Review

A Scientometric Analysis of Predicting Methods for Identifying the Environmental Risks Caused by Landslides

1
School of Civil Engineering, Wuhan University, Wuhan 430072, China
2
Department of Civil and Environmental Engineering, University of Texas at San Antonio, San Antonio, TX 78249, USA
*
Author to whom correspondence should be addressed.
Appl. Sci. 2022, 12(9), 4333; https://doi.org/10.3390/app12094333
Submission received: 30 March 2022 / Revised: 13 April 2022 / Accepted: 19 April 2022 / Published: 25 April 2022
(This article belongs to the Special Issue Natural Hazards and Geomorphology)

Abstract

:
The effects of a landslide can represent a very big problem, including the death of people, damage to the land, environmental pollution and the loss of natural resources. Landslides are the most important medium for transferring sediments and polluting waterways by earth and organic materials. An excess of sediments reduces the quality of fish habitat and the potability of water. In order to understand landslides in depth, a thorough study was conducted using a scientometric analysis, as well as a thorough practical examination of landslide analysis and monitoring techniques. This review focused on methods used for landslide analysis, including physical models requiring easily prepared event-based landslide inventory, probabilistic methods which are useful for both shallow and earthquake-based landslides, and landslide monitoring performed by remote sensing techniques, which provide data helpful for prediction, monitoring and mapping. The fundamental principles of each method are described in terms of the method used, and its advantages, and limits. People and infrastructure are at danger from landslides caused by heavy rain, so this report highlights landslide-prone regions and considers the analysis methods for landslides used in these countries, with a view to identifying mitigation measures for coping with landslide risks in hilly areas. Furthermore, future landslide research possibilities, as well as possible modeling methods, are addressed. The report summarizes some landslide prediction and monitoring techniques used in landslide-prone countries which can help inform researchers seeking to protect the public from danger in landslide areas.

1. Introduction

In hilly areas throughout the globe, landslides inflict massive fatalities and economic damage. To stabilize or manage slopes, methodical and rigorous procedures are always used to prevent or reduce mass movements [1]. Because this is seldom recognized, new and more effective methods are needed to improve awareness of landslide risk and allow reasonable choices to be made about how to allocate money for landslide risk management [2]. Several studies on landslide forecasting and risk mitigation have been conducted. Landslide risk analysis and hazard assessment have been a significant topic in hydrogeological research [3,4]. In recent years, the use of information and geospatial technologies, such as remote sensing and geographic information systems (GISs) has made a significant contribution to landslide hazard assessment research [5]. Furthermore, the value of quantitative landslide risk assessment has been acknowledged, as it serves as the foundation for maintenance, mitigation measures, and resource allocation [6]. Topography, geology, hydrogeological conditions, plant cover, and precipitation are all variables that influence the incidence of landslides in different geographic regions [7]. It becomes more difficult to evaluate landslide susceptibility in these situations because varied and significant quantities of spatial data from the regional area must be collected and taken into account throughout the analysis process [8,9].
Understanding watershed water quality is critical for the long-term management of water resources; as water combines with soils and foundation rocks, the chemical properties of the water in a reservoir alter affecting stream water quality. There have been numerous cases of a single landslide and a neighboring stream polluting nearby waterways in recent years. Water pollution caused by landslides occurs when pollutant-laden landslide debris reaches a river or other body of water [10]. Organic and inorganic elements, such as sediment, can enter drinking water supplies following landslides. An unprecedented long-term water boiling advisory instruction was imposed by the Regional District of Greater Vancouver in 2006. One theory holds that landslides that occur near drinking water storage areas cause deteriorated water quality [11].
The statistical connections between landslide-inducing variables and sites of previous landslides are assessed using data-driven techniques and then quantitative forecasts for landslide-free regions with comparable circumstances are produced [12]. These techniques are referred to as data-driven approaches since they rely on historical landslide data to determine the proportional significance of each component. The three predominantly utilized data-driven approaches are multivariate statistical techniques, bivariate statistical tools and artificial neural network analysis [13,14]. In bivariate statistical analysis, each confounding variable, such as land, slope and geology, is coupled with the locations of landslide occurrences, and the weighting values for each class of parameter are computed. Multivariate statistical methods are used to evaluate the link between an independent variable and a collection of dependent variables [14,15,16]. However, statistical models often neglect the temporal elements related to landslides and are not able to anticipate the effect of variation in landslide-controlling circumstances (e.g., alteration in land usage and water table) on landslides [17,18]. Physically based landslide susceptibility assessment techniques describe the occurrence process using physical landslide models [19]. The techniques estimate slope instability using geometric and geotechnical data. Unlike data-driven techniques, site or laboratory tests and physical slope model findings may be used to assess slope stability independent of landslide incidence [20]. The consistency of the slope is determined by analyzing the forces acting on it using a physical slope concept, such as an infinite slope model [17,21]. Landslides are assumed in this model to be indefinitely long but to have a short depth relative to their length and breadth, making the model suitable for shallow landslides with flat failure surfaces [17,22].
Extensive study has been undertaken in recent decades to investigate the landslide situation and different mitigation methods, with some beneficial findings. Reviews of studies have also been carried out, although these were mostly manual reviews. This article presents a scientometric analysis of methods of landslide prediction and monitoring, mainly in landslide-prone regions [23]. This research is unique in that it uses scientometric analysis, which differs from conventional traditional reviews and is more authentic since data is gathered from the database of Scopus. As a consequence of this study, research studies from all over the world may benefit from the simple visual depiction focused on a scientometric assessment when establishing research alliances, forming joint projects, or exchanging innovative techniques and ideas [24]. To develop a uniform landslide severity map for landslide-prone areas, further study is required. This study will be helpful for creating landslide severity maps in most landslide effected nations utilizing landslide prediction and monitoring methods analyzed in this review article to make landslide preparation and mitigation easier [25]. Furthermore, certain nations provide a wide range of options for landslide study, along with new methods for landslide modeling [26]. Most landslide hazard assessments include landslide monitoring as a major component, with the goal of giving early warning of an imminent collapse that may put communities, lives or infrastructure at risk. The goal of landslide monitoring and warning is to collect data that may be used to prevent or mitigate the effects of landslides [27,28]. Landslide monitoring and early warning, particularly in the light of recent disastrous landslides across the globe, have attracted public attention [28,29,30].

Research Significance
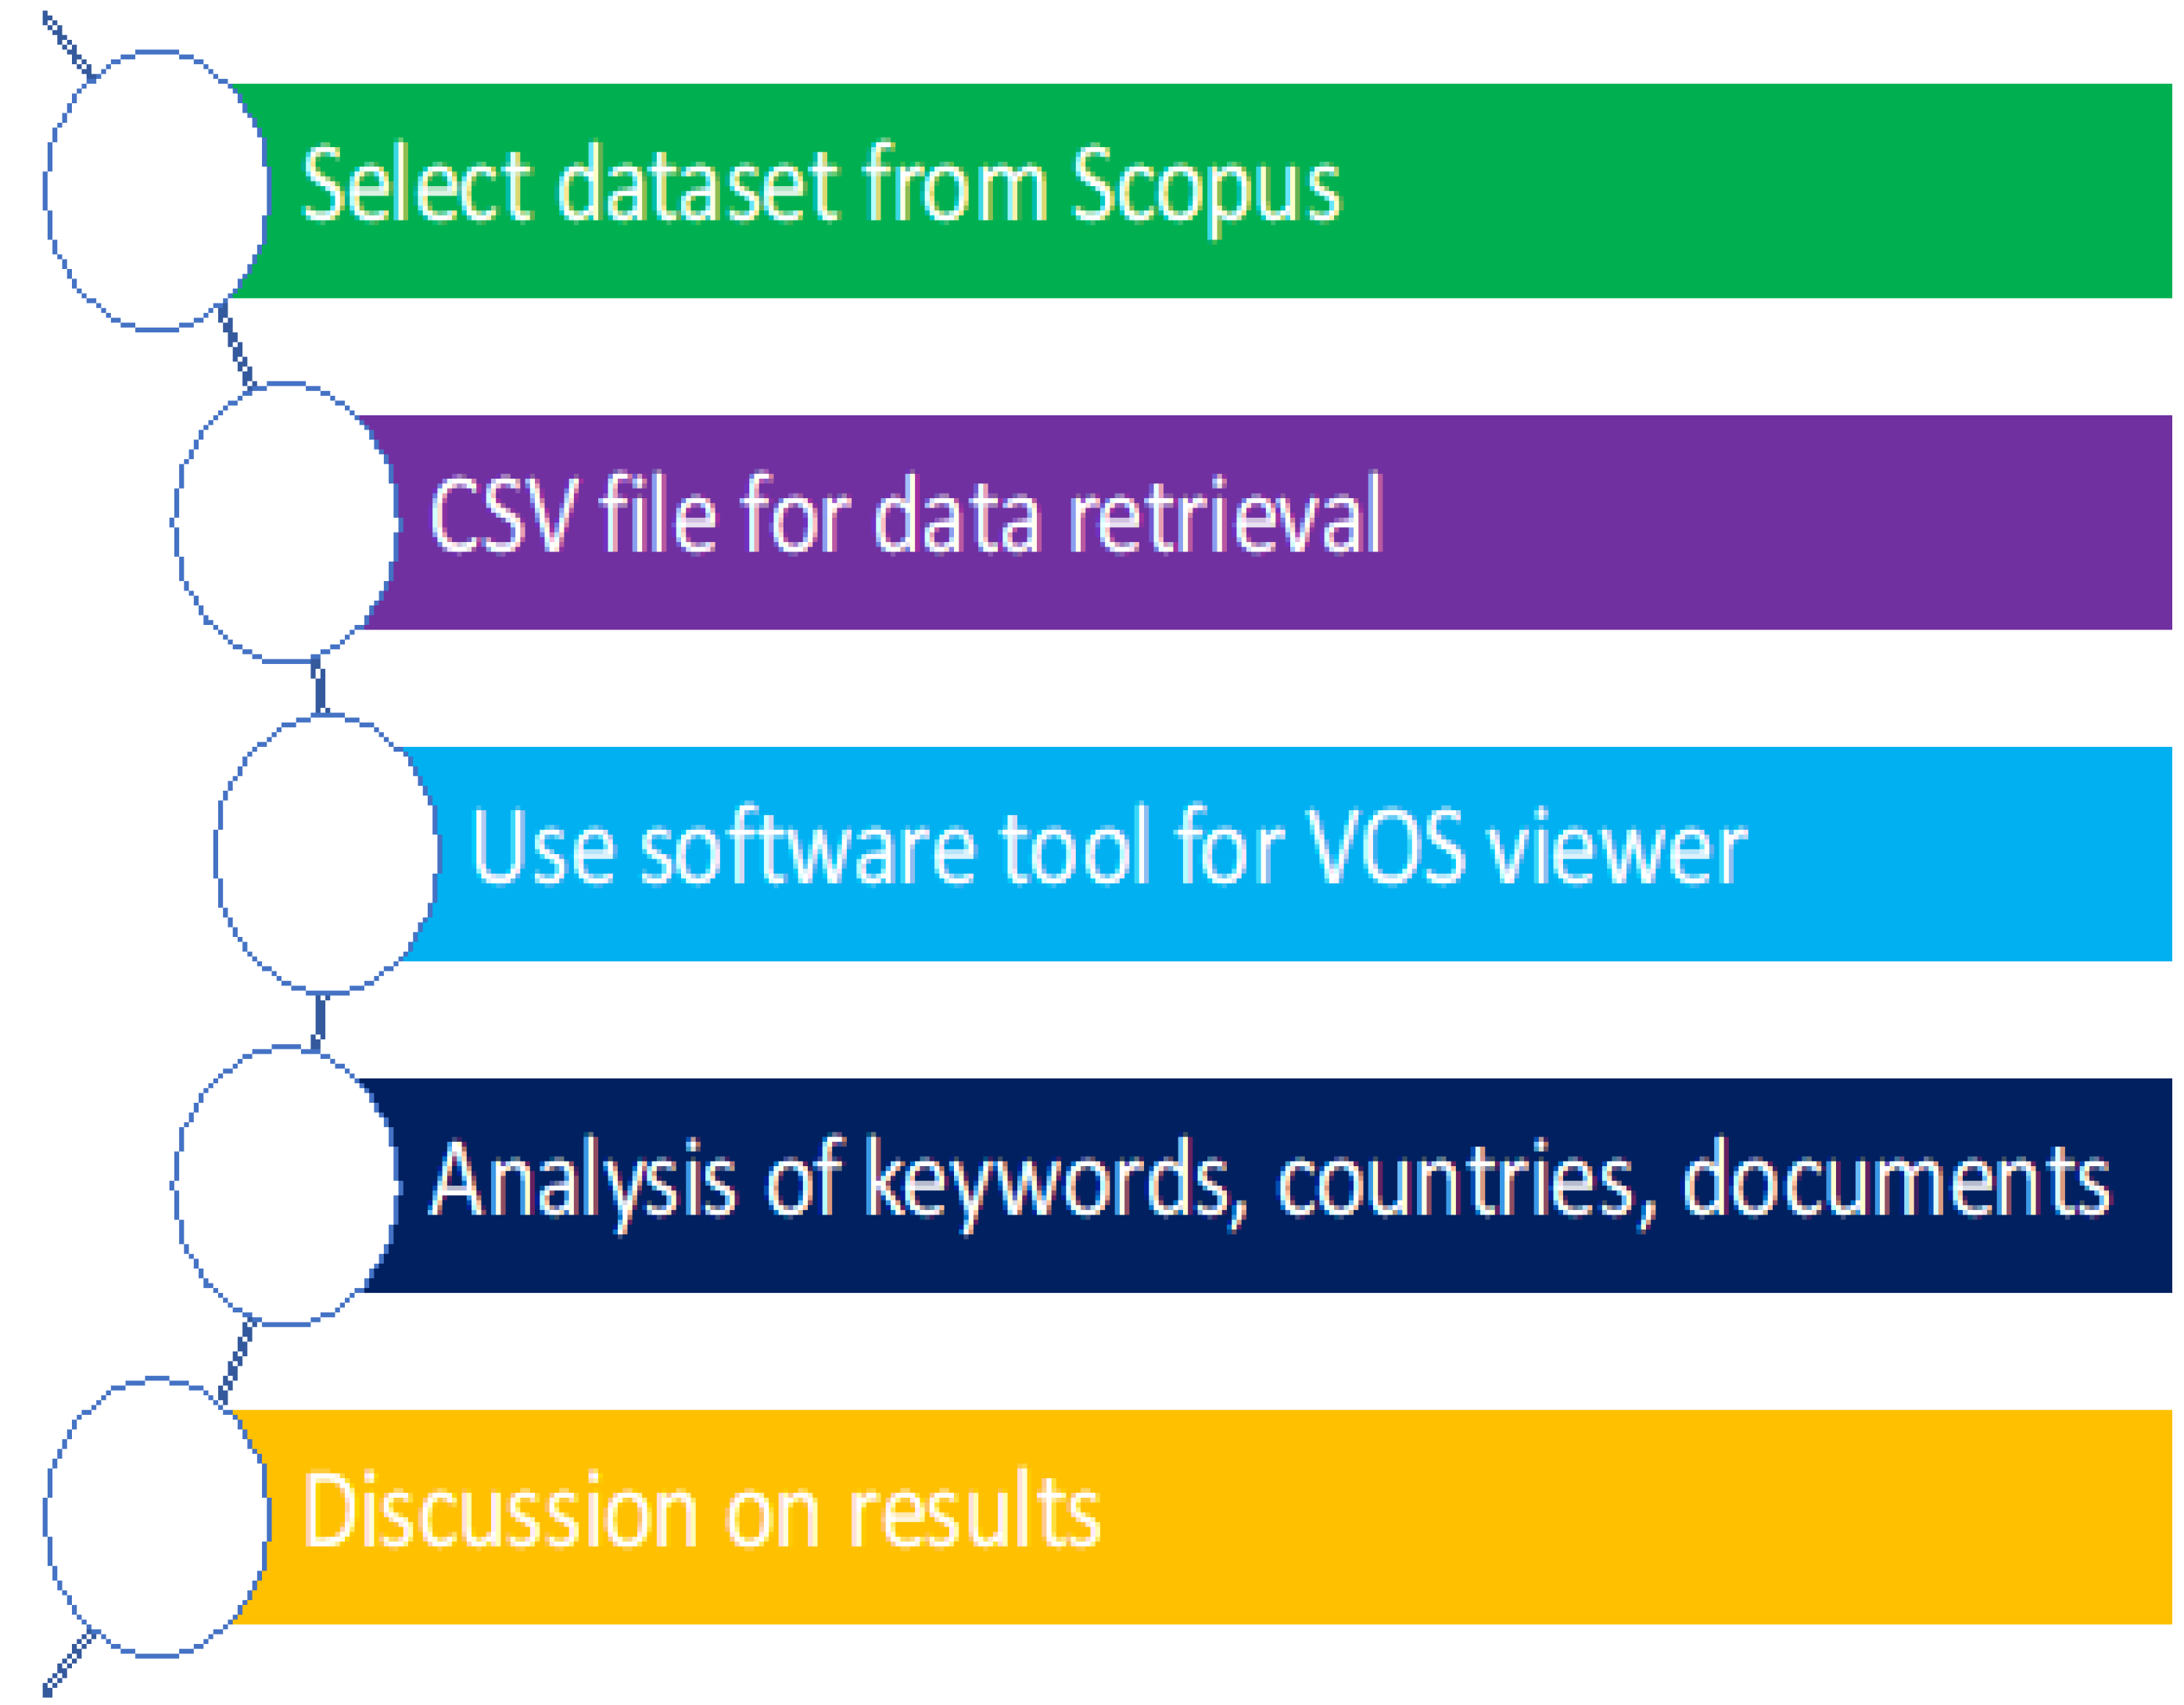
This study focuses on gathering information from the large amount of data produced in recent years concerning landslides. Scientometric study explores the quantitative aspects of the scientific process, science policy, and scientific communication. Its primary focus, involves measuring the influence of researchers, journals, articles and institutions, as well as comprehending citations associated with them. It also focuses on scientific field mapping and visualization, as well as assessment of indicators for future policy and corporate strategy. It is used as a tool for evaluating the outcomes of research and analyzing large data sets which are often too large to consider storing on a single computer system or to be managed by conventional database structures, measurement bundles, or normal visual programming. Scientometric analysis includes the annual production of scientific publications, the most productive countries, and collaboration between groups; additionally, there are many distinct keyword occurrences, as well as progression of study from subject to theme.
The three techniques primarily used in landslide assessment are reviewed in this study. Probabilistic landslide risk assessment has the virtue of being suitable for all kinds of landslides, if required, and can provide risk maps and curves. In probabilistic models, for the results to be significant, the data must cover a long enough time period to cover both active and tranquil periods. The predictive power and ability to mimic the physical processes that determine landslide incidence make the physically based model an obvious choice for rain-induced shallow landslide hazards. To assess the danger of rainfall-induced landslides, this approach combines distributed hydrological and stability models. The linked models use a physical slope concept, such as the limitless gradient model, along with critical geomechanically and hydrological factors, to predict the spatially distributed safety margin. Landslide susceptibility study approaches have been developed in the scientific literature as a result of recent improvements in remote sensing and geographic information systems (GISs). Landslide monitoring has made use of optical remotely sensed imaging. SAR interferometry takes advantage of the phase differences between multiple SAR photos of the same scene taken at various times. This study also depicts the intensity and frequency of landslide prone regions and how these areas cope with these environmental risks. The major focus is on rainfall-induced landslides which are common in India, Italy, China and USA. When forming research collaborations, joint ventures, and when sharing new thoughts and technologies, researchers from various geographical regions may benefit from the modeling of many parts of the literature developed through scientometric analysis. In addition, this work also highlights significant research areas and open issues.

2. Methodology

One of the major goals of the study was to illustrate the challenges researchers face when performing manual evaluations and to demonstrate the connections among authors, keywords, publications, and countries within certain research areas. Scopus data was analyzed using a tool, and the findings were stored in CSV format for future use. The research was constructed using the mapping and visualization tools in combination with a VOS viewer (Version: 1.6.16). The VOS viewer is a well-known visualization tool with a solid track record in academic research. The VOS viewer was utilized to accomplish the present research’s objectives, as shown by the results. Novel research was performed in VOS viewer, which was configured to generate a map utilizing data from bibliographic datafiles. The Scopus CSV file was imported into the VOS reader and evaluated in a few easy steps while managing data and accuracy. The review of scientific mapping included citation network structure, publications, co-authorship, keyword co-occurrence network structure bibliometric overlaps, and country contributions. The total number of citations to the articles was tallied in order to do so; other nations were added to the map to show the connection between publications and authors. The numerical attributes of a variety of variables are described using tables, whereas maps are used to show the relationships and co-occurrence of those factors. To ensure that the study findings are of value, it included summaries and keyword reviews of discussion points. The analysis steps are depicted in Figure 1.

3. Scientometric Analysis Results and Discussion

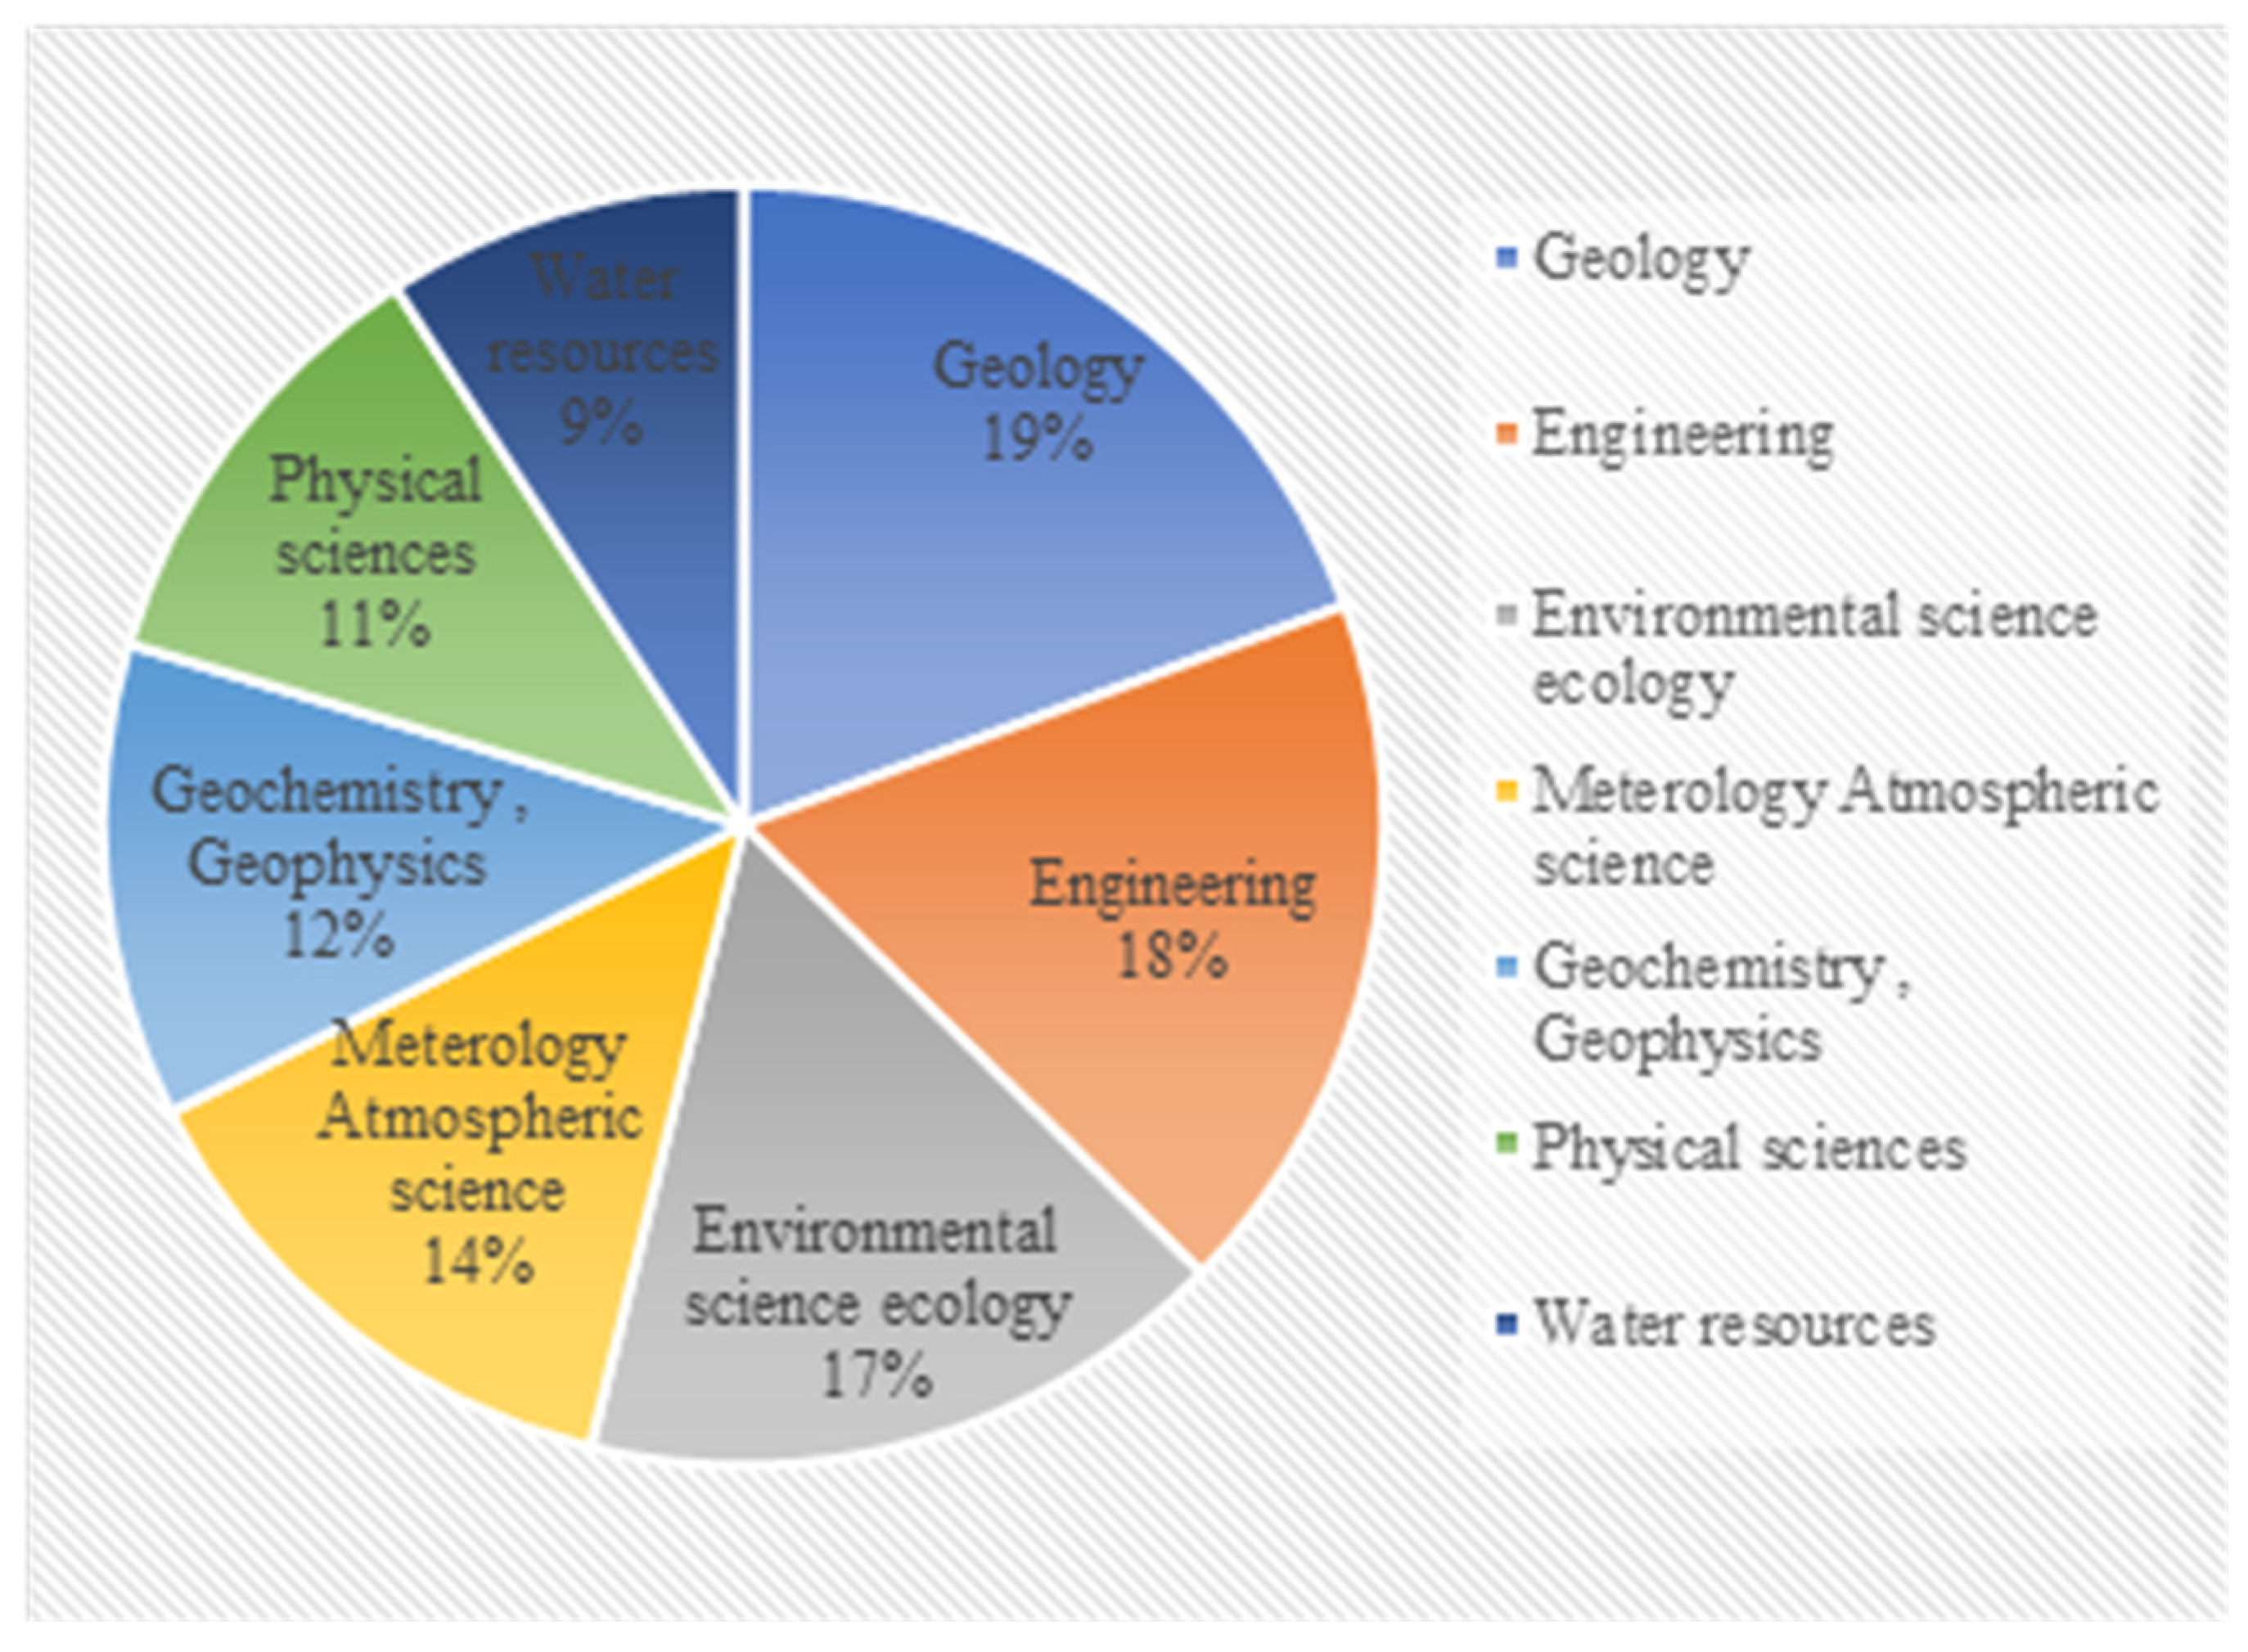
3.1. Annual Publications and Subject Area of Articles

To identify the most significant study subjects, the Scopus analyzer was used to scan the Scopus database. According to the statistics, the top four disciplines, based on quantity of papers, were geology (19%), engineering (18%), environmental research ecology (17%), and meteorology (17%). Atmospheric science accounted for 14% of all documents, followed by physical science (11%) and water resources (9%); geochemistry and geophysics accounted for up to 12% of all papers, as shown in Figure 2. These areas accounted for approximately 75% of the estimated number of Scopus articles that have been reviewed. The frequency with which journal publications and literature reviews are used in a document was investigated; 73% of articles published in journals were for preliminary or continuing research, while 27% were for evaluating previous work.
The model depicts the trend in research area publication from 2000 to 2020, which is represented by the graph in Figure 3. From 2000 to 2010, the number of publications on the topic of rainfall-induced landslides grew, and then a significant increase in the number of publications occurred in 2014, followed by an increase in the number of publications from 2015 to 2020. Although a significant increase was seen in recent years, the real amount may be somewhat less. It is interesting to observe the fresh and innovative approaches to the issue which have been used, with specialists concentrating their efforts on predicting rainfall-induced landslides and monitoring methods.

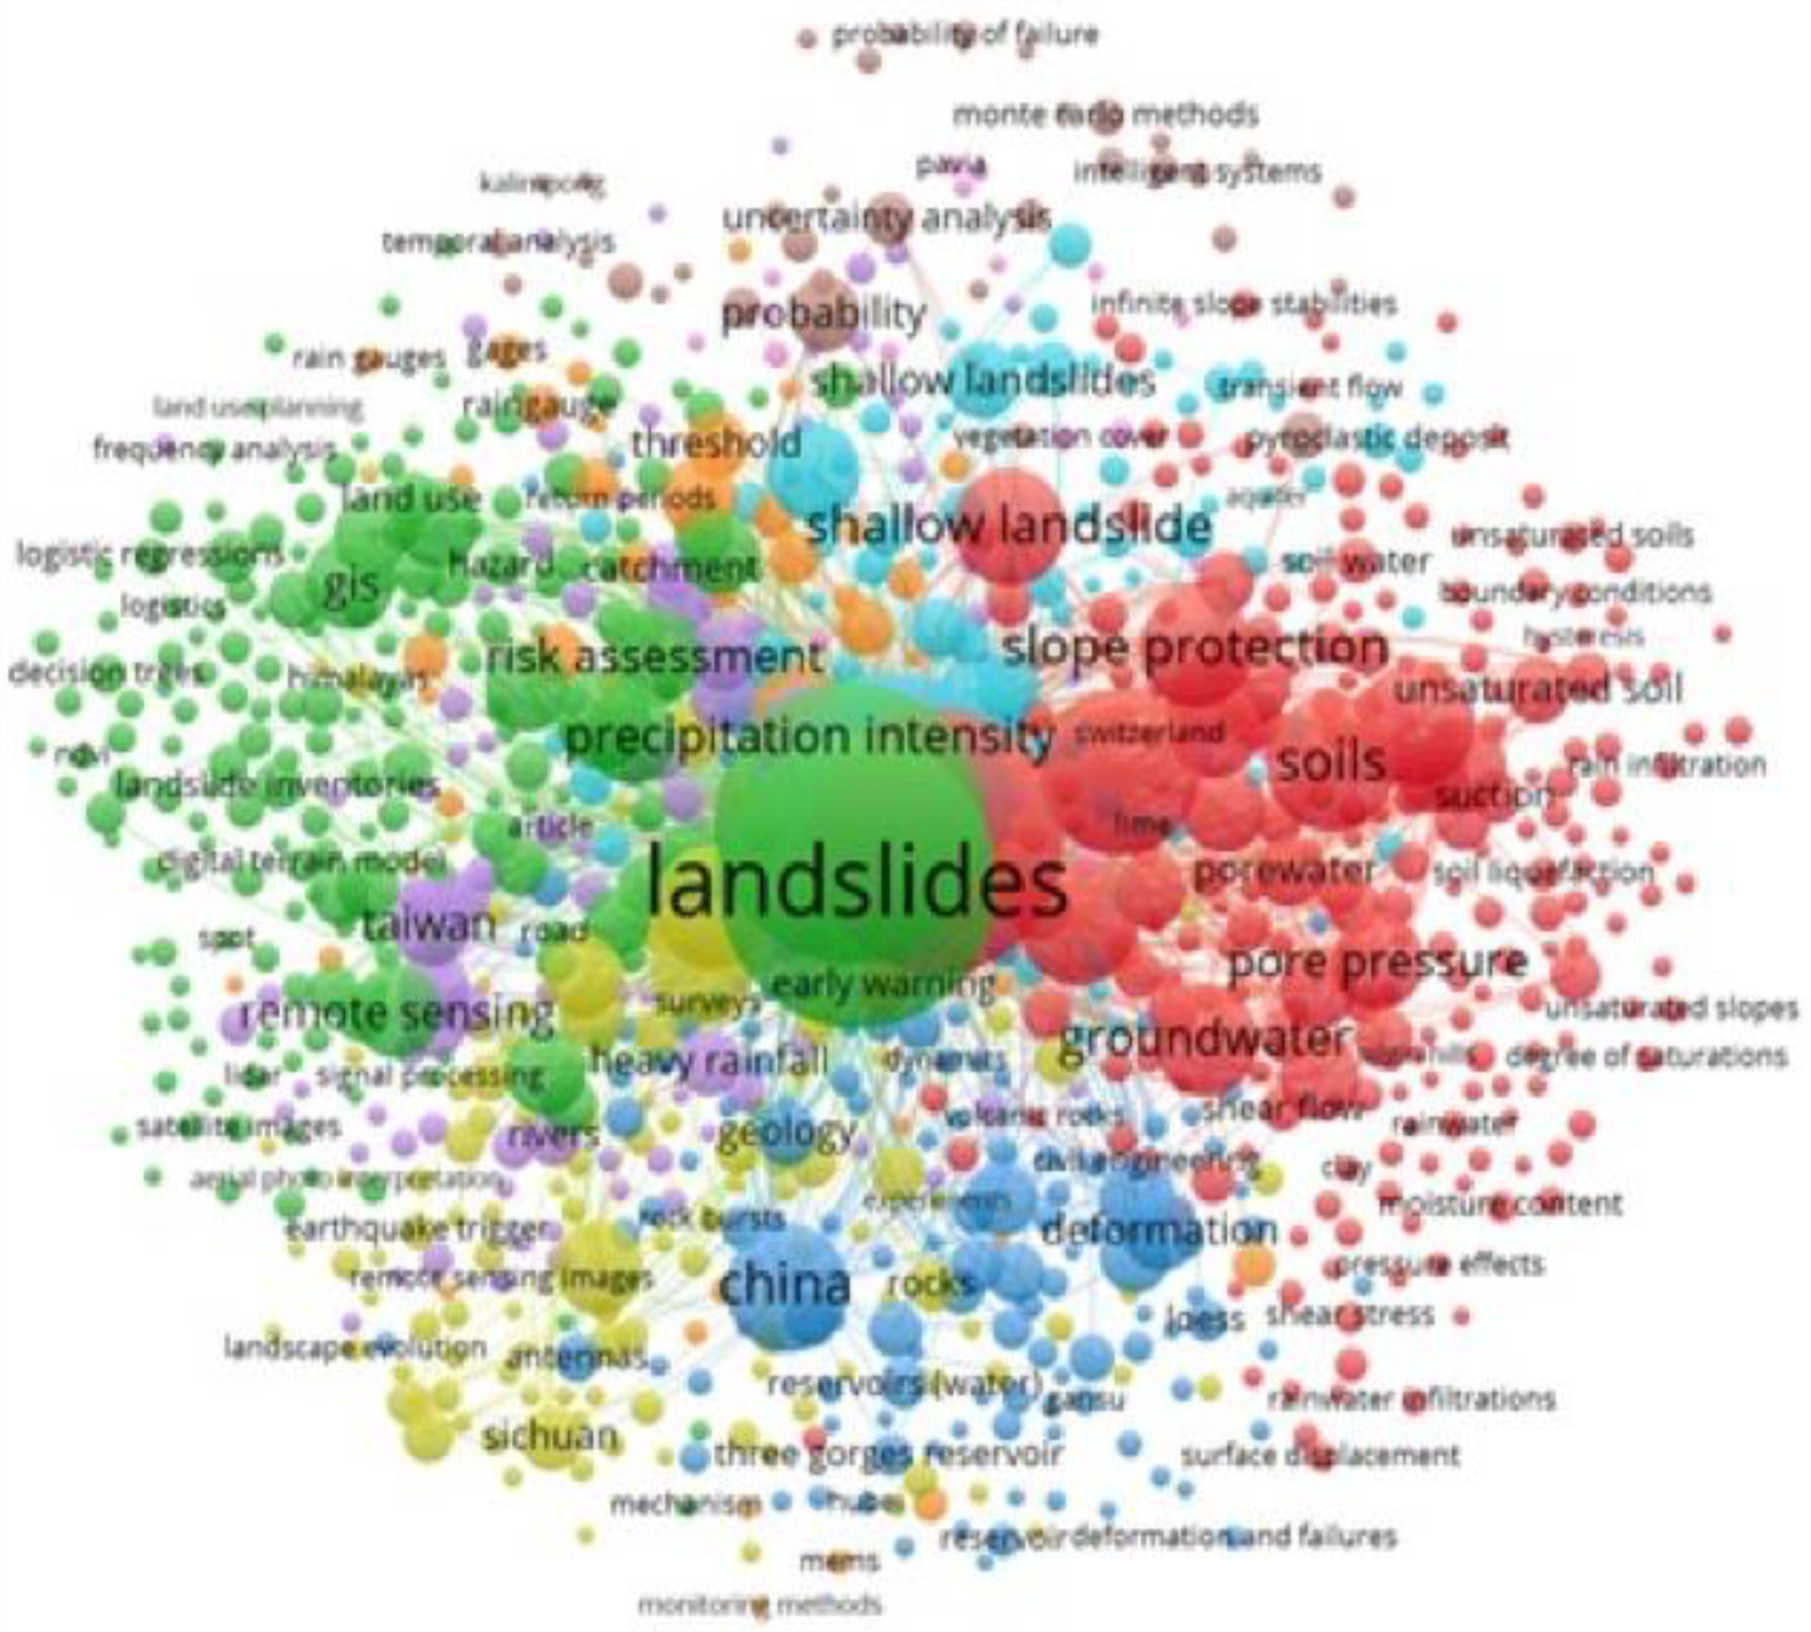
3.2. Mapping of Keywords

Keywords are critical research tools since they assist in identifying and reflecting the subject of study that is reviewed. In order to perform the study, “type of analysis” was selected as “co-occurrence” and “unit of analysis” as “all keywords”. The minimum occurrence of a word was set at five to guarantee that no term was ever used fewer than five times; because of these restrictions, only 98 of the 9135 words were found to meet the criteria. Table 1 displays the top 20 search keywords that were used in the research articles in the study and the greatest use in the present study. The most often occurring keywords, according to the aims of research, were landslide, precipitation intensity, risk assessment, slope instability, China, pore water, and slope protection. The top five most regularly occurring keywords were landslide, rainfall, slope stability, soil and China. This image illustrates the network of co-occurring terms, their visualization, their links to one another and the strength of their correlations. The size of the keyword node in Figure 4 correlates to the term’s density in the articles published, while the position of the keyword node corresponds to the keyword’s density. Furthermore, the graphic shows that the mentioned keywords have more nodes than others, indicating that they were the most significant terms for the landslide modeling study. Numerous keywords have been graphically separated in the network to indicate their co-occurrence in a variety of publications. There were a total of five clusters identified, each of which was represented by a different color: green, red, brown, purple, blue, or yellow. For instance, a green cluster contains the terms landslide, land use, early warning and precipitation intensity. As shown in Figure 5, the keyword density concentration is denoted by different colors. The rainbow colors are yellow, red, green, purple, and blue, in decreasing order of density. Thus, soils, hillside soils, unsaturated soils, and soil water all exhibit red marks on the density depiction, indicating a higher volume. This finding will benefit writers in the future by assisting them in selecting keywords that aid in the identification of published content in a certain area.

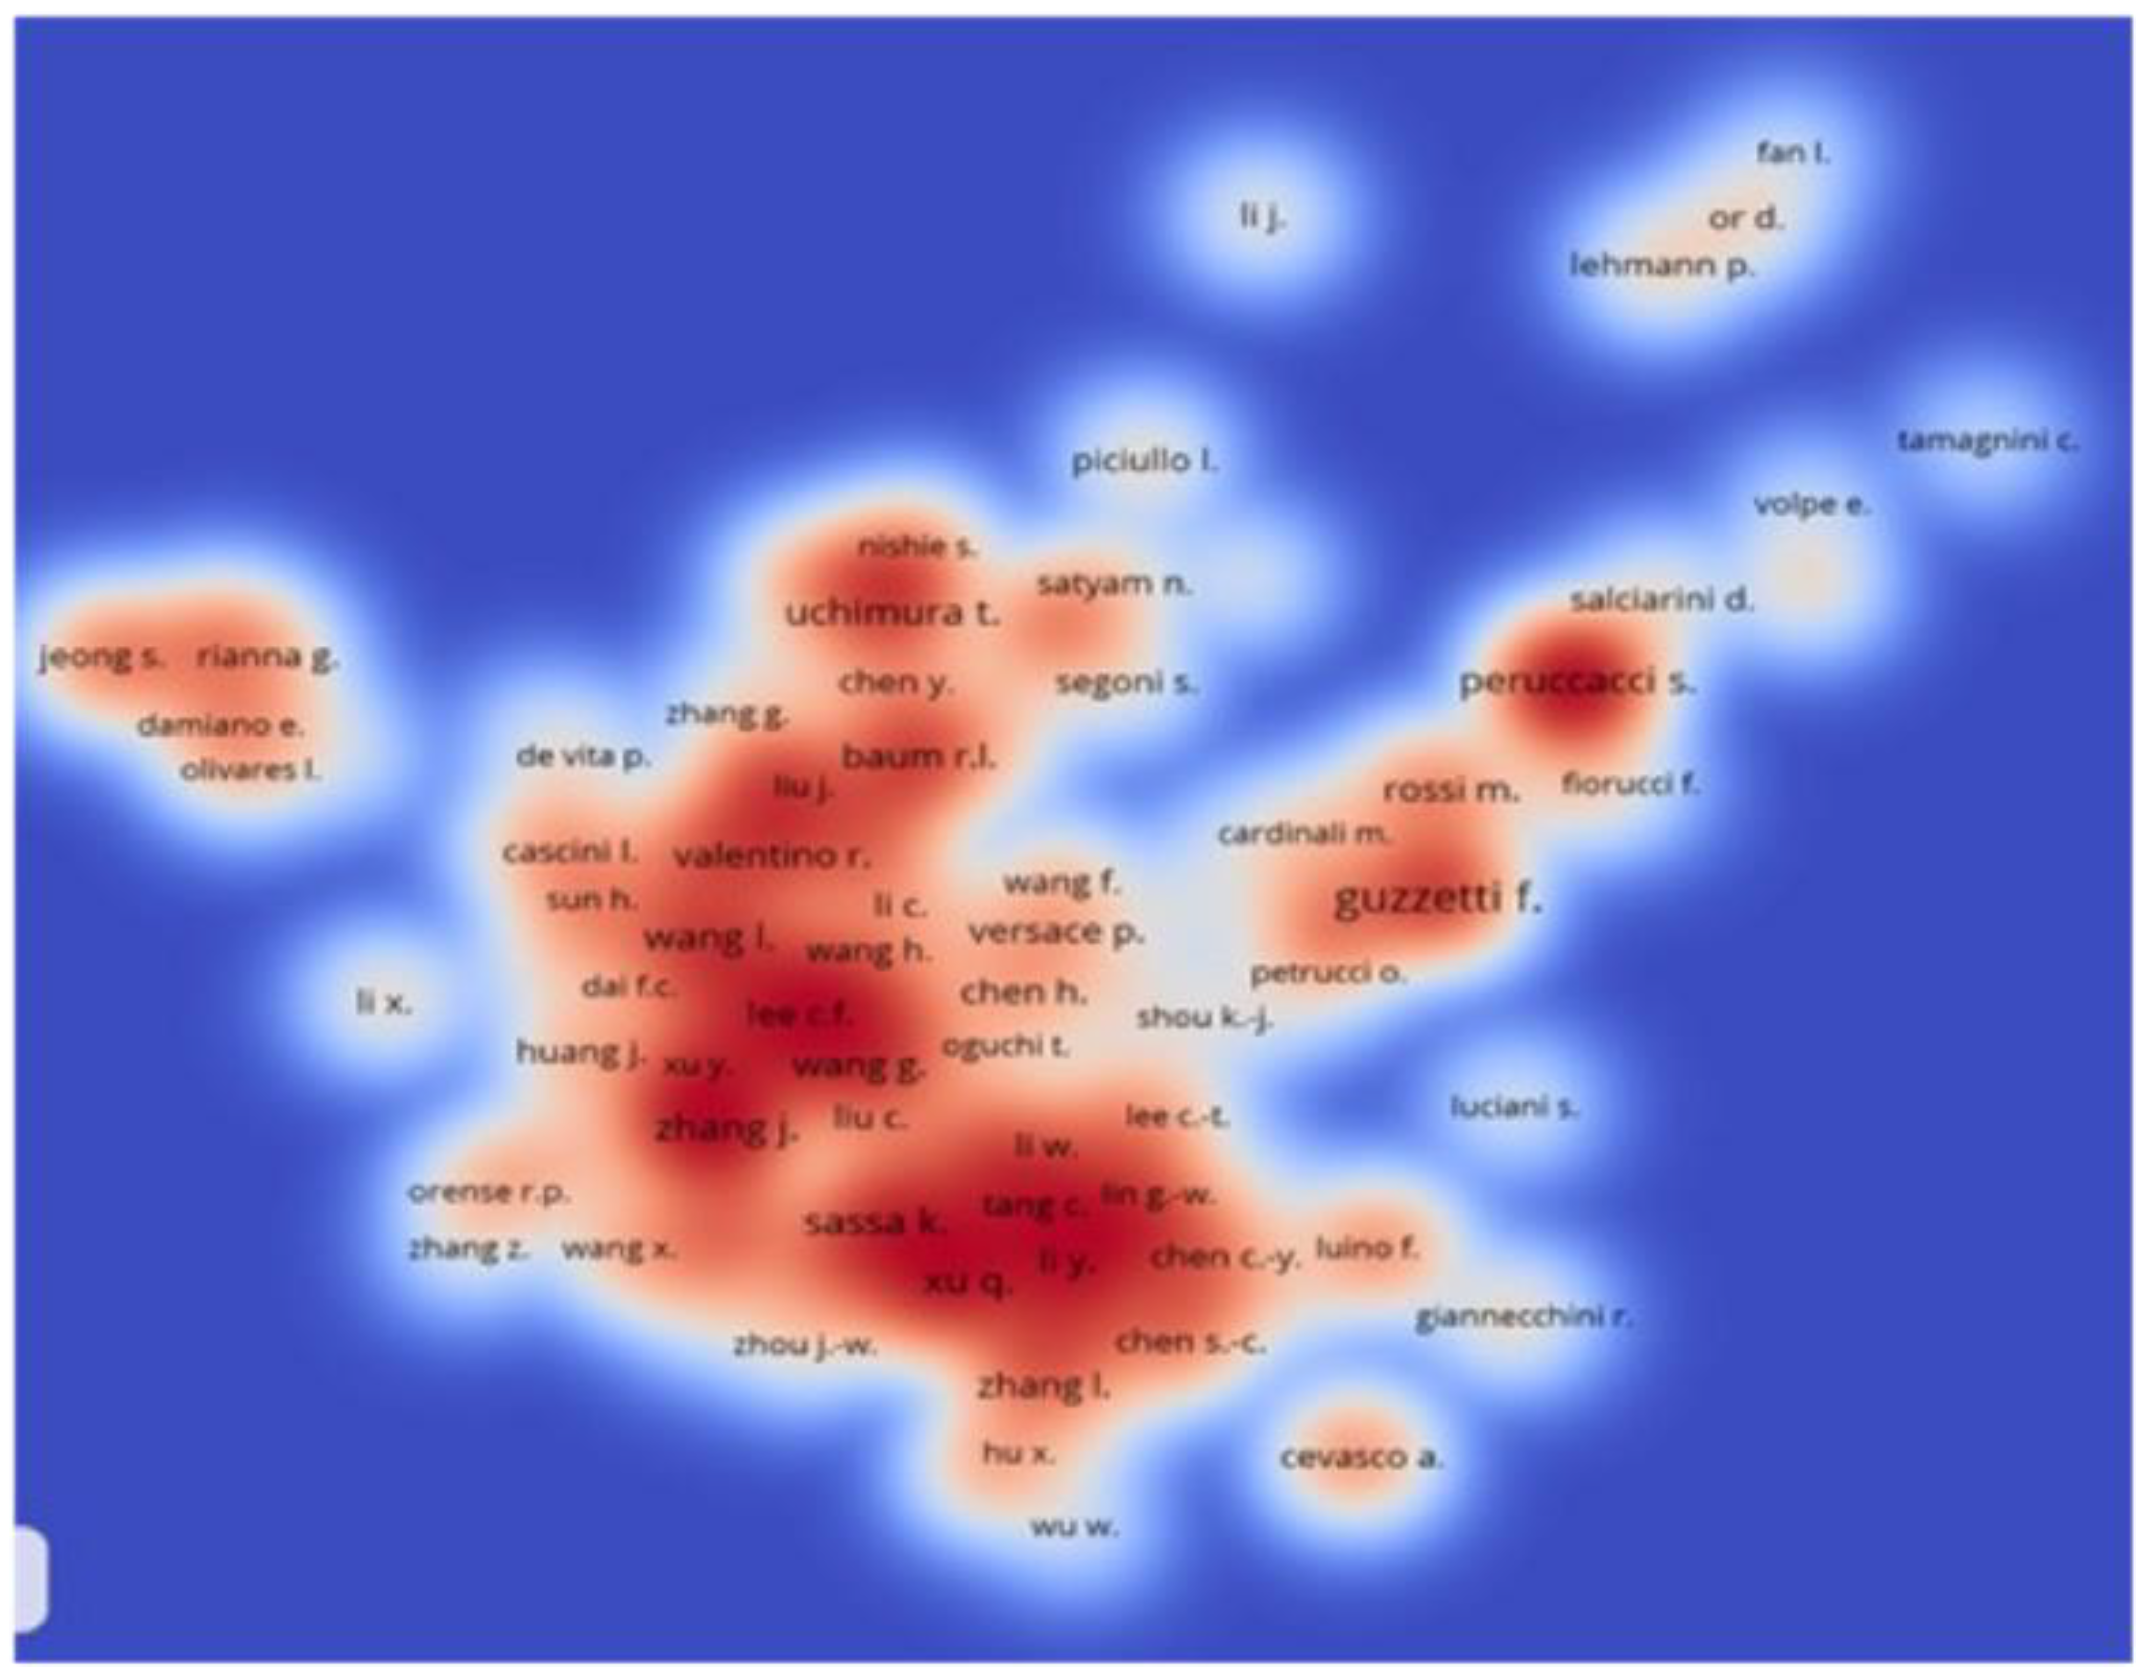
3.3. Mapping Co-Authorship

The author’s name appears when reference numbers reflect an author’s impact in a certain area. In the VOS viewer, setting “co-authorship” as the “kind of analysis” and “authors” as the “unit of analysis” produced an excellent result. Around 188 of 6832 writers fulfilled the criteria, since the minimum number of publications was five. The findings of research are summarized in Table 2, based on data retrieved from the Scopus database search. The expected citation count was calculated by comparing the number of citations by the number of articles published by each author. Guzzetti F. received the most citations (1652) and the most papers (36). Measuring a particular researcher’s performance was challenging. However, the author’s grade was determined by whether or not all the criteria were evaluated individually or in combination. Sassa K., with 25 publications, Rahardjo H., with 9 articles and 1019 citations, and Godt J.W., with 17 articles published, were the most productive authors. When citations were compared, Sassa K. Rahardjo H. were placed second and third with 1026 and 1019, Godtj.W. was placed fourth with 961, and Pradhan B. was placed fifth with (881) citations. Figure 6 and Figure 7 show the writers with five or more articles as well as a representation of the density.

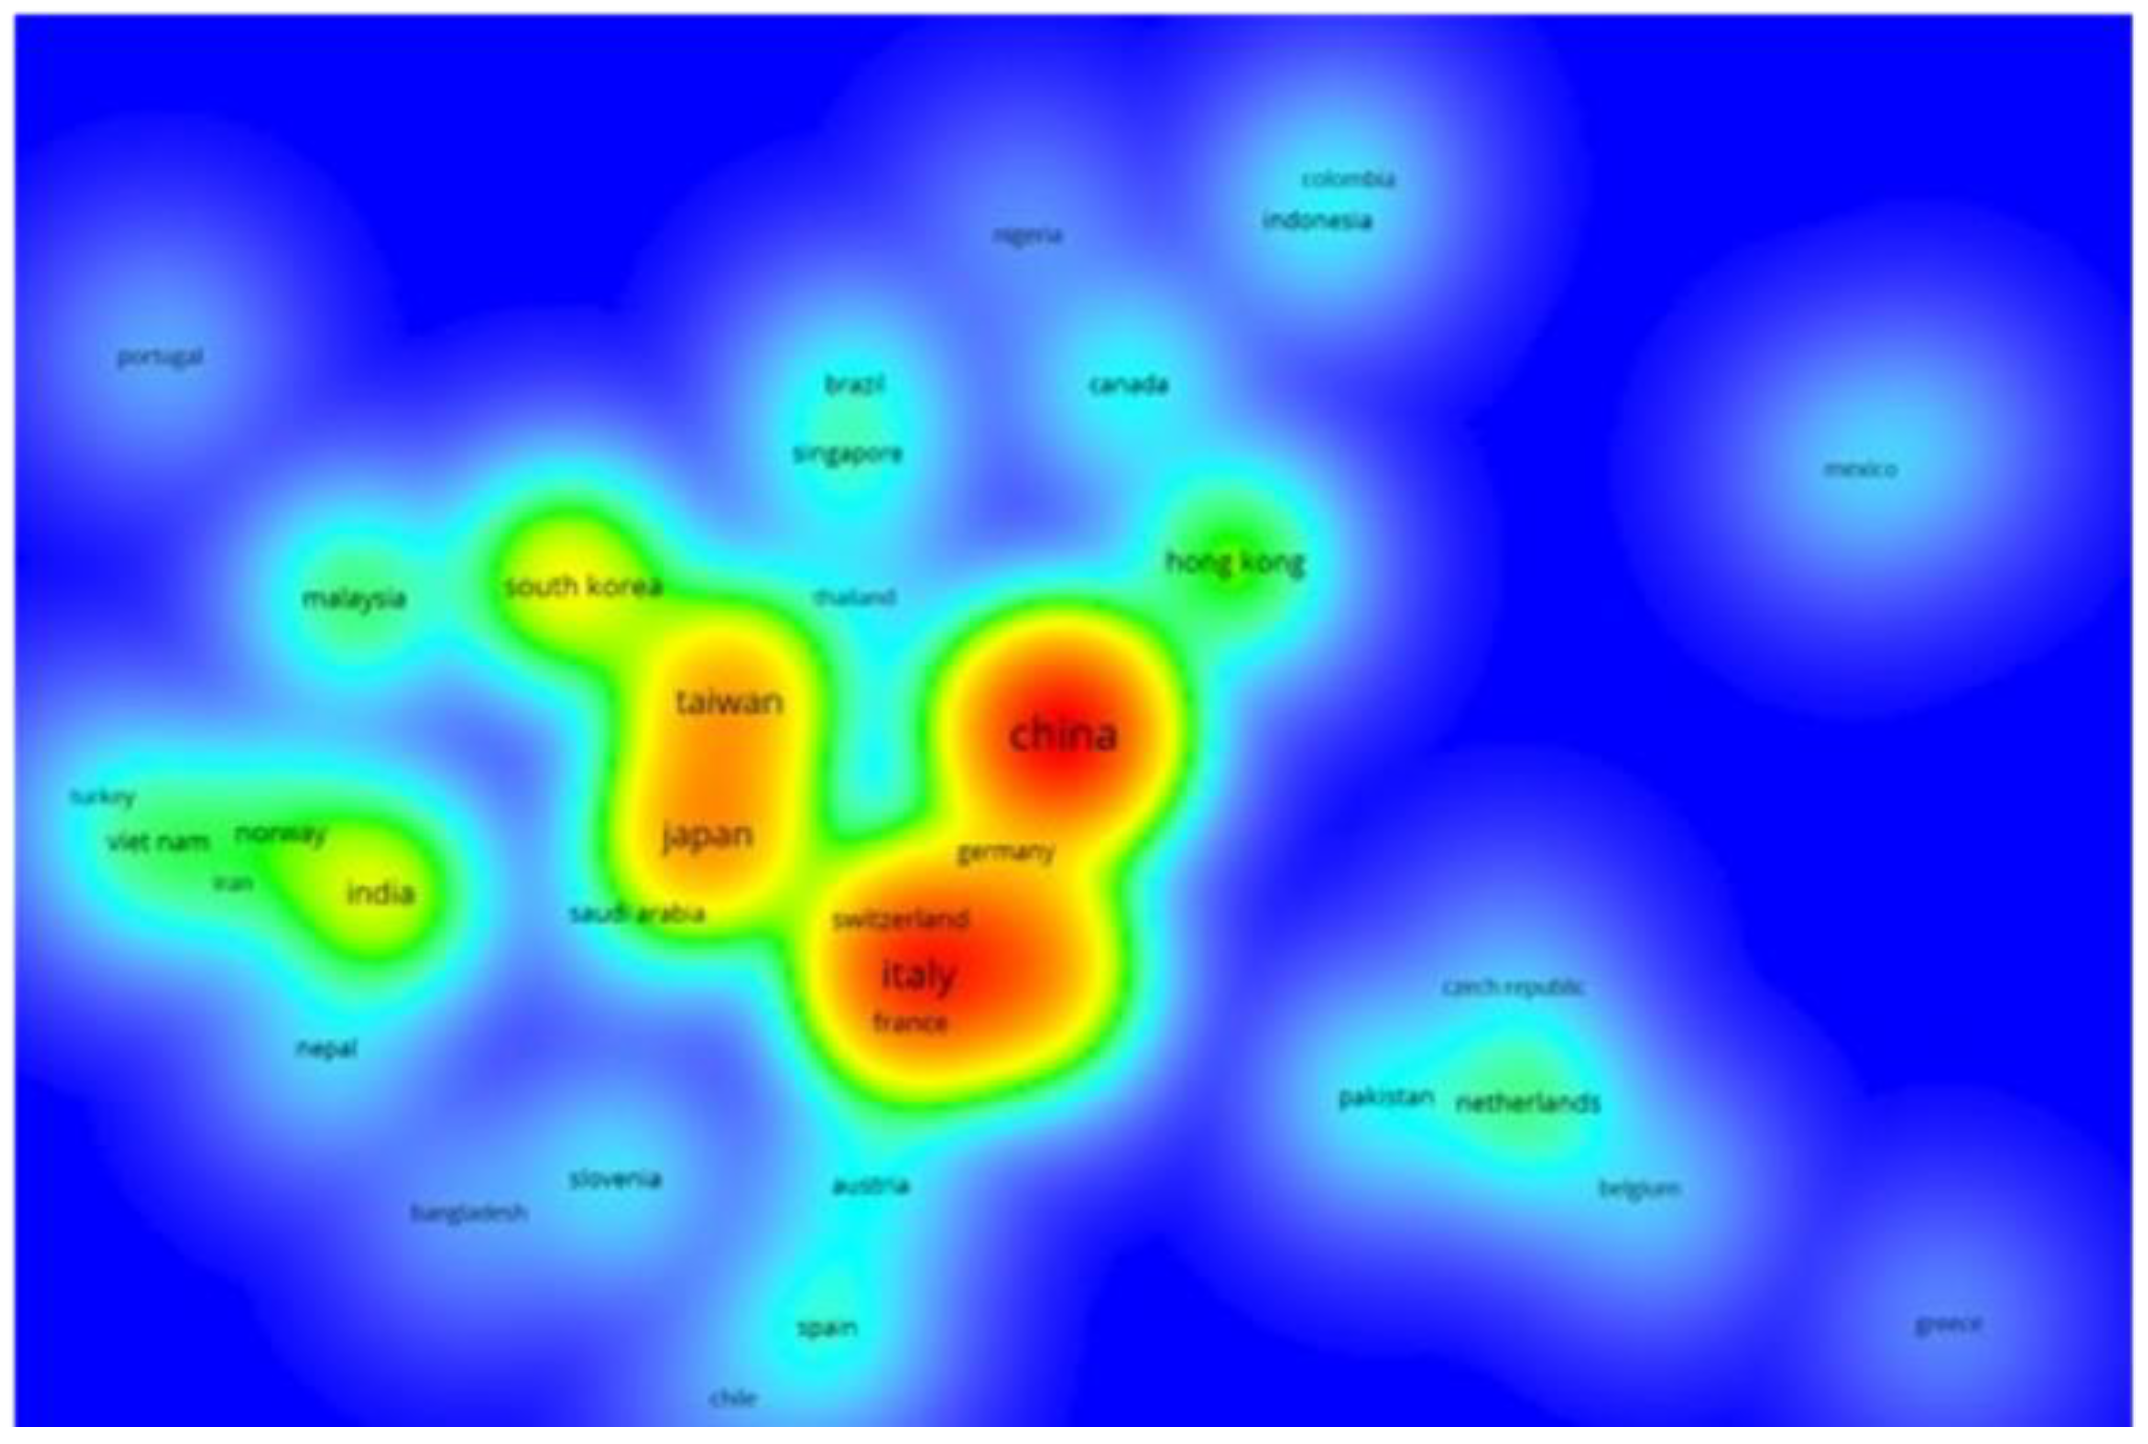
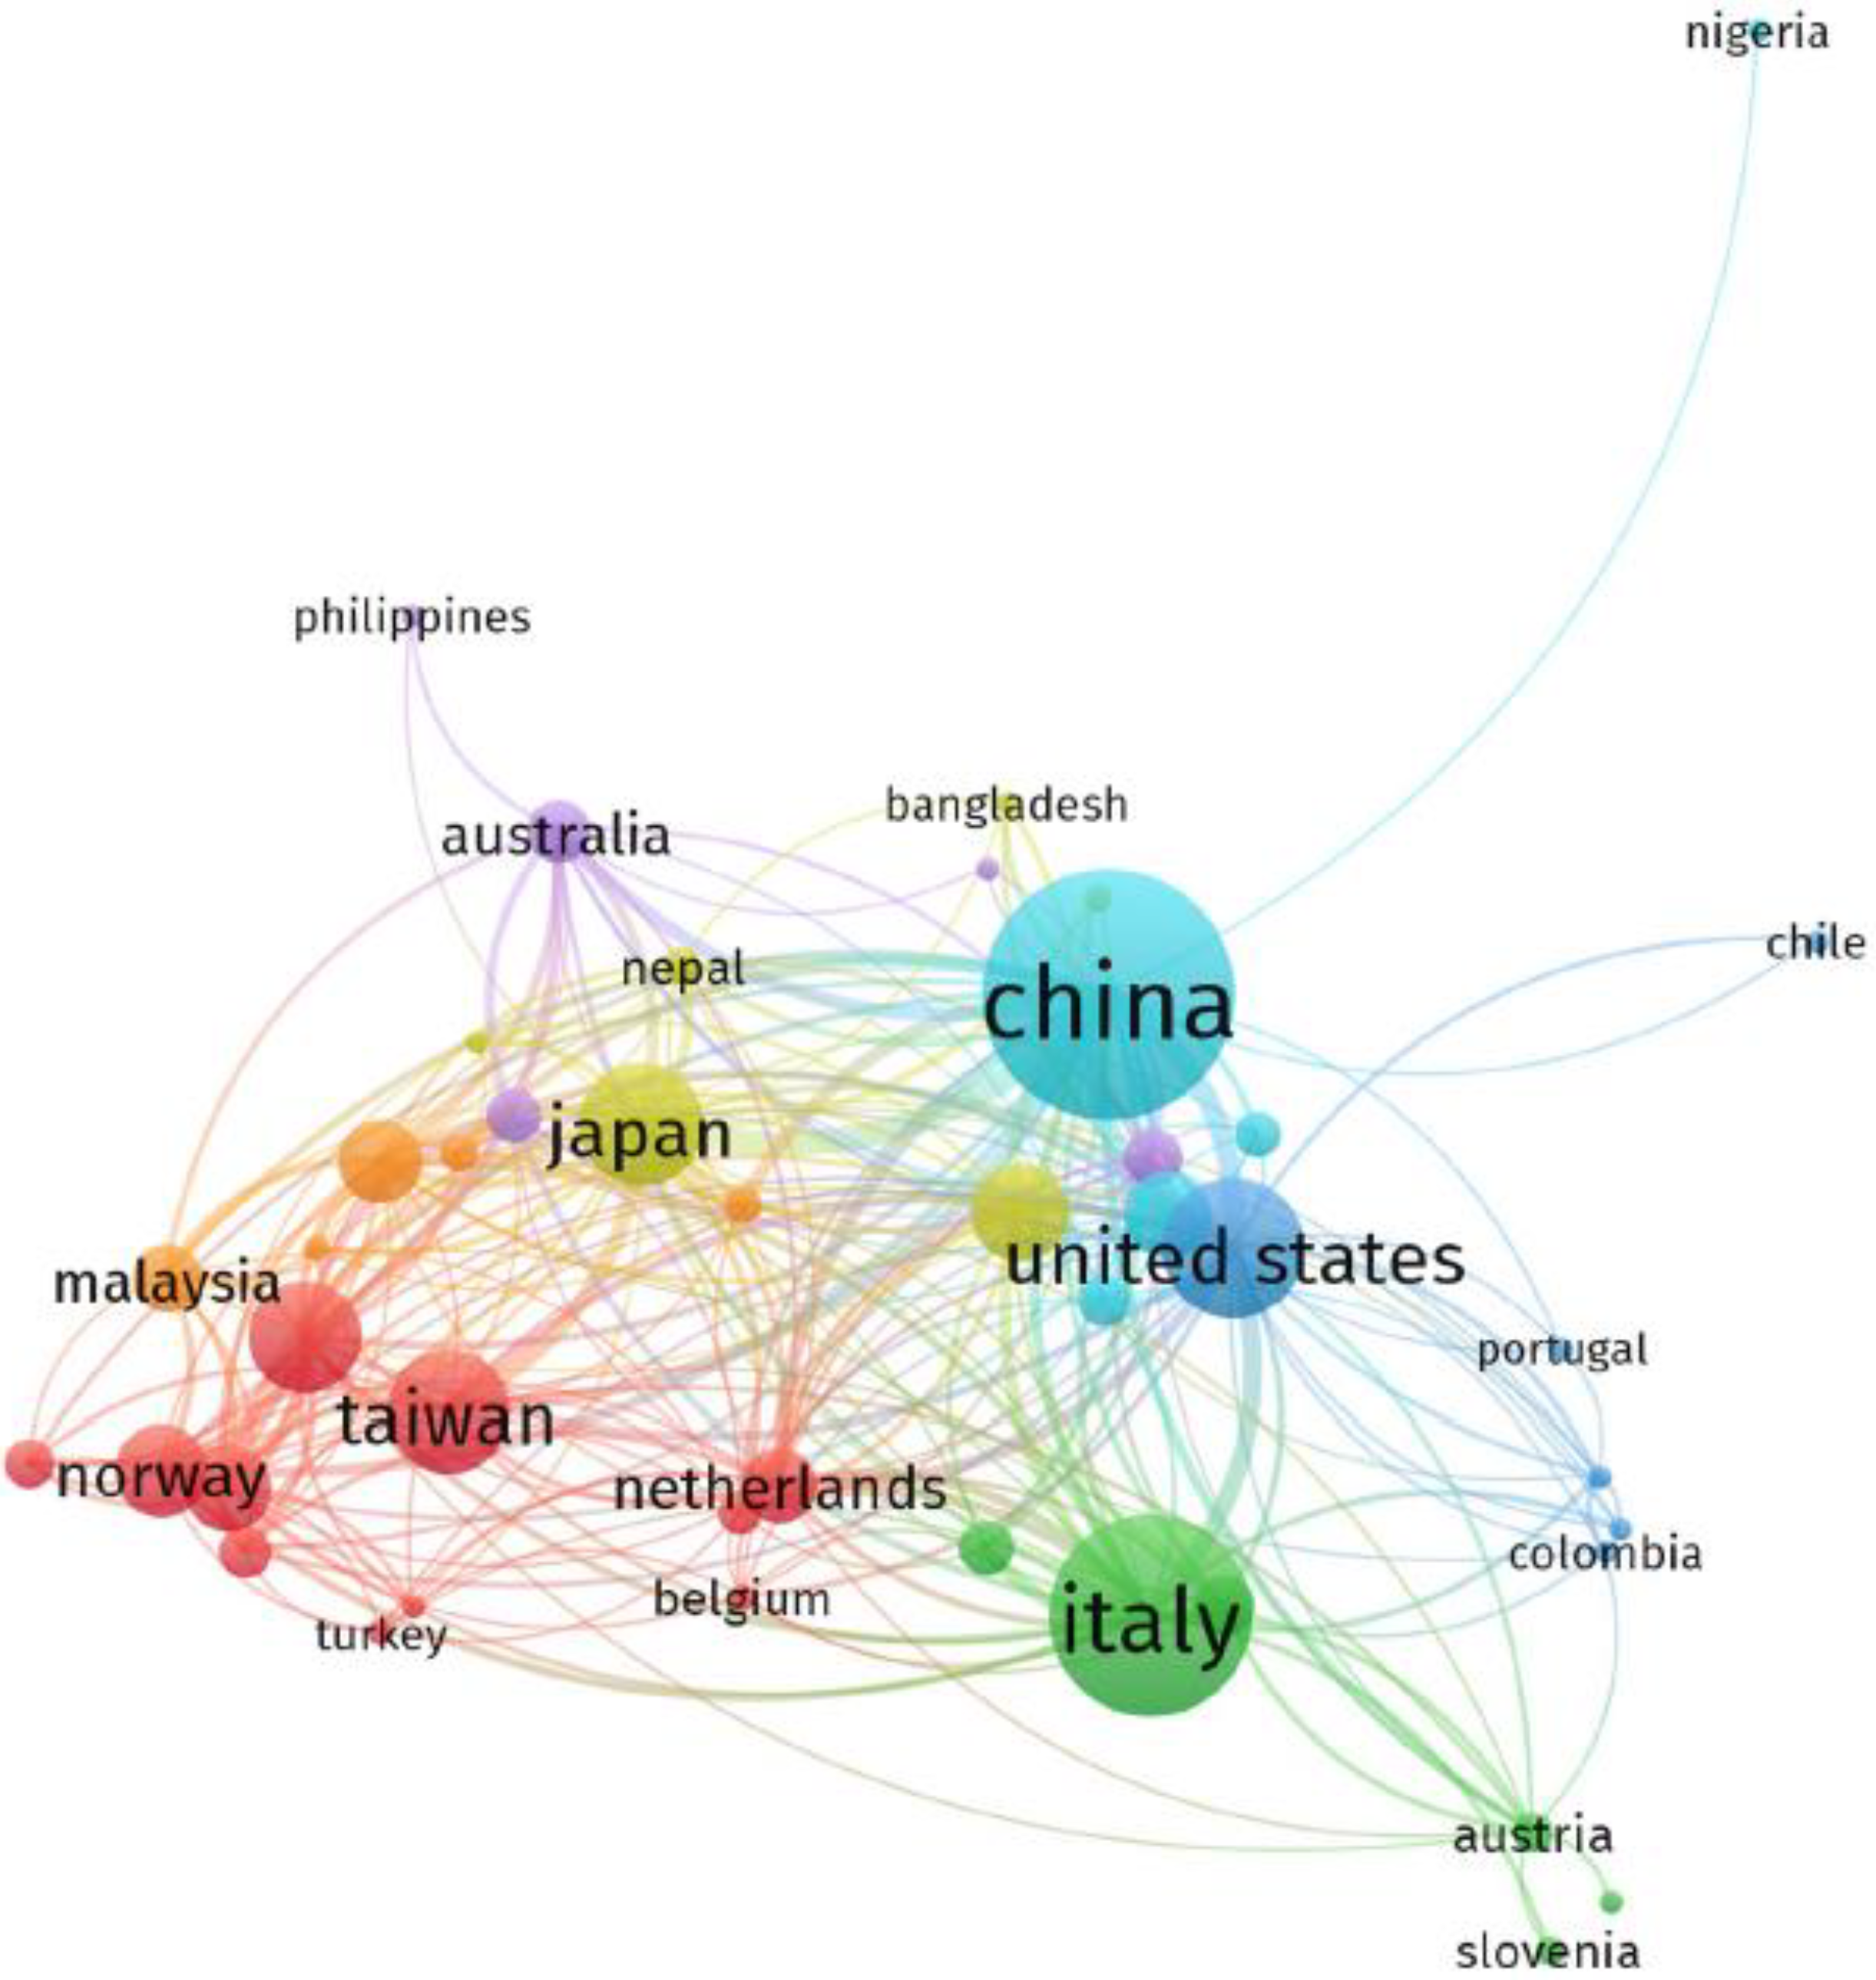
3.4. Mapping of Countries

Certain countries have made a greater contribution to research studies than others and maintain this. The network visualization was created to assist readers in identifying sites committed to ecologically responsible development. The “kind of analysis” was “bibliographic coupling,” and the “unit of analysis” was “countries.” A country’s minimum requirement for papers was set at five, and 68 of the 133 nations fulfilled this criterion. The top twenty most active nations in terms of publications and citations related to the current study subject are shown in Table 3 China, Italy, and Japan contributed far more papers overall, with 471, 320, and 206 submissions, respectively. China, Italy, and Japan received the most citations, with 4734, 4777, and 4356 citations, respectively. The number of publications, citations, and the overall link strength indicate how prominent a country is in the present study field. The overall link strength shows the extent to which an article from one country has impacted the articles from the other countries included in this research. As a result, the preceding countries are considered to have the greatest impact on landslide monitoring. Figure 8 and Figure 9 illustrate the countries connectedness and the density of nations linked through citations. The size of the frame represents the country’s role in the field. Additionally, the density graph indicates that regions with the greatest number of respondents had a higher density. Due to the graphical depiction of the participating nations, future academics will be able to form scientific partnerships, produce joint venture reports, and share new techniques.
Figure 10 demonstrates a comparison based on the ranking of articles published in terms of international collaboration in scientific journals. The United States is second only to China in terms of fractional counts; it is noted that the United States is not as involved in terms of international co-authorship as advanced industrial countries such as Italy and Japan in studying landslides. China has collaborated in research with Germany, Nigeria, Hongkong and Canada. This clearly shows that China is collaborating with all types of nations, whether rich or poor. The results also indicate that, despite the use of English as the international language, there has been collaboration between the US and Portugal. Italy has mostly collaborated with neighboring countries, such as Spain and Austria. The Asian country Taiwan has collaborated with Norway and Turkey, and Australia with Saudi Arabia. These networks indicate the economic and cultural differentiation in the global pattern [31].

4. Different Landslide Prediction Methods

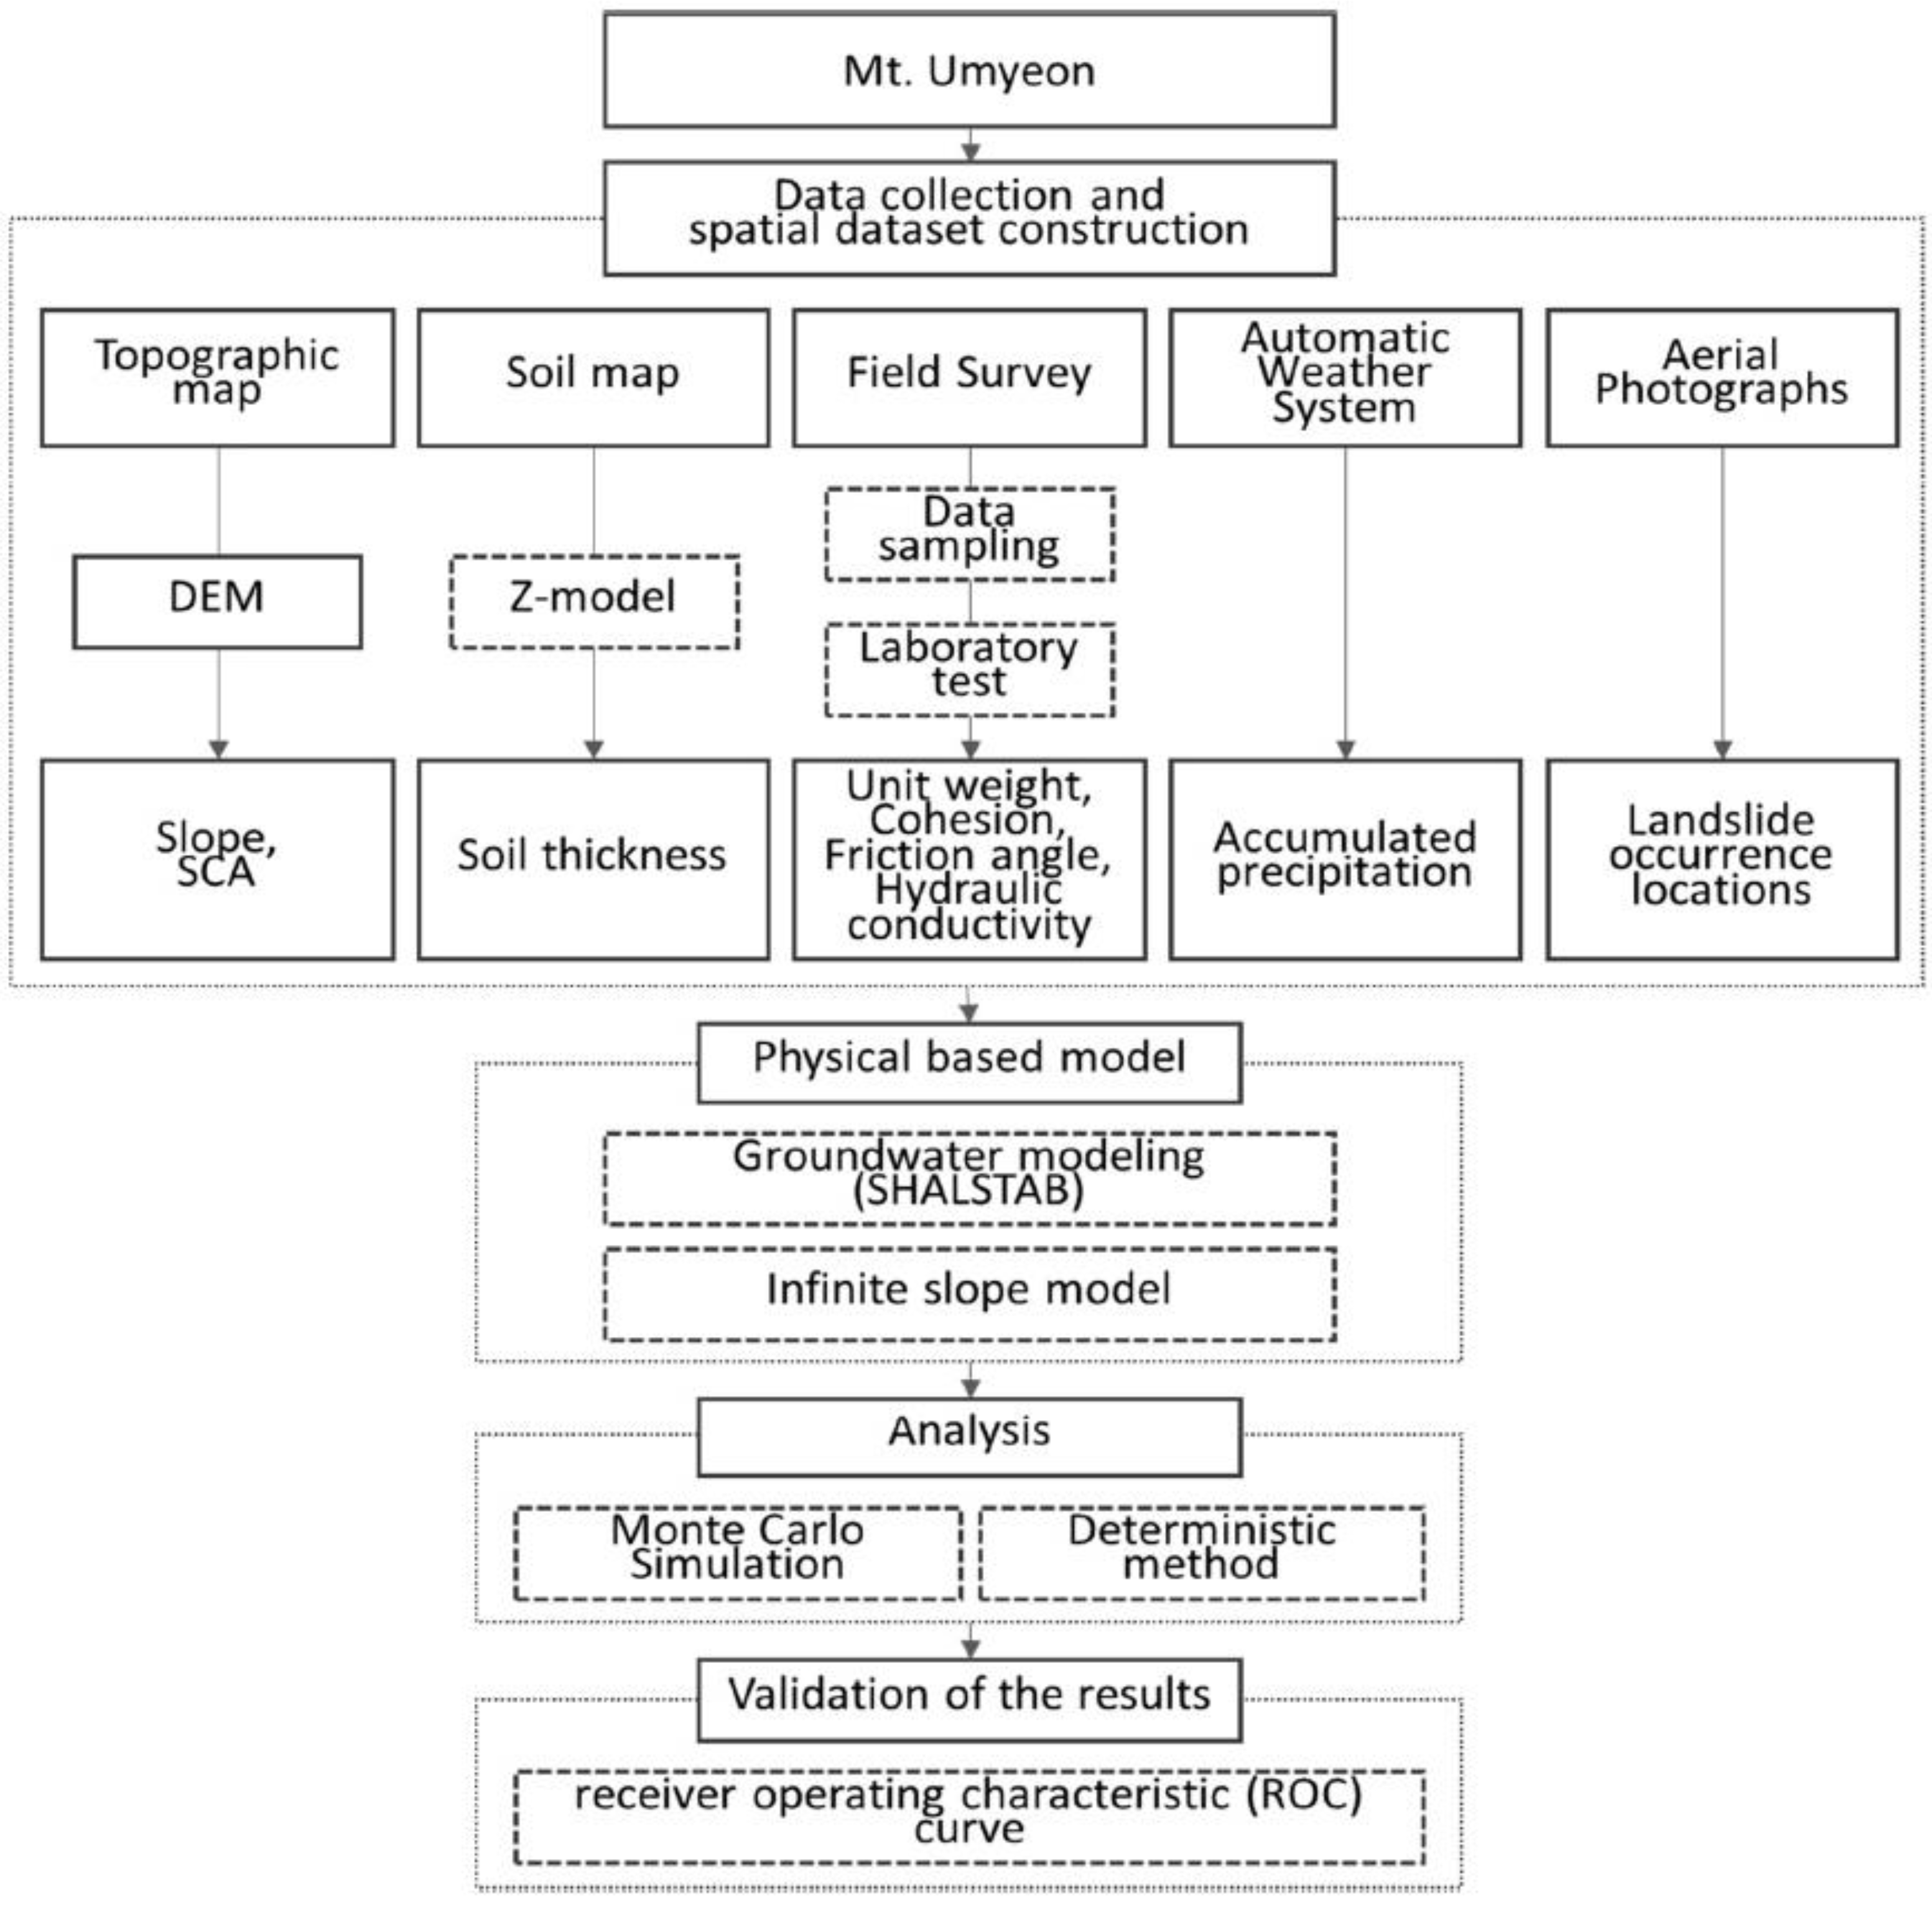
4.1. Physically Based Models

Physically based models have been widely used due to their excellent advanced data, potential and appropriateness for quantifying the impacts of certain factors leading to the initiation of landslides. Due to their capacity to mimic the physical processes governing the recurrence of landslides, the physically based approach may be useful for studying the resilience of shallow landslides [32,33]. Slope resilience is evaluated physically by evaluating the forces operating on it with the use of a physical slope model, which may include an infinite slope method [34]. The infinite slope model is a simple but effective representation of a rainfall-induced landslide on a slip surface parallel to the ground slope. Due to its premise that landslides are infinitely long but have a minimum depth in relation to their width and length, this model is well-suited for the study of rainfall-induced landslides with planar slope failure [29,35]. SINMAP utilizes pore water pressure from a topographic consistent hydrogeology model based on the infinite slope stability approach. SINMAP classifies terrain stability based on hydrological, topographic and soil properties [34]. The SINMAP model, which integrates hydrologic processes, geotechnical data, and terrain, is ideal for dealing with this issue. Because precipitation and groundwater circulation may affect soil moisture and produce flow convergence in catchment areas where landslides occur regularly, hydrological variables play a key role in causing shallow landslides [36].
F S = 1 X   ( A + B + C )
X = D ρ s sin θ cos θ
A = C r   ;   B   = C s
C = cos 2 [ ρ s ( D D w ) + ( ρ s ρ ω ) D ω ] tan ϕ
F S = C = cos θ   1 ω r ] tan ϕ sin θ
ω = D w D = h w h
C = ( C r + C s ) h ρ s
r = ρ w ρ s
Hydrological models were used in this instance to clarify the idea of slope stability. The following equation describes the connection between varying soil thickness (m) and depth D (m):
The factor of safety changes to
h = D cos θ
where C represents combination of cohesion. A dimensionless number is created between the soil depth line and the water density to soil weight ratios. The cohesion equation is based on the infinite-slope model and shows a dimensionless variable. According to research, the equation is acceptable since it incorporates soil and root coherence into the cohesion factor (c).
In order for physical models to be useful, they must have precise and spatially detailed description, which is not always attainable. Statistical approaches may include additional elements, such as the distance from roadways, that affect the stability of the slope, but they depend on accurate landslide inventories to make this possible. Because missing data is sometimes imprecise, the maximum entropy (MaxEnt) model has been extensively and effectively utilized in species distribution mapping. A lack of landslides may also be attributed to inadequate mapping scale or technique. MaxEnt and SINMAP have been used in this study to provide an innovative hybrid method for landslide susceptibility modeling. Figure 11 shows a hybrid model which combines SINMAP with Entropy (MaxEnt).
The data collected (slope and catchment area) are obtained through a digital terrain analysis model (DEMs). These parameters may be changed and calibrated using an interactive visual process that modifies them in response to observed landslides. Across the globe, landslides are a major cause of death and property damage. Landslide hazard maps have been developed over the last several decades by a variety of academics using both descriptive and analytical methodologies [38]. DEM, geography, and other factors are used to investigate the interaction of landslides, as shown in Figure 12. Obtaining reliable findings from landslide research requires sufficient precise data from a broad variety of criteria SINMAP accounts for unknown parameters by constructing regular random variables with lower and upper bounds [39].
In terms of the probability density function between these boundaries, the parameters are assumed to vary randomly. By maintaining uniform parameter distributions across complex ranges, this model produces the stability index (SI), which is defined as the probability that a location is stable. To predict the possibility of shallow landslides occurring, dynamic pressure fluctuations due to rainfall and downward incursion are included in the TRIGRS method. The S software enables the combination of infinite slope stability calculations with a one-dimensional empirical method for pore-pressure filtration in a limited depth topsoil in response to time-varying precipitation [41,42,43]. While transitory models may improve the quality of susceptibility results by accounting for the transient impacts of changing rainfall on slope stability conditions, they often need a significant quantity of data [44]. The TRISHAL landslide-susceptibility algorithm and a real-time tracking system were integrated in this study to create an alert index for emergency preparedness and response by showing the consistency of regional slopes in real time and providing an alert level under rainstorm situations for emergency preparedness and response, respectively. The TRIGRS (transient rainfall infiltration and grid-based regional slope-stability) model and an RGA (real-coded genetic algorithm) backward study were used to evaluate the global hydro–geological variables. Slope stability was studied in relation to rainfall infiltration by TRIGRS, which used real rainfall data to determine the durability of regional slopes. Real-time global slope landslide susceptibility study could not be performed using the TRIGRS tool obtained from the USGS website since it did not include an automated rainfall setting mechanism, as shown in Figure 13. The bulk of the spatial-temporal hydrological parameters (e.g., intrusion, evapotranspiration, subsurface dynamics, and moisture in the soil levels) can be simulated using a triangulated irregular network (TIN)-based real-time integrated basin model (TRIBS) [42,45]. This model incorporates regional uncertainty in rainfall fields, soil characteristics, and associated moisture to account for the environmental impacts of varied and anisotropic soils [46].

4.2. Probabilistic Models for Landslides

It is recommended that parameters are regarded as random variables for the purposes of probabilistic analysis to account for any uncertainties that may be involved with their calculation. Additionally, the probability density function (PDF) and the statistical characteristics (such as the standard and mean deviation) of unknown variables are computed based on the available laboratory or field data. For models for which deterministic analysis is feasible, Monte Carlo simulations are one of the most frequently utilized techniques of probabilistic analysis, and they may be used for any model for which deterministic analysis is conceivable [47]. It is believed that Monte Carlo simulations are a more complete probabilistic analysis method because they incorporate all random variables, along with the probability of failure that is determined by reliability analysis [48,49].
The Umyeon area served as a representative case study for urban landslides in South Korea, and Monte Carlo simulation was used to examine the relationship between landslide location, altitude, slope aspect, particular catchment area (SCA), soil depth, bulk modulus, cohesion, angle of friction, hydraulic properties, and rainfall amount. A deterministic analysis was also carried out to provide a basis of comparison, as shown in Figure 14. This methodology was used in conjunction with a physically based model approach; nevertheless, in this case of probabilistic analysis, the parameters were not treated as random variables [50].
Several researchers have used probabilistic analytic techniques to evaluate physically based models when conducting their investigations. However, since the hydrogeological model was not utilized in these studies, it was assumed that the groundwater level remained constant across the whole study area in these calculations. The probabilistic approach treats the input data as unknown parameters, with uncertainties in their determination taken into consideration. The statistical characteristics of the input parameters (e.g., probability density function, mean, and standard deviation) are then computed using the available data, and the likelihood of failure is calculated using these random variables [50]. Because the correctness of the statistical description of input unknown parameters has a major effect on the results of probabilistic analysis, the validity of the input data should be mathematically verified by a sufficient number of samples. That is, a significant amount of reliable data is needed to conduct the probabilistic analysis and calculate the uncertainty properly [52].

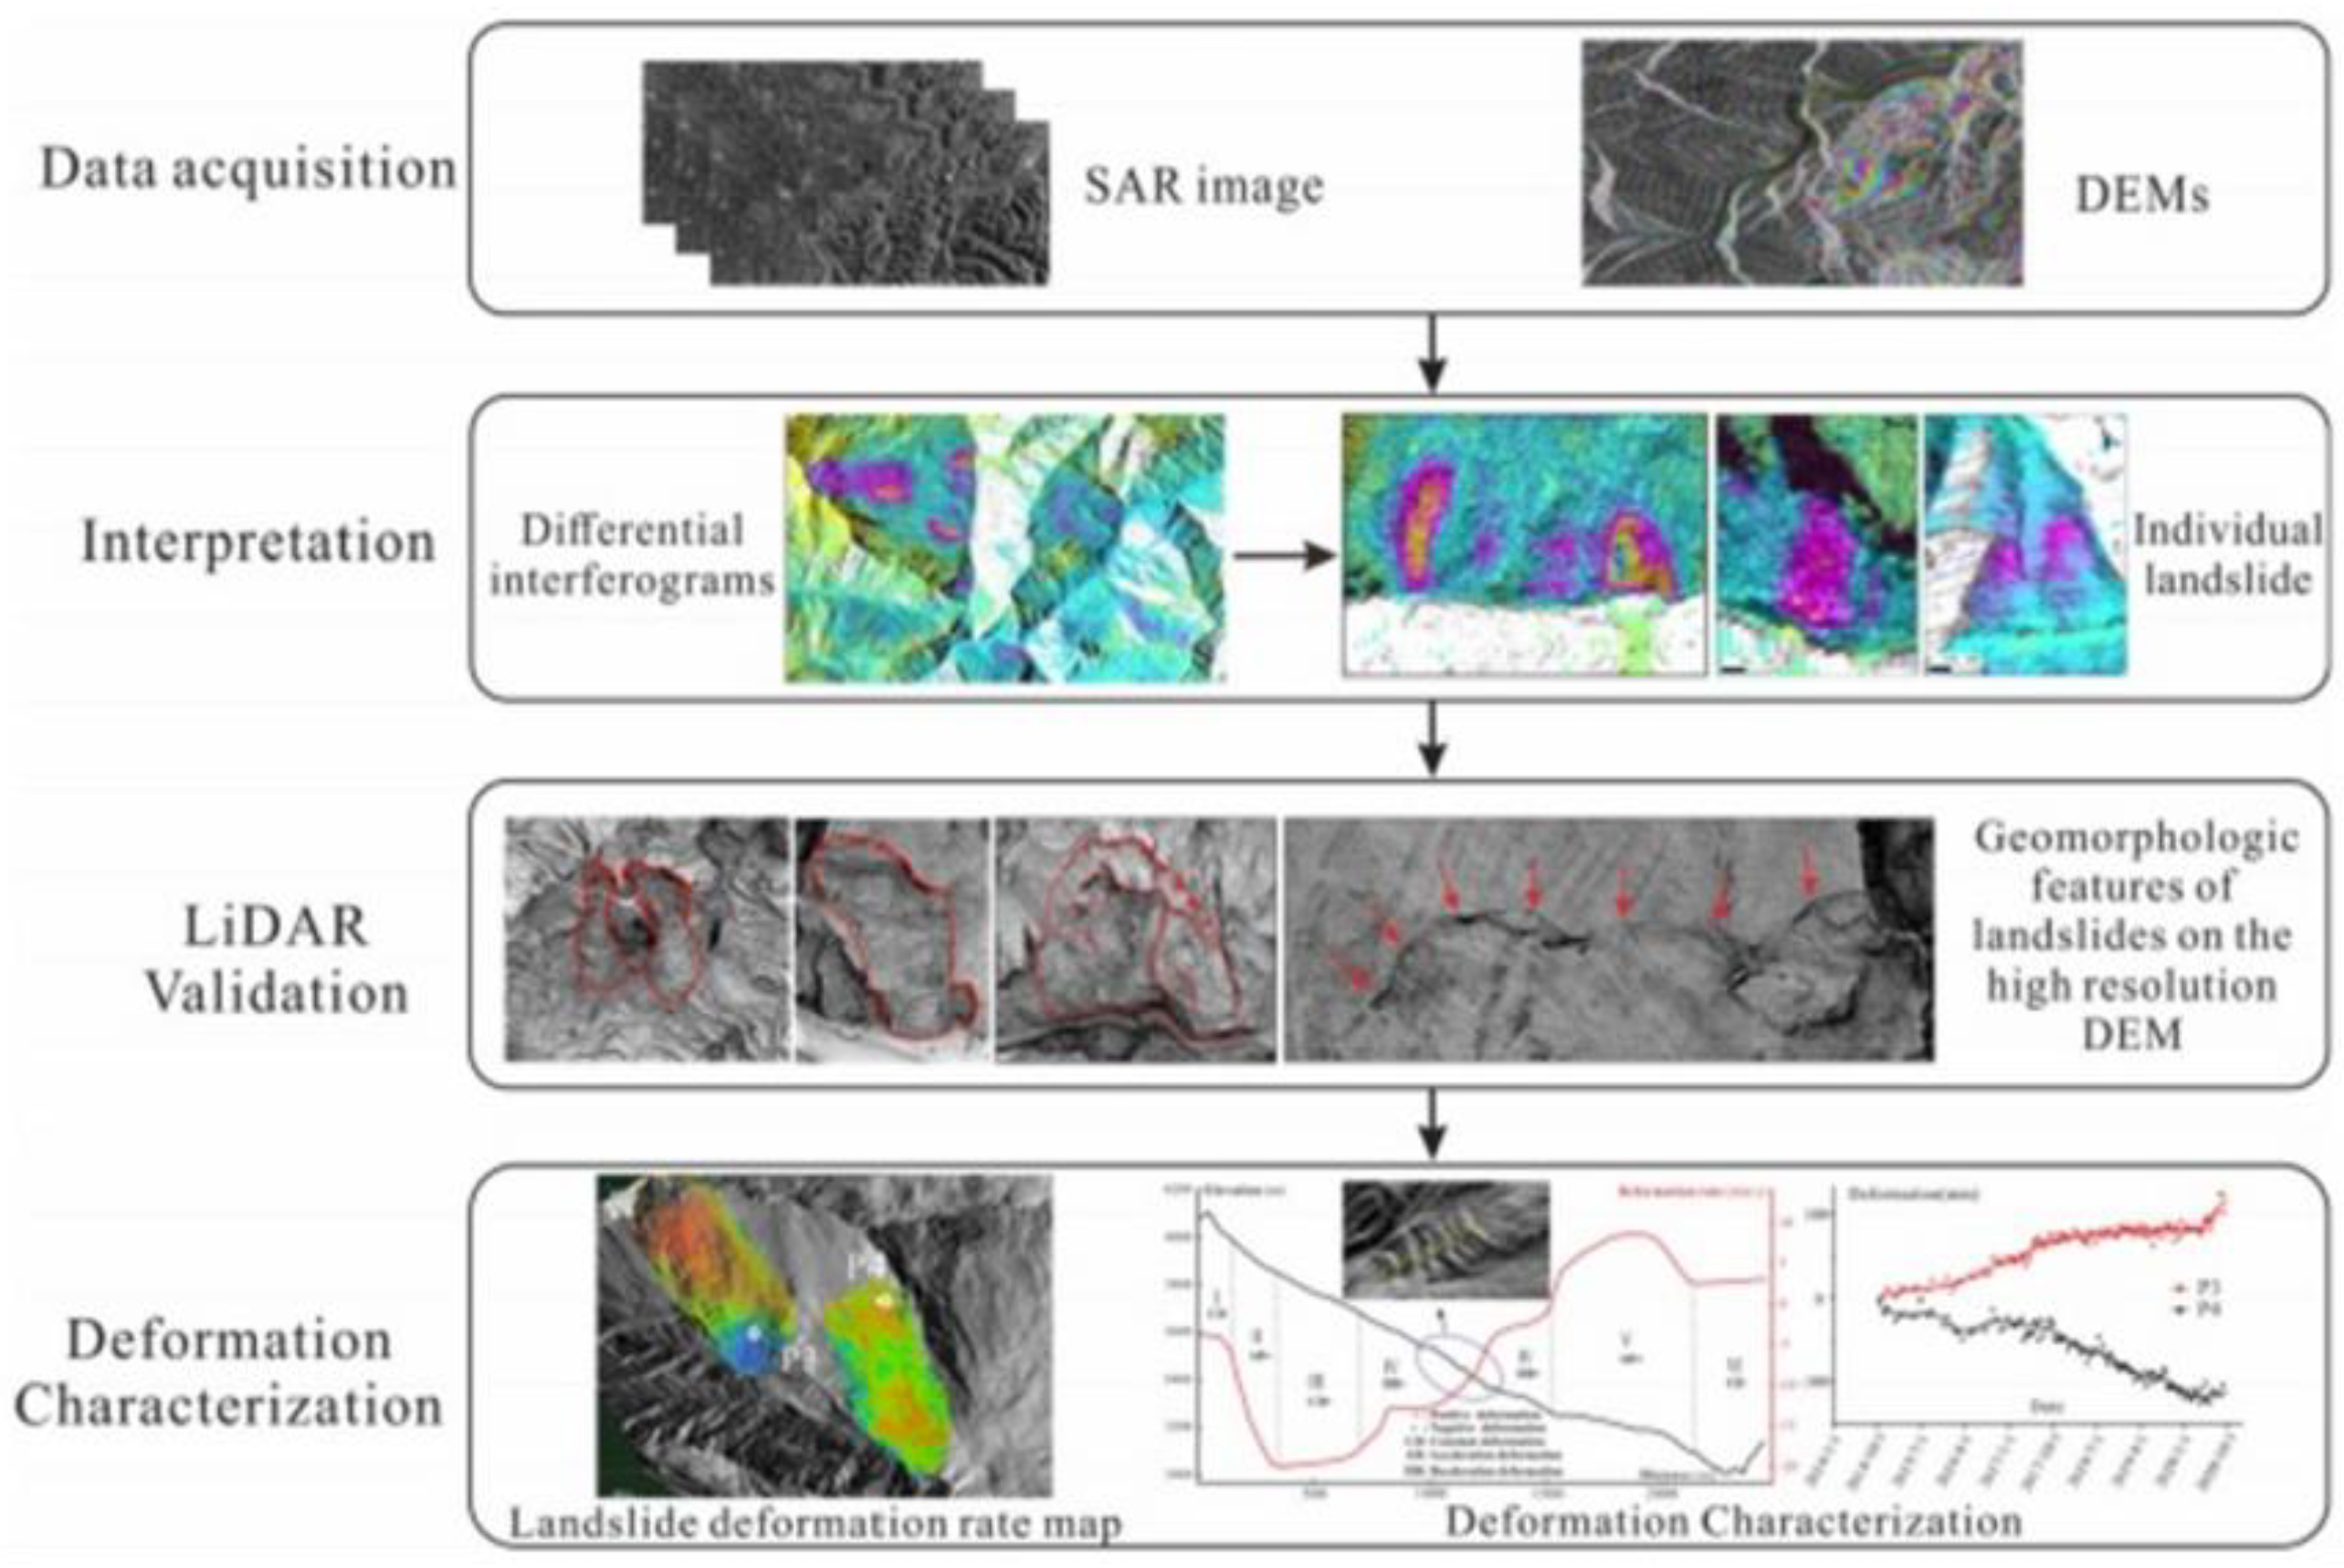
4.3. Landslide Monitoring Methods

Landslide monitoring is necessary for early detection of landslides as well as early warning. It detects changes in attribute values of landslide triggering variables and records slope displacements at probable landslide sites to minimize landslide-induced damage. The development of slope stability models relies heavily on the monitoring of kinematic, hydrological, and climatic data. Forecasting is impossible without a thorough knowledge of movement patterns and reactions to climatic events [53,54]. In the physically based model technique, the parameters are not treated as categorical variables in the probabilistic analysis technique. In previous studies, probabilistic analytic techniques were employed to evaluate physically based models but not the hydrogeological model, implying a consistent level of water across the study area [55]. A GPS, tiltmeter, and wire extensometer were installed in the upper part of the landslide to determine the shape and magnitude of the sliding masses [56]. Using displacement monitoring, the authors tried to estimate the absolute longitudinal and lateral motions, as well as the speed of the various components of the complicated landslide. Inclinometers have been used in a number of studies to track the progress of landslides [57]. This restriction is nearly entirely addressed by remote sensing techniques, which use sensors that can detect the earth’s geological characteristics from a distance and without direct contact. This, along with recent significant advancements in space- or airborne-sensing platforms, has resulted in a significant increase in the contribution of remote sensing to landslide risk analysis, early warning and monitoring [58]. Aerial photo-interpretation, which was historically carried out by calibrated optical cameras flying on airplanes, depending on high-resolution images of the ground, was the first RS tool employed in geomorphological research, with a particular reference to landslide identification and mapping (both in grayscale and RGB) [59]. Traditional airborne photogrammetry was the first technique to be surpassed by space-borne optical image analysis, mostly due to cost considerations [60]. The transition from conventional human interpretation and mapping to semi-automated or completely automated interpretation and mapping is essential for the use of optical images in landslide monitoring. In practice, if the revisiting time is short enough to allow for monitoring, the image elaboration must be as quick [59]. According to ALS, which investigated the morphology of two huge landslides in Idaho (USA) at various spatial scales, mass movement geometry and kinematics are minimized by using geomorphometry with high resolution DEMs, such as laser scanners. A number of factors, including aircraft altitude, LiDAR quality, topographic surface layout, and vegetation effects, affect the feasibility of DEMs and 3D models produced by ALS [61]. Because of the difficult terrain and extensive vegetation in the mountains of western China, inSAR displacement estimates are inherently more unreliable. The accuracy of landslide detection may be compromised if there is insufficient validation. Landslides were first detected using stacking InSAR technology over a vast region in this research. Then, high-resolution DEM and aerial LiDAR data were used to validate, alter, and precisely delineate the borders of active landslides in a narrow zone, as shown in Figure 15.

5. Case Study of Landslide Prone Regions

5.1. India

Several landslides have struck the Himalayan area, and a sample of the more well-studied and destructive landslides are highlighted below. The majority of research has taken place in Uttarakhand [63]. Some large landslides in Uttarakhand happened in the Okhimath area in Mandakini Valley, which was severely devastated by a landslide caused by intensive rainfall in August 1998 [64]. A total of 466 landslides were caused in all, resulting in 103 fatalities and the destruction of 47 communities. Subsequently, a cloudburst in Mandakini Valley in July 2001 caused more than 200 landslides, killing 27 individuals and affecting over 4000 people. To detect a landslide immediately after its occurrence, the OB method has been used for making landslide inventory database from previous pictures. In Okhimath, Uttarakhand, data from the 1998 landslide inventory were related to field data collected after the landslide [65], as shown in Figure 6. In the research, 73 landslides were discovered using Resourcesat-1 LISS-IV multispectral data (5.8 m) and a 10-m Cartosat-1 derived digital elevation model (DEM). In terms of the number of landslides, this semi-automatic method resulted in an accuracy of 76 percent for recognition and 69 percent for categorization using a semi-automatic approach. The Darjeeling region of West Bengal and Sikkim has seen the highest number of recorded landslides in the country’s northeastern region. Landslides have occurred in the Darjeeling area on many occasions in the past, with the first significant documented event being in 1899, which resulted in the deaths of 72 people. Subsequently, landslides occurred in 1950 (in which 127 people perished) and 1968 [66] (667 people died). The majority of landslides in the Indian Himalayan area are shallow in character, with rainfall serving as the main triggering cause in the majority of cases. Precipitation analysis for the purpose of predicting landslide occurrence may be accomplished via the estimation of minimum rainfall conditions, subsurface monitoring, or slope stability analysis. In terms of minimal rainfall conditions, often known as thresholds, two types of methods may be distinguished: empirical and physical [67]. The majority of landslides in the Indian Himalayan area are shallow in character, with rainfall serving as the main triggering cause in the majority of cases. Precipitation analysis for the purpose of predicting landslide occurrence may be accomplished via the estimation of minimum rainfall conditions, subsurface monitoring, or slope stability analysis. In the Himalayan area, it has been proposed that antecedent rainfall, lasting between 15 and 30 days, has a significant impact on destabilizing slopes, resulting in landslides being triggered by subsequent rainfall of short duration (24–72 h). There has been little research on rainfall thresholds in the Indian Himalayas, and more study on calculating and studying local and regional thresholds is needed [68]. It is self-evident that Kerala’s diverse climatic conditions enhance slope failures [69]. In Kerala, the greatest mass movements originate on hill slopes along the Western Ghats scarps [70,71] apart from the coastal cliffs. Shallow landslides and mudflows are much more frequent than massive landslides and debris flows. Typically, debris flows lead to the formation of very low streams, the reopening of naturally clogged drainage routes, and the enlargement of streams. The Wayanad and Kozhikode districts, situated north of the Palakkad Gap, are more prone to deep-seated landslides, which may be attributed to the state’s greater rainy season [72]. Historical archives include only indirect evidence of landslides in the past, which were most likely limited to seasonal rainfall associated with severe parts of the course [73]. Human impacts, such as reforestation, conservation tillage and blockage of small streams, and the growth of crops incapable of adding root cohesiveness on steep slopes, increase the process. Inevitably, spontaneous drainage was obstructed or changed on the majority of collapsed slopes via retaining walls without enabling water runoff of surplus rain water during strong storms [74]. The southern Indian state of Kerala has suffered considerable losses due to landslides in the 2018 and 2019 monsoon seasons, and is in danger of debris flows in the foreseeable future [75]. Because of its geographic and geographical qualities, the state is particularly vulnerable to natural disasters. The topography all along the Arabian Sea coast has a severe elevation due to the hills of the Western Ghats. Darjeeling Himalayan landslides are a continual source of concern in Himalayan mountain areas, inflicting catastrophic loss of property and lives each year [76,77]. Landslides in Darjeeling Himalaya have happened mostly on cutting slopes, either by the side of roadways, or in places next to developed settlements [78,79]. The Darjeeling Himalaya is made up of lithology from the tertiary, proterozoic, and upper palaeozoic-mesozoic eras [80,81]. The delicate condition of the soil in the Darjeeling Himalaya aids in the inception of slope movement processes. June, July, and August are the months with the highest average precipitation [82,83]. The latest monsoon tragedies in the Western Ghats have prompted officials to take notice of recurring landslides in the area. Landslides have become a serious hazard to people and property in Wayanad, a district in Kerala, India, as shown in Figure 16.

5.2. Italy

The Liguria region has been one of the most severely impacted mountainous regions in Italy and the Mediterranean by rainfall-induced shallow landslides, which have occurred across the region [85]. Specifically, in the Entella River basin, which is located in the Tyrrhenian sector of the Ligurian Apennine, over the period 2000–2017, a total of 45 rainfall events occurred, resulting in more than 664 destructive instability processes throughout the slopes of the basin. An inventory of instability mechanisms and ground impacts caused by rainfall events in the research region was created and georeferenced using landslide information gathered mostly from online networks and damage reports [86]. The frequent occurrence of short-duration, strong rainfall events in the basin, along with harsh morphological conditions and human activity that has gradually and intensely changed the landscape in recent decades, has resulted in an increase in the frequency of landslides. The instability has mostly impacted natural or semi-natural slopes that were vegetated and seemed to be inhabited at first sight; nevertheless, gravitational processes happened often when anthropic factors were present. We discovered a statistically significant relationship between anthropogenic landforms and slope instability. The extensive and widespread damage framework exhibited a strong correlation with road networks, buildings, terraces, and other man-made structures, and can be linked to the unplanned urbanization that has occurred in recent decades on slopes that have a fundamentally high tendency to instability as a result of their morphological and geological characteristics. The results of this study show that human influence has an effect on the occurrence of landslides; re-profiling the slope and changing the landscape increase the chances that a landslide may happen [87]. The Basilicata area (southern Italy) has the highest number of landslides, with almost 27 landslide sites per 100 km2. Extreme rainfall events, as well as human activities, such as cave excavation, forest destruction, and heavy urbanization and industrialization, all contribute to the high landslide density [88]. Landslides are a common occurrence in this region’s terrain, and they impact about 90 percent of the region’s communities. Massive and regular landslides have wreaked havoc on Basilicata’s inhabited regions in recent decades, inflicting significant and severe destruction to houses and infrastructure. Numerous landslides in the regions south-eastern corner were triggered by severe rainfall events between October 2013 and March 2014, particularly in the regions south-eastern corner [89]. The most significant of these occurred on 3 December 2013 in Montescaglioso, a hilltop town located in the south-eastern part of the Basilicata, near the town of Matera, and was reported by the media. With strong and dramatic geomorphological impacts and extensive destruction, including the collapse of residential structures and a store, it was fortunate that in the landslide no one was killed or seriously injured [90]. It evolved along a slope, which had been constant over the previous 40 years, according to SINMAP’s study of susceptibility, but had undergone significant anthropization in the recent past. There was additional evidence of a link between rainfall and slope displacement. Because of the lack of natural drainage networks and the inadequacy of artificial ones, climate research shows that recent severe occurrences have created critical circumstances alongside the weighing caused by supersaturation [91]. Common causes of failure have included soil disruption, silt or mud deposition along streams and roadways, slope failure and removal of sections of roadways or walking routes, collapse of concrete blocks and inorganic scarps. These have caused disruption of services and/or the dismantlement of engineering structures, and, in some cases, the destruction of houses and depots, as shown in Figure 17. IRPI, or the Istituto di Ricerca per la Protezione Idrogeologica, is a CNR research institution tasked with the responsibility of investigating geohydrological risks, such as landslides [92]. The faculty’s objective is to plan and carry out scientific research and technical development in the area of natural catastrophes, with a particular focus on geo-hydrological risks, territory and ecological sustainability, and appropriate georesource use [92]. CNR IRPI’s areas of focus includes landslide risk disaster risk reduction, landslide identification and mapping, soil investigation analyses, remote sensing data analysis, landslide predicting systems, landslide vulnerability and threat modeling, socioeconomic impact assessment of landslides, and propagation of landslide information [93,94]. CNR IRPI is a center of expertise for geo-hydrological hazard identification and risk management for the Italian National Department of Civil Protection, a Prime Minister’s Office [95]. The authors report an investigation of landslide incidence in Porretta-Vergato, Italy, in relation to protracted seasonal rainfall. Statistical analysis was performed on data sets gathered over almost a century [96]. At the basin level, the distribution of landslide hazard was addressed and compared to rainfall in order to improve knowledge of the two variables and to analyze their temporal variations, as well as their interdependencies [97]. Pomarico is a tiny village in Basilicata, southern Italy, that has a history of landslides [96,98]. A networked optical fiber type of sensor was used to determine the stresses caused by landslides on an optical fiber embedded in a wide scale physical model of a hillside [99]. The fiber sensor wire was installed at the specified failure plane and characterized using optical spatial frequency reflectometry [100]. The model was divided into two sections: a steady-state simulation for subsurface drainage as well as an infinite-slope Coulomb failure analysis that implies the ground is undermined at collapse [101]. Heavy rains often impact the Eastern Ligurian Riviera, especially the famed Cinque Terre, resulting in minor landslides, inflicting damage and occasionally fatality [102,103]. In engineering geology and geomorphology, airborne remote sensing devices are increasingly employed to analyze and monitor environmental hazardous situations and phenomena. Remote sensing monitoring methods, such as LiDAR and unmanned aerial vehicles (UAV), were utilized in this work to assess the Montescaglioso landslide’s kinematic development (Basilicata, Southern Italy) as shown in Figure 16. The huge failure continued to move together across Montescaglioso municipality’s steady–state model slope, causing severe breakdowns along the road (“Montescaglioso-Piani Bradano”) giving access to the Montescaglioso provincial road and causing harm to some housing and houses in construction, including a grocery store and the sandstone sector (see Figure 18).

5.3. China

The findings of this research demonstrate that empirical techniques may be used to model rainfall-induced landslides that frequently occur in China [106]. This may be regarded as a meaningful feature used in systematic landslide modeling, and has the potential to be used in the study of Earth system science for the activation of suitable landslide susceptibility mitigation strategies [107]. Machine learning is a cutting-edge analytic method [108,109,110]. It has been extensively employed in the prevention of landslides. Combining a modeling approach with a locally-based mathematical model as well as with other types of remote sensing data is referred to as a combining econometric model [111]. Several similar numerical simulations have been used to study the collapse stages of a Yindongzigou landslide during rainy circumstances. The collapse of the hills has been categorized into three forms based on the degree of the failure: (1) delayed retrogressive toe sliding; (2) numerous retrogressive rolling; and (3) rapid diffusion flow sliding as a whole. Landslide susceptibility mapping using the data cost method was implemented through research into historical landslides, slope monitoring, and statistical analysis, to develop an estimate of the likelihood of landslides occurring for each sensitivity and specificity class, with precipitation expected in the next 24 h being the most important factor [112]. The innovative approach for spatiotemporal forecasting on the basis of grading and overlapped physical parameters, as well as the influence of the rainfall factor, has been used in the analysis of the formation circumstances of rainfall-induced landslides [113]. China is divided into seven main regions and twenty-eight warning regions based on geological and geographical factors. The prediction and alert criteria for each location are created using a statistical study of the quantity and method of rainfall in the 15 days before the landslide occurrence [114]. China is one of the nations that has suffered significant casualties as a consequence of landslides [5]. Annually, landslides claim a large number of lives in China. Climate change is predicted to boost the incidence and magnitude of intense precipitation, resulting in a shift in the incidence of landslides [115]. The purpose of this research was to examine the effects of climate change on the features of the occurrence rainfall that are typically associated with the landslide hazard in China [116]. However, no cohesive equation can presently characterize the I-D threshold in China, owing partly to the absence of ground rainfall gauges in so many places, particularly in the country’s west [117]. Due to the possibility of inconsistent seasonal rainfall, the spatio-temporal rainfall patterns derived by interpolation techniques are erroneous [118]. Several studies have demonstrated that the solutions can accurately reproduce the geographical and temporal pattern of actual rainfall, as evidenced by their pathways linking with rainfall gauges in various parts of China [119]. The purpose of this project was to determine if it was feasible to map landslide susceptibility at the national level for China, using limited landslide data and mixed effects modeling [120,121]. To accomplish this, three leading landslide susceptibility models for China were provided. Each model focused on a false strategy for dealing with the inevitability of regional landslide data insufficiency [120,122]. It was demonstrated that certain biases may significantly affect the evidential support of future statistical key metrics, as well as the believability of the generated spatial variation [123]. The modeling findings demonstrated that a generalized additive mixed model (GAMM) may be used to mitigate the undesirable impacts of incomplete landslide data [124]. Geographic variety in socioeconomic levels throughout China’s geological environment areas, has resulted in considerable spatial variances in disaster prevention and mitigation and landslide study spending across geologic environmental regions [125,126]. For example, the southern China geological environment area is more developed financially than Tibet, which is likely to spend more on landslide studies [120,127]; shallow landslides are shown in Figure 19.

5.4. United States of America

As a geologic hazard that may occur anywhere in the United States, landslides are a common occurrence. It has been estimated that they are responsible for 25–50 deaths a year and billions of dollars’ worth of economic damage [129]. In the United States, the number of people killed by landslides varies dramatically from year to year. According to more current figures, 93 people died as a result of landslides between 2004 and 2016. Estimates of landslide-related economic losses, however, are fraught with ambiguity in relation to fatality counts. Estimates were made using data from individual homes in southern California that had landslide-related damage that were extrapolated to the whole nation [130,131]. Similarly, Kentucky’s estimated yearly direct repair expenditures for landslide-damaged highways and private homes ranged between $10 million and $20 million US dollars [132]. Indirect losses from decreased economic productivity and other landslide-related expenses, on the other hand, are very difficult to quantify and have not been documented. For the typical range and severity of landslide weather conditions across the United States, upgraded estimates of economic damage are critical, particularly given that the impacts of landslides are anticipated to grow as a result of ongoing climate change, increased disturbances, such as wildfire, and population expansion into landslide-prone terrain [133]. Several landslide-related deaths and catastrophes in the United States have recently heightened public awareness and directed more resources into landslide research and mapping. These shifts in objectives, along with recent technological advancements, have resulted in concentrated attempts to map landslides within specific administrative regions, usually by state or county. Landslide inventories have long served as the basis for research and different kinds of hazard evaluations aimed at minimizing losses. Inventorying the time of slope collapses, for example, is important for improving empirical and deterministic criteria for landslide early warning systems at different scales. Landslide mapping and categorization is usually performed at a local level, or during post-event response operations, with very varied goals and resources provided. Several state geological surveys or agencies in the United States have developed landslide mapping procedures that are well-defined [133]. This has opened the path for thorough landslide inventories inside their different jurisdictional borders. However, because of a lack of guidelines for consistent data collection and administration, landslide data formats may differ significantly across inventories, making it difficult to create a unified national-scale product. Our first steps toward compiling a list of known landslide occurrences in the United States compiled existing, publicly available geodatabases, but reduced them to a uniform subset of attributes that we deemed necessary for developing a comprehensive understanding of landslides and their impacts across the country. The USGS maintains an open repository for seismically induced ground-failure inventory, which includes liquefaction and landslide incidents related to particular earthquakes. The authors of technical reports and scientific journal publications contribute inventories, but the USGS maintains access in a centralized place [134]. Academic researchers in England have created a worldwide database of deadly landslides going back to 2004 based on media and other sources. However, state and municipal government organizations in the United States often keep more accurate and complete maps of landslide occurrence, which may contain historical landslides that predate 2007, or may not always include explicit information on the date of occurrence. These surveys are created by trained geoprofessionals using a variety of rigorous investigative techniques, including LIDAR-based detection and deep investigations, as well as regional geologic mapping of major quaternary landslide deposits. NASA extracted a subset of landslides with specified dates from these state and local records and combined it with the GLC to generate a dataset of rainfall-triggered landslides with dates [135], e.g., SINMAP in conjunction with MaxEnt. This technique was put to the test on a seaside basin in Pacifica, California, with a very well-established landslide history that included three inventories of 154 scars on 1941 images, 142 scars in 1975, and 253 scars in 1983. Due to a lack of data on root cohesiveness, the results showed that SINMAP simply overstated vulnerability, as shown in Figure 20.

6. Discussion

Landslides cause a great deal of human suffering and financial loss. Systematic and rigorous processes are always implemented to prevent or limit mass movements in order to stabilize or regulate slopes. In the near term, landslide sediments can harm fish habitat, despite their importance for stream shape. The recovery rate is highly variable. Wet hillsides in a mountain watershed are exposed by shallow landslides, and these deposits bury the downstream channels. Landslide scars have created an oxygen-rich habitat. A large amount of Ca2+ and HCO3 is entrapped in the rainfall as it percolates down the slopes and into the landslide deposit, as shown in Figure 21. It is no secret that the VOS viewer is a well-respected graphical interface in research. The results of this study reveal that the VOS viewer is used to meet the data analysis goals. Physical models have been extensively used because of the abundance of high-quality data innovation; they have potential and are appropriate for quantifying the impacts of certain factors leading to the initiation of landslides. Furthermore, because of its ability to replicate the physical phenomena governing the repetition of landslides, the physically centered method may be suitable to study the adaptability of shallow landslides. The parametric approach analyzes the input data as if they were unknown parameters, with the assumptions in their derivation also being taken into account. Based on the data collected, the statistical properties of the input variables (e.g., probability density distribution, mean, and variance) are determined, and the chance of failure is evaluated using the random variables derived as a result. The observation of kinematics, hydrologic, and climatology is essential to the growth of slope stability models. Landslides pose a serious hazard to the lives and property of people living in India. After the latest monsoon catastrophes, officials have taken notice of frequent landslides in the Western Ghats. For residents and property owners alike, landslides in Kerala’s Wayanad district have become a significant source of worry. Because of the wide range of socioeconomic conditions found throughout China’s geologically diverse regions, there are wide variations in hazard preparedness and mitigation efforts, as well as in landslide research expenditure. Liguria has been severely affected by rainfall-induced landslides, which have happened all over the territory in the past few years. Landslides are a typical geologic hazard that can occur anywhere in the United States. They are thought to be responsible for 25–50 deaths per year, as well as billions of dollars in economic harm.
The limitation of this research is that some groundbreaking studies are unjustifiably omitted by scientometric analysis and secondary sources written by other writers and released later are preferred. In scientometric analysis, sometimes it is the case that decision-makers, as well as other users of relevant research results, are guided by the similarity principle, which states that one indication is usually the best option. Scientometric analysis pays attention to a response to the range of situations and tasks, which lacks the necessary variety of viewpoints.

7. Conclusions and Future Recommendations

This study performed a scientometric evaluation of the susceptibility of landslides in landslide-prone regions. The scientometric analysis method was adopted in order to find the most related research topics, the trends in papers published by authors, the co-occurrence of keywords, and the most active nations in the landslide field. Furthermore, the forecasting and monitoring methods connected with landslides were investigated, as well as the effect of landslides on nations such as China, Italy, India, and the United States. The effect of landslides, as well as various forecasting methods, were specifically studied. The following conclusions are presented:
  • A scientometric study of data from the database of Scopus showed that the top three disciplines in counting documents were geology, engineering and environmental research ecology, and meteorology and atmospheric science, accounting for 19%, 18%, and 17% of total papers, respectively. There was a slight increase in the number of articles regarding landslides between 2000 and 2010. Furthermore, statistics gathered between 2014 and 2022 indicated a significant increase in publications. The top four most often appearing words were landslides, rainfall, slope stability, and soils. Furthermore, China, Italy, and Japan contributed the most articles on the subject of rainfall-induced landslides. Guzzetti F. was the most cited author, with 1652 citations.
  • Physical models of landslides are used to simulate the process of landslide occurrence in physically based landslide susceptibility assessment techniques. A disadvantage of utilizing a physical model is that good mechanical and hydrological soil characteristic data from natural areas is not always available. In physical models, grid cells are used for analysis which have lower resolution. In the probabilistic approach, if the data covers a long-time span in order to cover a present period, the outcomes are meaningful. The disadvantage of using probabilistic methods is their inventory approach, as it is not workable for multi-temporal landslides. Remote sensing is extremely useful for exploring changes in the surface. If the detection can be repeated with sufficient frequency, the RS technique may be utilized as a monitoring tool. Remote rainfall observations can be used to anticipate rainfall-induced landslides.
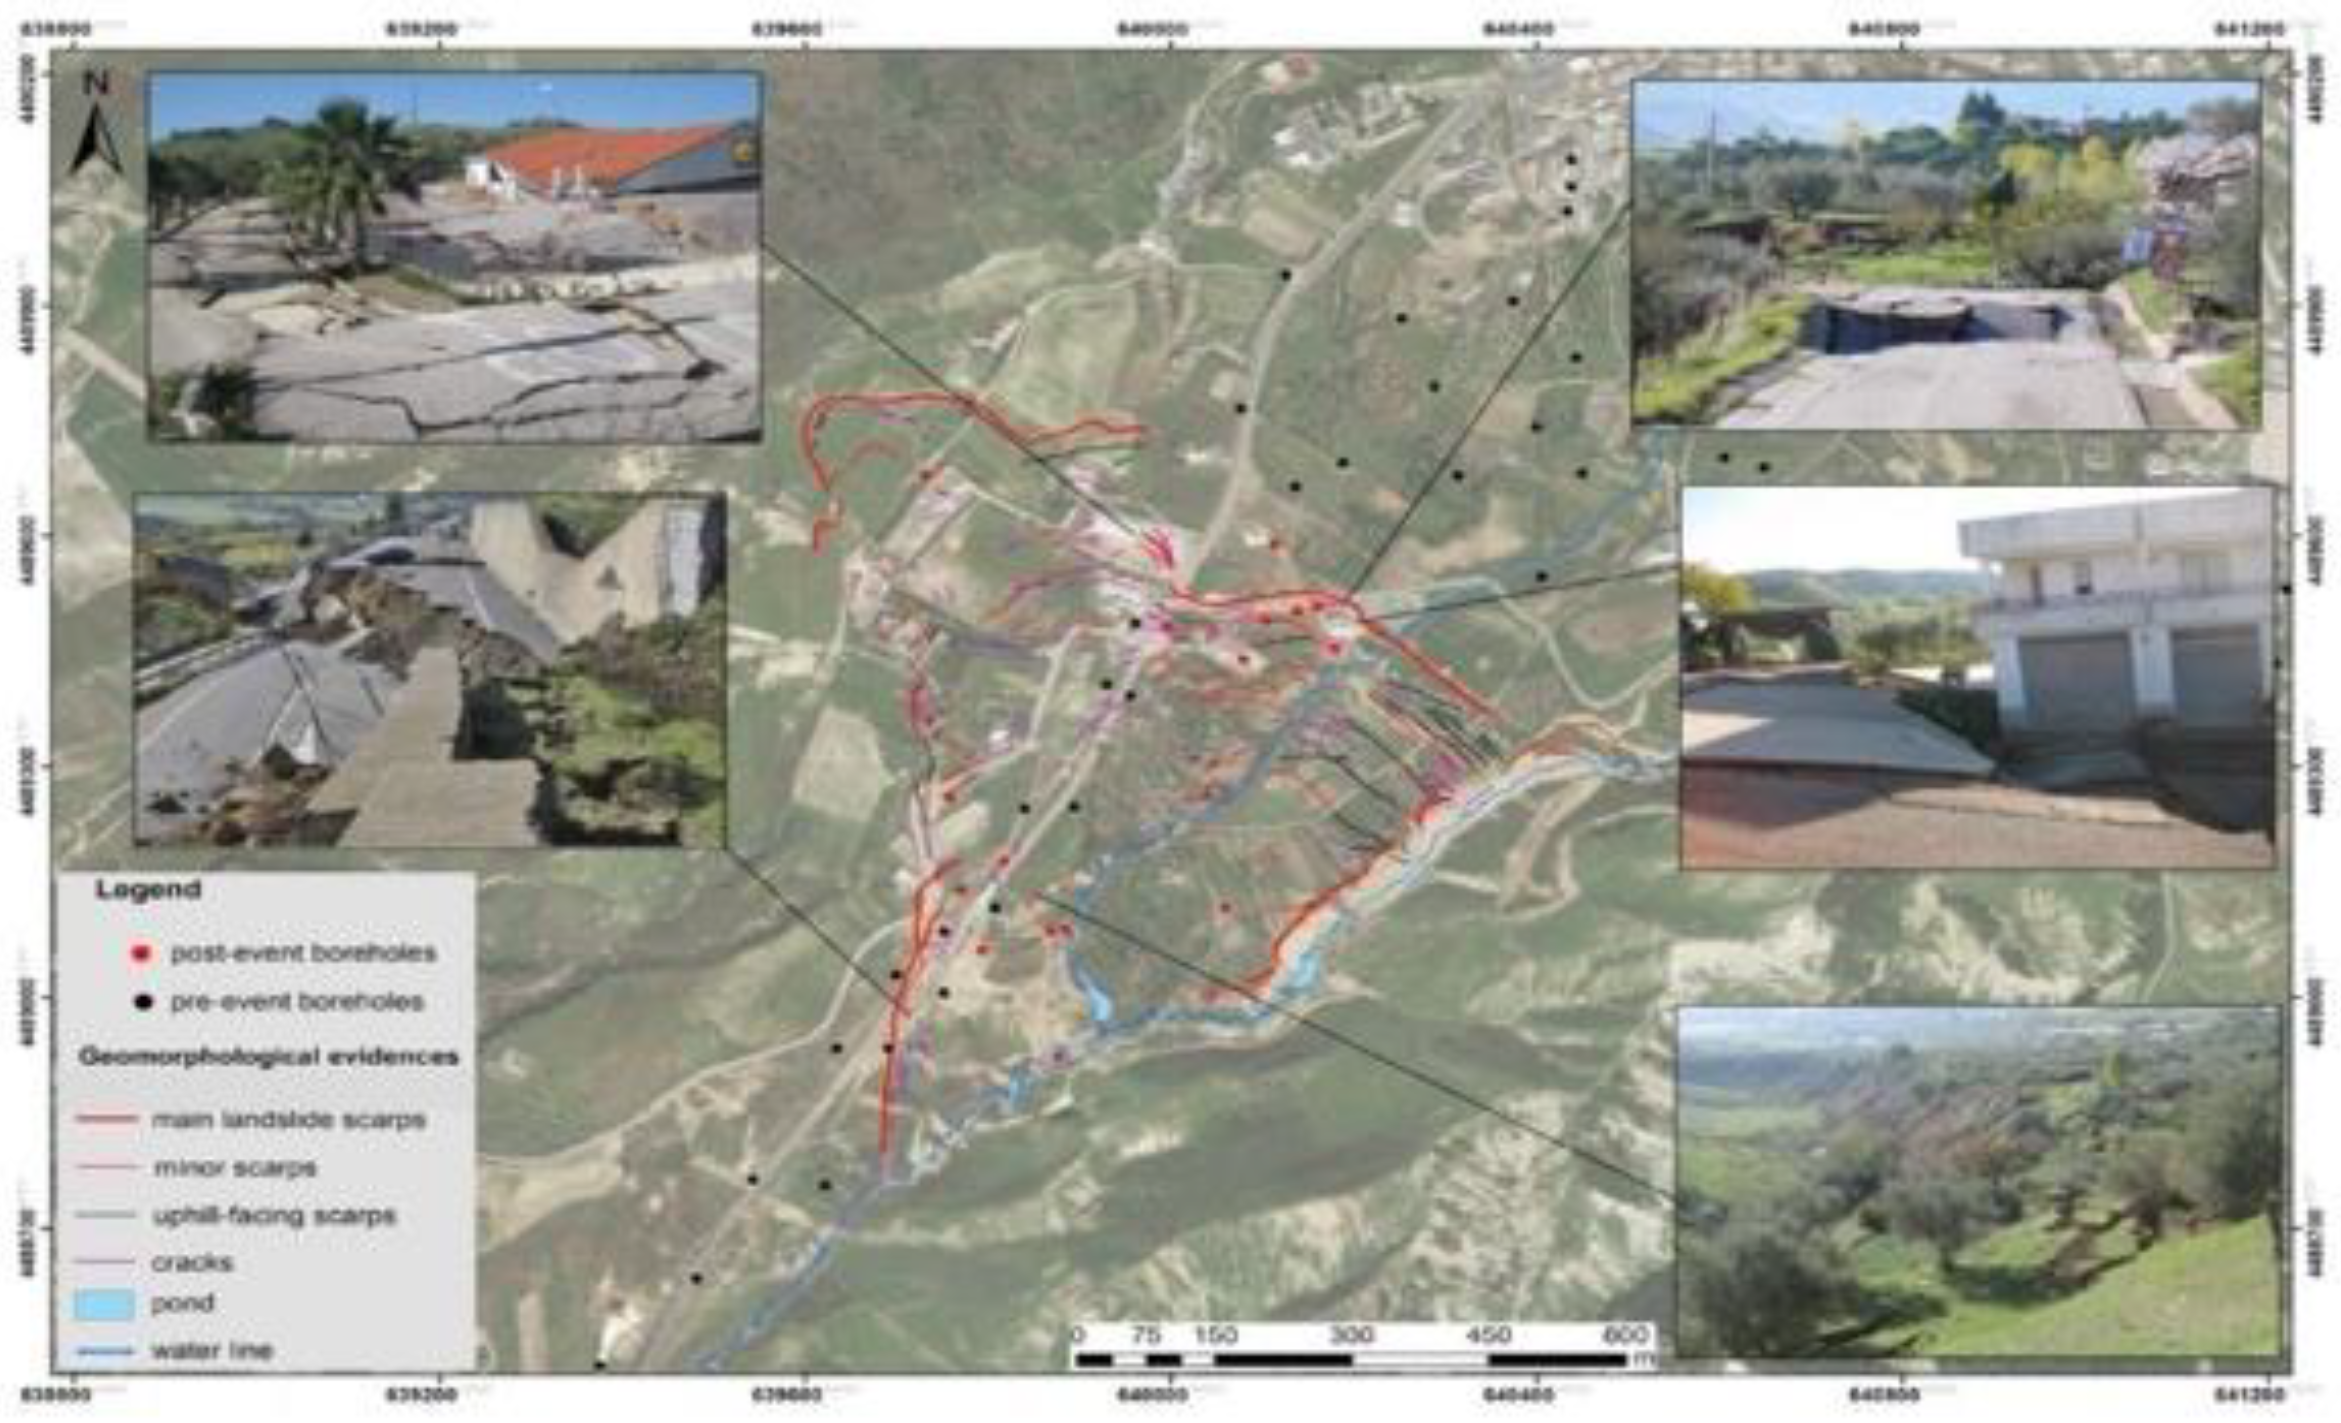
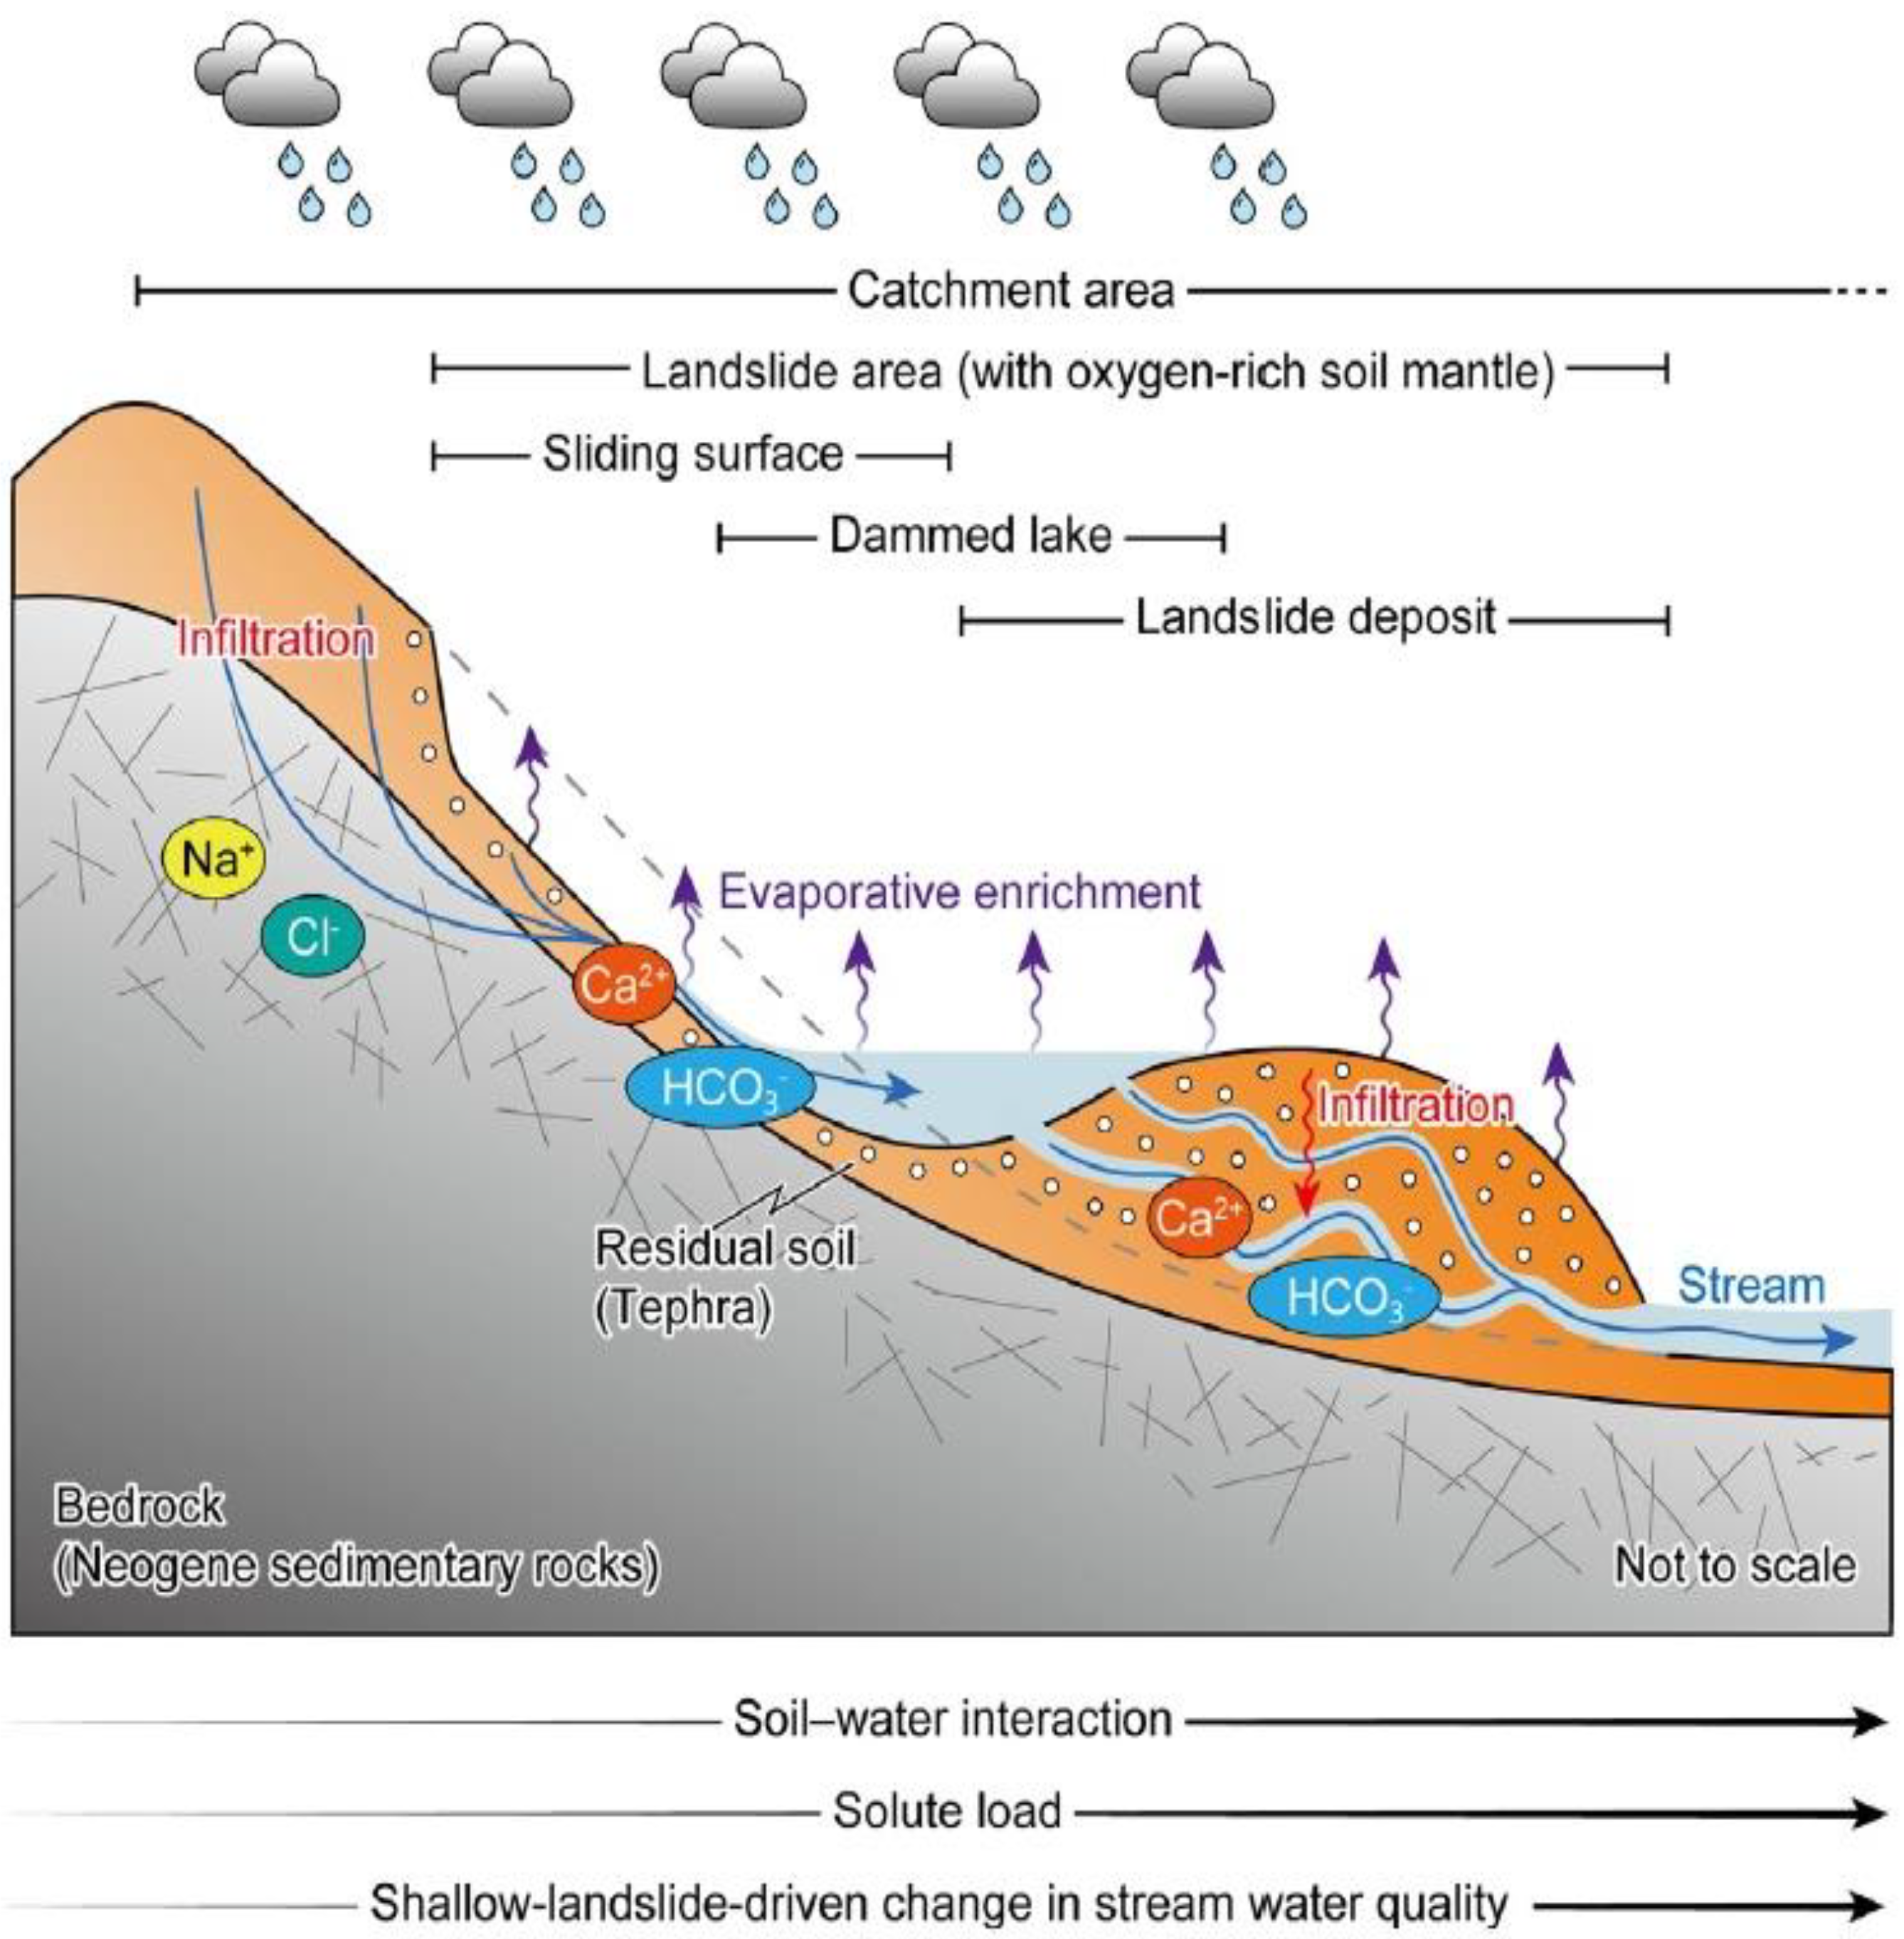
  • There is a need for further study in the Jammu and Kashmir Himalayas and the northeastern zone. The focus has been on states and territories including Uttarakhand, Darjeeling, and parts of Himachal Pradesh. Computational techniques have been shown to be superior to conventional methods in modeling. To understand the region’s heterogeneity and unpredictability, regional- to site-specific analysis using hybrid models and big data analytics can be conducted. Rainfall-induced shallow landslides have hit the Italian and Mediterranean hilly regions of Liguria hard; a semi-quantitative method combining predisposing factors and unstructured data was used for landslide prediction in this area. In China and the USA, river water quality, caused by shallow landslides, can be estimated by the portion of the landslide area at the catchment level, which is more flexible than the local structure of a single landslide and a located near flow.
  • Future research directions that need to be explored are as follows:
    More research is required to establish if areas with high relief and steep terrain, but no recorded landslides, need additional landslide inventory mapping.
    Work should be performed to combine remote sensing data, numerical models, and other landslide-related variables. More detailed remote sensing images should be used for landslide monitoring, risk assessment and hazards assessment.
    A publicly available approach will encourage continuing contributions to enhance landslide characterization and awareness across nations.
    The resultant map of landslide-prone regions has many drawbacks, including a lower degree of precision when compared to a traditional susceptibility map, and insufficient information regarding instability mechanisms which can be improved.
    Natural materials, which make up most slopes, that have inherent variability that is difficult to forecast can be considered for further study.
    The physical models are usually limited to a certain type of landslide and they may not be able to accurately describe local geological, soil, and hydrological characteristics that are difficult to see in the field and parameterize in model theory; this issue needs to be addressed in the future.
    Landslide danger cannot be fully assessed without more information on slope mechanisms, so these require to be studied.
    In order to make landslide inventory layouts for areas where they do not already exist, we suggest testing ways to use the results of susceptibility models made in one area to help people in other areas. This will involve uniformity of the information about landslides and the variables that explain why they happened.
    It is suggested that more time is devoted to developing new and much more reliable ways to measure model quality, which should make models more credible and useful.
    Work is needed to identify test methods and techniques for the best way to combine zones of land that have the potential for various types of landslides.

Author Contributions

Y.Z.: conceptualization, methodology, visualization, data acquisition, writing—original draft; C.Z.: investigation, data acquisition, supervision, writing—review and editing. All authors have read and agreed to the published version of the manuscript.

Funding

This research received no external funding.

Institutional Review Board Statement

Not applicable.

Informed Consent Statement

Not applicable.

Data Availability Statement

All data is available in the paper.

Conflicts of Interest

The authors declare no competing interests.

References

  1. Lucieer, A.; Jong, S.M.D.; Turner, D. Mapping landslide displacements using Structure from Motion (SfM) and image correlation of multi-temporal UAV photography. Prog. Phys. Geogr. 2014, 38, 97–116. [Google Scholar] [CrossRef]
  2. Ali, A.; Huang, J.; Lyamin, A.V.; Sloan, S.W.; Griffiths, D.V.; Cassidy, M.J.; Li, J.H. Simplified quantitative risk assessment of rainfall-induced landslides modelled by infinite slopes. Eng. Geol. 2014, 179, 102–116. [Google Scholar] [CrossRef]
  3. Zhu, A.X.; Miao, Y.; Yang, L.; Bai, S.; Liu, J.; Hong, H. Comparison of the presence-only method and presence-absence method in landslide susceptibility mapping. Catena 2018, 171, 222–233. [Google Scholar] [CrossRef]
  4. Li, T.; He, B.; Chen, Z.; Zhang, Y.; Liang, C.; Wang, R. Effects of gravel on infiltration, runoff, and sediment yield in landslide deposit slope in Wenchuan earthquake area, China. Environ. Sci. Pollut. Res. 2016, 23, 12075–12084. [Google Scholar] [CrossRef]
  5. Petley, D. Global patterns of loss of life from landslides. Geology 2012, 40, 927–930. [Google Scholar] [CrossRef]
  6. Westoby, M.J.; Brasington, J.; Glasser, N.F.; Hambrey, M.J.; Reynolds, J.M. Structure-from-Motion’ photogrammetry: A low-cost, effective tool for geoscience applications. Geomorphology 2012, 179, 300–314. [Google Scholar] [CrossRef] [Green Version]
  7. Shu, H.; Ma, J.; Guo, J.; Qi, S.; Guo, Z.; Zhang, P. Effects of rainfall on surface environment and morphological characteristics in the Loess Plateau. Environ. Sci. Pollut. Res. 2020, 27, 37455–37467. [Google Scholar] [CrossRef]
  8. Chae, B.-G.; Park, H.J.; Catani, F.; Simoni, A.; Berti, M. Landslide prediction, monitoring and early warning: A concise review of state-of-the-art. Geosci. J. 2017, 21, 1033–1070. [Google Scholar] [CrossRef]
  9. Zhang, H.; Huang, C.; Hu, X.; Mei, H.; Hu, R. Evaluating water resource carrying capacity using the deep learning method: A case study of Yunnan, Southwest China. Environ. Sci. Pollut. Res. 2022, 1–15. [Google Scholar] [CrossRef]
  10. Yoshihara, N.; Matsumoto, S.; Umezawa, R.; Machida, I. Catchment-scale impacts of shallow landslides on stream water chemistry. Sci. Total Environ. 2022, 825, 153970. [Google Scholar] [CrossRef]
  11. Geertsema, M.; Highland, L.; Vaugeouis, L. Environmental impact of landslides. In Landslides–Disaster Risk Reduction; Springer: Berlin/Heidelberg, Germany, 2009; pp. 589–607. [Google Scholar]
  12. Galve, J.P.; Cevasco, A.; Brandolini, P.; Soldati, M. Assessment of shallow landslide risk mitigation measures based on land use planning through probabilistic modelling. Landslides 2015, 12, 101–114. [Google Scholar] [CrossRef] [Green Version]
  13. Banerjee, A.; Dimri, A. Comparative analysis of two rainfall retrieval algorithms during extreme rainfall event: A case study on cloudburst, 2010 over Ladakh (Leh), Jammu and Kashmir. Nat. Hazards 2019, 97, 1357–1374. [Google Scholar] [CrossRef]
  14. Kanungo, D.; Arora, M.K.; Sarkar, S.; Gupta, R.P. A comparative study of conventional, ANN black box, fuzzy and combined neural and fuzzy weighting procedures for landslide susceptibility zonation in Darjeeling Himalayas. Eng. Geol. 2006, 85, 347–366. [Google Scholar] [CrossRef]
  15. Kanungo, D.; Sarkar, S.; Sharma, S. Combining neural network with fuzzy, certainty factor and likelihood ratio concepts for spatial prediction of landslides. Nat. Hazards 2011, 59, 1491. [Google Scholar] [CrossRef]
  16. Tofani, V.; Bicocchi, G.; Rossi, G.; Segoni, S.; D’Ambrosio, M.; Casagli, N.; Catani, F. Soil characterization for shallow landslides modeling: A case study in the Northern Apennines (Central Italy). Landslides 2017, 14, 755–770. [Google Scholar] [CrossRef] [Green Version]
  17. Nsengiyumva, J.B.; Nahayo, L.; Huang, X.; Cai, P. Landslide susceptibility assessment using spatial multi-criteria evaluation model in Rwanda. Int. J. Environ. Res. Public Health 2018, 15, 243. [Google Scholar] [CrossRef] [Green Version]
  18. Chen, W.; Pourghasemi, H.R.; Kornejady, A.; Xie, X. GIS-based landslide susceptibility evaluation using certainty factor and index of entropy ensembled with alternating decision tree models. In Natural Hazards GIS-Based Spatial Modeling Using Data Mining Techniques; Springer: Berlin/Heidelberg, Germany, 2019; pp. 225–251. [Google Scholar]
  19. Wu, Y.; Tian, A.; Lan, H. Comparisons of Dynamic Landslide Models on GIS Platforms. Appl. Sci. 2022, 12, 3093. [Google Scholar] [CrossRef]
  20. Tekin, S.; Çan, T. Slide type landslide susceptibility assessment of the Büyük Menderes watershed using artificial neural network method. Environ. Sci. Pollut. Res. 2022, 1–15. [Google Scholar] [CrossRef]
  21. Li, K.; Zhao, X.; Xiao, D. Acid rain: An unsuspected factor predisposing Panzhihua airport landslide, China. Environ. Sci. Pollut. Res. 2021, 28, 36753–36764. [Google Scholar] [CrossRef]
  22. Alvioli, M.; Guzzetti, F.; Rossi, M. Scaling properties of rainfall induced landslides predicted by a physically based model. Geomorphology 2014, 213, 38–47. [Google Scholar] [CrossRef] [Green Version]
  23. Nikolopoulos, E.I.; Crema, S.; Marchi, L.; Marra, F.; Guzzetti, F.; Borga, M. Impact of uncertainty in rainfall estimation on the identification of rainfall thresholds for debris flow occurrence. Geomorphology 2014, 221, 286–297. [Google Scholar] [CrossRef]
  24. Endo, T. Probable Distribution of the Amount of Rainfall Causing Landslides. 1970. Available online: https://agris.fao.org/agris-search/search.do?recordID=US201300555779 (accessed on 29 March 2022).
  25. Guo, X.; Cui, P.; Li, Y.; Zou, Q.; Kong, Y. The formation and development of debris flows in large watersheds after the 2008 Wenchuan Earthquake. Landslides 2016, 13, 25–37. [Google Scholar] [CrossRef]
  26. Jebur, M.; Pradhan, B.; Shafri, H.Z.M.; Yusoff, Z.M.; Tehrany, M.S. An integrated user-friendly ArcMAP tool for bivariate statistical modelling in geoscience applications. Geosci. Model Dev. 2015, 8, 881–891. [Google Scholar] [CrossRef] [Green Version]
  27. Gariano, S.L.; Guzzetti, F. Landslides in a changing climate. Earth-Sci. Rev. 2016, 162, 227–252. [Google Scholar] [CrossRef] [Green Version]
  28. Aleotti, P.; Chowdhury, R. Landslide hazard assessment: Summary review and new perspectives. Bull. Eng. Geol. Environ. 1999, 58, 21–44. [Google Scholar] [CrossRef]
  29. Anagnostopoulos, G.G.; Fatichi, S.; Burlando, P. An advanced process-based distributed model for the investigation of rainfall-induced landslides: The effect of process representation and boundary conditions. Water Resour. Res. 2015, 51, 7501–7523. [Google Scholar] [CrossRef]
  30. Ardizzone, F.; Cardinali, M.; Galli, M.; Guzzetti, F.; Reichenbach, P. Identification and mapping of recent rainfall-induced landslides using elevation data collected by airborne Lidar. Nat. Hazards Earth Syst. Sci. 2007, 7, 637–650. [Google Scholar] [CrossRef] [Green Version]
  31. Cary, M.; Rockwell, T. International collaboration in open access publications: How income shapes international collaboration. Publications 2020, 8, 13. [Google Scholar] [CrossRef] [Green Version]
  32. Park, H.J.; Lee, J.H.; Woo, I. Assessment of rainfall-induced shallow landslide susceptibility using a GIS-based probabilistic approach. Eng. Geol. 2013, 161, 1–15. [Google Scholar] [CrossRef]
  33. Arnone, E.; Noto, L.V.; Lepore, C.; Bras, R.L. Physically-based and distributed approach to analyze rainfall-triggered landslides at watershed scale. Geomorphology 2011, 133, 121–131. [Google Scholar] [CrossRef] [Green Version]
  34. Savage, W.; Godt, J.; Baum, R. Modeling time-dependent areal slope stability. In Landslides-Evaluation and Stabilization, Proceedings of the 9th International Symposium on Landslides, Rio de Janeiro, Brazil, 28 June–2 July 2004; Lacerda, W.A., Erlich, M., Fontoura, S.A.B., Sayao, A.S.F., Eds.; AA Balkema Publishers: London, UK, 2004. [Google Scholar]
  35. Corominas, J.; van Westen, C.; Frattini, P.; Cascini, L.; Malet, J.P.; Fotopoulou, S.; Catani, F.; Van Den Eeckhaut, M.; Mavrouli, O.; Agliardi, F.; et al. Recommendations for the quantitative analysis of landslide risk. Bull. Eng. Geol. Environ. 2014, 73, 209–263. [Google Scholar] [CrossRef]
  36. Mavroulis, S.; Diakakis, M.; Kranis, H.; Vassilakis, E.; Kapetanidis, V.; Spingos, I.; Kaviris, G.; Skourtsos, E.; Voulgaris, N.; Lekkas, E. Inventory of Historical and Recent Earthquake-Triggered Landslides and Assessment of Related Susceptibility by GIS-Based Analytic Hierarchy Process: The Case of Cephalonia (Ionian Islands, Western Greece). Appl. Sci. 2022, 12, 2895. [Google Scholar] [CrossRef]
  37. Davis, J.; Blesius, L. A hybrid physical and maximum-entropy landslide susceptibility model. Entropy 2015, 17, 4271–4292. [Google Scholar] [CrossRef] [Green Version]
  38. Miao, Z.; Peng, R.; Wang, W.; Li, Q.; Chen, S.; Zhang, A.; Pu, M.; Li, K.; Liu, Q.; Hu, C. Integrating Data Modality and Statistical Learning Methods for Earthquake-Induced Landslide Susceptibility Mapping. Appl. Sci. 2022, 12, 1760. [Google Scholar] [CrossRef]
  39. Michel, G.P.; Kobiyama, M.; Goerl, R.F. Comparative analysis of SHALSTAB and SINMAP for landslide susceptibility mapping in the Cunha River basin, southern Brazil. J. Soils Sediments 2014, 14, 1266–1277. [Google Scholar] [CrossRef]
  40. Li, B.; Wang, N.; Chen, J. GIS-based landslide susceptibility mapping using information, frequency ratio, and artificial neural network methods in Qinghai Province, Northwestern China. Adv. Civ. Eng. 2021, 2021, 4758062. [Google Scholar] [CrossRef]
  41. Marin, R.J. Physically based and distributed rainfall intensity and duration thresholds for shallow landslides. Landslides 2020, 17, 2907–2917. [Google Scholar] [CrossRef]
  42. Baum, R.L.; Savage, W.Z.; Godt, J.W. TRIGRS—A Fortran program for transient rainfall infiltration and grid-based regional slope-stability analysis. US Geol. Surv. Open-File Rep. 2002, 424, 38. [Google Scholar]
  43. Deng, Y.-C.; Hwang, J.-H.; Lyu, Y.-D. Developing Real-Time Nowcasting System for Regional Landslide Hazard Assessment under Extreme Rainfall Events. Water 2021, 13, 732. [Google Scholar] [CrossRef]
  44. Li, X.; Lizárraga, J.J.; Buscarnera, G. Regional-scale simulation of flowslide triggering in stratified deposits. Eng. Geol. 2021, 292, 106248. [Google Scholar] [CrossRef]
  45. Liao, Z.; Hong, Y.; Kirschbaum, D.; Adler, R.F.; Gourley, J.J.; Wooten, R. Evaluation of TRIGRS (transient rainfall infiltration and grid-based regional slope-stability analysis)’s predictive skill for hurricane-triggered landslides: A case study in Macon County, North Carolina. Nat. Hazards 2011, 58, 325–339. [Google Scholar] [CrossRef]
  46. Wang, S.; Zhang, K.; van Beek, L.P.; Tian, X.; Bogaard, T.A. Physically-based landslide prediction over a large region: Scaling low-resolution hydrological model results for high-resolution slope stability assessment. Environ. Model. Softw. 2020, 124, 104607. [Google Scholar] [CrossRef]
  47. Liu, C.-N.; Wu, C.-C. Mapping susceptibility of rainfall-triggered shallow landslides using a probabilistic approach. Environ. Geol. 2008, 55, 907–915. [Google Scholar] [CrossRef]
  48. Park, H.J.; Jang, J.Y.; Lee, J.H. Assessment of rainfall-induced landslide susceptibility at the regional scale using a physically based model and fuzzy-based Monte Carlo simulation. Landslides 2019, 16, 695–713. [Google Scholar] [CrossRef]
  49. Castañeda, C.; Dibucho, K.; Arauzo, L.; Raymundo, C. Calculation of the Probability of Landslides Caused by Precipitation Applying the Janbu and MonteCarlo Method in Skarn-Type Mineral Deposits. In Proceedings of the International Conference on Human Interaction and Emerging Technologies, Strasbourg, France, 28–30 April 2021; Springer: Berlin/Heidelberg, Germany, 2021. [Google Scholar]
  50. Miao, F.; Wu, Y.; Xie, Y.; Yu, F.; Peng, L. Research on progressive failure process of Baishuihe landslide based on Monte Carlo model. Stoch. Environ. Res. Risk Assess. 2017, 31, 1683–1696. [Google Scholar] [CrossRef]
  51. Lee, S.; Jang, J.; Kim, Y.; Cho, N.; Lee, M.J. Susceptibility analysis of the Mt. Umyeon landslide area using a physical slope model and probabilistic method. Remote Sens. 2020, 12, 2663. [Google Scholar] [CrossRef]
  52. Liu, X.; Wang, Y. Probabilistic simulation of entire process of rainfall-induced landslides using random finite element and material point methods with hydro-mechanical coupling. Comput. Geotech. 2021, 132, 103989. [Google Scholar] [CrossRef]
  53. Atzeni, C.; Barla, M.; Pieraccini, M.; Antolini, F. Early warning monitoring of natural and engineered slopes with ground-based synthetic-aperture radar. Rock Mech. Rock Eng. 2015, 48, 235–246. [Google Scholar] [CrossRef] [Green Version]
  54. Bardi, F.; Raspini, F.; Ciampalini, A.; Kristensen, L.; Rouyet, L.; Lauknes, T.R.; Frauenfelder, R.; Casagli, N. Space-borne and ground-based InSAR data integration: The Åknes test site. Remote Sens. 2016, 8, 237. [Google Scholar] [CrossRef] [Green Version]
  55. Zhang, S.; Zhao, L.; Delgado-Tellez, R.; Bao, H. A physics-based probabilistic forecasting model for rainfall-induced shallow landslides at regional scale. Nat. Hazards Earth Syst. Sci. 2018, 18, 969–982. [Google Scholar] [CrossRef] [Green Version]
  56. Li, Y.; Huang, J.; Jiang, S.H.; Huang, F.; Chang, Z. A web-based GPS system for displacement monitoring and failure mechanism analysis of reservoir landslide. Sci. Rep. 2017, 7, 17171. [Google Scholar] [CrossRef] [PubMed] [Green Version]
  57. Wasowski, J.; Pisano, L. Long-term InSAR, borehole inclinometer, and rainfall records provide insight into the mechanism and activity patterns of an extremely slow urbanized landslide. Landslides 2020, 17, 445–457. [Google Scholar] [CrossRef]
  58. Zhao, C.; Lu, Z. Remote sensing of landslides—A review. Remote Sens. 2018, 10, 279. [Google Scholar] [CrossRef] [Green Version]
  59. Zhong, C.; Liu, Y.; Gao, P.; Chen, W.; Li, H.; Hou, Y. Landslide mapping with remote sensing: Challenges and opportunities. Int. J. Remote Sens. 2020, 41, 1555–1581. [Google Scholar] [CrossRef]
  60. Shahzad, N.; Ding, X.; Abbas, S. A Comparative Assessment of Machine Learning Models for Landslide Susceptibility Mapping in the Rugged Terrain of Northern Pakistan. Appl. Sci. 2022, 12, 2280. [Google Scholar] [CrossRef]
  61. Donati, D.; Rabus, B.; Engelbrecht, J.; Stead, D.; Clague, J.; Francioni, M. A Robust SAR Speckle Tracking Workflow for Measuring and Interpreting the 3D Surface Displacement of Landslides. Remote Sens. 2021, 13, 3048. [Google Scholar] [CrossRef]
  62. Xu, Q.; Guo, C.; Dong, X.; Li, W.; Lu, H.; Fu, H.; Liu, X. Mapping and Characterizing Displacements of Landslides with InSAR and Airborne LiDAR Technologies: A Case Study of Danba County, Southwest China. Remote Sens. 2021, 13, 4234. [Google Scholar] [CrossRef]
  63. Ghosh, T.K.; Jakobsen, F.; Joshi, M.; Pareta, K. Extreme rainfall and vulnerability assessment: Case study of Uttarakhand rivers. Nat. Hazards 2019, 99, 665–687. [Google Scholar] [CrossRef]
  64. Bopche, L.; Rege, P.P. Feature-based model for landslide prediction using remote sensing and digital elevation data. In Advances in Signal and Data Processing; Springer: Berlin/Heidelberg, Germany, 2021; pp. 299–312. [Google Scholar]
  65. Dikshit, A.; Sarkar, R.; Pradhan, B.; Segoni, S.; Alamri, A.M. Rainfall induced landslide studies in Indian Himalayan region: A critical review. Appl. Sci. 2020, 10, 2466. [Google Scholar] [CrossRef] [Green Version]
  66. Sarkar, S. Landslide risk assessment in parts of the Darjeeling Himalayas, India. In Integrating Disaster Science and Management; Elsevier: Amsterdam, The Netherlands, 2018; pp. 99–108. [Google Scholar]
  67. Saha, A.; Saha, S. Application of statistical probabilistic methods in landslide susceptibility assessment in Kurseong and its surrounding area of Darjeeling Himalayan, India: RS-GIS approach. Environ. Dev. Sustain. 2021, 23, 4453–4483. [Google Scholar] [CrossRef]
  68. Samanta, S.K.; Majumdar, R.K. Identification of landslide-prone slopes at Paglajhora area, Darjeeling Himalaya, India. Landslides 2020, 17, 2643–2657. [Google Scholar] [CrossRef]
  69. Abraham, M.T.; Satyam, N.; Reddy, S.K.P.; Pradhan, B. Runout modeling and calibration of friction parameters of Kurichermala debris flow, India. Landslides 2021, 18, 737–754. [Google Scholar] [CrossRef]
  70. Meena, S.R.; Ghorbanzadeh, O.; van Westen, C.J.; Nachappa, T.G.; Blaschke, T.; Singh, R.P.; Sarkar, R. Rapid mapping of landslides in the western ghats (India) triggered by 2018 extreme monsoon rainfall using a deep learning approach. Landslides 2021, 18, 1937–1950. [Google Scholar] [CrossRef]
  71. Sajinkumar, K.; Anbazhagan, S.; Pradeepkumar, A.P.; Rani, V.R. Weathering and landslide occurrences in parts of Western Ghats, Kerala. J. Geol. Soc. India 2011, 78, 249–257. [Google Scholar] [CrossRef]
  72. Swetha, T.; Gopinath, G. Landslides susceptibility assessment by analytical network process: A case study for Kuttiyadi river basin (Western Ghats, southern India). SN Appl. Sci. 2020, 2, 1776. [Google Scholar] [CrossRef]
  73. Lalitha, M.; Kumar, K.S.; Nair, K.M.; Dharumarajan, S.; Koyal, A.; Khandal, S.; Kaliraj, S.; Hegde, R. Evaluating pedogenesis and soil Atterberg limits for inducing landslides in the Western Ghats, Idukki District of Kerala, South India. Nat. Hazards 2021, 106, 487–507. [Google Scholar] [CrossRef]
  74. Gawali, P.B.; Aher, S.P.; Lakshmi, B.V.; Gaikwad, R.D.; Deendayalan, K.; Hanamgond, P.T.; Mahesh Babu, J.L.V.; Arote, S.A.; Bairage, S.I. Identification of landslide susceptible villages around Kalsubai region, Western Ghats of Maharashtra using geospatial techniques. J. Geol. Soc. India 2017, 90, 301–311. [Google Scholar] [CrossRef]
  75. Sajinkumar, K.; Anbazhagan, S. Geomorphic appraisal of landslides on the windward slope of Western Ghats, southern India. Nat. Hazards 2015, 75, 953–973. [Google Scholar] [CrossRef]
  76. Mondal, S.; Mandal, S. Landslide susceptibility mapping of Darjeeling Himalaya, India using index of entropy (IOE) model. Appl. Geomat. 2019, 11, 129–146. [Google Scholar] [CrossRef]
  77. Chawla, A.; Pasupuleti, S.; Chawla, S.; Rao, A.C.S.; Sarkar, K.; Dwivedi, R. Landslide susceptibility zonation mapping: A case study from Darjeeling District, eastern Himalayas, India. J. Indian Soc. Remote Sens. 2019, 47, 497–511. [Google Scholar] [CrossRef]
  78. Sarkar, S.; Roy, A.K.; Martha, T.R. Landslide susceptibility assessment using information value method in parts of the Darjeeling Himalayas. J. Geol. Soc. India 2013, 82, 351–362. [Google Scholar] [CrossRef]
  79. Dikshit, A.; Satyam, N.; Pradhan, B.; Kushal, S. Estimating rainfall threshold and temporal probability for landslide occurrences in Darjeeling Himalayas. Geosci. J. 2020, 24, 225–233. [Google Scholar] [CrossRef]
  80. Abraham, M.T.; Satyam, N.; Pradhan, B.; Alamri, A.M. IoT-based geotechnical monitoring of unstable slopes for landslide early warning in the Darjeeling Himalayas. Sensors 2020, 20, 2611. [Google Scholar] [CrossRef] [PubMed]
  81. Abraham, M.T.; Satyam, N.; Pradhan, B.; Segoni, S. Developing a prototype landslide early warning system for Darjeeling Himalayas using SIGMA model and real-time field monitoring. Geosci. J. 2022, 26, 289–301. [Google Scholar] [CrossRef]
  82. Mondal, S.; Maiti, R. Integrating the analytical hierarchy process (AHP) and the frequency ratio (FR) model in landslide susceptibility mapping of Shiv-khola watershed, Darjeeling Himalaya. Int. J. Disaster Risk Sci. 2013, 4, 200–212. [Google Scholar] [CrossRef] [Green Version]
  83. Ghosh, S.; van Westen, G.J.; Carranza, E.J.M.; Jetten, V.G. Integrating spatial, temporal, and magnitude probabilities for medium-scale landslide risk analysis in Darjeeling Himalayas, India. Landslides 2012, 9, 371–384. [Google Scholar] [CrossRef]
  84. Abraham, M.T.; Satyam, N.; Pradhan, B.; Alamri, A.M. The selection of rain gauges and rainfall parameters in estimating intensity-duration thresholds for landslide occurrence: Case study from Wayanad (India). Water 2020, 12, 1000. [Google Scholar] [CrossRef] [Green Version]
  85. Pepe, G.; Mandarino, A.; Raso, E.; Cevasco, A.; Firpo, M.; Casagli, N. Extreme flood and landslides triggered in the Arroscia Valley (Liguria Region, Northwestern Italy) during the November 2016 rainfall event. In Proceedings of the IAEG/AEG Annual Meeting Proceedings, San Francisco, CA, USA, 17–21 September 2018; Springer: Berlin/Heidelberg, Germany, 2019; Volume 1. [Google Scholar]
  86. Cevasco, A.; Termini, F.; Valentino, R.; Meisina, C.; Bonì, R.; Bordoni, M.; Chella, G.P.; De Vita, P. Residual mechanisms and kinematics of the relict Lemeglio coastal landslide (Liguria, northwestern Italy). Geomorphology 2018, 320, 64–81. [Google Scholar] [CrossRef]
  87. Cignetti, M.; Godone, D.; Giordan, D. Shallow landslide susceptibility, Rupinaro catchment, Liguria (northwestern Italy). J. Maps 2019, 15, 333–345. [Google Scholar] [CrossRef] [Green Version]
  88. Perrone, A.; Canora, F.; Calamita, G.; Bellanova, J.; Serlenga, V.; Panebianco, S.; Tragni, N.; Piscitelli, S.; Vignola, L.; Doglioni, A.; et al. A multidisciplinary approach for landslide residual risk assessment: The Pomarico landslide (Basilicata Region, Southern Italy) case study. Landslides 2021, 18, 353–365. [Google Scholar] [CrossRef]
  89. Lazzari, M.; Gioia, D.; Anzidei, B. Landslide inventory of the Basilicata region (Southern Italy). J. Maps 2018, 14, 348–356. [Google Scholar] [CrossRef] [Green Version]
  90. Caporossi, P.; Mazzanti, P.; Bozzano, F. Digital image correlation (DIC) analysis of the 3 December 2013 Montescaglioso landslide (Basilicata, southern Italy): Results from a multi-dataset investigation. ISPRS Int. J. Geo-Inf. 2018, 7, 372. [Google Scholar] [CrossRef] [Green Version]
  91. Lazzari, M.; Piccarreta, M. Landslide disasters triggered by extreme rainfall events: The case of Montescaglioso (Basilicata, Southern Italy). Geosciences 2018, 8, 377. [Google Scholar] [CrossRef] [Green Version]
  92. Borrelli, L.; Ciurleo, M.; Gullà, G. Shallow landslide susceptibility assessment in granitic rocks using GIS-based statistical methods: The contribution of the weathering grade map. Landslides 2018, 15, 1127–1142, Erratum in Landslides 2018, 15, 1143–1144. [Google Scholar] [CrossRef]
  93. Guzzetti, F.; Gariano, S.L. Activities of the Research Institute for Geo-Hydrological Protection, of the Italian National Research Council, World Centre of Excellence on landslide risk. Landslides 2019, 16, 1415–1418. [Google Scholar] [CrossRef]
  94. Alvioli, M.; Marchesini, I.; Melelli, L.; Guth, P. Geomorphometry 2020, Conference Proceedings; Cnr Edizioni: Roma, Italy, 2020; ISBN 978-88-8080-282-2. [Google Scholar]
  95. Canale, C.; Barbaro, G.; Foti, G.; Petrucci, O.; Besio, G.; Fiamma, V.; Barillà, G.C.; Puntorieri, P.; Bruzzaniti, L. Floods and sea storms: Analysis of contemporaneity conditions in Calabria, Italy. In Proceedings of the Eighth International Conference on Remote Sensing and Geoinformation of the Environment (RSCy2020), Paphos, Cyprus, 16–18 March 2020; International Society for Optics and Photonics: Bellingham, WA, USA, 2020. [Google Scholar]
  96. Segoni, S.; Rosi, A.; Fanti, R.; Gallucci, A.; Monni, A.; Casagli, N. A regional-scale landslide warning system based on 20 years of operational experience. Water 2018, 10, 1297. [Google Scholar] [CrossRef] [Green Version]
  97. Lainas, S.; Depountis, N.; Sabatakakis, N. Preliminary Forecasting of Rainfall-Induced Shallow Landslides in the Wildfire Burned Areas of Western Greece. Land 2021, 10, 877. [Google Scholar] [CrossRef]
  98. Doglioni, A.; Casagli, N.; Nocentini, M.; Sdao, F.; Simeone, V. The landslide of Pomarico, South Italy, occurred on 29 January 2019. Landslides 2020, 17, 2137–2143. [Google Scholar] [CrossRef]
  99. Capparelli, G.; Tiranti, D. Application of the MoniFLaIR early warning system for rainfall-induced landslides in Piedmont region (Italy). Landslides 2010, 7, 401–410. [Google Scholar] [CrossRef]
  100. Schenato, L.; Palmieri, L.; Camporese, M.; Bersan, S.; Cola, S.; Pasuto, A.; Galtarossa, A.; Salandin, P.; Simonini, P. Distributed optical fibre sensing for early detection of shallow landslides triggering. Sci. Rep. 2017, 7, 14686. [Google Scholar] [CrossRef]
  101. Borga, M.; Dalla Fontana, G.; Da Ros, D.; Marchi, L. Shallow landslide hazard assessment using a physically based model and digital elevation data. Environ. Geol. 1998, 35, 81–88. [Google Scholar] [CrossRef]
  102. Giannecchini, R.; Galanti, Y.; Barsanti, M. Rainfall intensity-duration thresholds for triggering shallow landslides in the Eastern Ligurian Riviera (Italy). In Engineering Geology for Society and Territory—Volume 2; Springer: Berlin/Heidelberg, Germany, 2015; pp. 1581–1584. [Google Scholar]
  103. Ciampittiello, M.; Saidi, H.; Dresti, C.; Coluccino, M.; Turconi, L.; Little, W.W.; Luino, F. Landslides along the Lago Maggiore western coast (northern Italy): Intense rainfall as trigger or concomitant cause? Nat. Hazards 2021, 107, 1225–1250. [Google Scholar] [CrossRef]
  104. Roccati, A.; Faccini, F.; Luino, F.; Ciampalini, A.; Turconi, L. Heavy rainfall triggering shallow landslides: A susceptibility assessment by a GIS-approach in a Ligurian Apennine Catchment (Italy). Water 2019, 11, 605. [Google Scholar] [CrossRef] [Green Version]
  105. Pellicani, R.; Argentiero, I.; Manzari, P.; Spilotro, G.; Marzo, C.; Ermini, R.; Apollonio, C. UAV and airborne LiDAR data for interpreting kinematic evolution of landslide movements: The case study of the Montescaglioso landslide (Southern Italy). Geosciences 2019, 9, 248. [Google Scholar] [CrossRef] [Green Version]
  106. Li, W.; Liu, C.; Scaioni, M.; Sun, W.; Chen, Y.; Yao, D.; Chen, S.; Hong, Y.; Zhang, K.; Cheng, G. Spatio-temporal analysis and simulation on shallow rainfall-induced landslides in China using landslide susceptibility dynamics and rainfall ID thresholds. Sci. China Earth Sci. 2017, 60, 720–732. [Google Scholar] [CrossRef]
  107. Scaioni, M.; Longoni, L.; Melillo, V.; Papini, M. Remote sensing for landslide investigations: An overview of recent achievements and perspectives. Remote Sens. 2014, 6, 9600–9652. [Google Scholar] [CrossRef] [Green Version]
  108. Parvez, I.; Shen, J.; Hassan, I.; Zhang, N. Generation of Hydro Energy by Using Data Mining Algorithm for Cascaded Hydropower Plant. Energies 2021, 14, 298. [Google Scholar] [CrossRef]
  109. Parvez, I.; Shen, J. Algorithms of approximate dynamic programming for hydro scheduling. E3S Web Conf. 2020, 144, 01001. [Google Scholar] [CrossRef] [Green Version]
  110. Parvez, I.; Shen, J.; Khan, M.; Cheng, C. Modeling and solution techniques used for hydro generation scheduling. Water 2019, 11, 1392. [Google Scholar] [CrossRef] [Green Version]
  111. Cheng, G.; Li, X. Integrated research methods in watershed science. Sci. China Earth Sci. 2015, 58, 1159–1168. [Google Scholar] [CrossRef]
  112. Chen, J.; Yang, Z.-F.; Liu, H.-Q. Landslide susceptibility zoning and its probabilistic forecast. Yanshilixue Yu Gongcheng Xuebao/Chin. J. Rock Mech. Eng. 2005, 24, 2392–2396. [Google Scholar]
  113. Tao, J.; Barros, A. Coupled prediction of flood response and debris flow initiation during warm-and cold-season events in the Southern Appalachians, USA. Hydrol. Earth Syst. Sci. 2014, 18, 367–388. [Google Scholar] [CrossRef] [Green Version]
  114. Liu, C.; Wen, M.; Tang, C. Meteorological early warning of geo-hazards in Chinabased on raining forecast. Reg. Geol. China 2004, 4, 303–309. [Google Scholar]
  115. Li, G.; Lei, Y.; Yao, H.; Wu, S.; Ge, J. The influence of land urbanization on landslides: An empirical estimation based on Chinese provincial panel data. Sci. Total Environ. 2017, 595, 681–690. [Google Scholar] [CrossRef] [PubMed]
  116. Lin, Q.; Wang, Y.; Glade, T.; Zhang, J.; Zhang, Y. Assessing the spatiotemporal impact of climate change on event rainfall characteristics influencing landslide occurrences based on multiple GCM projections in China. Clim. Change 2020, 162, 761–779. [Google Scholar] [CrossRef]
  117. Lin, Q.; Wang, Y. Spatial and temporal analysis of a fatal landslide inventory in China from 1950 to 2016. Landslides 2018, 15, 2357–2372. [Google Scholar] [CrossRef]
  118. Shen, Y.; Pan, Y.; Yu, J.J.; Zhao, P.; Zhou, Z.J. Quality assessment of hourly merged precipitation product over China. Trans. Atmos. Sci. 2013, 36, 37–46. [Google Scholar]
  119. Liu, C.; Shige, S.; Takayabu, Y.N.; Zipser, E. Latent heating contribution from precipitation systems with different sizes, depths, and intensities in the tropics. J. Clim. 2015, 28, 186–203. [Google Scholar] [CrossRef] [Green Version]
  120. Catani, F.; Lagomarsino, D.; Segoni, S.; Tofani, V. Landslide susceptibility estimation by random forests technique: Sensitivity and scaling issues. Nat. Hazards Earth Syst. Sci. 2013, 13, 2815–2831. [Google Scholar] [CrossRef] [Green Version]
  121. Chen, W.; Panahi, M.; Pourghasemi, H.R. Performance evaluation of GIS-based new ensemble data mining techniques of adaptive neuro-fuzzy inference system (ANFIS) with genetic algorithm (GA), differential evolution (DE), and particle swarm optimization (PSO) for landslide spatial modelling. Catena 2017, 157, 310–324. [Google Scholar] [CrossRef]
  122. Froude, M.J.; Petley, D.N. Global fatal landslide occurrence from 2004 to 2016. Nat. Hazards Earth Syst. Sci. 2018, 18, 2161–2181. [Google Scholar] [CrossRef] [Green Version]
  123. Hong, H.; Miao, Y.; Liu, J.; Zhu, A.X. Exploring the effects of the design and quantity of absence data on the performance of random forest-based landslide susceptibility mapping. Catena 2019, 176, 45–64. [Google Scholar] [CrossRef]
  124. Hong, H.; Liu, J.; Zhu, A.-X. Modeling landslide susceptibility using LogitBoost alternating decision trees and forest by penalizing attributes with the bagging ensemble. Sci. Total Environ. 2020, 718, 137231. [Google Scholar] [CrossRef] [PubMed]
  125. Sun, X.; Chen, J.; Han, X.; Bao, Y.; Zhou, X.; Peng, W. Landslide susceptibility mapping along the upper Jinsha River, south-western China: A comparison of hydrological and curvature watershed methods for slope unit classification. Bull. Eng. Geol. Environ. 2020, 79, 4657–4670. [Google Scholar] [CrossRef]
  126. Lin, Q.; Lima, P.; Steger, S.; Glade, T.; Jiang, T.; Zhang, J.; Liu, T.; Wang, Y. National-scale data-driven rainfall induced landslide susceptibility mapping for China by accounting for incomplete landslide data. Geosci. Front. 2021, 12, 101248. [Google Scholar] [CrossRef]
  127. Du, J.; Glade, T.; Woldai, T.; Chai, B.; Zeng, B. Landslide susceptibility assessment based on an incomplete landslide inventory in the Jilong Valley, Tibet, Chinese Himalayas. Eng. Geol. 2020, 270, 105572. [Google Scholar] [CrossRef]
  128. Wen, Y.; Gao, P.; Mu, X.; Li, M.; Su, Y.; Wang, H. Experimental Study on Landslides in Terraced Fields in the Chinese Loessial Region under Extreme Rainfall. Water 2021, 13, 270. [Google Scholar] [CrossRef]
  129. Mazzanti, P.; Caporossi, P.; Muzi, R. Sliding time master digital image correlation analyses of cubesat images for landslide monitoring: The Rattlesnake Hills landslide (USA). Remote Sens. 2020, 12, 592. [Google Scholar] [CrossRef] [Green Version]
  130. Hu, X.; Bürgmann, R.; Lu, Z.; Handwerger, A.L.; Wang, T.; Miao, R. Mobility, thickness, and hydraulic diffusivity of the slow-moving Monroe landslide in California revealed by L-band satellite radar interferometry. J. Geophys. Res. Solid Earth 2019, 124, 7504–7518. [Google Scholar] [CrossRef] [Green Version]
  131. de Oliveira-Folharini, S.; de-Oliveira, R.C.; Brown, J.C. Estimate of housing and population in landslide risk areas in California (USA) and coastal São Paulo (Brazil). Rev. Geográfica América Cent. 2018, 3, 319–337. [Google Scholar] [CrossRef] [Green Version]
  132. Chapella, H.; Haneberg, W.; Crawford, M.; Shakoor, A. Landslide inventory and susceptibility models, Prestonsburg 7.5-min quadrangle, Kentucky, USA. In Proceedings of the IAEG/AEG Annual Meeting Proceedings, San Francisco, CA, USA, 17–21 September 2018; Springer: Berlin/Heidelberg, Germany, 2019; Volume 1. [Google Scholar]
  133. Mirus, B.B.; Jones, E.S.; Baum, R.L.; Godt, J.W.; Slaughter, S.; Crawford, M.M.; Lancaster, J.; Stanley, T.; Kirschbaum, D.B. Landslides across the USA: Occurrence, susceptibility, and data limitations. Landslides 2020, 17, 2271–2285. [Google Scholar] [CrossRef]
  134. Allstadt, K.E.; Thompson, E.M.; Hearne, M.; Jessee, M.N.; Zhu, J.; Wald, D.J.; Tanyas, H. Integrating landslide and liquefaction hazard and loss estimates with existing USGS real-time earthquake information products. In Proceedings of the 16th World Conference on Earthquake Engineering, Santiago, Chile, 9–13 January 2017. [Google Scholar]
  135. Handwerger, A.L.; Booth, A.M.; Huang, M.H.; Fielding, E.J. Inferring the Subsurface Geometry and Strength of Slow-Moving Landslides Using 3-D Velocity Measurements From the NASA/JPL UAVSAR. J. Geophys. Res. Earth Surf. 2021, 126, e2020JF005898. [Google Scholar] [CrossRef]
Figure 1. Steps of landslide scientometric analysis; CSV: comma separated values.
Applsci 12 04333 g001
Figure 2. Subject areas which contribute to rainfall-induced landslide analysis.
Applsci 12 04333 g002
Figure 3. Annual number of articles on landslide analysis.
Applsci 12 04333 g003
Figure 4. Keyword mapping for landslide analysis.
Applsci 12 04333 g004
Figure 5. Density visualization of co-occurrence.
Applsci 12 04333 g005
Figure 6. Representation of co-authorship for rainfall-induced landslide analysis.
Applsci 12 04333 g006
Figure 7. Density representation of co-authorship for rainfall-induced landslide analysis.
Applsci 12 04333 g007
Figure 8. Representation of countries for rainfall-induced landslides.
Applsci 12 04333 g008
Figure 9. Density representation of countries for rainfall-induced landslide analysis.
Applsci 12 04333 g009
Figure 10. Co-authorship mapping for international collaboration.
Applsci 12 04333 g010
Figure 11. SINMAP combined with Entropy (MaxEnt) [37].
Applsci 12 04333 g011
Figure 12. DEM is used to observe the landslides [40].
Applsci 12 04333 g012
Figure 13. TRIGRS model used for rainfall-induced landslide analysis [43].
Applsci 12 04333 g013
Figure 14. Monte Carlo simulation used for landslide analysis [51].
Applsci 12 04333 g014
Figure 15. Mapping and characterization of LiDAR [62].
Applsci 12 04333 g015
Figure 16. Images from the 2018 monsoon landslides in Wayanad district [84].
Applsci 12 04333 g016
Figure 17. (A) Roto-translational slide; (B) Rotational slide cutting road downhill; (C) Landslide on terrace slides; (D) Uphill road cutting; (E) rockfall; (F,H) soil slip; (G) fast flow of earth [104].
Applsci 12 04333 g017
Figure 18. Damage caused by landslide [105].
Applsci 12 04333 g018
Figure 19. Shallow landslides in Yan’an China, July 2013 [128].
Applsci 12 04333 g019
Figure 20. Rainfall-induced landslide in San Pedro Creek watershed [37].
Applsci 12 04333 g020
Figure 21. Impact of rainfall−induced landslide on quality of water [10].
Applsci 12 04333 g021
Table 1. The twenty most often used terms for landslides.
KeywordOccurrencesTotal Link Strength
Landslides10782258
Rainfall6821311
Slope stability3441264
Soils320979
China211649
Infiltration190630
Slope failure203631
Slope protection176586
Debris flow195496
Precipitation intensity167450
Shallow landslide174435
Groundwater154412
Numerical model135403
Debris145398
Pore pressure116396
Italy127380
Hazards119369
Hazard assessment123363
Rainfall infiltration110338
Safety factor99330
Table 2. Authors in the top twenty.
AuthorDocumentsCitationsTotal Link Strength
Guzzetti F.361652231
Sassa K.25102694
Rahardjo H.9101923
Godt J.W.1796198
Pradhan B.18881166
Baum R.L19852113
Tien Bui D.1084514
Wang G.1782175
Peruccacci S.23821297
Brunetti M.T.22795294
Lee C.F.1078116
Melillo M.1674986
Rossi M.1773761
Leong E.C.569715
Cardinali M.867034
Gariano S.L17665263
Xu Q.24646134
Zhang L.M.1462574
Table 3. Most popular countries working on rainfall-induced landslides.
CountryDocumentsCitationsTotal Link Strength
China4717384750
Italy3207777696
Japan2064356359
Taiwan1843325250
United States1563932330
India911323238
South Korea711165183
United Kingdom691971152
Hong Kong642105134
Switzerland4887074
Malaysia46130196
Australia42565194
Netherlands3981198
Publisher’s Note: MDPI stays neutral with regard to jurisdictional claims in published maps and institutional affiliations.

