Article

Use of Fe (II) and H2O2 along with Heating for the Estimation of the Browning Susceptibility of White Wine

by
Sofia Voltea
1,
Ioannis K. Karabagias
2 and
Ioannis G. Roussis
1,*
1
Laboratory of Food Chemistry, Department of Chemistry, University of Ioannina, 45110 Ioannina, Greece
2
Department of Food Science & Technology, School of Agricultural Sciences, University of Patras, Charilaou Trikoupi 2, 30100 Agrinio, Greece
*
Author to whom correspondence should be addressed.
Appl. Sci. 2022, 12(9), 4422; https://doi.org/10.3390/app12094422
Submission received: 12 February 2022 / Revised: 20 April 2022 / Accepted: 26 April 2022 / Published: 27 April 2022
(This article belongs to the Section Food Science and Technology)

Abstract

:

Featured Application

The potential use of Fe (II) and H2O2 (Fenton reaction) along with heating for the evaluation of the browning susceptibility of white wine was investigated. The results showed that by using the Fenton reaction along with heating, an easy, rapid and reliable test to evaluate the browning susceptibility of white wine can be developed. The hypothesis driven in the present study might be of interest for the winemakers and the wine industry in terms of testing the quality of white wine during winemaking, at bottling and during wine storage.

Abstract

The aim of the present study was to investigate if the use of Fe (II) and H2O2 (Fenton reaction) along with heating can be implicated for the rapid evaluation of the browning susceptibility of white wine. In this context, increasing concentrations of Fe (II) and H2O2 were added to two white wines (Roditis–Malagouzia and Debina), the samples were stored at 45 °C or 18 °C, and the absorbance at 420 nm (browning index) was measured. Moreover, total sulfur dioxide, total phenolics, flavanols, hydroxycinnamates and total free sulfhydryls were assessed during storage of Roditis–Malagouzia wine samples. The results showed that the addition of Fe (II) + H2O2 mixture in white wines increases rapidly the browning index at 45 °C, indicating the ability to develop a rapid test for the estimation of the browning susceptibility of white wines. Results also showed that the level of flavanols is a suitable index to follow the forced oxidative browning of white wine by adding Fe II + H2O2 at 45 °C. Moreover, results indicated that the levels of total free sulfhydryls may be a suitable index to follow the forced oxidative browning of white wine and in general, white wine oxidation.

1. Introduction

Oxidation of white and red wines is a well-known problem in winemaking, particularly the oxidative spoilage of young wines. Oxygen ingress changes the chemical profile of wines, consequently altering their sensory attributes. Oxidation leads to a loss of the characteristic aromas of wines, the formation of new aromas characteristic of older wines or atypical aromas associated with wine spoilage, and to oxidative browning [1,2,3,4]. According to recent studies, the cascade of chemical reactions constituting wine oxidation begins with the reduction of oxygen coupled to the oxidation of phenols through the redox cycling of iron between Fe (II) and Fe (III). The oxidation of wine phenolic compounds into quinones is coupled to the reduction of oxygen into hydrogen peroxide. Hydrogen peroxide in the presence of Fe II is converted to hydroxyl radicals by the so-called Fenton reaction. Hydroxyl radicals are highly unstable species that react immediately with any substances present in solution in proportion to their concentrations. Hydroxyl radicals are a very strong and non-selective oxidant and are considered to oxidize almost all wine components [5,6,7,8,9,10]. Quinones are unstable and may undergo further reactions. These reactions may cause pigment formation, for instance, condensation reactions that form colored products with high molecular weight. As electrophiles, quinones can spontaneously react directly with nucleophilic compounds, including some phenolics, sulfhydryl compounds and amines. In the process, dimers or polymers are produced, which can form new diphenols. The regenerated o-diphenols will be oxidized renewably, ultimately accelerating the polymerization reaction of phenols [1,5,8,9,10,11,12].
Several antioxidants play significant roles during wine storage and oxidation. SO2 protects wine from the above-mentioned cascade of oxidation reactions essentially by competing against Fe (II) for H2O2. Moreover, it possibly reduces quinones back to their phenolic form [5,10,13,14,15]. Sulphur dioxide gives limited or higher protection to aroma volatiles during wine storage [16,17]. Natural wine antioxidants, such as phenolic acids and glutathione, protect several wine aroma volatiles after bottling [18]. Thiols protect several wine aroma volatiles due to their free –SH [19]. Sulfur dioxide, phenolics and glutathione have significant effect in the browning of white wine. Sulfur dioxide levels in white wine are critical regarding browning onset [2,20]. Among phenolic compounds, flavan-3-ols are the compounds most directly related to the browning process in most of the white wines, while cinnamates are also involved in the browning reactions, and in some wines, browning depends on the cinnamates more than on the flavan-3-ols [2,21]. Glutathione seems to have positive effect on the browning of white wine [22].
Since oxidative browning is the most common color defect in white wines and results in serious economic losses, the determination of the susceptibility of white wines to browning is of considerable industrial interest.
The accelerated methods used to determine the susceptibility of wines to browning are based on heating the wine to different temperatures, such as 55 °C, for different periods of time, such as 5 days, together with submitting them to aeration or to oxygenation [23,24]. Moreover, a linear regression has been found between the browning capacity of wines oxidized at room temperature (20 °C) and that of wines oxidized at 55 °C regarding phenolic composition and other wine parameters such as sulfur dioxide, indicating that the difference between the oxidations is the amount of time in which wine browning took place [2]. Some other methodologies have also been proposed such as the use of H2O2 along with heating at 60 °C [25,26], and the use of electrochemical oxidation of the polyphenolic components in the wine [27]. In all the above tests, the absorbance at 420 nm is used as the index of wine browning.
The aim of the present study was to use Fe (II) + H2O2 (Fenton reaction) at increasing concentrations along with heating at 45 °C to evaluate the browning susceptibility of white wine.

2. Materials and Methods

2.1. Wine Samples

The wine samples used in the study were the following: (i) Roditis–Malagouzia white wine. Alcohol: 12.8% vol., total acidity: 5.4 g/L as tartaric acid, volatile acidity: 0.37 g/L as acetic acid. (ii) Debina white wine. Alcohol: 12.1% vol., total acidity 6.8 g/L as tartaric acid, volatile acidity: 0.3 g/L as acetic acid.

2.2. Chemicals and Reagents

Folin–Ciocalteu reagent, caffeic acid, quercetin, gallic acid, glutathione and catechin were purchased from Sigma Chemicals (St. Louis, MO, USA). DTNB (5,5’-Dithiobis-(2-Nitrobenzoic acid) was purchased from Sigma-Aldrich (Steinheim, Germany). Ethanol of purity ≥99.8%, potassium bicarbonate and starch were purchased from Riedel-de-Haen (Seelze, Germany). DMACA (p-dimethyl-amino-cinnamaldehyde) was purchased from Aldrich Chemical (Milwaukee, WI, USA). FeCl2 × 4H2O, H2O2 30%, sodium carbonate, hydrochloric acid 37% and the iodine ampoule were purchased from Merck (Darmstadt, Germany). Methanol of purity ≥ 99.8% was purchased from LAB-SCAN (Dublin, Ireland). Sulfuric acid of purity ≥ 96% was purchased from FERAK (Berlin, Germany). Potassium hydroxide and sodium hydroxide were purchased from Mallinckrodt Chemical Works (St. Louis, MO, USA).

2.3. Equipment

All absorbance measurements were made on a three-decimal precision spectrophotometer, Jenway 6505 UV/VIS (Stone, Staffordshire, UK)—using either glass or quartz cells of 1 cm and 0.1 cm, respectively. The Perkin Elmer Lambda 35 UV/Vis double channel spectrophotometer (Waltham, MA, USA) was used for taking the visible (VIS) and ultraviolet (UV) spectra using quartz cells of 1 cm. Before measurements, the spectrophotometer was calibrated according to the manufacturer’s instructions. The pH measurements were obtained using a Consort C831 pH-meter (Turnhout, Belgium), with a precision of two decimal points. The weight of materials was measured using an electronic balance, Kern 770 (Balingen, Germany), with a precision of four decimal points.

2.4. Experimental Procedure

The wine samples studied (Roditis–Malagouzia and Debina) at 18 °C were the control, a sample with a final concentration of FeCl2 × 4H2O of 0.025 mM and H2O2 of 0.1575 mM, as well as a sample with a final concentration of FeCl2 × 4H2O of 0.10 mM and H2O2 of 0.63 mM. All these samples were kept at 18 °C. The analyses of wine samples were performed at 0, 28, 56, and 84 days for the Roditis–Malagouzia and at 0, 22, 44, 66 days for Debina wines. For the control sample, 740 mL of wine from a 750 mL wine bottle was transferred into a 1000 mL volumetric cylinder. For the sample with a final concentration of FeCl2 × 4H2O of 0.025 mM and H2O2 of 0.1575 mM, as well as for the sample with a final concentration of FeCl2 × 4H2O of 0.10 mM and H2O2 of 0.63 mM, the procedure was as follows: Into a volumetric cylinder of 1000 mL, 740 mL of wine was transferred. Then, 3.7 mL of wine was removed using a 5 mL pipette, and 0.0037 g of FeCl2 × 4H2O was added for the first and 0.0148 g of FeCl2 × 4H2O for the second sample. This was followed by the addition of 3.7 mL of a 5 mL solution of wine + 16.5μL H2O2 (CH2O2 = 9.79 mol/L) for the first sample and 5 mL of wine + 66 μL H2O2 (CH2O2 = 9.79 mol/L) for the second sample. The solution was stirred with a glass rod. All three samples were analyzed on day 0.
Moreover, each wine sample was put in glass bottle of 250 mL capacity by adding 200 mL each. The bottles were closed with a metal cap and kept/placed in a chamber at 18 °C. The wine samples studied (Roditis–Malagouzia and Debina) at 45 °C were treated in a similar manner. The samples were the control, a sample with a final concentration of FeCl2 × 4H2O of 0.10 mM and H2O2 of 0.63 mM, as well as a sample with a final concentration of FeCl2 × 4H2O of 0.25 mM and H2O2 of 1.575 mM. All these samples were put in the same bottles as above, and the bottles were kept at 45 °C. The sampling for the analysis of wine samples was also performed at 0, 1, 2, and 3 days for the Roditis–Malagouzia and Debina wines, respectively.

2.5. Methods of Analysis

2.5.1. Determination of Browning Index

The determination of the browning index was done by measuring the absorbance at 420 nm (A420 nm) [2]. The sample of wine (2.5 mL) was placed in a 1 cm glass cuvette. The absorbance was measured at 420 nm. The calibration of the instrument was done with deionized water.

2.5.2. Determination of Sulfur Dioxide

The determination of free and total sulfur dioxide was done according to the methods of the International Organization of Vine and Wine [28].

2.5.3. Visible and Ultraviolet Spectra

A sample of 2.5 mL of wine was placed in a quartz cuvette of 1 cm. The spectra were taken in the visible region (380–750 nm). The calibration of the instrument was done with a model wine. The model medium used consisted of 12% vol ethanol and 5 g/L tartaric acid in water, with the pH adjusted to 3.5 using 1N NaOH [17,29]. To obtain the spectra in the ultraviolet radiation range (250–380 nm), a sample of 2.5 mL of wine, diluted 1 to 10 with model wine, was placed in a quartz cuvette of 1 cm. The calibration of the instrument was done with model wine.

2.5.4. Determination of Hydroxycinnamic Acids

The hydroxycinnamic acids content was calculated by measuring the absorbance at 320 nm [30]. A 2.5 mL sample of wine was diluted, 1 to 10 with model wine, and placed in a 1 cm quartz cuvette. The absorbance was measured at 320 nm. The calibration of the instrument was done with model wine. The hydroxycinnamic acid content was calculated from a standard calibration curve, constructed using known concentrations of caffeic acid in model wine (0, 0.5, 1, 2, 4, 6, 8, 10 mg/L) measured at 320 nm. Results were expressed as mg/L of caffeic acid equivalents ((Content (mg/L) = 10.9 × Absorbance, R2 = 0.9993).

2.5.5. Determination of Flavanols

Total flavanols content was calculated using the p-dimethylaminoquinamaldehyde (DMACA) method [30]. A 0.2 mL sample of wine, diluted with methanol (MeOH) (1:2), was placed in an Eppendorf tube, and 1 mL of DMACA solution [0.1% w/v in 1 N hydrochloric acid (HCl) in MeOH] was added. The solution was stirred in a vortex apparatus and allowed to react at room temperature for 10 min. The absorbance was measured at 640 nm. For each sample, there was a blank that was prepared similarly, using a solution of 1 N HCl in MeOH instead of the DMACA solution. The instrument was calibrated for each sample with the corresponding blank. The absorbance was measured at 640 nm. The content of total flavanols was calculated from a standard calibration curve, constructed using known concentrations of catechin in methanol (0, 4, 8, 12, 16, 24 mg/L) measured also at 640 nm. Results were expressed as mg/L of catechin equivalents [Content (mg/L) = 65.4 × Absorbance, R2 = 0.9978].

2.5.6. Determination of Total Phenolic Content

Total phenolic content was determined using the Folin–Ciocalteu method [30]. For the determination, 3.950 μL of deionized water, 50 μL of wine sample and 250 μL of Folin–Ciocalteu reagent were added to a test tube. After 1 min, 750 μL of 20% sodium carbonate (Na2CO3) solution was added, followed by stirring. The obtained mixture was left for 2 h at room temperature in a dark place and the absorbance was measured at 750 nm with glass cuvettes of 1 cm. To calibrate the instrument, instead of the sample, 50 μL of 10% ethanol (EtOH)/model wine was added to the mixture. To determine the concentration of the sample, a standard calibration curve with a solution of gallic acid (0, 50, 100, 250, 500 mg/L) was prepared. Results were expressed as mg/L of gallic acid equivalents [Content (mg/L) = 909.1 × Absorbance, R2 = 0.9995].

2.5.7. Determination of Total Free Sulfhydryls

The content in sulfhydryl groups (SH) was determined using the Ellman’s reagent [31]. Approximately 0.8 mL of phosphate buffer (K2HPO4/KH2PO4) (200 mM, pH 7.4) was added to 0.3 mL of wine (wine diluted 1:10 with model wine) and stirred. Then, 0.1 mL of the 5,5’-dithiobis (2-nitrobenzoic acid) (DTN) solution (1 mM in 200 mM phosphate solution, pH 7.4) was added, and the obtained solution was stirred for 1 h at 20 °C. For each wine sample, the absorbance at 412 nm was measured which was relative to a blank prepared in the same manner and containing 0.1 mL of phosphate buffer instead of DTN solution. The instrument was calibrated with deionized water. The concentration of –SH groups was expressed as glutathione (mg/L) and was determined by constructing a standard calibration curve using different concentrations of glutathione (0, 10, 20, 40, 80, 120 mg/L, in model wine). Results were expressed as mg/L of glutathione equivalents [Content (mg/L) = 137.0 × Absorbance, R2 = 0.9998].

2.6. Statistical Analysis

Each experiment was performed in triplicate. Statistical analysis was done using the SPSS program (SPSS v.17.0, IBM, Armonk, NY, USA). Results were expressed as mean ± standard deviation values. The comparison of the values of each wine sample data at 18 °C or 45 °C, at different test times and at the same test time, was done by one-way analysis of variance (ANOVA) and using the Bonferroni’s post hoc test. The differences with p ≤ 0.05 were considered statistically significant. In addition, the linear correlation of the values of each wine sample data at 18 °C and 45 °C was done using Pearson’s correlation coefficient (r), at the significance level of 0.05 and 0.01. More specifically, Pearson’s correlation coefficient is used to test whether there is or not a linear correlation between two quantitative variables.
The Pearson correlation coefficient is a numerator or indicator of the magnitude of the correlation between two sets of values. It ranges from between +1.00 and −1.00. The negative correlation shows that low values of the same variable correspond to large values of the other and vice versa. The positive correlation shows that low values of the same variable correspond to low values of the other and vice versa. That is, the ratio of the rates indicates the type of correlation, while the higher their absolute value, the stronger is the correlation of the two variables. Finally, the value zero corresponds to the non-existence of a graphical relation. For statistically significant correlations, the significance level p must be ≤0.05 or ≤0.01.

3. Results and Discussion

3.1. Effect of Fe (II) + H2O2 on the Browning Index of Roditis–Malagouzia and Debina White Wines during Storage at 18 °C or 45 °C

The oxidative browning of white wines was followed by measuring the absorbance at 420 nm, which is the browning index. During storage of both white wines at 18 °C, the browning index was increased by the time (Figure 1a,b; Tables S1 and S2). It is well known that the absorbance at 420 nm increases during wine storage [2,32]. At 18 °C, the addition of Fe (II) + H2O2 mixture increased the browning index during storage in a dose-dependent manner (Figure 1a,b; Tables S1 and S2). These results indicate the oxidative function of the mixture Fe (II) + H2O2, while the formation of hydroxyl radicals by the Fenton reaction during wine oxidation is well known [5,8,9,10,11]. Increase of the browning index by adding Fe (II) + H2O2 in white wine during storage has been reported previously [32].
For the Roditis–Malagouzia wine, there was a statistically significant positive correlation between the absorbance values at 420 nm in the control samples and those to which the lower and higher concentrations of Fe (II) + H2O2 were added (r = 0.959, p = 0.040, and r = 0.951, p = 0.049, respectively). Similarly, there was a statistically significant positive correlation between the absorbance values at 420 nm in the control samples of Debina wine and those to which the higher concentration of Fe (II) + H2O2 was added (r = 0.967, p = 0.033). On the other hand, there was no statistically significant correlation between the absorbance values at 420 nm in the control samples of Debina wine and to those which the lower concentration of Fe (II) + H2O2 mixture was added (r = 0.894, p = 0.106).
During storage of both white wines at 45 °C, the browning index was increased by the time (Figure 2a,b; Tables S1 and S2). It is well known that the absorbance at 420 nm increases during wine storage at higher temperatures such as 45–55 °C [2,33]. There was a statistically significant positive correlation between the absorbance values at 420 nm at 45 °C and at 18 °C in the control wine samples of Roditis–Malagouzia (r = 0.956, p = 0.044). Similarly, there was a statistically significant positive correlation between the absorbance values at 420 nm at 45 °C and at 18 °C in control wine samples of Debina (r = 0.972, p = 0.028). These results are in agreement with those of a previous study, in which it was reported that the only difference between the oxidative capacity of white wines stored at 20 °C or 55 °C is the time the oxidation take place [2].
At 45 °C, the addition of Fe (II) + H2O2 mixture increased the browning index of both wines during storage in a dose-dependent manner (Figure 2a,b; Tables S1 and S2). These results indicate the cumulative oxidative result of the mixture Fe (II) + H2O2 and the higher temperature of 45 °C. There was a statistically significant positive correlation between the absorbance values at 420 nm in the control samples of Roditis–Malagouzia wine and those to which the lower and higher concentrations of Fe (II) + H2O2 mixture were added. The correlation coefficient for the first case was r = 0.950 (p = 0.05) and for the second r = 0.966 (p = 0.034). Similarly, there was a statistically significant positive correlation between the absorbance values at 420 nm in Debina wine samples and those to which the lower and higher concentration of Fe (II) + H2O2 mixture were added. The correlation coefficient for the first case was r = 0.998 (p = 0.002) and for the second r = 0.962 (p = 0.038).
Finally, in both wines studied at 18 and 45 °C, the effect of Fe (II) + H2O2 is additionally shown in the visible spectra (Figures S1–S4). An increase in the absorbance values of the treated samples compared to the control was monitored. This increase in the region of 420–440 nm indicated an increase of both yellow and brown colors, since the absorbance at 420 nm is an index of yellow color and at 440 nm, of brown color [34].

3.2. Effect of Fe (II) + H2O2 on the Levels of Antioxidants of Roditis–Malagouzia White Wine during Storage at 18 °C or 45 °C

To evaluate the effect of Fe (II) + H2O2 on the levels of the main antioxidants of a white wine, the levels of total sulfur dioxide, total phenolics, flavanols, hydroxycinnamates and total free sulfhydryls were assessed during storage of Roditis–Malagouzia wine samples.

3.2.1. Total Sulphur Dioxide

At 18 or 45 °C, control wine samples exhibited a sharp decrease in the content of total sulfur dioxide with respect to storage time (Tables S3 and S4). It is expected, since sulfur dioxide, the main additive antioxidant in wine, reacts at the first stage of oxidation with hydrogen peroxide and quinones [5,10,13,15]. It should be noted that there was no statistically significant correlation between the content of total sulfur dioxide at 45 °C and the content of total sulfur dioxide at 18 °C in the control wine samples (r = 0.913, p = 0.087).
At 18 °C, the higher the concentration of Fe (II) + H2O2 added, the greater the decrease in the content of total sulfur dioxide (Tables S3 and S4). At this temperature, there was a statistically significant positive correlation between the content of total sulfur dioxide in the control samples and those to which the low concentration of Fe (II) + H2O2 was added. The correlation coefficient was r = 1.000 (p < 0.001).
On the other hand, there was no statistically significant positive correlation between the content of total sulfur dioxide in the control samples and with those to which the high concentration of Fe (II) + H2O2 mixture was added. This can be attributed to the strong oxidative action of Fe II + H2O2 mixture at both concentrations used. At 45 °C, the addition of Fe (II) + H2O2 mixture accelerated the decrease of total sulfur dioxide content in wine samples with respect to storage time. The higher the concentration of Fe (II) + H2O2 mixture added, the greater the decrease in total sulfur dioxide content (Tables S3 and S4).
There was a statistically significant positive correlation between the content of total sulfur dioxide in the control samples and with those to which the high concentration of Fe (II) + H2O2 mixture was added. The correlation coefficient was r = 0.963 (p = 0.037). On the other hand, there was no statistically significant correlation between the content of total sulfur dioxide in the control wine samples and those to which the low concentration of Fe (II) + H2O2 mixture was added. It may be said that total sulfur dioxide is not a suitable index to follow the forced oxidative browning of white wine by adding Fe II + H2O2 at 18 or 45 °C.
It has been reported that total sulfur dioxide is inversely related to browning as indicated by a negative regression slope [2]. In another study, it was reported that the relative molar amounts of sulfur dioxide considered might be critical with regard to browning onset [20]. However, it has been also reported that increasing SO2 concentration does not result in increased protection with regard to browning and that increased amounts of SO2 might under certain circumstances be detrimental, by promoting higher browning values [20,35].

3.2.2. Total Phenolics
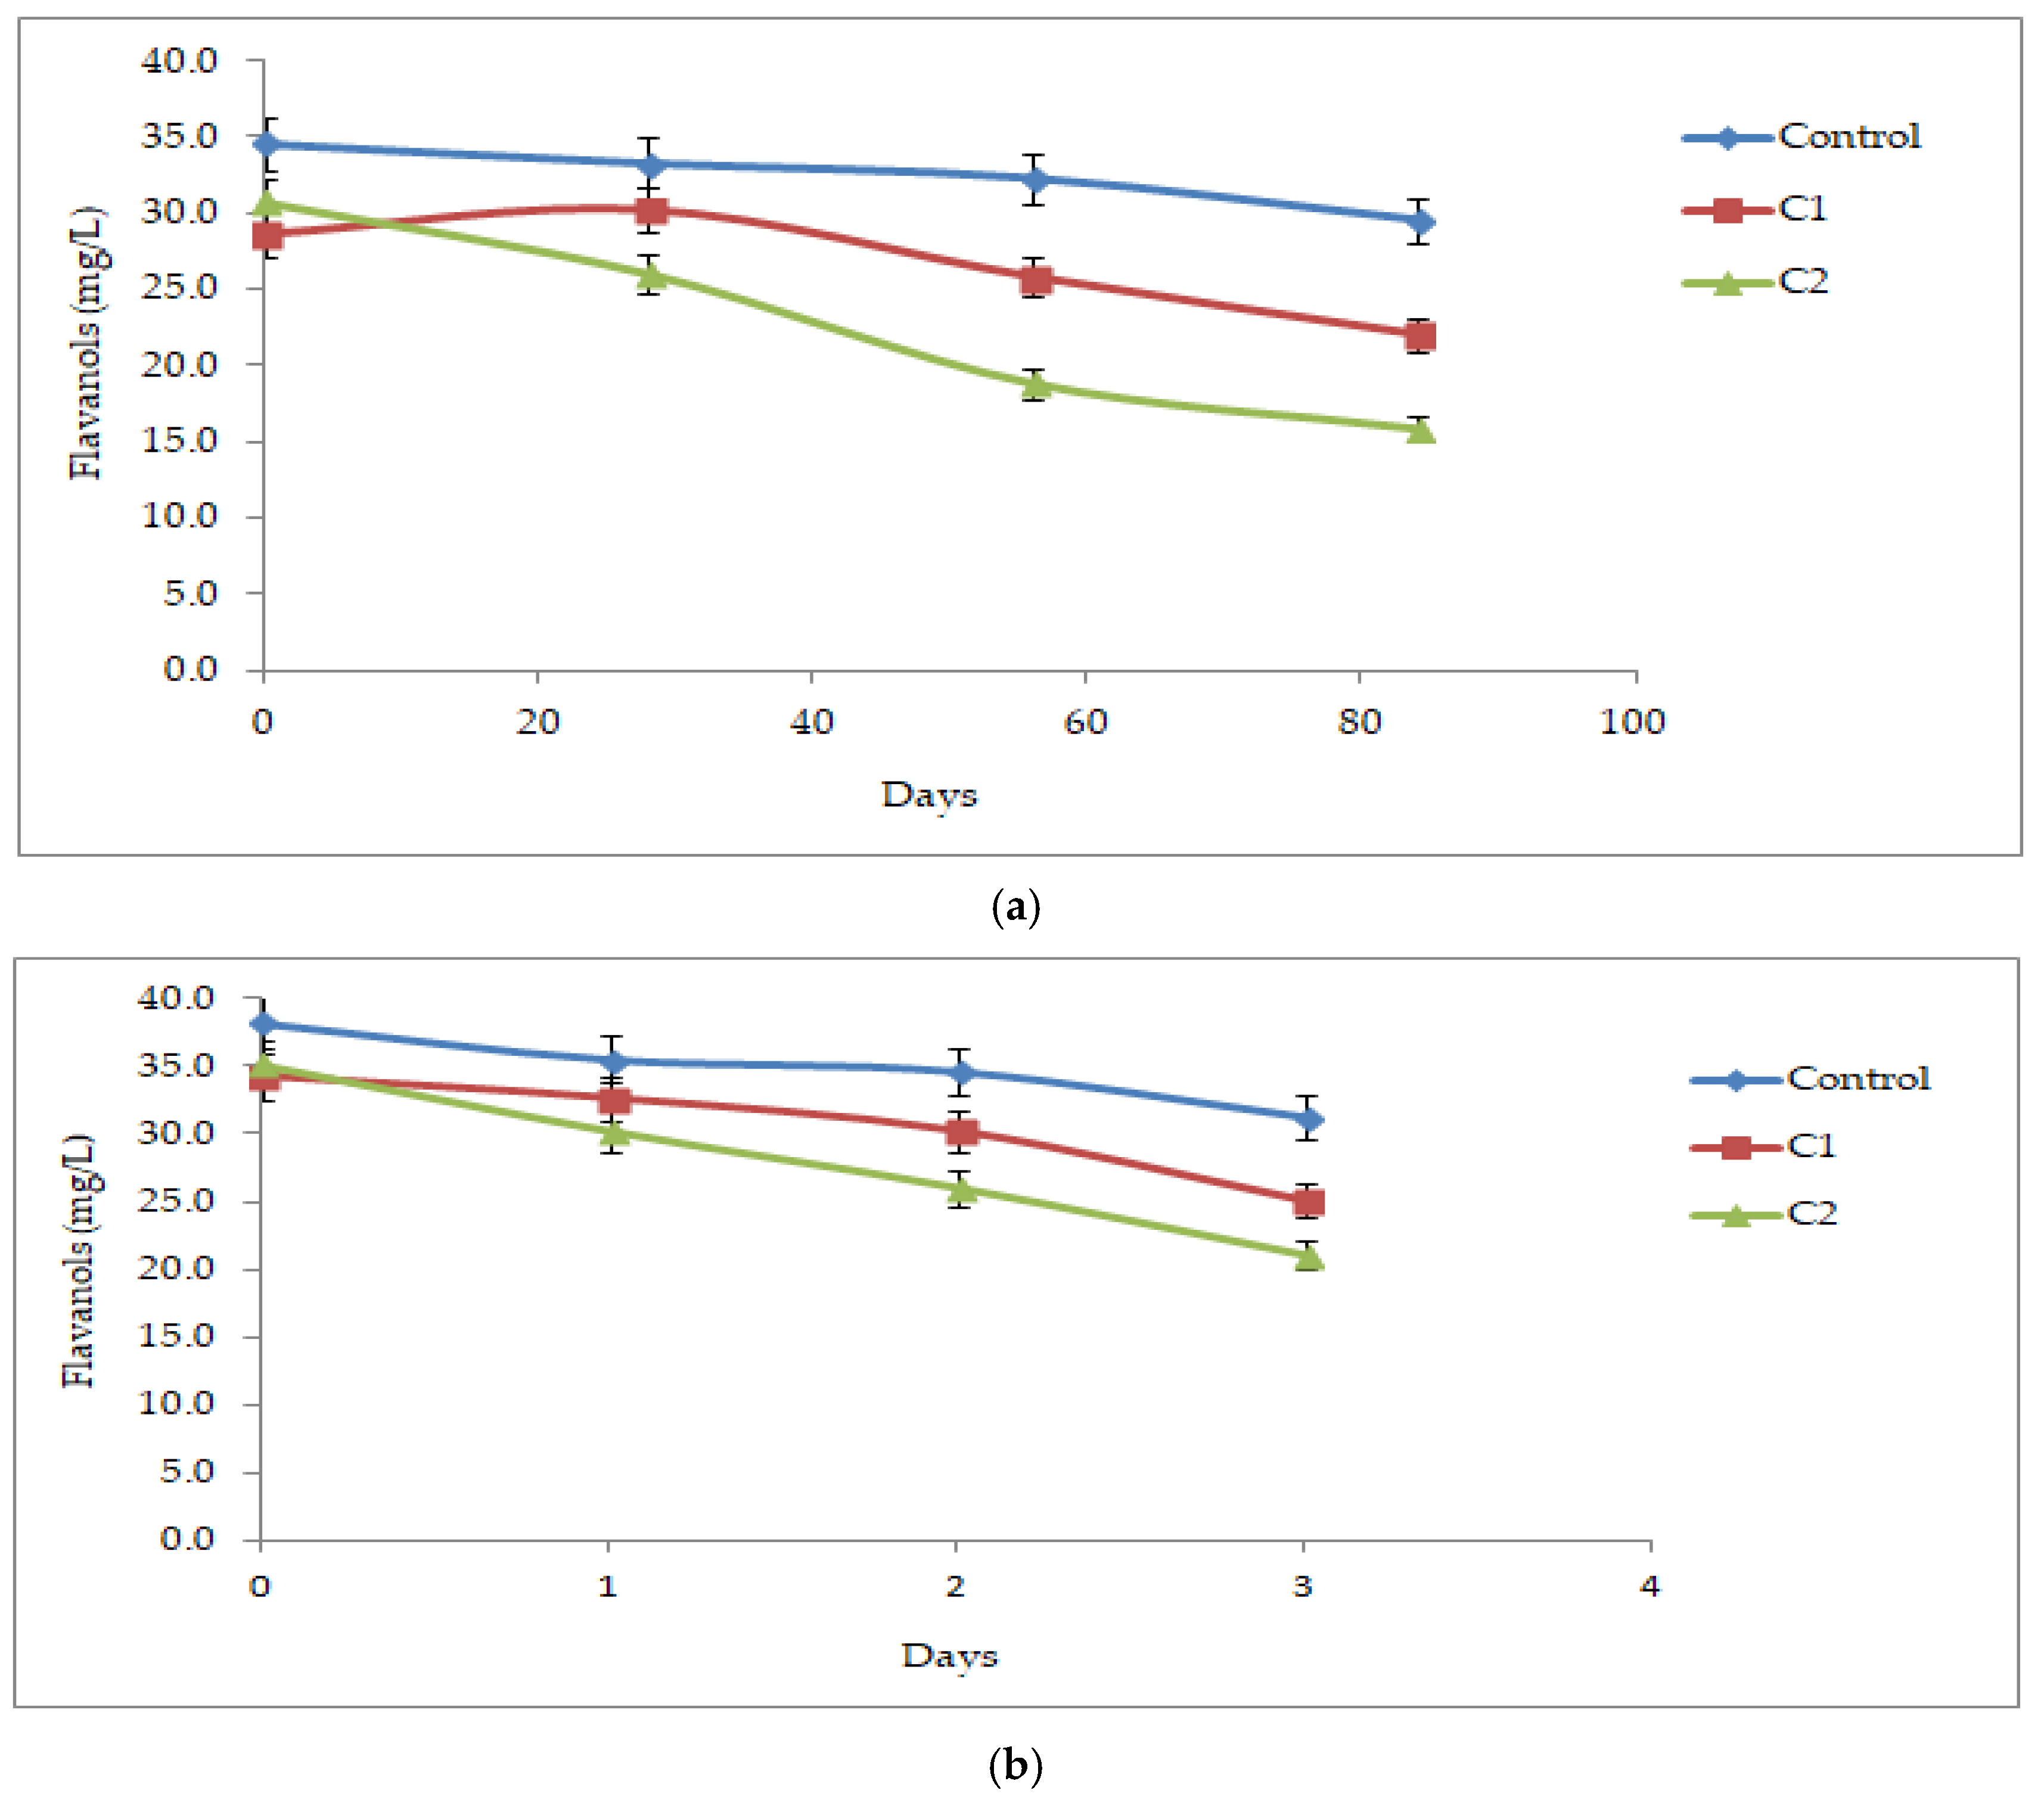
At 18 or 45 °C, the control wine samples showed a decrease in total phenolic content with respect to storage time (Table S5). There was a statistically significant positive correlation between the total phenolic content at 45 °C and the total phenolic content at 18 °C in the control wine samples (r = 0.996, p = 0.004). Decrease of total phenolics during white wine storage or after accelerated browning test has been reported by several researchers [24,33,36].
At 18 °C, the addition of Fe (II) + H2O2 mixture resulted in a decrease of total phenolic content with respect to storage time of wine (Table S5). There was a statistically significant positive correlation between the total phenolic content in the control wine samples and those to which the lower and higher concentrations of Fe (II) + H2O2 mixture were added. The correlation coefficient for the first case was r = 0.970 (p = 0.030) and for the second r = 0.966 (p = 0.034).
At 45 °C, the addition of Fe (II) + H2O2 mixture resulted in a decrease in the total phenolic content of wine samples with respect to storage time (Table S5). There was no linear correlation between the total phenolic content in the control wine samples and in those to which the low and high concentration of FeCl2 × 4H2O and H2O2 were added. Present results indicate that total phenolics may not be a suitable index to follow the forced oxidative browning of white wine by adding Fe II + H2O2 at 45 °C.
The effect of Fe (II) + H2O2 on phenolic antioxidants is additionally shown in their ultraviolet spectra (Figures S5 and S6). A decrease on the absorbance values with regard to the treated wine samples at 18 and 45 °C, compared to the control, was monitored. This decrease at 280 nm indicated a decrease in total phenolic content, since the absorbance at 280 nm is an index of total phenolics [34].

3.2.3. Flavanols

At 18 or 45 °C, control wine samples exhibited a decrease in the content of flavanols with respect to storage time (Figure 3a,b; Table S6). A linear correlation was found between the oxidized Roditis–Malagouzia wine samples at 18 °C and 45 °C. More specifically, there was a statistically significant positive correlation between the content of flavanols at 45 °C and the content of flavanols at 18 °C in the control samples (r = 0.988, p = 0.012). These results are expected, since flavanols are directly related to the browning process. Several researchers reported a decrease in total flavanols levels during white wine storage [2,3,37,38]. A decrease in the levels of (+)-catechin and (-)-epicatechin was also reported by Fernández–Zurbano et al. [2] during storage of white wine, indicating that these compounds have an important role in browning and therefore, in wine oxidation.
At 18 °C, the addition of Fe (II) + H2O2 mixture accelerated the decrease of flavanols during the storage of wine. The higher the concentration of the mixture of Fe (II) + H2O2 added, the greater the decrease in the content of flavanols (Figure 3a; Table S6). There was no linear correlation between the content of flavanols in the control samples and in the samples to which an increasing concentration of FeCl2 × 4H2O and H2O2 mixture was added.
At 45 °C, the addition of Fe (II) + H2O2 mixture accelerated the decrease of flavanols content with respect to storage time. The higher the concentration of Fe (II) + H2O2 mixture added, the greater the decrease in flavanols content (Figure 3b; Table S6). In this context, there was a statistically significant positive correlation between the content of flavanols in the control wine samples and those to which the lower and higher concentration of Fe (II) + H2O2 were added. The correlation coefficient in the first case was r = 0.973 (p = 0.027) and in the second, r = 0.984 (p = 0.016). The present results indicate that flavanols are a suitable index to follow the forced oxidative browning of white wine by adding Fe II + H2O2 at 45 °C.

3.2.4. Hydroxycinnamates

At 18 or 45 °C, the control wine samples did not show any statistically significant differences in the content of hydroxycinnamic acids with respect to storage time (Table S7). Similarly, it has been reported that hydroxycinnamates show low correlation to browning, while these may be involved in the browning reactions, especially in some white wines [2,21,38]. Kallithraka et al. [33] also reported a decrease in tartaric acid esters (kaftaric acid, coutaric acid and fertaric acid) during the storage of white wines. They also reported an increase in the content of hydroxycinnamic acids, caffeic acid, coumaric acid and ferulic acids during storage.
At 18 °C, the addition of Fe (II) + H2O2 mixture of low concentration did not cause any statistically significant differences in the content of hydroxycinnamic acids with respect to storage time (Table S7). At this temperature, the addition of Fe (II) + H2O2 mixture of the higher concentration resulted in a decrease in hydroxycinnamic acids content, as early as day 28. There was no linear correlation between the content of hydroxycinnamic acids in the control wine samples and those to which the low and high concentrations of Fe (II) + H2O2 mixture were added. In another study, Gislason et al. [39] reported that cinnamates and the ubiquitous hydroxycinnamates were found to suppress equally the formation of oxidation products in a model wine subjected to the Fenton reaction.
At 45 °C, the addition of Fe (II) + H2O2 mixture of low concentration in the Roditis–Malagouzia wine did not show any statistically significant differences in the content of hydroxycinnamic acids with respect to storage time (Table S7). On the other hand, the addition of Fe (II) + H2O2 mixture of higher concentration resulted in a decrease in hydroxycinnamic acids content (Table S7). There was a linear correlation between the content of hydroxycinnamic acids in the control wine samples and in the samples to which the higher concentration of Fe (II) + H2O2 mixture was added (r = 0.951, p = 0.049).
Similarly, there was no linear correlation between the content of hydroxycinnamic acids in the control wine samples and in the samples to which the lower concentration of Fe (II) + H2O2 mixture was added. The present results indicate that hydroxycinnamates may not be a suitable index to predict the accelerated oxidative browning of white wine by adding Fe II + H2O2 at 45 °C.

3.2.5. Total Free Sulfhydryls

At 18 or 45 °C, the control wine samples exhibited a decrease in the content of total free sulfhydryls with respect to storage time (Figure 4a,b; Table S8). A linear correlation was found between wine samples undergoing oxidation at 18 °C and at 45 °C, pointing out that the differences in the content of total sulfhydryls are owed to the time demanded for each oxidation. There was a statistically significant positive correlation between the content of total sulfhydryls at 45 °C and the content of total sulfhydryls at 18 °C in the control samples of the Roditis–Malagouzia wine (r = 0.992, p = 0.008). These results indicate that total free sulfhydryls may be a suitable index of white wine oxidation at both room and higher temperatures. Glutathione comprises the main thiol of wines, while the glutathione equivalent capacity has been proposed as a new quantitative criterion for white wine characterization [40,41]. In addition, Ugliano et al. [42] reported a decrease in glutathione content of Sauvignon blanc wine during storage.
Moreover, a significant decrease of glutathione in white wines during an accelerated test at 55 °C has also been reported by others [23]. It should be noted that wines contain significant levels of total free sulfhydryls [31].
At 18 °C, the addition of Fe (II) + H2O2 mixture increased the reduction of total sulfhydryls with respect to the storage time of the studied wine sample. The higher the concentration of Fe (II) + H2O2 mixture added, the greater the decrease in the content of total sulfhydryls (Figure 4a; Table S8). There was a statistically significant positive correlation between the content of total sulfhydryls in the control wine samples and with those to which the low concentration of Fe (II) + H2O2 mixture was added (r = 0.954, p = 0.046).
On the other hand, there was no statistically significant correlation between the content of total sulfhydryls in the control wine samples and with those to which the high concentration FeCl2 × 4H2O and H2O2 was added (r = 0.938, p = 0.062). At 45 °C, the addition of Fe (II) + H2O2 mixture accelerated the decrease of total sulfhydryls in wine with respect to storage time. The higher the concentration of Fe (II) + H2O2 mixture added, the greater the reduction of total sulfhydryls (Figure 4b; Table S8). There was a statistically significant positive correlation between the content of total sulfhydryls in the control samples and those to which the low and high concentration of Fe (II) + H2O2 were added. The correlation coefficient in the first case was r = 0.996 (p = 0.004) and in the second, r = 0.996 (p = 0.004).
Present results indicate that total free sulfhydryls may be considered as a suitable index to follow the forced oxidative browning of white wine by adding Fe II + H2O2 at 45 °C.

4. Conclusions

Accelerating the oxidative browning of white wines by adding Fe (II) and H2O2 along with heating at 45 °C indicates that it is possible to develop a rapid test for assessing the susceptibility of white wines to browning, and it seems to be effective in reducing the test time globally applied for the evaluation of the tendency of white wines to browning by heating at 45–55 °C. Among the studied parameters, the levels of flavanols and total free sulfhydryls may be proposed as a pair of suitable indices to follow the forced oxidative browning of white wine by adding Fe II + H2O2 at 45 °C. Moreover, total free sulfhydryls, known nucleophiles, may be a suitable index to follow white wine oxidation.

Supplementary Materials

The following supporting information can be downloaded at: https://www.mdpi.com/article/10.3390/app12094422/s1, Table S1: Variation in the browning index (A420 nm) of Roditis–Malagouzia white wine during storage at 18 °C and 45 °C and after the addition of Fe (II) and H2O2 mixture of different concentrations; Table S2: Variation in the browning index (A420 nm) of Debina white wine during storage at 18 °C and 45 °C and after the addition of Fe (II) and H2O2 mixture of different concentrations; Table S3: Variation in total sulfur dioxide content of Roditis–Malagouzia white wine during storage at 18 °C and 45 °C and after the addition of Fe (II) and H2O2 mixture of different concentrations; Table S4: Variation in total sulfur dioxide content of Debina white wine during storage at 18 °C and 45 °C and after the addition of Fe (II) and H2O2 mixture of different concentrations; Table S5: Variation in total phenolic content of Roditis–Malagouzia white wine during storage at 18 °C and 45 °C and after the addition of Fe (II) and H2O2 mixture of different concentrations; Table S6: Variation in flavanols content of Roditis–Malagouzia white wine during storage at 18 °C and 45 °C and after the addition of Fe (II) and H2O2 mixture of different concentrations; Table S7: Variation in hydroxycinnamic acids content of Roditis–Malagouzia white wine during storage at 18 °C and 45 °C and after the addition of Fe (II) and H2O2 mixture of different concentrations; Table S8: Variation in total sulfydryls content of Roditis–Malagouzia white wine during storage at 18 °C and 45 °C and after the addition of Fe (II) and H2O2 mixture of different concentrations; Figure S1: Visible spectra of Roditis–Malagouzia wine during storage at 18 °C for 0 (a), 28 (b), 56 (c) and 84 (d) days after the addition of increasing concentrations of Fe (II) and H2O2; Figure S2: Visible spectra of Roditis–Malagouzia wine during storage at 45 °C for 0 (a), 1 (b), 2 (c) and 3 (d) days after the addition of increasing concentrations of Fe (II) and H2O2; Figure S3:Visible spectra of Debina wine during storage at 18 °C for 0 (a), 22 (b), 44 (c) and 66 (d) days after the addition of increasing concentrations of Fe (II) and H2O2; Figure S4: Visible spectra of Debina wine during storage at 45 °C for 0 (a), 1 (b), 2 (c) and 3 (d) days after the addition of increasing concentrations of Fe (II) and H2O2; Figure S5: Ultraviolet spectra of Roditis–Malagouzia wine (diluted 1:10 with model wine) during storage at 18 °C for 0 (a), 28 (b), 56 (c) and 84 (d) days after the addition of increasing concentrations of Fe (II) and H2O2; Figure S6: Ultraviolet spectra of Roditis–Malagouzia wine (diluted 1:10 with model wine) during storage at 45 °C for 0 (a), 1 (b), 2 (c) and 3 (d) days after the addition of increasing concentrations of Fe (II) and H2O2.

Author Contributions

Conceptualization, I.G.R.; methodology, I.G.R.; software, S.V. and I.K.K.; validation, S.V.; formal analysis, S.V.; investigation, S.V. and I.G.R.; resources, I.G.R.; data curation, S.V. and I.K.K.; writing—original draft preparation, I.K.K.; writing—review and editing, I.G.R.; visualization, S.V. and I.K.K.; supervision, I.G.R.; project administration, I.G.R.; funding acquisition, I.G.R. All authors have read and agreed to the published version of the manuscript.

Funding

This research received no external funding.

Institutional Review Board Statement

Not applicable.

Informed Consent Statement

Not applicable.

Data Availability Statement

Not applicable.

Conflicts of Interest

The authors declare no conflict of interest.

References

  1. Singleton, V.L. Oxygen with phenols and related reactions in musts, wines, and model systems: Observations and practical implications. Am. J. Enol. Vitic. 1987, 38, 69–77. [Google Scholar]
  2. Fernãndez-Zurbano, P.; Ferreira, V.; Peña, C.; Escudero, A.; Serrano, F.; Cacho, J. Prediction of oxidative browning in white wines as a function of their chemical composition. J. Agric. Food Chem. 1995, 43, 2813–2817. [Google Scholar] [CrossRef]
  3. Vaimakis, V.; Roussis, I.G. Must oxygenation together with glutathione addition in the oxidation of white wine. Food Chem. 1996, 57, 419–422. [Google Scholar] [CrossRef]
  4. Roussis, I.G.; Lambropoulos, I.; Papadopoulou, D. Inhibition of the decline of volatile esters and terpenols during oxidative storage of Muscat-white and Xinomavro-red wine by caffeic acid and N-acetyl-cysteine. Food Chem. 2005, 93, 485–492. [Google Scholar] [CrossRef]
  5. Danilewicz, J.C. Review of reaction mechanisms of oxygen and proposed intermediate reduction products in wine: Central role of iron and copper. Am. J. Enol. Vitic. 2003, 54, 73–85. [Google Scholar]
  6. Danilewicz, J.C. Interaction of sulfur dioxide, polyphenols, and oxygen in a wine-model system: Central role of iron and copper. Am. J. Enol. Vitic. 2007, 58, 53–60. [Google Scholar]
  7. Danilewicz, J.C. Reactions involving iron in mediating catechol oxidation in model wine. Am. J. Enol. Vitic. 2013, 64, 316–324. [Google Scholar] [CrossRef]
  8. Waterhouse, A.L.; Laurie, V.F. Oxidation of wine phenolics: A critical evaluation and hypotheses. Am. J. Enol. Vitic. 2006, 57, 306–313. [Google Scholar]
  9. Nguyen, T.H.; Waterhouse, A.L. Redox cycling of iron: Effects of chemical composition on reaction rates with phenols and oxygen in model wine. Am. J. Enol. Vitic. 2021, 72, 209–216. [Google Scholar] [CrossRef]
  10. Nguyen, T.H.; Waterhouse, A.L. Acid complexation of iron controls the fate of hydrogen peroxide in model wine. Food Chem. 2022, 377, 131910. [Google Scholar] [CrossRef]
  11. Li, H.; Guo, A.; Wang, H. Mechanisms of oxidative browning of wine. Food Chem. 2008, 108, 1–13. [Google Scholar] [CrossRef]
  12. Oliveira, C.M.; Ferreira, A.C.S.; De Freitas, V.; Silva, A.M.S. Oxidation mechanisms occurring in wines. Food Res. Int. 2011, 44, 1115–1126. [Google Scholar] [CrossRef]
  13. Elias, R.J.; Waterhouse, A.L. Controlling the Fenton reaction in wine. J. Agric. Food Chem. 2010, 58, 1699–1707. [Google Scholar] [CrossRef] [PubMed]
  14. Elias, R.J.; Andersen, M.L.; Skibsted, L.H.; Waterhouse, A.L. Identification of free radical intermediates in oxidized wine using electron paramagnetic resonance spin trapping. J. Agric. Food Chem. 2009, 57, 4359–4365. [Google Scholar] [CrossRef]
  15. Danilewicz, J.C.; Seccombe, J.T.; Whelan, J. Mechanism of interaction of polyphenols, oxygen, and sulfur dioxide in model wine and wine. Am. J. Enol. Vitic. 2008, 59, 128–136. [Google Scholar]
  16. Garde-Cerdán, T.; Ancín-Azpilicueta, C. Effect of SO2 on the formation and evolution of volatile compounds in wines. Food Control 2007, 18, 1501–1506. [Google Scholar] [CrossRef]
  17. Roussis, I.G.; Sergianitis, S. Protection of some aroma volatiles in a model wine medium by sulphur dioxide and mixtures of glutathione with caffeic acid or gallic acid. Flavour Fragr. J. 2008, 23, 35–39. [Google Scholar] [CrossRef]
  18. Roussis, I.G.; Patrianakou, M.; Drossiadis, A. Protection of aroma volatiles in a red wine with low sulphur dioxide by a mixture of glutathione, caffeic acid and gallic acid. S. Afr. J. Enol. Vitic. 2013, 34, 262–265. [Google Scholar] [CrossRef]
  19. Roussis, I.G.; Papadopoulou, D.; Sakarellos-Daitsiotis, M. Protective effect of thiols on wine aroma volatiles. Open Food Sci. J. 2009, 3, 98–102. [Google Scholar] [CrossRef]
  20. Galuska, S.; Makris, D.P. The effect of chlorogenic acid, catechin and SO2 on browning development in white wine model solutions. J. Inst. Brew. 2013, 119, 309–313. [Google Scholar] [CrossRef]
  21. Cheynier, V.; Rigaud, J.; Souquet, J.M.; Barillere, J.M.; Moutounet, M. Effect of pomace contact and hyperoxidation on the phenolic composition and quality of Grenache and Chardonnay wines. Am. J. Enol. Vitic. 1989, 40, 36–42. [Google Scholar]
  22. El Hosry, L.; Auezova, L.; Sakr, A.; Hajj-Moussa, E. Browning susceptibility of white wine and antioxidant effect of glutathione. Int. J. Food Sci. Technol. 2009, 44, 2459–2463. [Google Scholar] [CrossRef]
  23. Singleton, V.L.; Kramlinga, T.E. Browning of white wines and an accelerated test for browning capacity. Am. J. Enol. Vitic. 1976, 27, 157–160. [Google Scholar]
  24. Mayén, M.; Barón, R.; Mérida, J.; Medina, M. Changes in phenolic compounds during accelerated browning in white wines from cv. Pedro Ximenez and cv. Baladi grapes. Food Chem. 1997, 58, 89–95. [Google Scholar] [CrossRef]
  25. Muller-Spath, H. Der POM-test. Deutsche Weinbau 1992, 23, 1099–1100. [Google Scholar]
  26. Fia, G.; Gori, C.; Bucalossi, G.; Borghini, F.; Zanoni, B. A Naturally occurring antioxidant complex from unripe grapes: The case of Sangiovese (v. Vitis vinifera). Antioxidants 2018, 7, 27. [Google Scholar] [CrossRef] [Green Version]
  27. Palma, M.; Barroso, C.G. Application of a new analytical method to determine the susceptibility of wine to browning. Eur. Food Res. Technol. 2002, 214, 441–443. [Google Scholar] [CrossRef]
  28. International Organisation of Vine and Wine. Compendium of International Methods of Wine and Must Analysis, 2020 ed.; International Organisation of Vine and Wine: Paris, France, 2021; Volume 1, ISBN 978-2-85038-053-2. [Google Scholar]
  29. Mladenoska, I.; Petkova, V.; Kadifkova Panovska, T. Pre-fermentative treatment of a model wine with aim to serve as functional food with decreased alcohol content. Maced. Pharm. Bull. 2017, 63, 47–53. [Google Scholar] [CrossRef]
  30. Roussis, I.G.; Lambropoulos, I.; Tzimas, P.; Gkoulioti, A.; Marinos, V.; Tsoupeis, D.; Boutaris, I. Antioxidant activities of some Greek wines and wine phenolic extracts. J. Food Comp. Anal. 2008, 21, 614–621. [Google Scholar] [CrossRef]
  31. Kontogeorgos, N.; Roussis, I.G. Total free sulphydryls of several white and red wines. S. Afr. J. Enol. Vitic. 2014, 35, 125–127. [Google Scholar]
  32. Patrianakou, M.; Roussis, I.G. Decrease of Wine Volatile Aroma Esters by Oxidation. S. Afr. J. Enol. Vitic. 2013, 34, 241–245. [Google Scholar] [CrossRef]
  33. Kallithraka, S.; Salacha, M.I.; Tzourou, I. Changes in phenolic composition and antioxidant activity of white wine during bottle storage: Accelerated browning test versus bottle storage. Food Chem. 2009, 113, 500–505. [Google Scholar] [CrossRef]
  34. Aleixandre-Tudo, J.L.; Weightman, C.; Panzeri, V.; Nieuwoudt, H.H.; du Toit, W.J. Effect of skin contact before and during alcoholic fermentation on the chemical and sensory profile of South African Chenin blanc white wines. S. Afr. J. Enol. Vitic. 2015, 36, 366–377. [Google Scholar] [CrossRef]
  35. Galuska, S.; Makris, D.P.; Kefalas, P. Browning development in wine-like liquid model matrices: Dependence on phenolic, Fe (III) and SO2 concentrations. J. Food Process. Eng. 2010, 33, 934–945. [Google Scholar] [CrossRef]
  36. Recamales, Á.F.; Sayago, A.; González-Miret, M.L.; Hernanz, D. The effect of time and storage conditions on the phenolic composition and colour of white wine. Food Res. Int. 2006, 39, 220–229. [Google Scholar] [CrossRef]
  37. Simpson, R.F. Factors affecting oxidative browning of white wine. Vitis 1982, 21, 233–239. [Google Scholar]
  38. Fernãndez-Zurbano, P.; Ferreira, V.; Escudero, A.; Cacho, J. Role of hydroxycinnamic acids and flavanols in the oxidation and browning of white wines. J. Agric. Food Chem. 1998, 46, 4937–4944. [Google Scholar] [CrossRef]
  39. Gislason, N.E.; Currie, B.L.; Waterhouse, A.L. Novel antioxidant reactions of cinnamates in wine. J. Agric. Food Chem. 2011, 59, 6221–6226. [Google Scholar] [CrossRef]
  40. Kritzinger, E.C.; Bauer, F.F.; du Toit, W.J. Role of glutathione in winemaking: A review. J. Agric. Food Chem. 2013, 61, 269–277. [Google Scholar] [CrossRef] [Green Version]
  41. Sarakbi, A.; Kauffmann, J.-M. A new chemical criteria for white wine: The glutathione equivalent capacity. Food Chem. 2014, 153, 321–326. [Google Scholar] [CrossRef]
  42. Ugliano, M.; Kwiatkowski, M.; Vidal, S.; Capone, D.; Siebert, T.; Dieval, J.-B.; Aagaard, O.; Waters, E.J. Evolution of 3-mercaptohexanol, hydrogen sulfide, and methyl mercaptan during bottle storage of Sauvignon blanc wines. Effect of glutathione, copper, oxygen exposure, and closure-derived oxygen. J. Agric. Food Chem. 2011, 59, 2564–2572. [Google Scholar] [CrossRef] [PubMed]
Figure 1. (a). Effect of Fe (II) + H2O2 on the levels of absorbance at 420 nm of Roditis–Malagouzia wine during storage at 18 °C. C1: low concentration: FeCl2 × 4H2O = 0.10 mM/H2O2 = 0.63 mM. C2 high concentration: FeCl2 × 4H2O = 0.25 Mm/H2O2 = 1.575 mM. (b). Effect of Fe (II) + H2O2 on the levels of absorbance at 420 nm of Debina wine during storage at 18 °C. C1: low concentration: FeCl2 × 4H2O = 0.10 mM/H2O2 = 0.63 mM. C2 high concentration: FeCl2 × 4H2O = 0.25 Mm/H2O2 = 1.575 mM.
Applsci 12 04422 g001
Figure 2. (a). Effect of Fe (II) + H2O2 on the levels of of absorbance at 420 nm nm of Roditis–Malagouzia wine during storage at 45 °C. C1: low concentration: FeCl2 × 4H2O = 0.10 mM/H2O2 = 0.63 mM. C2 high concentration: FeCl2 × 4H2O = 0.25 Mm/H2O2 = 1.575 mM. (b). Effect of Fe (II) + H2O2 on the levels of absorbance at 420 nm of Debina wine during storage at 18 °C. C1: low concentration: FeCl2 × 4H2O = 0.10 mM/H2O2 = 0.63 mM. C2 high concentration: FeCl2 × 4H2O = 0.25 Mm/H2O2 = 1.575 mM.
Applsci 12 04422 g002
Figure 3. (a). Effect of Fe (II) + H2O2 on the levels of flavanols of Roditis–Malagouzia wine during storage at 18 °C. C1: low concentration: FeCl2 × 4H2O = 0.10 mM/H2O2 = 0.63 mM. C2 high concentration: FeCl2 × 4H2O = 0.25 Mm/H2O2 = 1.575 mM. (b). Effect of Fe (II) + H2O2 on the levels of flavanols of Roditis–Malagouzia wine during storage at 45 °C. C1: low concentration: FeCl2 × 4H2O = 0.10 mM/H2O2 = 0.63 mM. C2 high concentration: FeCl2 × 4H2O = 0.25 Mm/H2O2 = 1.575 mM.
Applsci 12 04422 g003
Figure 4. (a). Effect of Fe (II) + H2O2 on the levels of total free sulfhydryls of Roditis–Malagouzia wine during storage at 18 °C. C1: low concentration: FeCl2 × 4H2O = 0.10 mM/H2O2 = 0.63 mM. C2 high concentration: FeCl2 × 4H2O = 0.25 Mm/H2O2 = 1.575 mM. (b). Effect of Fe (II) + H2O2 on the levels of total free sulphydryls of Roditis–Malagouzia wine during storage at 45°C. C1: low concentration: FeCl2 × 4H2O = 0.10 mM/H2O2 = 0.63 mM. C2 high concentration: FeCl2 × 4H2O = 0.25 Mm/H2O2 = 1.575 mM.
Applsci 12 04422 g004
Publisher’s Note: MDPI stays neutral with regard to jurisdictional claims in published maps and institutional affiliations.

