Abstract
In this paper, the molecular dynamics (MD) method was used to study the influence of factors of bulk Cu material, such as the effect of the number of atoms (N) at temperature (T), T = 300 K, temperature T, and annealing time (t) with Cu5324 on the structure properties, phase transition, and glass temperature Tg of the bulk Cu material. The obtained results showed that the glass transition temperature (Tg) of the bulk Cu material was Tg = 652 K; the length of the link for Cu-Cu had a negligible change; r = 2.475 Å; and four types of structures, FCC, HCP, BCC, Amor, always existed. With increasing the temperature the FCC, HCP, and BCC decrease, and Amorphous (Amor) increases. With an increasing number of atoms and annealing time, the FCC, HCP, and BCC increased, and Amor decreased. The simulated results showed that there was a great influence of factors on the structure found the gradient change, phase transition, and successful determination of the glass temperature point above Tg of the bulk Cu material. On the basis of these results, essential support will be provided for future studies on mechanical, optical, and electronic properties.
1. Introduction
Metals are the most used materials, and they are readily available in nature. Among them, copper (Cu) is a metal with an atomic number of Z = 29 with outstanding properties, such as high ductility and good thermal and electrical conductivity [1,2,3,4,5,6,7], and it is a soft, ductile, orange-red metal. Therefore, Cu is widely used in human life and science and technology; for example, one can produce materials that effectively conduct heat and electricity [8], Cu thin films indispensable in electronics [9,10,11], phosphorescent materials [12], etc. As a consequence, for a long time, Cu has been a center of interest for many researchers, both in theoretical and experimental terms [13,14,15].
Experimental methods include direct MW irradiation in the presence of triethylenetetramine (TETA) [16], sliding friction plate strain [17], and the reduction method [18,19,20]. Instruments such as scanning electron microscopes (SEMs) and transmission electron microscopes (TEMs) are called electron microscopes (SEM/TEM) and are used to observe the surface details of materials, while the melting and crystallization temperatures are directly measured by differential scanning calorimetry (DSC), X-ray diffraction, optical microscopy, and electron microscopy [16]. Li-Cheng Jheng et al. [16] successfully studied the melting and crystallization process and determined the phase transition temperature (Tm) to be Tm = 1358 K. In addition, it can be noted that Cu with a size less than 100 nm can be MW irradiated (microwave) with or without polyols [21,22].
Theoretically, results showed that for 5 nm materials, a significant decrease in the phase transition temperature Tm to several hundred degrees for metals was produced. Furthermore, if the Cu material has a size of less than 3 nm, the Tm decreases sharply (Tm < 373 K) because of the size effect (surface effect) [23]. Recently, Xin Zhou et al. [24] successfully determined the gradient of Cu through SMGT and grain size dependences of grain boundary (GB) migration in nanograined Ag, Cu, and Ni under tension. The thin tissue molecular dynamics (MD) method [25] is a modern method used to determine properties, such as the Radial Distribution Function (RDF) [26,27], the transformation between local structures by Honeycutt–Andersen (HA) [28], local atomic shear strain [29,30], and pick separation at the second peak of RDF of the material [31,32].
To determine all these characteristics, it is necessary to use suitable interaction potentials and to apply the Embedded Atom Method (EAM). Mishin et al. [33] determined the structural stability and lattice defects in copper. Among the research methods, simulation methods are considered to be the most effective research tools today because they have the ability to approach the critical size and reach regions with high temperatures and pressure (such as 360 GPa and 7000 K for MgSiO3 [34] and CaSiO3 [35]) that experimental methods cannot approach.
The authors of references [36,37,38] considered numerically by MD simulation the atomic structure variations in the cooling, vitrification, and crystallization process in liquid metals. The process consists of continuous cooling and isothermal annealing. The numerical calculations are performed in the framework of an embedded-atom method potential at constant pressure. A direct structure observation has been observed in the large simulation cells that contain about 105 to 106 atoms. MD simulation of glass transition of pure metals, such as Fe, Ni, Cu, and other metals, was made. The authors concluded that for the occurrence of crystallization, the cubic cell size was typically chosen to be about 10 nm.
Researchers use a variety of tools, such as free commercial software or self-coding based on molecular dynamics simulation methods, such as the use of the Large-scale Atomic Molecular Massively Parallel Simulator (LAMMPS) program [39], to simulate the materials. Zhou et al. [40] applied MD simulations to determine the tensile deformation of gradient nano-grained copper film films. In addition, MD has been widely applied to determine the structure and thermodynamic properties of metals [41], especially for the structural phase transition of single-crystal Cu [42]. Cu is a metal with a face-centered cubic (FCC) crystal structure, and it is very stable until it changes to the liquid state [43]; its structure change is based on the phase transition diagram. The body-centered cubic (BCC) phase of Cu is unstable in the ground state [44] (demonstrated by the Ab—Initio method), which has led to controversy and various explanations. In addition, stable substrates with complex structures that affect Cu structure only occur in thin films and not in bulk materials or materials that are thick films [45]. Friedel [46] demonstrated that the BCC structure of Cu is energetically unstable in the ground state but is suitable for high temperatures because of its large entropy and its low-energy transverse vibrational mode. This fact highlighted that the structural transformation can be driven only by an excess of the fluctuating entropy of the high-temperature phase [47]. Given the importance and extensive applications of Cu, this element has been extensively studied in different research [48,49,50]. In addition, it has been determined that the phase transition temperature (Tm) of the material decreases with decreasing size [51,52], and the appearance of cubic structure units and crystallization was found at room temperature [53]. As has been emphasized above, MD methods have been widely used in studies on structural evolution during crystallization [54], deformation characteristics, and the stress–strain response [55]. Lee et al. [56] argued that there is little research regarding the crystallization of amorphous materials in which stress plays a very important role. Recently, some researchers [57] considered the structure of materials by analyzing the structure of chemical bonds between atoms that were constituents of the given condensed matter. They used an abstract set theory with the concept of topological Hausdorff–Besicovitch dimension, which has a stepwise change from zero to fractal one (nearly 2.55), when the condensed system passes the glass transition temperature Tg. Thus, above this temperature, the structure of the system has fractal symmetry, evidently different from 3D. This leads to an important conclusion: phase transitions of Cu at this point have a topological character, quite different from that related to spontaneous breaking of traditional symmetries, such as translation and rotation. Then, the authors proposed a method for fixing the glass transition temperature using the procedure they discovered earlier in [58,59], which led to the result of 794 K. This is a higher than the value of 773 K obtained from the well-known Wen–Abraham empirical criterion given in [60]. These values are also different from the result of 652 K obtained in this paper by our simulation method, which, in our opinion, is more in agreement with reality because it is a result of the fast convergent MD simulation procedure presented below.
Notably, in Cu material, there is a change in the number of FCC, hexagonal close-packed (HCP), BCC, and amorphous (Amor) structural units [61], with a transition hot temperature of Tm = 1356.2 K [62]. In addition, the material size, energy, and number of atoms influences the structural characteristics, electronic structure, and phase transition of the metals Al [63], Fe [64], and Ag [65] and the alloys AlNi [66], NiCu [67,68], AgAu [69], NiFe [70], AuCu [71], NiAu [72], and CuAu [73].
Therefore, the question arises of whether there is any influence on the structure, phase transition, and the phase transition temperature of the bulk Cu material. To answer that question, in the content of this paper, we studied the influence of factors such as atoms number, temperature, and annealing time on the structural characteristics and phase transition of bulk Cu material using the MD simulation method. The obtained results will serve as the basis for the future study of the structural features of the experiment.
2. Method of Calculation
To study the structural characteristics of bulk Cu material, we applied the following procedure:
Originally, Cu atoms were randomly sown into a cube with the size l, determined by Formula (1):
and the molecular dynamics (MD) simulation method with the embedded interaction potential of Sutton–Chen (SC) (2) [61,74,75], and periodic boundary conditions were applied. As emphasized in [73], this choice of potential is the most appropriate one.

Table 1.
Parameters of the cubic Cu material model [76].
The program code LAMMPS [74,75] based on Embedded Atom Method (EAM) potential [49] was applied to describe the interaction between Cu atoms.
Initially, to make bulk Cu material, the material was left to run 5 × 10⁴ MD steps of recovery statistics with a heating rate of 4 × 10¹¹ K/s and a heating step of 1 fs at temperature (T) = 4500 K. Then, the temperature decreased from T = 4500 K to T = 1000, 900, 800, 700, 600, 500, 400, and 300 K to increase the crystallization state of the material. To determine the effect number of atoms, models with the corresponding number of atoms (N) were applied: N = 2916 atoms Cu (Cu2916), 4000 atoms Cu (Cu4000), 5324 atoms Cu (Cu5324), and 6912 atoms Cu (Cu6912). Then, the material Cu5324 was selected as the standard to study the effect of temperature, and the glass transition temperature of the material and the annealing time (t) = 200 ps at T = 652 K were determined to increase the crystallization of the material.
To study the structural features, radial distribution function (RDF), size (l), and the total energy of the system (Etot) [77] were determined through the values of the shape quantities. All samples are conducted through the phase transition with the laws of Nosé [78], Hoover [79], and the Common Neighbors Analysis (CNA) [80,81] was applied on the basis of the glass transition temperature (Tg) by the Etot and T. For the number of atoms distribution in the material structure, the radial distribution function (RDF) was applied [82] to determine g(r):
where g(r), n(r), ρ0, and r are functions used to determine the probability of finding an atom i in the space, the atom number, the atomic density, and the distance from atom i to another atom.
To determine the diffusion mechanism of the atoms, mean squared distance (MSD) was applied using the following expression [83]:
where N is the number of atoms in the system, and ri(0) → ri(t) is the position of atom i at time t. For visualization, the software OVITO [55,56] was used. Finally, to check the accuracy of the results, Dual Energy X-ray Absorptiometry (DXA) was used [84]. These programs were edited and applied on the computer system of the Institute of Physics, University of Zielona Góra, Poland.
3. Results and Discussion
3.1. Structural Properties of Bulk Cu Materials
The structural properties were characterized by the number of structural units, as shown in Figure 1.
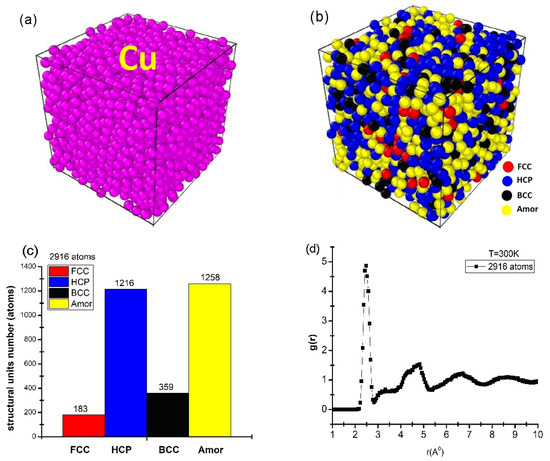
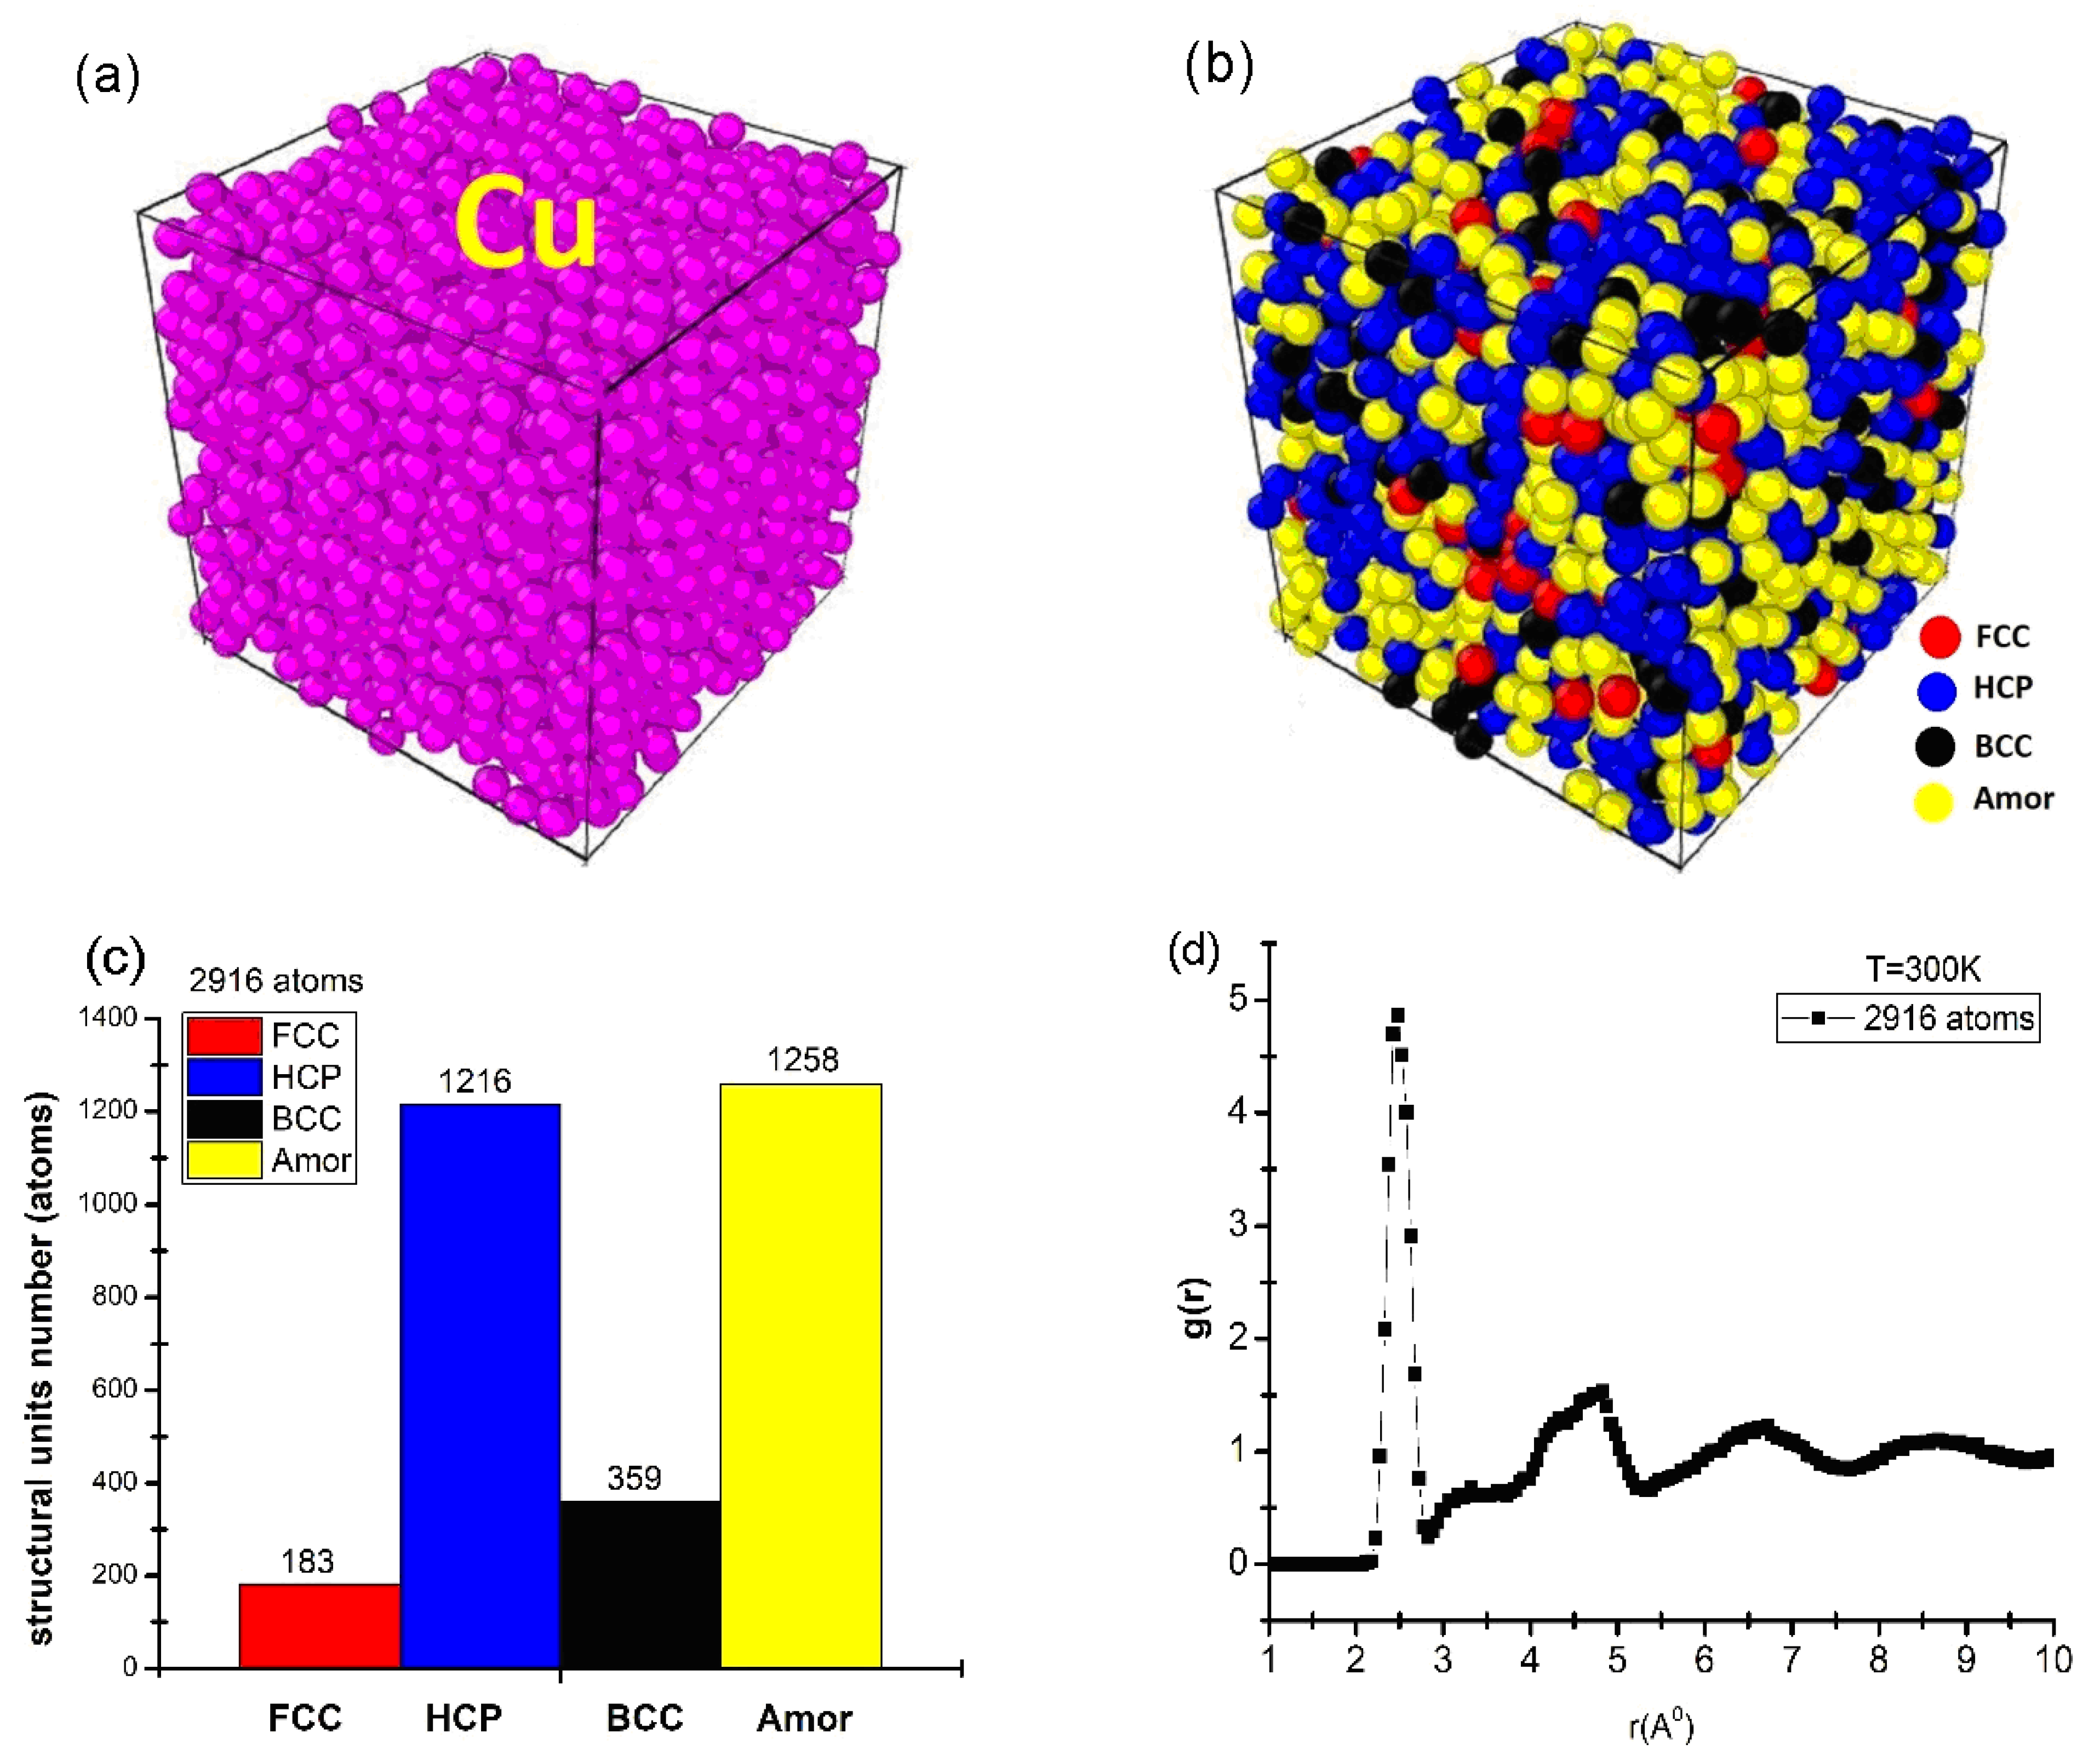
Figure 1.
Initial shape (a), structure shape (b), number of structural units (c), and RDF (d) of bulk Cu2916 material at temperature T = 300 K.
The obtained results show that the material of Cu2916 metal was identified by a cube-shaped structure, made up of Cu metal atoms, and identified in purple (Figure 1a). To determine the interaction between atoms (which is characterized by the number of structural units) the Common Neighbors Analysis (CNA) was applied. The obtained results show that Cu2916 material is determined by four structural units: face-centered cubic (FCC) is red, hexagonal close-packed (HCP) is blue, body-centered cubic (BCC) is black, and amorphous (Amor) is yellow (Figure 1b); the number of structural units was shown by 183 FCC, 1216 HCP, 356 BCC, and 1258 Amor (Figure 1c); the length of links was rCu-Cu = 2.475 Å; the height of the first peak radial distribution function was g(r) = 4.86 (Figure 1d). The obtained results are completely consistent with the experimental result rCu-Cu = 2.48 Å [28] and the simulation result rCu-Cu = 2.46 Å [43].
In addition, the material had a size (l) corresponding to l = 3.25 nm, Etot = −9931 eV. Through the obtained results, it is shown that the structural characteristic quantities that have been adopted by the Cu2916 material model are consistent with the results of [28,43] and create a premise for the process of studying the influencing factors.
3.2. Influencing Factors
To study the influencing factors, we used the material models Cu2916, Cu4000, Cu5324, and Cu6912 to study the influence of size; temperature at T = 300, 400, 500, 600, 700, 800, 900, and 1000 K; and annealing time after t = 0, 40, 100, 150, and 200 ps.
3.2.1. Effect of Atoms Number
The results showed the influence of the number of atoms on the structural properties, as shown in Figure 2.
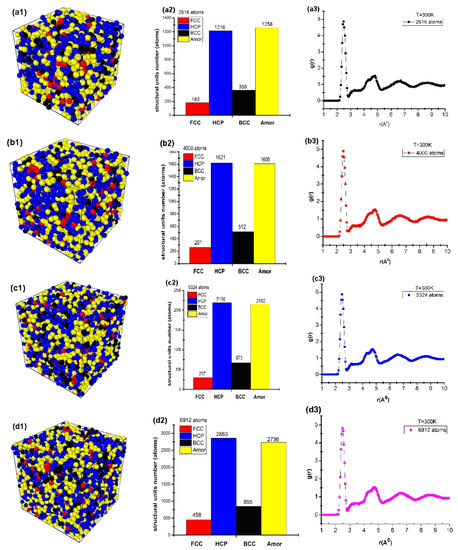
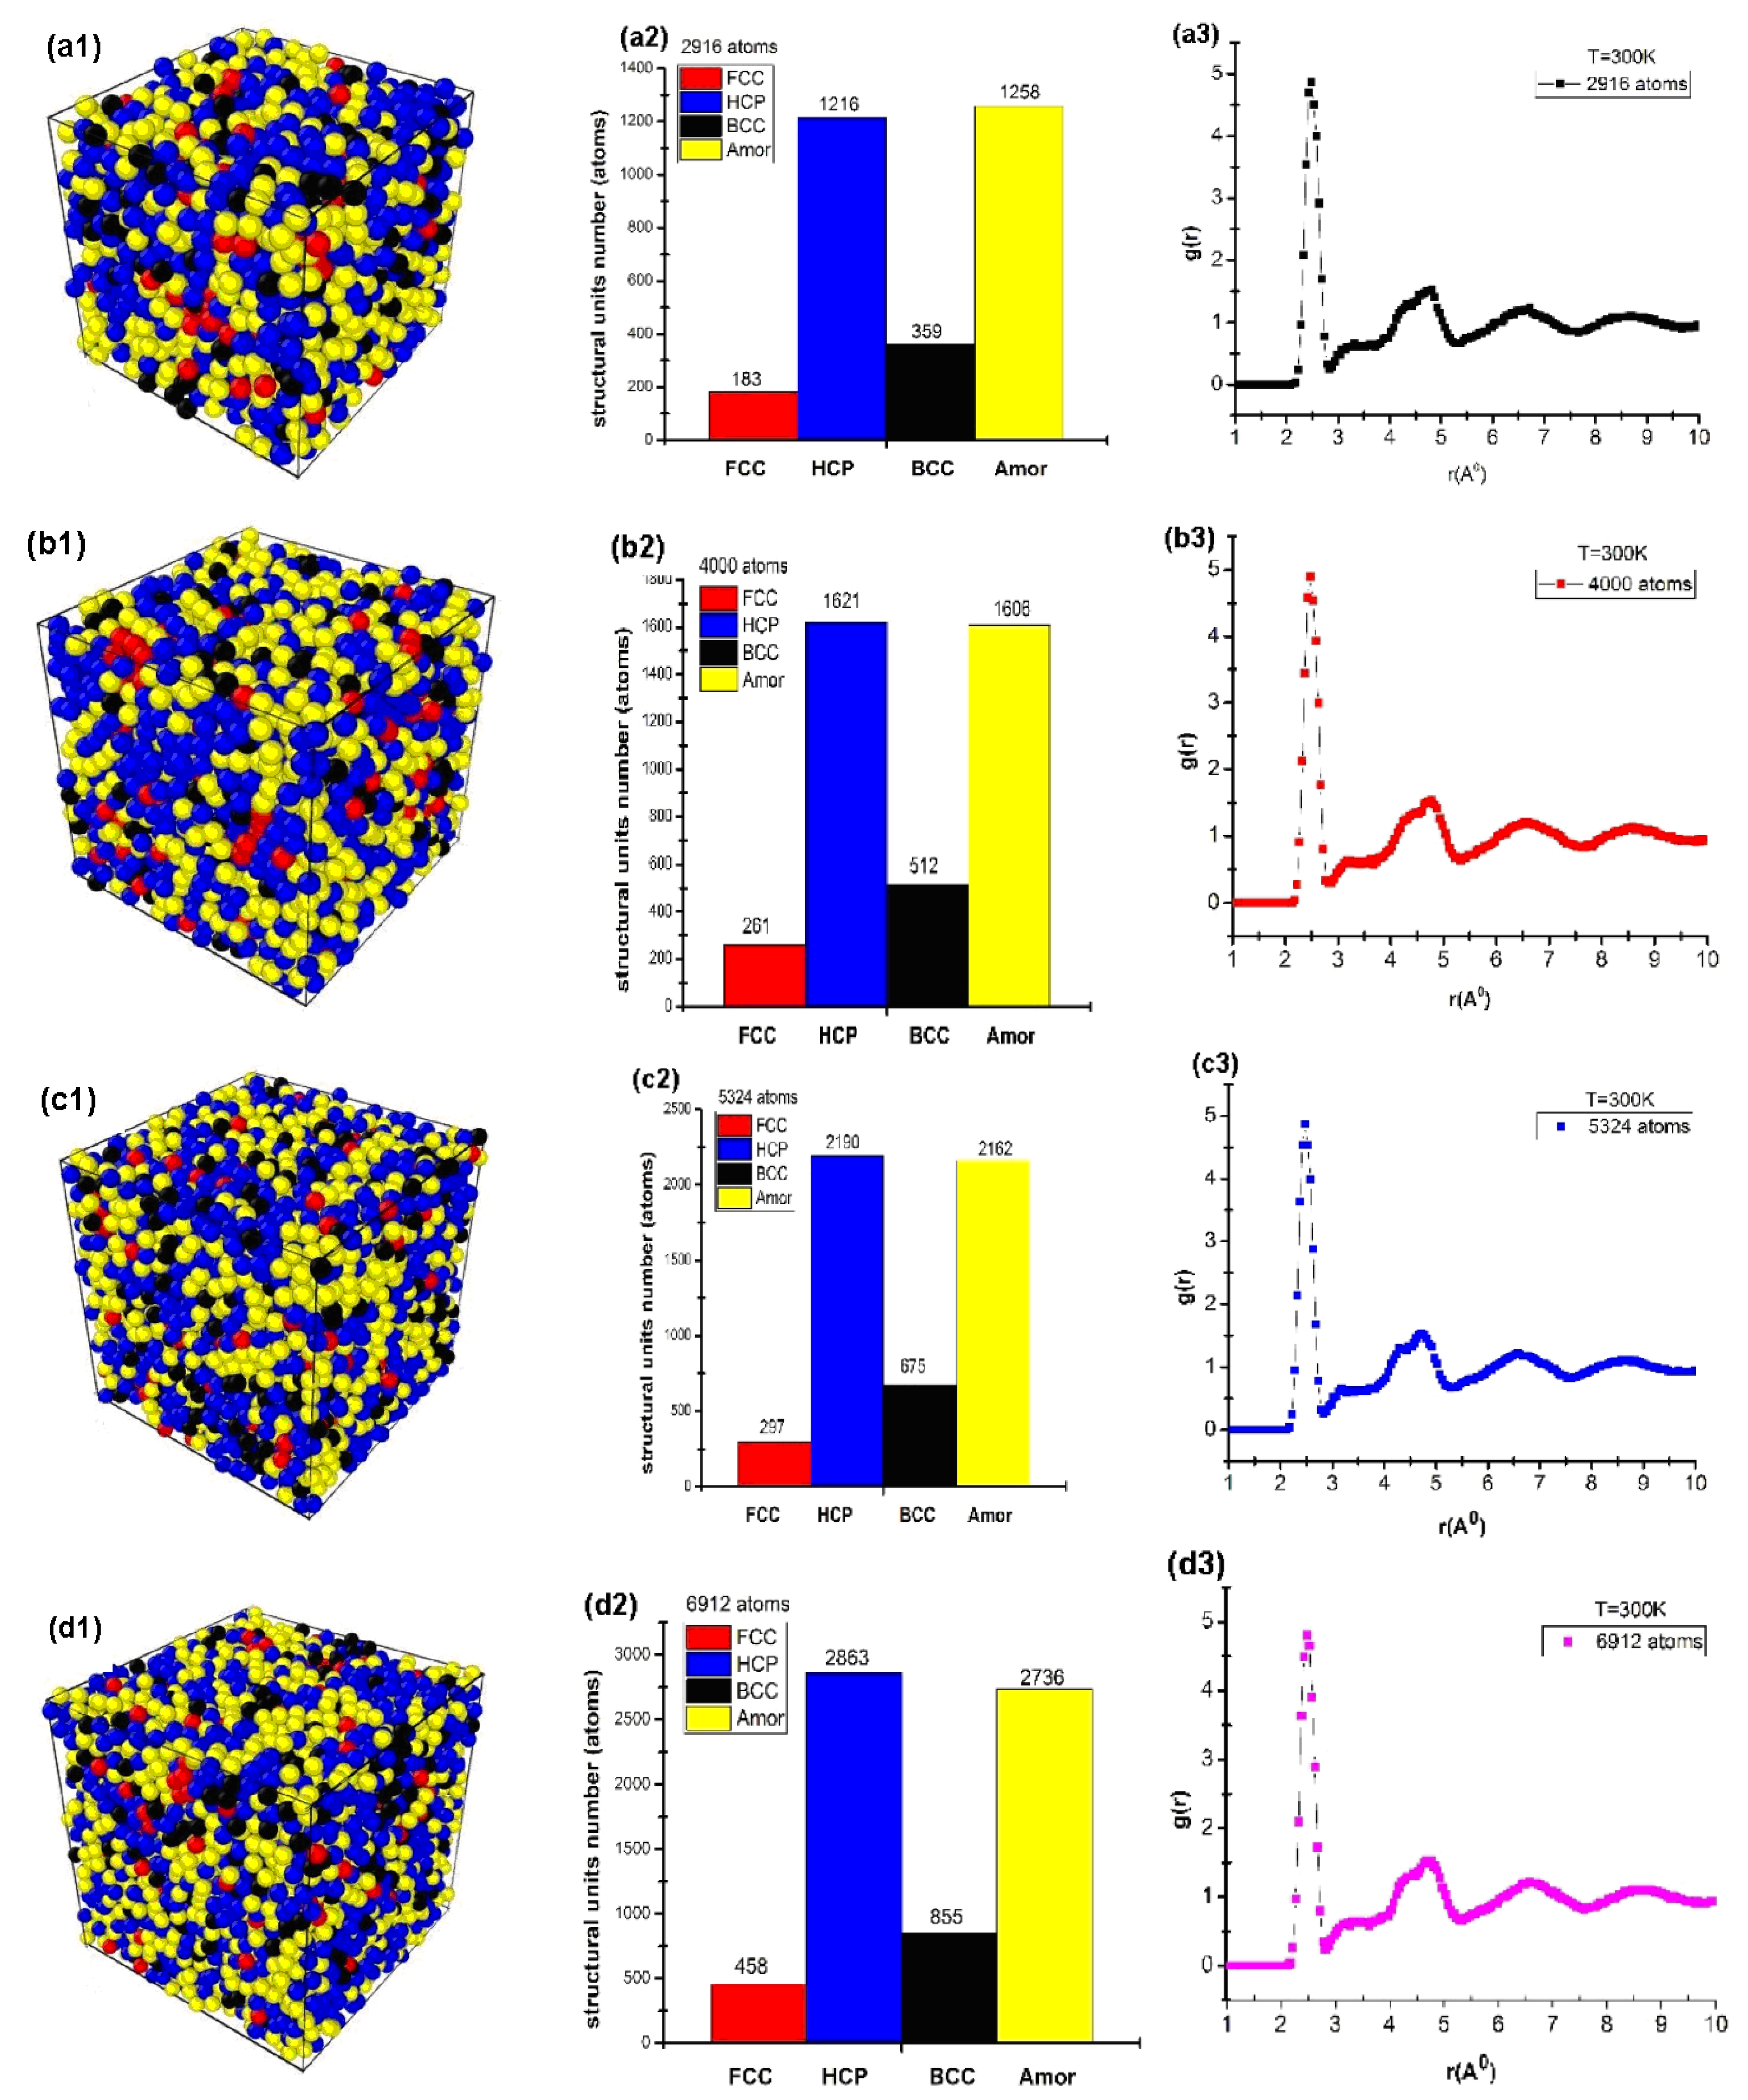
Figure 2.
Structure shape (a1,b1,c1,d1), number of structural units (a2,b2,c2,d2), and radial distribution function (a3,b3,c3,d3) of cubic Cu with different atom numbers.
The obtained results show that for the material of Cu2916 metal, the structure shape is given in Figure 2(a1); the number of structural units was shown by 183 FCC, 1216 HCP, 356 BCC, and 1258 Amor (Figure 2(a2)); the length of the links were rCu-Cu = 2.475 Å, g(r) = 4.86, l = 3.25 nm, and Etot = −9931 eV (Figure 2(a3)). When the number of atoms increased from N = 2916 (Cu2916) to N = 4000 (Cu4000), 5324 (Cu5324), and 6912 (Cu6912) atoms, the structural shape of the material changed with the FCC increase from 183 FCC to 458 FCC, HCP increased from 1216 HCP to 2863 HCP, BCC increased from 356 BCC to 855 BCC, Amor increased from 1258 Amor to 1606, 2162, and 2736 Amor (Figure 2(a2,b2,c2,d2)). r had no change, with rCu-Cu = 2.475 Å; g(r) changed from g(r) = 4.86 to g(r) = 4.80. l increased from l = 3.25 nm to l = 4.33 nm. Etot decreased from Etot = −9931 eV to Etot = −23525 eV (Figure 2(a3,b3,c3,d3)). The obtained results showed that there was a close relationship between the atom number and the size and total energy of the system (Figure 3).
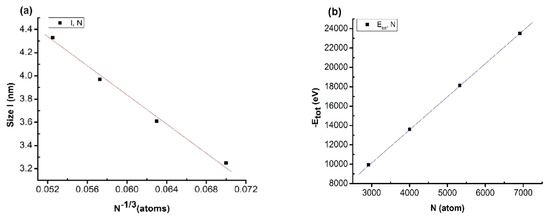
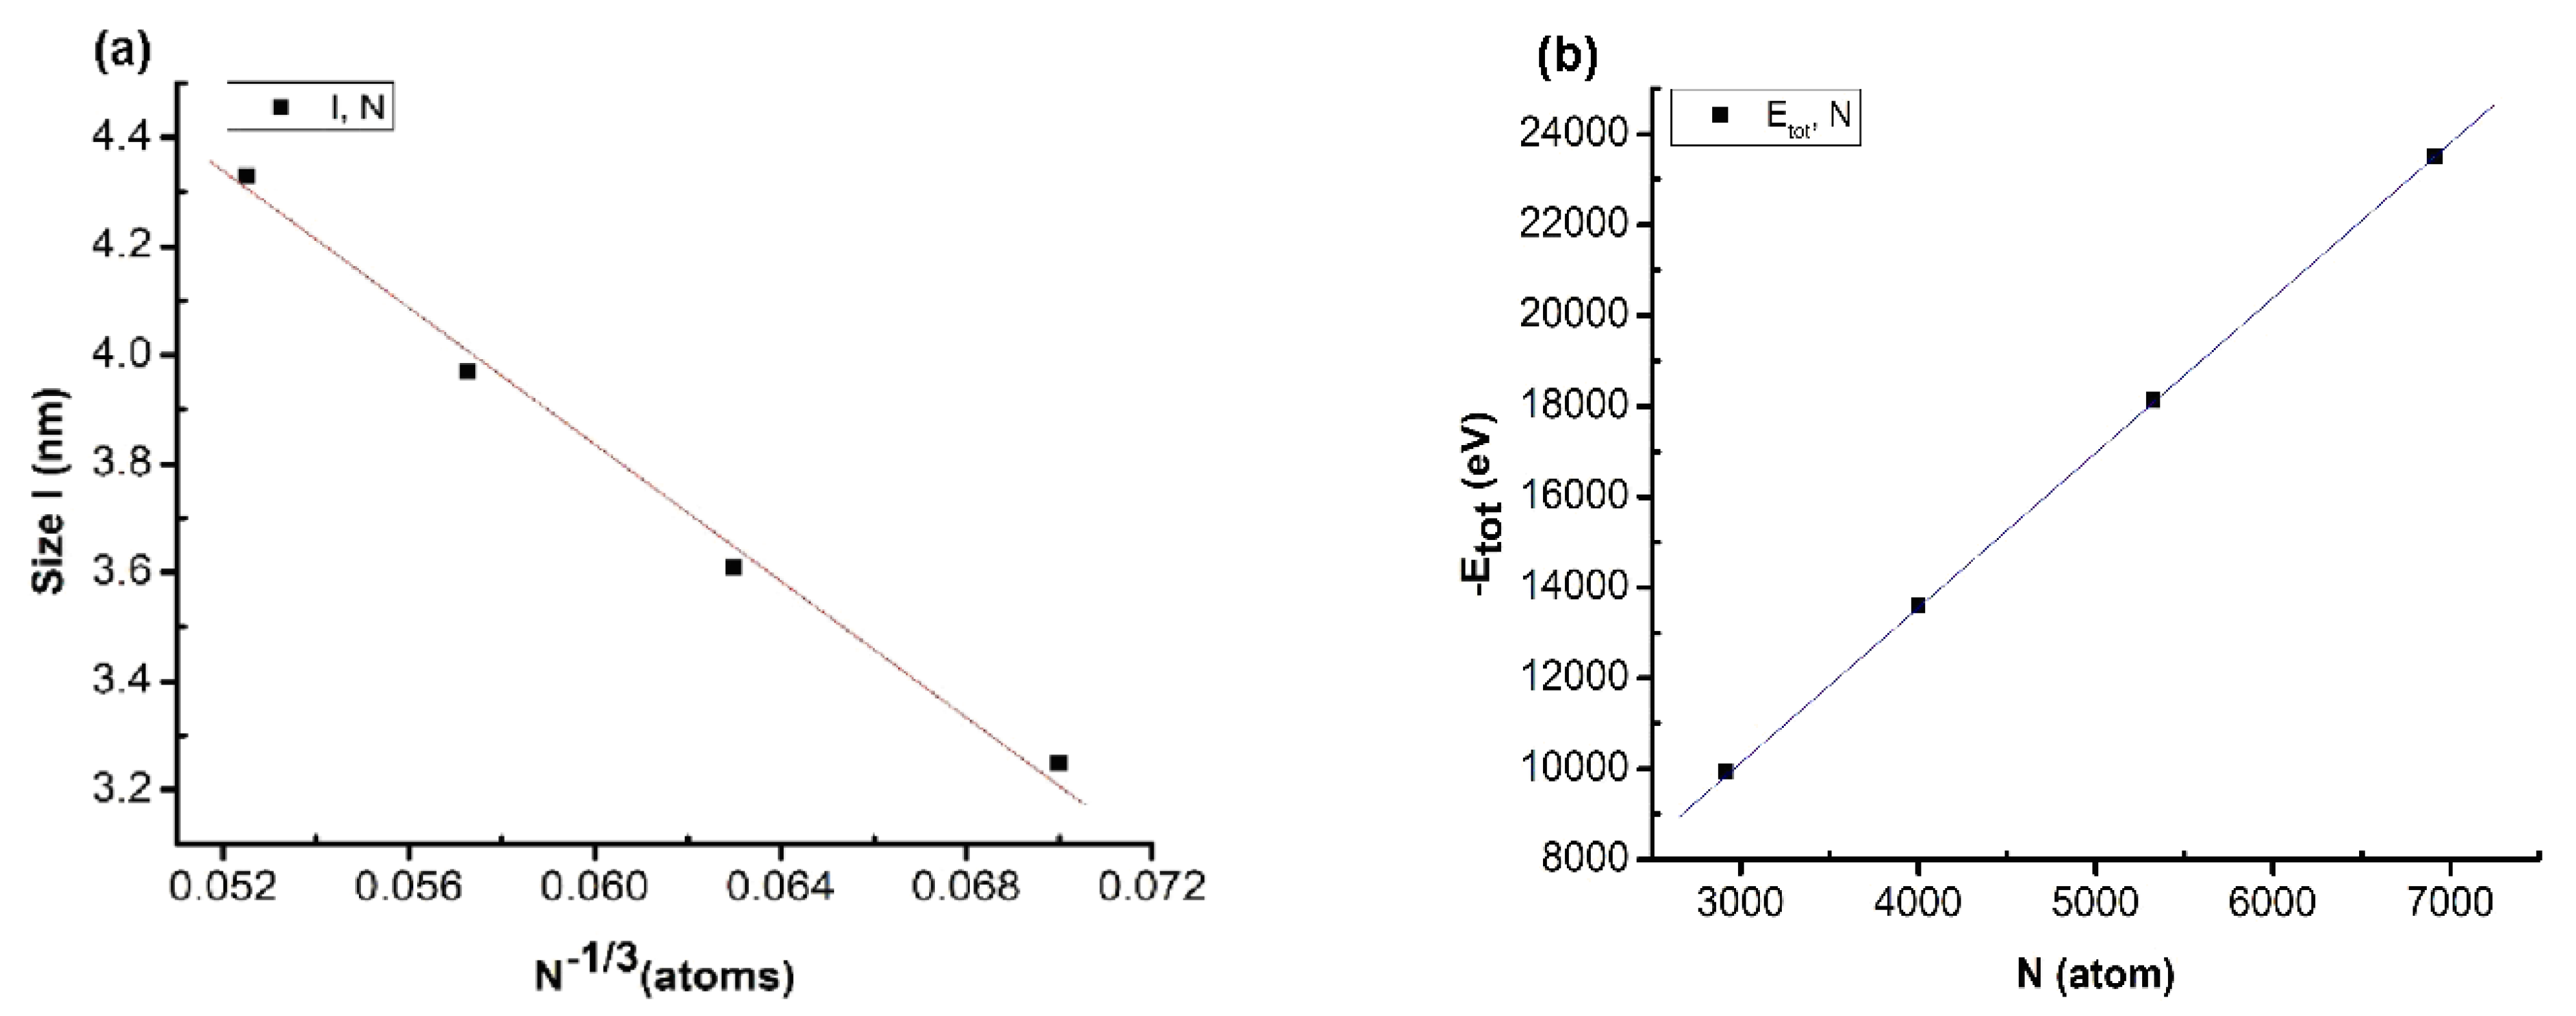
Figure 3.
Relationship between number of atoms and size (a) and between number of atoms and total energy of the system (b) when changing the atom number.
The results showed that there was a linear relationship between size (l) and the number of atoms (N), described by the expression l = 7.52–61.38N−1/3. Similarly, the total energy of the system (Etot) and number of atoms (N) is described by the expression Etot = −13.22–3.402N (Figure 3). The obtained results showed that there was an influence between the values, similar to the results for metal [42,43,62] and alloy [44,45,46,47]. In addition, the size increase of the material was confirmed by the increases in enthalpy and entropy [43]. When increasing the atom number, the size of the matter increased by the ratio l~N−1/3, and the total energy of the system decreased by the ratio Etot~N; this phenomenon is caused by the size effect and the surface effect. The results obtained will be the basis for experimentation methods to deploy future applications. To ensure the calculation speed as well as the stability of the structural features, we choose the Cu5324 material model as the standard material to investigate the influencing factors in the following sections.
3.2.2. Effect of Temperature
The effect of temperature on the structural characteristics and phase transition of bulk Cu5324 material are shown in Table 2.
Table 2.
The structural characteristics and phase transition of bulk Cu5324 material at different temperatures.
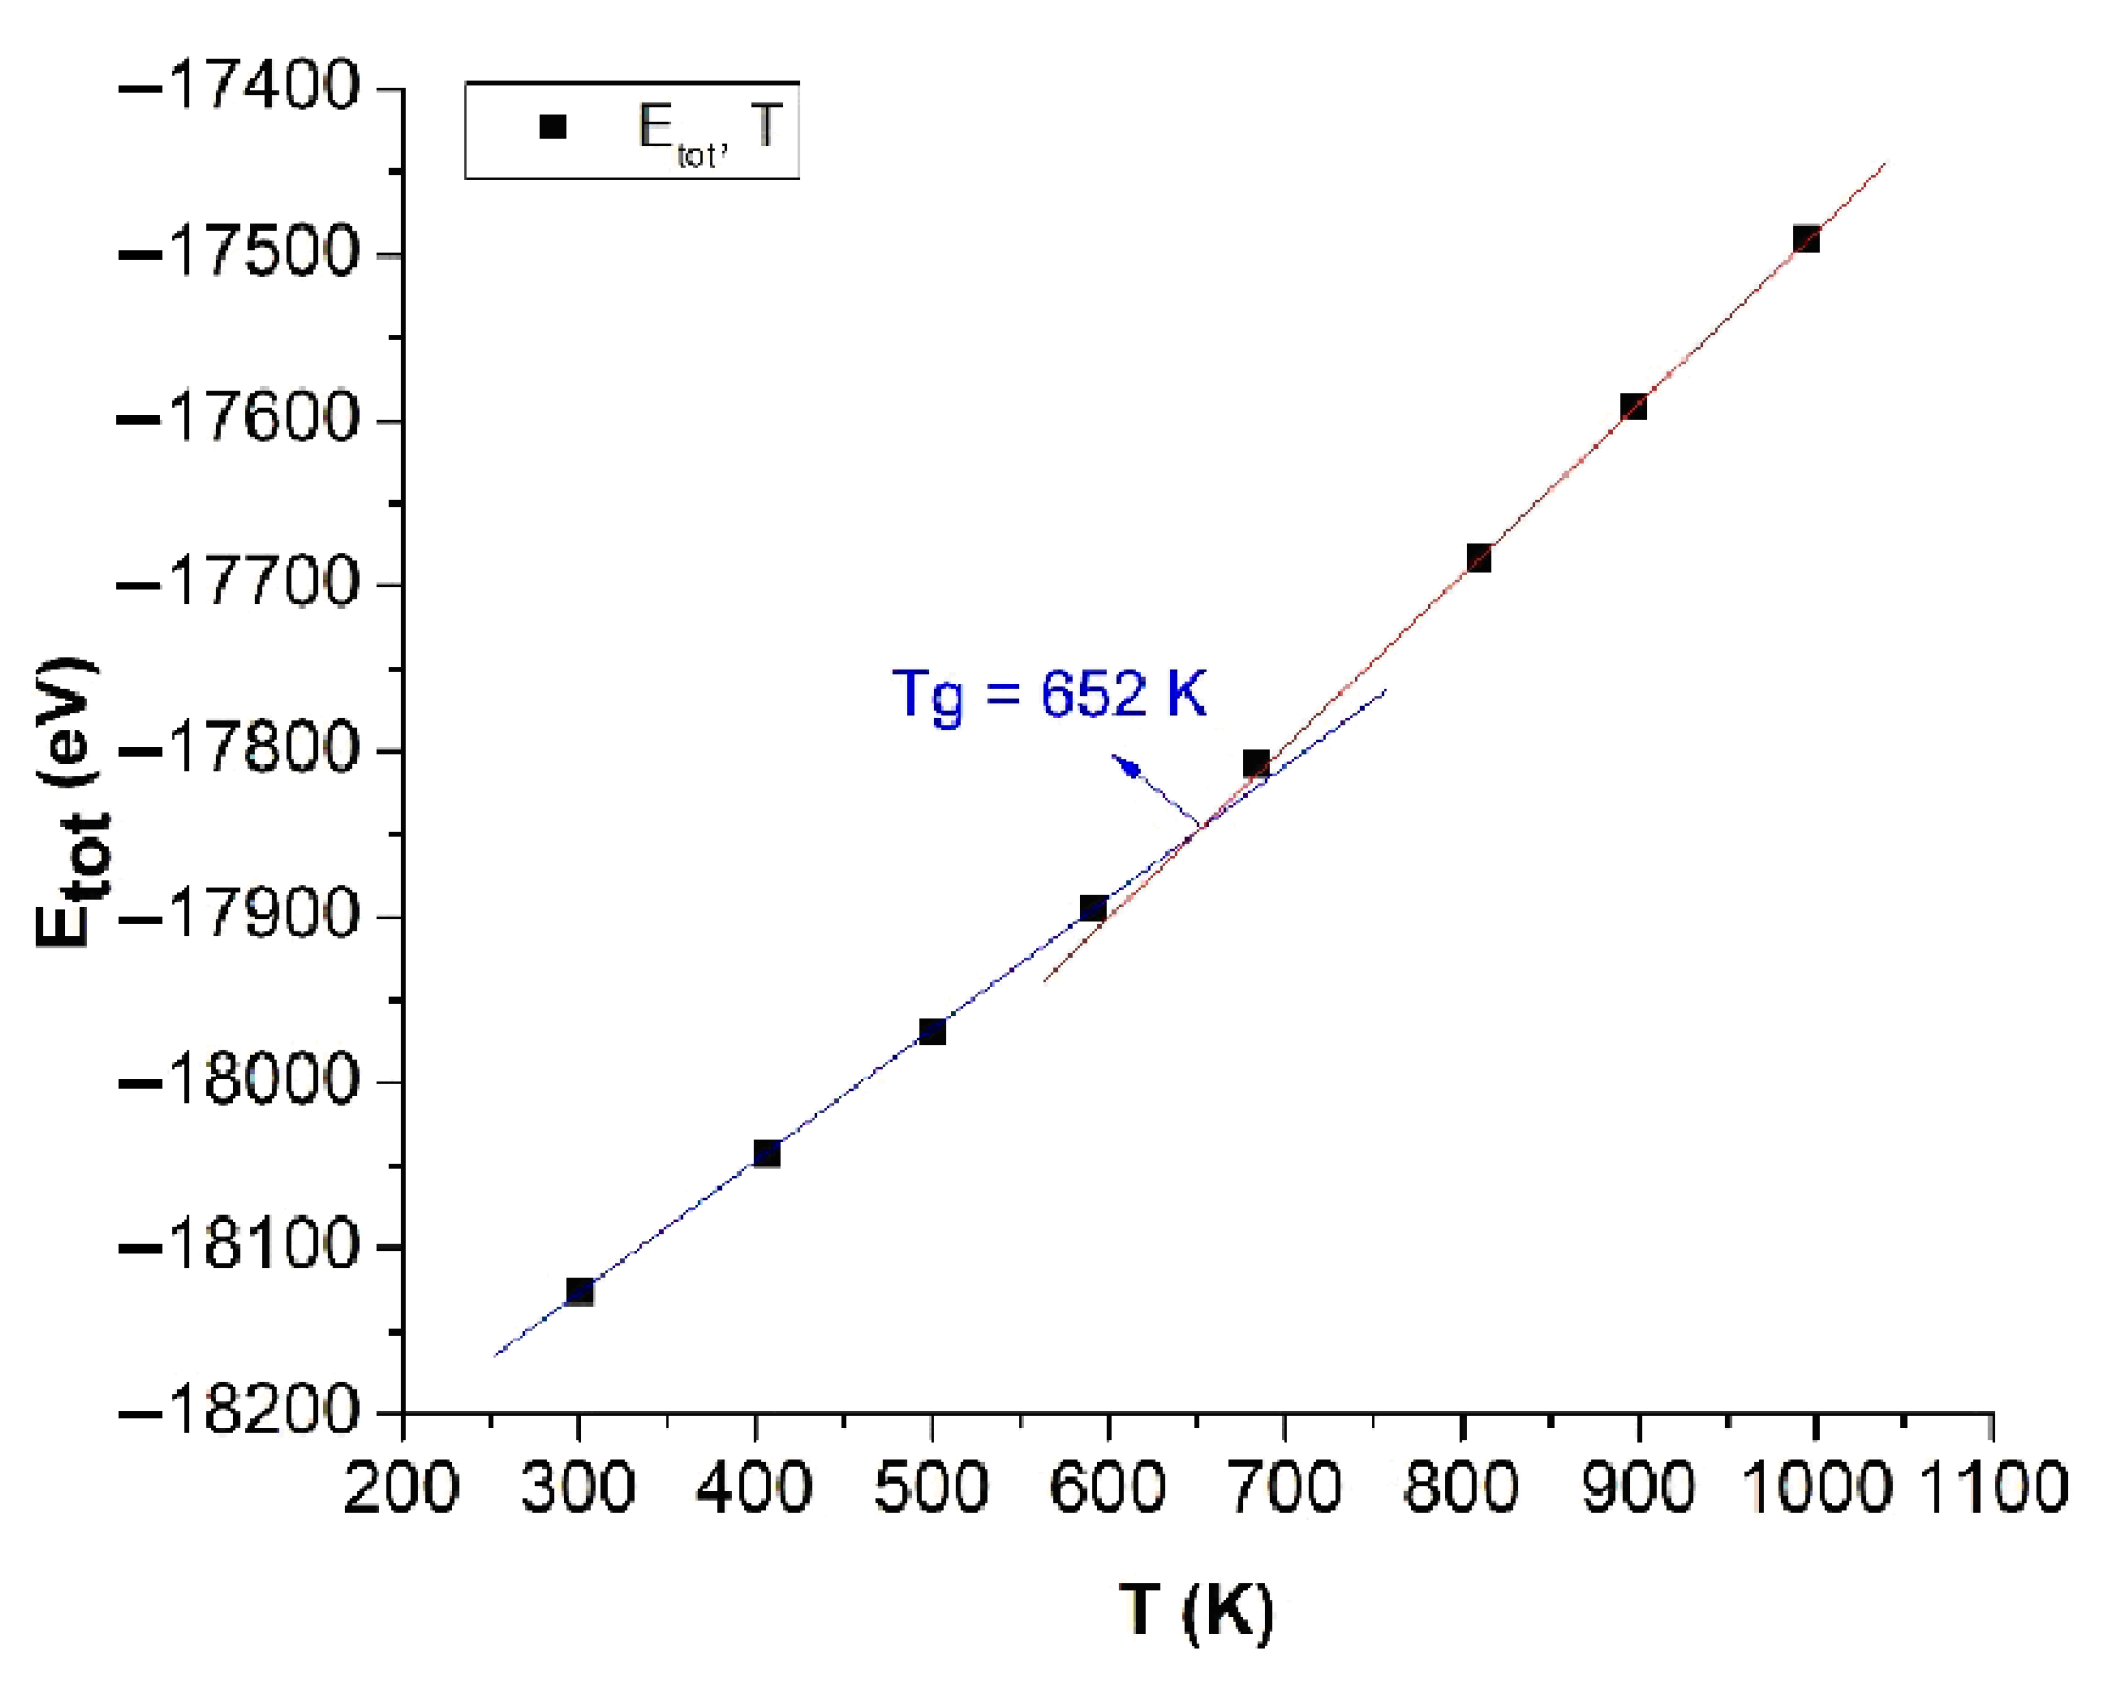
The obtained results show that when T increased from T = 300 K to T = 1000 K, the Etot decreased from Etot = −18125 eV to Etot = −17491 eV, the size l increased trivially from l = 3.970 nm to l = 3.974 nm, r decreased from rCu-Cu = 2.475 Å to rCu-Cu = 2.472 Å, and the g(r) decreased from g(r) = 4.87 to g(r) = 3.60. Correspondingly, with the number of structural units FCC, HCP decreased from 297 FCC to 163 FCC and 2190 HCP to 1779 HCP, BCC increased from 675 BCC to 794 BCC, and Amor increased from 2162 Amor to 2558 Amor (Table 2). The obtained results show that with an increase in the temperature, the length of the link of Cu-Cu decreased and was consistent with the results obtained earlier for metal [42,43,62] and alloy [44,45,46,47]. The relationship between the Etot and T is shown in Figure 4.
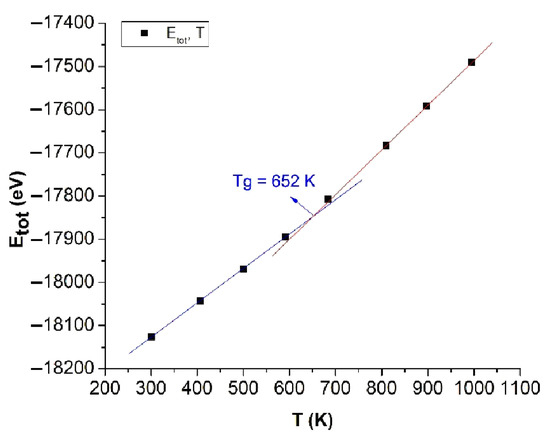
Figure 4.
The relationship between the total energy of the system and the temperature of bulk Cu5324.
The obtained results show that with increases in the temperature T, Etot always increased in linearity and was proportionally linear with T from about T = 300 K to T = 600 K and from T = 700 K to T = 1000 K. Increasing T led to l negligibly increasing; Etot increasing; the number of structural units FCC, HCP, and BCC decreasing; and Amor increasing, which indicates that approximately T = 600 K to T = 700 K is the glass temperature of bulk Cu5324 material. According to the graph results, the intersection point between the two temperature ranges is called the glass point or the glass temperature (Tg), with the value Tg = 652 K (Figure 4); the causes of this phenomenon are the size effect and the surface effect, and the phase transition of bulk Cu5324 materials is a phase transition of type 1. To determine the crystallization process of bulk Cu5324 material at the glass transition temperature Tg = 652 K, we investigated the effect of annealing time; the content will be presented in detail in the following section.
Fang et al. [85] first made a proper choice of the metal Cu as the subject of their research for analyzing the structural change from the liquid to the solid state. Instead of using the Sutto–Chen (SC) potential as the present work did, they performed an ab initio MD simulation that described the transition procedure to Cu glass and some structural features of metallic glasses. Although the number of Cu atoms was not large (150), the authors conducted a very interesting analysis that is similar to our consideration related to Figure 4. On the basis of the energy dependence of time (Figure 2 in [85]), they noticed the difference in simple deviations around the transition temperature to the glass. To determine this temperature, they took the intersection of these straight lines as 800 K, different from the one we established in the present work (see below) of 652 K, which is in good agreement with recent studies. In our opinion, this difference appeared because the number of Cu atoms of supercell considered in [85] was too small. Our simulations show that the simulation procedure using the SC potential stabilizes for numbers of atoms on the order of thousands. Meanwhile, our analysis results on the structural phase transition of bulk Cu materials were shown more in detail.
3.2.3. Effect of Annealing Time
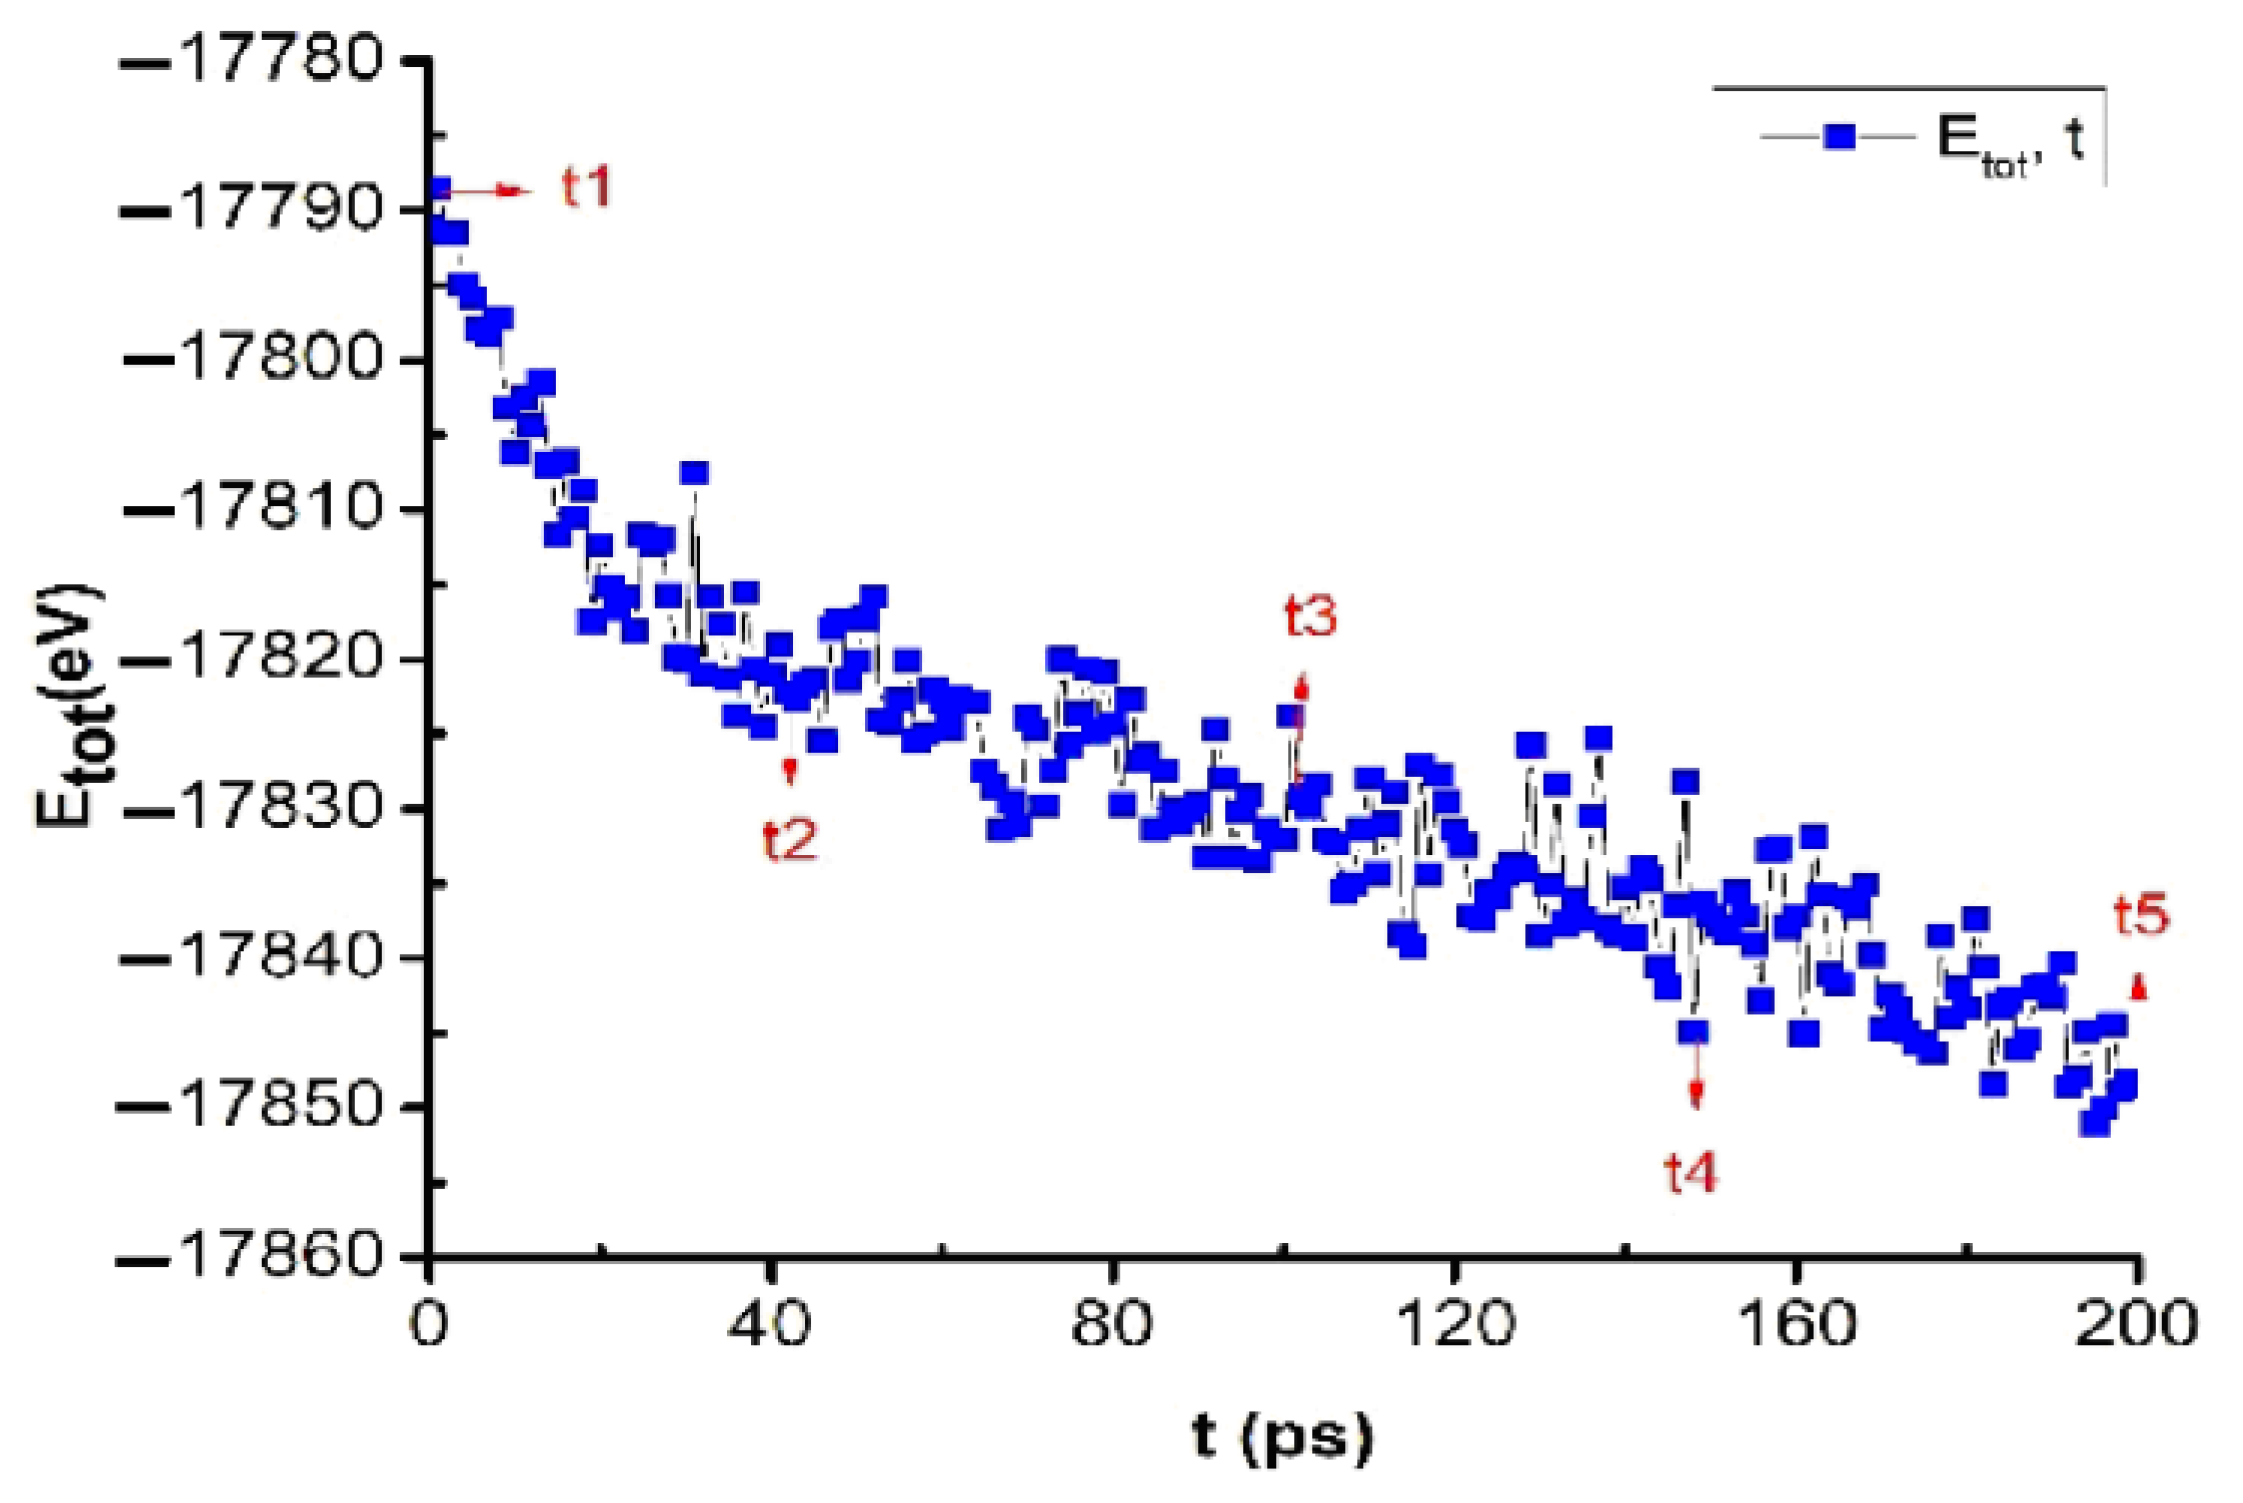
The obtained results show that when annealing the bulk Cu5324 material at the glass temperature Tg = 652 K, at t1 = 0 ps, Etot = −17791 eV. When the annealing time was increased from t1 = 0 ps to t2 = 40 ps, t3 = 100 ps, t4 = 150 ps, and t5 = 200 ps, Etot decreased from Etot = −17791 eV to Etot = −17821, −17832, −17837, and −17848 eV, which proves that when annealing at the temperature point Tg in glass, Etot decreases very quickly (Figure 5). This obtained result is completely consistent with the simulation results of previously studied metals Al [63], Fe [64], and Ag [65].
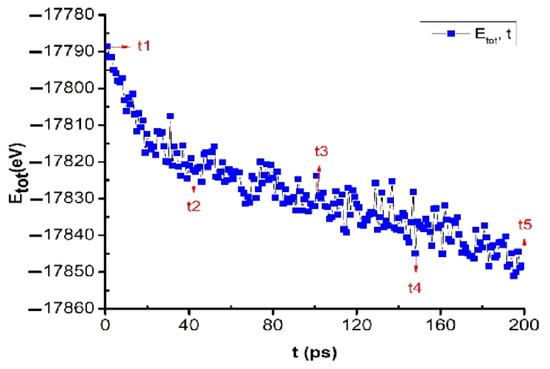
Figure 5.
The crystalline phase transition of bulk Cu5324 material at glass temperature Tg = 652 K after annealing time t = 200 ps.
Through the obtained results, it was shown that when metal was annealed at glass temperature Tg, metallic materials always tend to increase crystallization. There is a problem: in the course of experimental research, there is always the question of which point is the most standard glass temperature of a metal. To confirm the accuracy of the obtained results, we continue to study the effect of the annealing time at glass temperatures above Tg, and the results are shown in Figure 6.

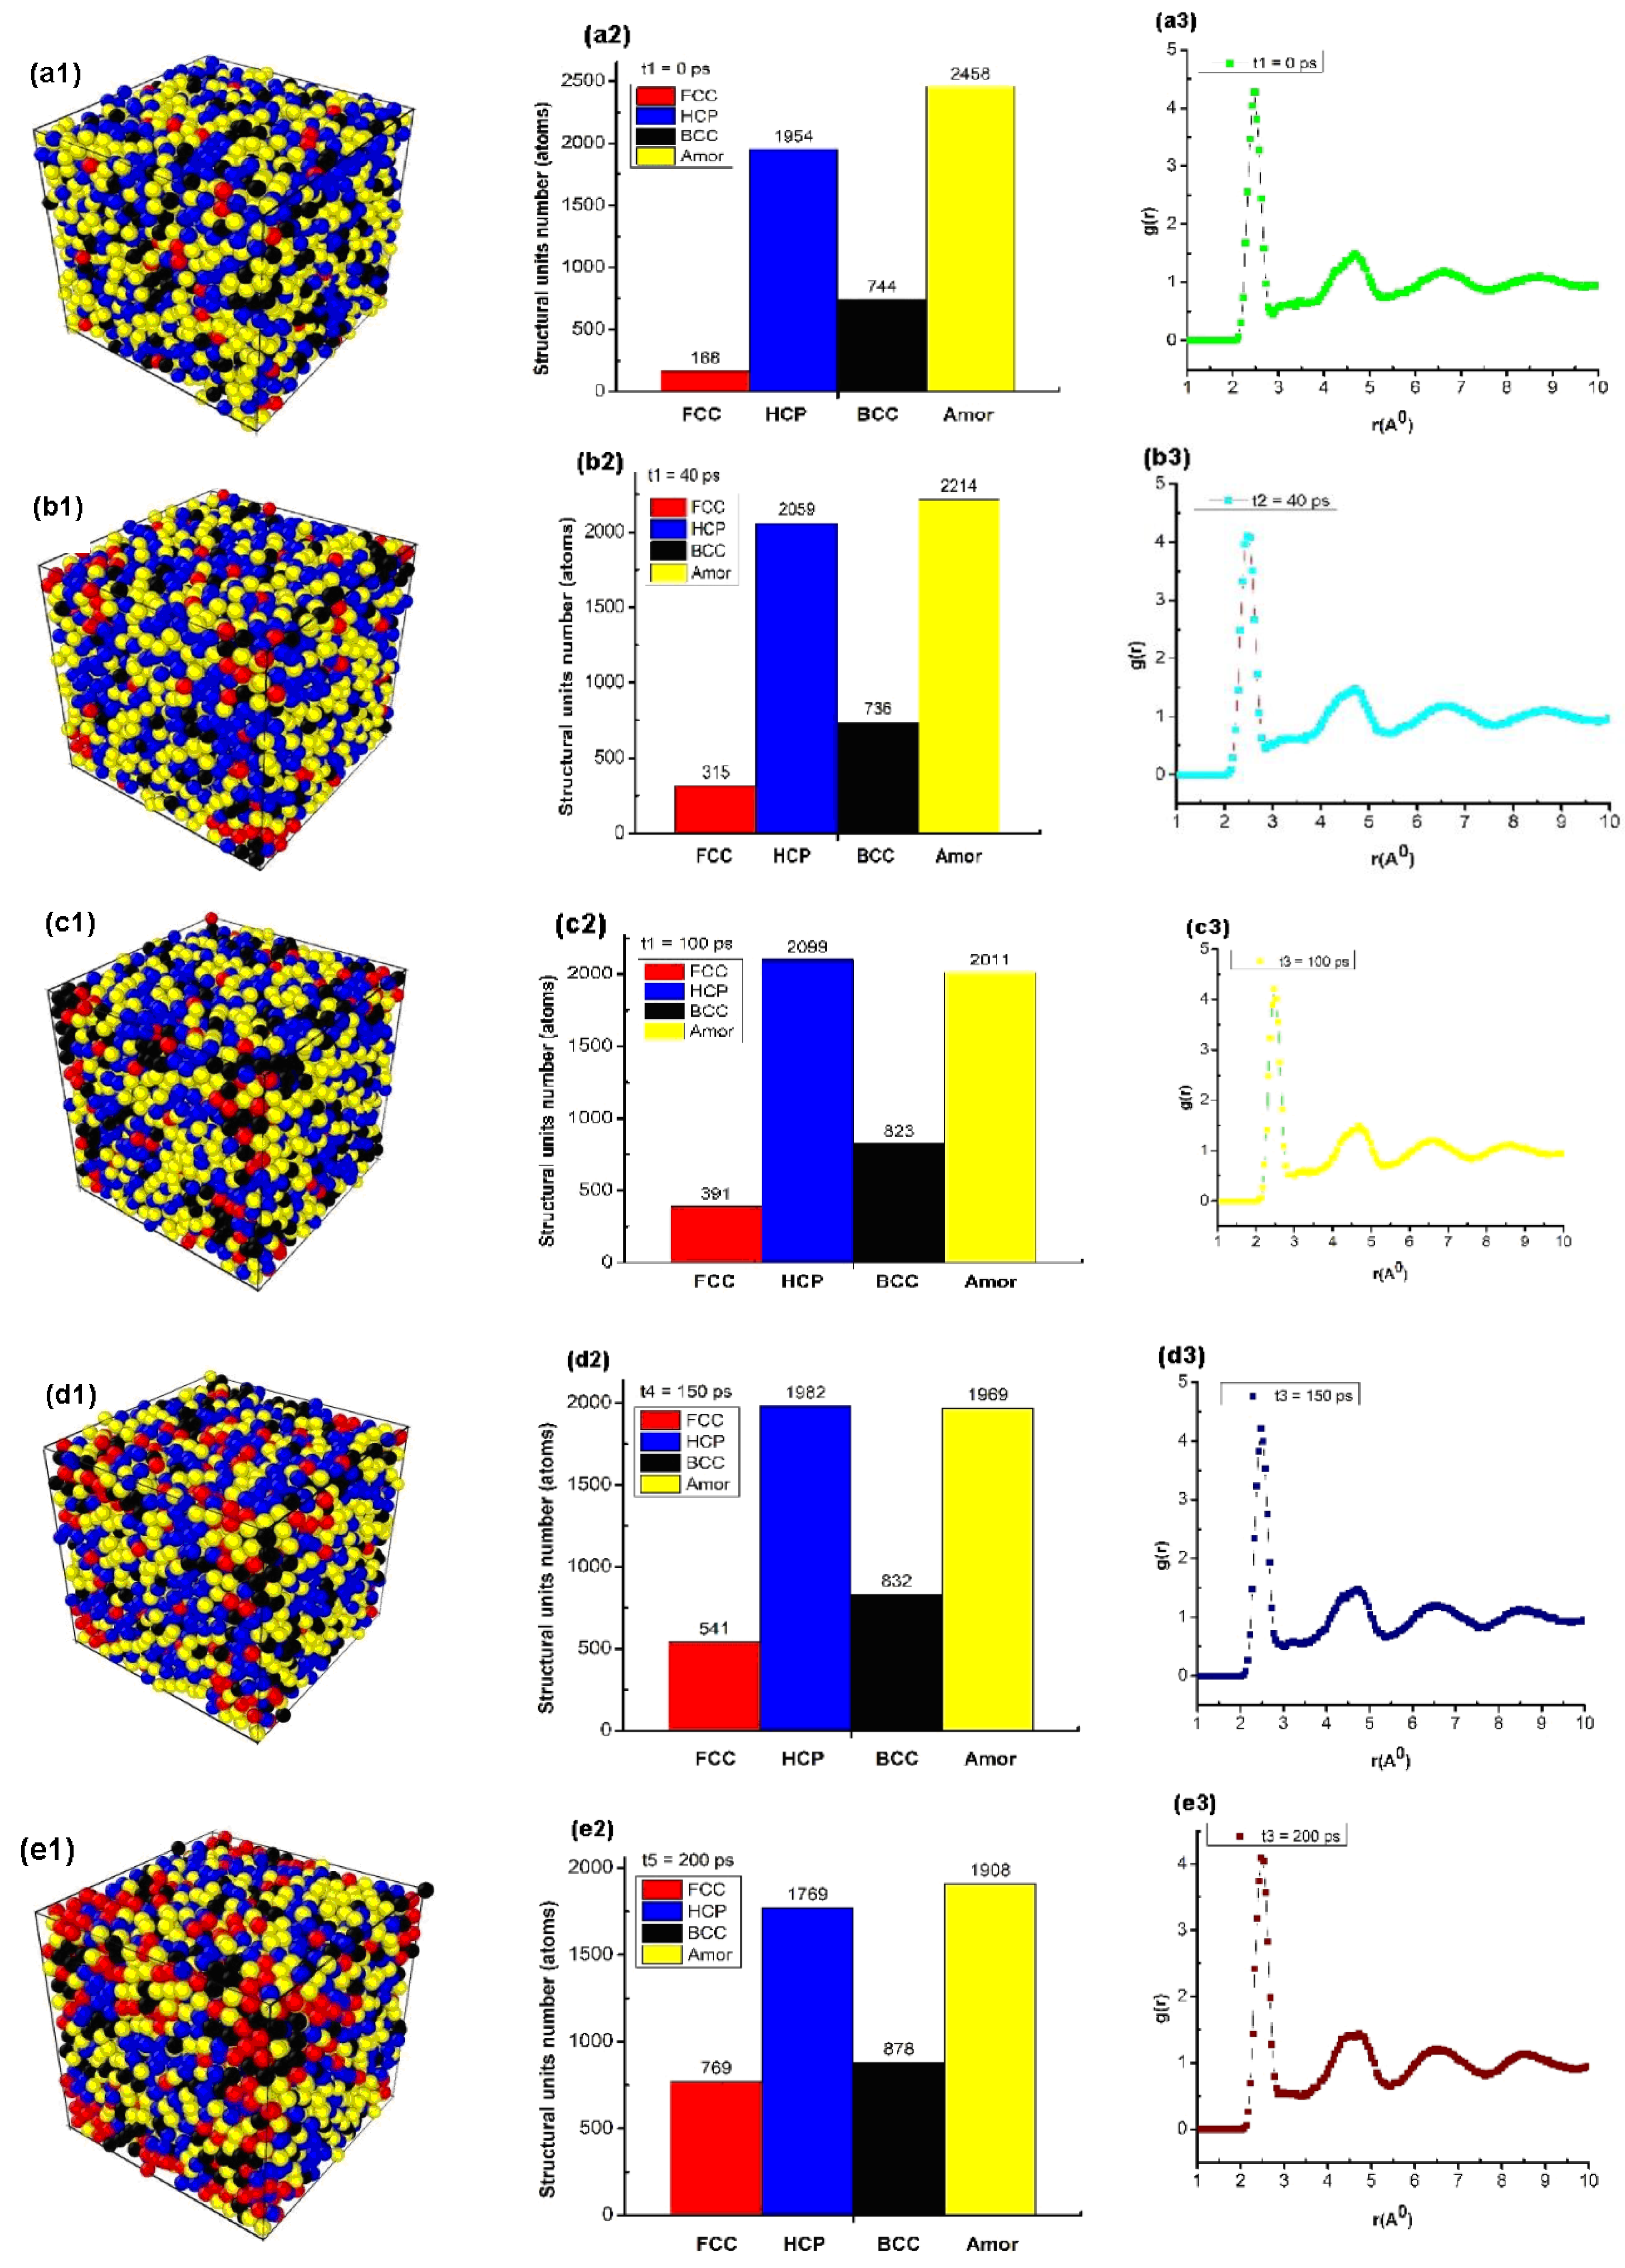
Figure 6.
Structural characteristic quantities, such as: structure shape (a1,b1,c1,d1,e1), number of structural units (a2,b2,c2,d2,e2), and radial distribution function (a3,b3,c3,d3,e3) of bulk Cu5324 material with different annealing times.
The obtained results showed that the material of bulk Cu5324 at Tg = 652 K and annealing time (t) t1 = 0 ps had a structure shape (Figure 6(a1)); the number of structural units was shown by 168 FCC, 1954 HCP, 744 BCC, and 2458 Amor (Figure 6(a2)); and length of the links rCu -Cu = 2.475 Å, g(r) = 4.31, l = 3.25 nm, and Etot = −9931 eV (Figure 6(a3)). When the annealing time increased from t1 = 0 ps to t2 = 40 ps, t3 = 100 ps, t4 = 150 ps, and t5 = 200 ps, the structural shape of the material changed (Figure 6(a1,b1,c1,d1,e1)) with the FCC increasing from 168 FCC to 769 FCC. In addition, the HCP increased from 1954 HCP to 1769 HCP, the BCC increased from 744 BCC to 878 BCC, and the Amor increases from 2458 Amor to 1908 Amor (Figure 6(a2,b2,c2,d2,e2)). Corresponding, r increased from rCu-Cu = 2.473 Å to rCu-Cu = 2.473, 2.474, 2.474, rCu-Cu = 2.475 Å, g(r) changed from about g(r) = 4.31 to g(r) = 4.12, l decreased slightly from l = 3.973 nm to l = 3.971 nm, and Etot decreased from Etot = −9931 eV to Etot = −23525 eV (Figure 6(a3,b3,c3,d3,e3)). The obtained results show that when increasing the annealing time, the length of the link of Cu-Cu increased from rCu-Cu = 2.473 Å to rCu-Cu = 2.475 Å, consistent with the results obtained earlier for metal [42,43,62] and alloy [44,45,46,47]. The obtained results showed that after the annealing time at the glass temperature, the crystallization process increased.
As has been emphasized in [38,85], several kinds of crystalline structures, HCP, BCC, and FCC, can exist in simulations of different quenching processes (for different heating rates) and even of used potentials. It is well-known that in the imperfect crystallization of Cu, the FCC structure should be dominated, but in [85], the authors used the bond pair analysis technique to show that icosahedral, BCC, and tetrahedral SRO were dominant in the glass state for the quenching rate, with an average cooling rate of 2 × 10¹⁴ K/s, and that during the rapid quenching process of Cu, there may exist an intermediate BCC phase between the fully amorphous phase and the FCC phase. By contrast, under an average cooling rate of 4.0 × 10¹³ K/s, the liquid Cu crystallized into the FCC phase as it should. In [38], the authors concluded that at a cooling rate of 5 × 10¹² K/s and lower, the studied metals started to crystallize directly on cooling. High critical cooling rate values indicate the high instability of the supercooled liquid. The difference could be connected with the type of potentials used. In the analysis of Figure 6b in this paper, one can see that BCC and hexagonal close-packed (HCP) atomic arrangements are also found in Cu to approximately the same degree as FCC. Thus, the crystal morphology depends strongly on the quenching rate and simulation models used. In our paper, we see that when the annealing time increases, the structural shape of the material changes in relation to the FCC increases. Therefore, we predict that if we increased the annealing time more and simulate a larger number of Cu atoms as in [38], we would have domination of FCC structure. To prove this prediction is beyond the initial purpose of the current paper, and further work should be performed in a future publication. Nevertheless, the recently obtained results will serve as the basis for future experimental research.
4. Conclusions
The molecular kinetics method shows that there are factors affecting the structural characteristics of bulk Cu materials, such as the number of atoms, temperature, and annealing time. To determine these characteristics, we used the Sutton–Chen embedded force field to determine the interaction force between atoms, combined with periodic boundary conditions and the Velvet algorithm. At equilibrium, bulk Cu materials always have four types of structural units: FCC, HCP, BCC, and Amor. When increasing the number of atoms (N), leading to an increase in size (l), the total energy of the system (Etot) decreased; while increasing the annealing time (t), l decreased and Etot decreased. As the temperature (T) increased, l increased, and Etot increased. In addition, if t was increased at T = 652 K, the number of FCC, HCP, BCC structural units increased sharply; Amor decreased the most; and the glass transition temperature of bulk Cu material was Tg = 652 K. That determines the effect of N, T, and t on the structure and phase transition, crystallization of bulk Cu material. Correspondingly, with Cu-Cu bond lengths increasing in the range of rCu-Cu = 2.473 Å to rCu-Cu = 2.475 Å with increasing t and decreasing from rCu-Cu = 2.475 Å to rCu-Cu = 2.472 Å with increasing T. The obtained results are completely consistent with previous experimental and simulation results. In addition, as N increased, the l of the material was always proportional to N−1/3, and the total Etot energy was always proportional to N. However, the obtained results showed that the bulk Cu5324 material had a glass temperature (Tg) = 652 K. When the material was thermally annealed at Tg = 652 K after time (t), t = 200 ps had an increase in crystallinity; as the number of structural units FCC, HCP, and BCC increased, Amor decreased, these results are completely consistent with previous studies. Finally, the phase transition and crystallization increase at the glass temperature Tg = 652 K of the bulk Cu5324 material are still unclear and need to be studied further in the future to explain and elucidate why this occurs in the upper and lower temperature ranges of the glass temperature. The obtained results serve as a basis for future research directions of new materials.
Author Contributions
Conceptualization, D.N.T.; methods, D.N.T.; validation, D.N.T.; investigation, D.N.T.; writing—original draft preparation and review, D.N.T., V.C.L. and Ş.Ţ.; writing—review and editing, D.N.T., V.C.L. and Ş.Ţ.; data curation, V.C.L. All authors have read and agreed to the published version of the manuscript.
Funding
The funders had no role in the design of the study; in the collection, analyses, or interpretation of the data; in the writing of the manuscript; or in the decision to publish the results.
Institutional Review Board Statement
Not applicable.
Informed Consent Statement
Not applicable.
Data Availability Statement
The data that supports the findings of this study are available from the corresponding author upon reasonable request.
Conflicts of Interest
The authors declare no conflict of interest.
References
- Kawasaki, H.; Kosaka, Y.; Myoujin, Y.; Narushima, T.; Yonezawa, T.; Arakawa, R. Microwave-assisted polyol synthesis of copper nanocrystals without using additional protective agents. Chem. Commun. 2011, 47, 7740–7742. [Google Scholar] [CrossRef] [PubMed] [Green Version]
- Anzlvar, A.; Orel, Z.C.; Zigon, M. Copper(I) oxide and metallic copper particles formed in 1,2-propane diol. J. Eur. Ceram. Soc. 2007, 27, 987–991. [Google Scholar] [CrossRef]
- Ghodselahi, T.; Vesaghi, M.A.; Shafiekhani, A. Study of surface plasmon resonance of Cu@Cu2O core–shell nanoparticles by Mie theory. J. Phys. D Appl. Phys. 2009, 42, 015308. [Google Scholar] [CrossRef]
- Wei, W.; Lu, Y.; Chen, W.; Chen, S. One-pot synthesis, photoluminescence, and electrocatalytic properties of subnanometer-sized copper clusters. J. Am. Chem. Soc. 2011, 133, 2060–2063. [Google Scholar] [CrossRef] [PubMed]
- Vidal, N.V.; Blanco, M.C.; López-Quintela, M.A.; Rivas, J.; Serra, C. Electrochemical synthesis of very stable photoluminescent copper clusters. J. Phys. Chem. C 2010, 114, 15924–15930. [Google Scholar] [CrossRef]
- Vazquez, C.; Banobre-Lopez, M.; Mitra, A.; Lopez-Quintela, M.A.; Rivas, J. Synthesis of small atomic copper clusters in microemulsions. Langmuir 2009, 25, 8208–8216. [Google Scholar] [CrossRef] [PubMed]
- Kumar, R.V.; Mastai, Y.; Diamant, Y.; Gedanken, A. Sonochemical synthesis of amorphous Cu and nanocrystalline Cu2O embedded in a polyaniline matrix. J. Mater. Chem. 2001, 11, 1209–1213. [Google Scholar] [CrossRef]
- Chen, J.H.; Zheng, Q.Y.; Zhou, Z.Y.; Ding, C.; Piao, Z.Y. Molecular dynamics simulation of monocrystalline copper nanoscratch process under the excitation of ultrasonic vibration. Mater. Res. Express. 2021, 8, 046507. [Google Scholar]
- Arman, A.; Ţălu, Ș.; Luna, C.; Ahmadpourian, A.; Naseri, M.; Molamohammadi, M. Micromorphology characterization of copper thin films by AFM and fractal analysis. J. Mater. Sci. Mater. Electron. 2015, 26, 9630–9639. [Google Scholar] [CrossRef]
- Ţălu, Ș.; Solaymani, S.; Bramowicz, M.; Kulesza, S.; Ghaderi, A.; Shahpouri, S.; Elahi, S.M. Effect of electric field direction and substrate roughness on three-dimensional self-assembly growth of copper oxide nanowires. J. Mater. Sci. Mater. Electron. 2016, 27, 9272–9277. [Google Scholar] [CrossRef]
- Jafari, A.; Tahani, K.; Dastan, D.; Asgary, S.; Shi, Z.; Yin, X.T.; Zhou, W.D.; Garmestani, H.; Ţălu, Ș. Ion implantation of copper oxide thin films; statistical and experimental results. Surf. Interfaces 2020, 18, 100463. [Google Scholar] [CrossRef]
- Galassi, R.; Ghimire, M.M.; Otten, B.M.; Ricci, S.; McDougald, R.N.; Almotawa, R.M.; Alhmoud, D.; Ivy, J.F.; Rawashdeh, A.M.M.; Nesterov, V.N.; et al. Cupriphication of gold to sensitize d10–d10 metal–metal bonds and near-unity phosphorescence quantum yields. Proc. Natl. Acad. Sci. USA 2017, 114, E5042. [Google Scholar] [CrossRef] [Green Version]
- Yang, X.; Ma, X.; Moering, J.; Zhou, H.; Wang, W.; Gong, Y.; Tao, J.; Zhu, Y.; Zhu, X. Influence of gradient structure volume fraction on the mechanical properties of pure copper. Mater. Sci. Eng. A 2015, 645, 280–285. [Google Scholar] [CrossRef]
- Yin, Z.; Yang, X.; Ma, X.; Moering, J.; Yang, J.; Gong, Y.; Zhu, Y.; Zhu, X. Strength and ductility of gradient structured copper obtained by surface mechanical attrition treatment. Mater. Des. 2016, 105, 89–95. [Google Scholar] [CrossRef]
- Zhou, H.; Qu, S. Investigation of atomistic deformation mechanism of gradient nano twinned copper using molecular dynamics simulation method. Acta Metall. Sin. Chin. Ed. 2014, 50, 226–230. [Google Scholar]
- Li, C.J.; Yen, Z.W.; Wen, Y.H.; Ko, S.H.; Cheng, H.T.; Ching, T.H.; Huang, S.T. Melting and Recrystallization of Copper Nanoparticles Prepared by Microwave-Assisted Reduction in the Presence of Triethylenetetramine. Materials 2020, 13, 1507. [Google Scholar]
- Deng, S.Q.; Godfrey, A.; Liu, W.; Hansen, N. A gradient nanostructure generated in pure copper by platen friction sliding deformation. Scr. Mater. 2016, 117, 41–45. [Google Scholar] [CrossRef] [Green Version]
- Dang, T.M.D.; Le, T.T.T.; Blanc, E.F.; Dang, M.C. Synthesis and optical properties of copper nanoparticles prepared by a chemical reduction method. Adv. Nat. Sci. Nanosci. Nanotechnol. 2011, 2, 015009. [Google Scholar] [CrossRef]
- Blosi, M.; Albonetti, S.; Dondi, M.; Martelli, C.; Baldi, G. Microwave-assisted polyol synthesis of Cu nanoparticles. J. Nanopart. Res. 2011, 13, 127–138. [Google Scholar] [CrossRef]
- Visurraga, J.D.; Plessing, C.V.; Daza, C.; Pozo, C.; Becerra, A.; Garcia, A. Study on antibacterial alginatestabilized copper nanoparticles by FT-IR and 2D-IR correlation spectroscopy. Int. J. Nanomed. 2012, 7, 3597–3612. [Google Scholar] [CrossRef] [Green Version]
- Chow, G.M.; Schoen, P.E.; Kurihara, L.K. Nanostructured Metallic Powders and Films via an Alcoholic Solvent Process. U.S. Patent No. 5,759,230, 2 June 1998. [Google Scholar]
- Kurihara, L.K.; Chow, G.M.; Schoen, P.E. Nanocrystalline metallic powders and films produced by the polyol method. NanaShuchued Mater. 1995, 5, 607–613. [Google Scholar] [CrossRef]
- Tseng, P.H.; Wang, Y.Z.; Hsieh, T.H.; Ho, K.S.; Tsai, C.H.; Chen, K.T. Preparation of low size copper nanoparticles by microwave irradiation in the presence of triethylene tetramine. Nanotechnology 2018, 29, 085603. [Google Scholar] [CrossRef] [PubMed]
- Xin, Z.; Xiuyan, L.; Lu, K. Size Dependence of Grain Boundary Migration in Metals under Mechanical Loading. Phys. Rev. Lett. 2019, 122, 126101. [Google Scholar]
- Li, Y.; Liang, H.; Zhang, X. Molecular Dynamics Simulation of Local Structure Evolution in Cu Amorphous during Uniaxial Tension and Compression. Mater. Trans. 2018, 59, 172–175. [Google Scholar] [CrossRef] [Green Version]
- Weller, K.; Zotov, N.; Wang, Z.M.; Jeurgens, L.P.H.; Mittemeijer, E.J.J. Atomic structure, electronic structure and thermal stability of amorphous AlxZr1−x (0.26 ≤ x ≤ 0.75). J. Non-Cryst. Solids 2015, 427, 104–113. [Google Scholar] [CrossRef]
- Fortner, J.; Lannin, J.S. Radial distribution functions of amorphous silicon. Phys. Rev. B 1989, 39, 5527–5530. [Google Scholar] [CrossRef] [PubMed]
- Kart, H.H.; Yildirim, H.; Kart, S.O.; Çağin, T. Physical properties of Cu nanoparticles: A molecular dynamics study. Mater. Chem. Phys. 2014, 147, 204–212. [Google Scholar] [CrossRef]
- Shimizu, F.; Ogata, S.; Li, J. Theory of Shear Banding in Metallic Glasses and Molecular Dynamics Calculations. Mater. Trans. 2007, 48, 2923–2927. [Google Scholar] [CrossRef] [Green Version]
- Borovikov, V.; Mendelev, M.I.; King, A.H.; LeSar, R. Effects of Stable and Unstable Stacking Fault Energy on Dislocation Nucleation in Nano-Crystalline Metals. Model. Simul. Mater. Sci. Eng. 2016, 24, 085017–085032. [Google Scholar] [CrossRef]
- Salehinia, I.; Bahr, D.F. Crystal orientation effect on dislocation nucleation and multiplication in FCC single crystal under uniaxial loading. Int. J. Plast. 2014, 52, 133–146. [Google Scholar] [CrossRef]
- Tschopp, M.A.; McDowell, D.L. Influence of single crystal orientation on homogeneous dislocation nucleation under uniaxial loading. J. Mech. Phys. Solids 2008, 56, 1806–1830. [Google Scholar] [CrossRef]
- Mishin, Y.; Mehl, M.J.; Papaconstantopoulos, D.A.; Voter, A.F.; Kress, J.D. Structural stability and lattice defects in copper: Ab initio, tight-binding, and embedded-atom calculations. Phys. Rev. B 2001, 63, 224106. [Google Scholar] [CrossRef] [Green Version]
- Tuan, T.Q.; Dung, N.T. Molecular dynamics studies the effects of the ’earth’s surface depth on the heterogeneous kinetics of MgSiO3. Results Phys. 2019, 15, 102671. [Google Scholar]
- Dung, N.T. Factors affecting the earth’s surface on heterogeneous dynamics of CaSiO3 Material. Mater. Sci. Eng. B 2020, 260, 114648. [Google Scholar]
- Dung, N.T.; Van, C.L. Factors affecting the depth of the Earth’s surface on the heterogeneous dynamics of Cu1−xNix alloy, x = 0.1, 0.3, 0.5, 0.7, 0.9 by Molecular Dynamics simulation method. Mater. Today Commun. 2021, 29, 102812. [Google Scholar]
- Mendelev, M.I.; Kramer, M.J.; Becker, C.A.; Asta, M. Analysis of semi-empirical interatomic potentials appropriate for simulation of crystalline and liquid Al and Cu. Philos. Mag. 2008, 88, 1723–1730. [Google Scholar] [CrossRef]
- Louzguine-Luzgin, D.V.; Bazlov, A.I. Crystallization of FCC and BCC Liquid Metals Studied by Molecular Dynamics Simulation. Metals 2020, 10, 1532. [Google Scholar] [CrossRef]
- Plimpton, S. Fast parallel algorithms for short-range molecular dynamics. J. Comput. Phys. 1995, 117, 1–19. [Google Scholar] [CrossRef] [Green Version]
- Zhou, K.; Zhang, T.; Liu, B.; Yao, Y. Molecular dynamics simulations of tensile deformation of gradient nano-grained copper film. Comput. Mater. Sci. 2018, 142, 389–394. [Google Scholar] [CrossRef]
- Daw, M.S.; Baskes, M.I. Embedded-atom method: Derivation and application to impurities, surfaces, and other defects in metals. Phys. Rev. B 1984, 29, 6443. [Google Scholar] [CrossRef] [Green Version]
- Anupam, N.; Nilanjan, M. A metastable phase of shocked bulk single crystal copper: An atomistic simulation study. Sci. Rep. 2017, 7, 7337. [Google Scholar]
- Hayes, D.; Hixson, R.; McQueen, R. High Pressure Elastic Properties, Solid-Liquid Phase Boundary and Liquid Equation of State from Release Wave Measurements in Shock-Loaded Copper; American Institute of Physics Conference Series; American Institute of Physics: College Park, MD, USA, 2000; Volume 505, pp. 483–488. [Google Scholar]
- Kraft, T.; Marcus, P.; Methfessel, M.; Scheffler, M. Elastic constants of Cu and the instability of its bcc structure. Phys. Rev. B 1993, 48, 5886. [Google Scholar] [CrossRef]
- Jona, F.; Marcus, P. Structural properties of copper. Phys. Rev. B 2001, 63, 094113. [Google Scholar] [CrossRef]
- Friedel, J. On the stability of the body centred cubic phase in metals at high temperatures. J. Phys. Lett. 1974, 35, 59–63. [Google Scholar] [CrossRef]
- Morris, J.; Gooding, R. Exactly solvable heterophase fluctuations at a vibrational-entropy-driven first-order phase transition. Phys. Rev. Lett. 1990, 65, 1769. [Google Scholar] [CrossRef] [PubMed]
- Bringa, E.M.; Rosolankova, I.K.; Rudd, R.E.; Remington, B.A.; Wark, J.S.; Duchaineau, M.; Kalantar, D.H.; Hawreliak, J.; Belak, J. Shock deformation of face-centred-cubic metals on subnanosecond timescales. Nat. Mater. 2006, 5, 805–809. [Google Scholar] [CrossRef] [PubMed]
- Murphy, W.J.; Higginbotham, A.; Kimminau, G.; Barbrel, B.; Bringa, E.M.; Hawreliak, J.; Kodama, R.; Koenig, M.; McBarron, W.; Meyers, M.A.; et al. The strength of single crystal copper under uniaxial shock compression at 100 GPa. J. Phys. Condens. Matter 2010, 22, 065404. [Google Scholar] [CrossRef]
- Kimminau, G.; Erhart, P.; Bringa, E.M.; Remington, B.; Wark, J.S. Phonon instabilities in uniaxially compressed FCC metals as seen in molecular dynamics simulations. Phys. Rev. B 2010, 81, 092102. [Google Scholar] [CrossRef]
- Luo, W.; Hu, W.; Xiao, S. Size Effect on the Thermodynamic Properties of Silver Nanoparticles. J. Phys. Chem. C 2008, 112, 2359–2369. [Google Scholar] [CrossRef]
- Yang, C.C.; Li, S. Investigation of cohesive energy effects on size-dependent physical and chemical properties of nanocrystals. Phys. Rev. B 2007, 75, 165413. [Google Scholar] [CrossRef]
- Yang, H.; Zheng, J.; Peng, S.-K.; Zhu, X.-W.; Wan, M.-Y.; Lu, W.; Li, D. A chemopalette strategy for white light by modulating monomeric and excimeric phosphorescence of a simple Cu(i) cyclic trinuclear unit. Chem. Commun. 2019, 55, 4635–4638. [Google Scholar] [CrossRef] [PubMed]
- Mo, Y.F.; Tian, Z.A.; Liu, R.S.; Hou, Z.Y.; Wang, C.C. Structural evolution during crystallization of rapidly super-cooled copper melt. J. Non-Cryst. Solids 2015, 421, 14–19. [Google Scholar] [CrossRef]
- Ishraq, S.; Ronald, E.M. Deformation characteristics and stress–strain response of nanotwinned copper via molecular dynamics simulation. Acta Mater. 2009, 57, 4364–4373. [Google Scholar]
- Lee, B.J.; Lee, J.C.; Kim, Y.C.; Lee, S.H. Behavior of amorphous materials under hydrostatic pressures: A molecular dynamics simulation study. Met. Mater. Int. 2004, 10, 467–474. [Google Scholar] [CrossRef]
- Michael, I.O.; Dmitri, V.L.L. On Structural Rearrangements during the Vitrification of Molten Copper. Materials 2022, 15, 1313. [Google Scholar]
- Michael, I.O.; Dmitri, V.L.L.J. Light Exposure Promotes Degradation of Intermediates and Growth of Phosphine-Ligated Gold Clusters. Phys. Chem. B 2020, 124, 3186–3194. [Google Scholar]
- Baeri, P.; Campisano, S.U.; Foti, G.; Rimini, E. Segregation Effects in Cu-Implanted Si after Laser-Pulse Melting; IBM Research Laboratory: San Jose, CA, USA, 1978; p. 95193. [Google Scholar]
- Wendt, H.R.; Farid, F. Empirical Criterion for the Glass Transition Region Based on Monte Carlo Simulations. Phys. Rev. Lett. 1978, 41, 1244. [Google Scholar] [CrossRef]
- Yanqiu, Z.; Shuyong, J. Atomistic mechanisms for temperature-induced crystallization of amorphous copper based on molecular dynamics simulation. Comput. Mater. Sci. 2018, 151, 25–33. [Google Scholar]
- Aleksandrov, V.D.; Aleksandrova, V.N.; Barannikov, A.A.; Dobritsa, N.V.; Malinovskaya, N.E.; Frolova, S.A. Melting and Crystallization of Copper, Silver, and Gold Droplets. Tech. Phys. Lett. 2001, 27, 258–259. [Google Scholar] [CrossRef]
- Tuan, T.Q.; Dung, N.T. Molecular dynamics factors affecting on the structure, phase transition of Al bulk. Phys. B Condens. Matter 2019, 570, 116–121. [Google Scholar]
- Dung, N.T.; Van, C.L. Effects of Number of Atoms, Shell Thickness, and Temperature on the Structure of Fe Nanoparticles Amorphous by Molecular Dynamics Method. Adv. Civ. Eng. 2021, 2021, 9976633. [Google Scholar]
- Dung, N.T.; Cuong, N.C.; Van, D.Q.; Tuan, T.Q. Study the effects of factors on the structure and phase transition of bulk Ag by molecular dynamics method. Int. J. Comput. Mater. Sci. Eng. 2020, 9, 2050016. [Google Scholar]
- Dung, N.T.; Phuong, N.T. Factors affecting the structure, phase transition and crystallization process of AlNi nanoparticles. J. Alloys Compd. 2020, 812, 152133. [Google Scholar]
- Tuan, T.Q.; Dung, N.T. Effect of heating rate, impurity concentration of Cu, atomic number, temperatures, time annealing temperature on the structure, crystallization temperature and crystallization process of Ni1−xCux bulk; x = 0.1, 0.3, 0.5, 0.7. Int. J. Mod. Phys. B 2018, 32, 1830009. [Google Scholar] [CrossRef]
- Dung, N.T.; Phuong, N.T. Molecular dynamic study on factors influencing the structure, phase transition and crystallization process of NiCu6912 nanoparticle. Mater. Chem. Phys. 2020, 250, 123075. [Google Scholar]
- Long, V.C.; Van, D.Q.; Dung, N.T. Ab Initio Calculations on the Structural and Electronic Properties of AgAu Alloys. ACS Omega 2020, 5, 31391–31397. [Google Scholar] [CrossRef] [PubMed]
- Dung, N.T. Influence of impurity concentration, atomic number, temperature and tempering time on microstructure and phase transformation of Ni1−xFex (x = 0.1, 0.3, 0.5) nanoparticles. Mod. Phys. Lett. B 2018, 32, 1850204. [Google Scholar] [CrossRef]
- Dung, N.T.; Cuong, N.C.; Van, D.Q. Study on the Effect of Doping on Lattice Constant and Electronic Structure of Bulk AuCu by the Density Functional Theory. J. Multiscale Model. 2020, 11, 2030001. [Google Scholar]
- Dung, N.T.; Van, C.L.; Țălu, Ș. The Structure and Crystallizing Process of NiAu Alloy: A Molecular Dynamics Simulation Method. J. Compos. Sci. 2021, 5, 18. [Google Scholar]
- Tuan, T.Q.; Van, C.L.; Țălu, Ș.; Dung, N.T. Molecular Dynamics Study on the Crystallization Process of Cubic Cu–Au Alloy. Appl. Sci. 2022, 12, 946. [Google Scholar]
- Spearot, D.E.; Tschopp, M.A.; Jacob, K.I.; McDowell, D.L. Tensile strength of ⟨100⟩ and ⟨110⟩ tilt bicrystal copper interfaces. Acta Mater. 2007, 55, 705–714. [Google Scholar] [CrossRef]
- Tschopp, M.A.; Spearot, D.E.; McDowell, D.L. Atomistic simulations of homogeneous dislocation nucleation in single crystal copper. Model. Simul. Mater. Sci. Eng. 2007, 15, 693–709. [Google Scholar] [CrossRef]
- Foiles, S.M.; Baskes, M.I.; Daw, M.S. Embedded-atom-method functions for the FCC metals Cu, Ag, Au, Ni, Pd, Pt, and their alloys. Phys. Rev. B 1986, 33, 7983. [Google Scholar] [CrossRef] [PubMed]
- Reed, E.J.; Fried, L.E.; Joannopoulos, J. A method for tractable dynamical studies of single and double shock compression. Phys. Rev. Lett. 2003, 90, 235503. [Google Scholar] [CrossRef] [PubMed] [Green Version]
- Nosé, S. A unified formulation of the constant temperature molecular dynamics methods. J. Chem. Phys. 1984, 81, 511–519. [Google Scholar] [CrossRef] [Green Version]
- Hoover, W.G. Canonical dynamics: Equilibrium phase-space distributions. Phys. Rev. A 1985, 31, 1695–1697. [Google Scholar] [CrossRef] [Green Version]
- Tsuzuki, H.; Branicio, P.S.; Rino, J.P. Structural characterization of deformed crystals by analysis of common atomic neighborhood. Comput. Phys. Commun. 2007, 177, 518–523. [Google Scholar] [CrossRef]
- Stukowski, A. Structure identification methods for atomistic simulations of crystalline materials. Model. Simul. Mater. Sci. Eng. 2012, 20, 045021. [Google Scholar] [CrossRef]
- Song, C.; Lin, T.; He, P.; Jiao, Z.; Tao, J.; Ji, Y. Molecular dynamics simulation of linear friction welding between dissimilar Ti-based alloys. Comput. Mater. Sci. 2014, 83, 35–38. [Google Scholar]
- Lu, T.; Niu, G.J.; Xu, Y.; Wang, J.; An, Z.; Liu, H.; Zhou, H.; Ding, F.; Luo, G.N.; Li, X.C. Molecular dynamics study of the diffusion properties of H in Fe with point defects. Fusion Eng. Des. 2016, 113, 340–345. [Google Scholar] [CrossRef]
- Stukowski, A.; Albe, K. Extracting dislocations and non-dislocation crystal defects from atomistic simulation data. Model. Simul. Mater. Sci. Eng. 2010, 18, 085001. [Google Scholar] [CrossRef]
- Fang, H.Z.; Hui, X.; Chen, G.L.; Liu, Z.K. Structural evolution of Cu during rapid quenching by ab initio molecular dynamics. Phys. Lett. A 2008, 372, 5831–5837. [Google Scholar] [CrossRef]
Publisher’s Note: MDPI stays neutral with regard to jurisdictional claims in published maps and institutional affiliations. |
© 2022 by the authors. Licensee MDPI, Basel, Switzerland. This article is an open access article distributed under the terms and conditions of the Creative Commons Attribution (CC BY) license (https://creativecommons.org/licenses/by/4.0/).