Featured Application
The present paper submitted debates and assesses whether the effect of LEDs' application on garden cress sprouts conjunctively with biochar is important concerning sprouts length, weight and radicles, also if the effect of LEDs and gauze substrate influences the weight, length, concentration of polyphenols and flavonoids and antioxidant capacity. The novelty of the subject, its implications for what the future holds for agriculture, and the re-markable economic implications of LED artificial light make for an interesting subject to be presented to editors and readers. LED technology supposes certain advantages in the lighting area, mainly for reasons such as high efficiency, low energy consumption, illumination uniformity, no additional heat production, and a high level of customization that aids in the control of light distribution in greenhouses or in vitro systems. This study offers findings for using a reliable tool, LED light, to obtain enhanced plants in terms of the content of beneficial biochemical secondary metabolites from sprouts. We believe that these findings will be of interest to the readers of this journal.
Abstract
In the current context of climate change and life on Earth, the purpose of this paper is to establish the effects of different light treatments (i.e., LEDs—white, blue, red, and sunlight) and two different substrates (i.e., gauze and biochar) on garden cress sprouts. In this respect, sprouts’ fresh weight and fresh length were statistically analyzed. In the case of the fresh weight, the results indicated that the most suitable substrate for better growth is biochar under all of the light treatments, with a 5.78% weight increase. On the other hand, the highest particular value regarding weight was obtained for gauze substrate under sunlight treatment, with a 4.08% weight increase compared to biochar substrate and sunlight treatment. Furthermore, red LED and biochar used as substrate improved the development of short radicles, with a decrease in length of 94.80% compared to gauze substrate and red LED treatment. The effect of LED irradiation was completed with biochemical analyses concerning polyphenols, flavonoid content, and antioxidant activity. Results suggest that blue LED is the most suitable source of artificial light to promote the accumulation of secondary metabolites, with a 9.88% higher concentration of flavonoids compared to the other light variants (2.22 ± 0.40 mg rutin equivalent/g fresh weight) and 37.98% higher concentration of polyphenols compared to the other light variants (2.76 ± 1.05 mg gallic acid equivalent/g fresh weight) in garden cress sprouts. The illumination with white LED produced the highest effect concerning antioxidant activity, with a 37.60% higher free radical scavenging activity.
1. Introduction
When someone says sprouts, the first thing that comes to mind is green, healthy, clean, or fresh. The act of sprouting can be briefly explained as the process in which imbibition happens on the embryo, resulting in the rehydration and enlargement of the cells. Numerous metabolic processes occur inside the previously dormant seed, such as enzymatic activity or synthesis of biochemical compounds, thus transforming the seeds into a much more nutritious source of food.
Lepidium sativum L., also known as garden cress, is part of the Brassicaceae family. It is native to the southwestern parts of Asia. Albeit commonly, garden cress sprouts are considered to have different medicinal properties, such as depurative and antiscorbutic properties, in addition to these, their contemporary aspects are freshness, lightness, and an easy-to-digest nutritious product [1].
An increasing number of studies in the medical oncology field associate a decrease in cancer risk with consuming fruits and vegetables [2]. Garden cress, along with other Brassica species or papaya, contains glucotropaeolin, a benzyl glucosinolate, the precursor of benzyl isothiocyanate, an important activator of second-phase chemoprotective enzymes, involved in anti-proliferative mechanisms countering the growth of cancer cells and anthelmintic activity [3].
Biochar is the major compound of the soil’s organic matter; it mediates biological, chemical, and physical processes [4]. Biochar, as it is, or used as a soil amendment, has variations regarding its effects on plant development and growth [5]. An increase in interest in the conversion of organic wastes to biochar has been observed in recent years, as the horticultural use of biochar has been discovered as a promising practice. New techniques regarding biochar obtained from biomass are increasing the feasibility of such processes [6]. Considering the economic approach of biochar and the processes to obtain it revolve around the biochar’s ability to impact plant growth positively, researchers are still studying the effects of biochar in places such as Terra Preta soils in the Brazilian Amazon [7]. An experiment from 2010 [8] on the influence of biochar on plants concluded that a low volatile matter content biochar has positive effects on plant growth.
Light represents a major environmental factor for plants. It sustains plants by helping provide the signal for many physiological responses and the energy required for photosynthesis. The key components of light are wavelength, intensity, duration, and direction. In comparing LED light with conventional light sources, an LED is cheaper, does not produce heat, and it is easy to manipulate its parameters to provide a wide array of light spectra. A study in 2019 by Fiutak et al. [9] concluded that even though there was no significant effect of LEDs on alfalfa sprouts’ morphological structure, an increase in chlorophylls, β-carotene, lutein, and total polyphenols came along with the use of RGB and cold LEDs, while the use of warm white LED light led to inferior results. However, other studies, e.g., a study by Gherghina et al. from 2020 [10], in which the comparison between LEDs and conventional artificial lighting systems were studied, showed that LED supplementation greatly influenced the growth and content of biochemical compounds of the studied lettuce varieties cultivated in a greenhouse.
Correlating the quality of light and the wavelength of the light used can improve the synthesis of secondary metabolites and stimulate enzyme activation and synthesis pathways, promoting the accumulation of bioactive compounds (polyphenols and flavonoids) and increasing the antioxidant activity in the plant.
All the factors above taken into consideration, biochar, light, and the action of sprouting, with all of their separate implications, give leeway to the proposition of merging the three to oversee the outcome.
Next, the influence of light treatment conjunctively with the type of substrate used will be evaluated to better understand the implication in the physical profile (sprout length, weight, and radicle length) and the implications of using different light treatments, artificial and natural, on the biochemical profile (the content of polyphenols, flavonoids, and the antioxidant activity) of the sprouts.
2. Materials and Methods
2.1. The Biological Material
The biological material used was garden cress seeds obtained from a commercial source; the supplier name is Sonnentor®, and the seed country of origin is Austria. Germination and sprouting occurred in a sterile setting. Seeds were sterilized by immersion in a 10% sodium hypochlorite solution followed by three consecutive washes in distilled water to clean the seed surface of any chlorine residue. Seeds were germinated in transparent recipients (13 × 13 × 7 cm, with a capacity of 500 mL) in the dark. As substrates, sterile gauze and sterile grounded biochar were used, with 20 mL of sterile distilled water per recipient. The substrates were moistened with 10 mL of sterile distilled water only once the following day.
2.2. The Light Sources
As light sources, LEDs—cold white (5000–8300 K), deep red (650–670 nm), and high blue (460–490 nm) [11]—and natural sunlight (the control test) were used. LED treatment was applied for 16 h of photoperiod for 6 days. For the first 24 h, before moistening the substrates, the recipients were held in total darkness. After 5 more days, the sprouts were fully matured and underwent analysis. Technical characteristics of LEDs were light flux of 435 lm, 18 W power, and 220 V voltage [11,12].
For the duration of the whole experiment, plants were grown under artificial light, with measured PPFD (photosynthetic photon flux density) within the growth chamber of 215 ± 5.5 μmol m⁻2 s⁻1, a photoperiod of 16 h/8 h (light/dark) and air temperature of 24 ± 2 °C [13], with 450 ppm CO2 and 50–70% relative humidity in the air.
2.3. The Experimental Variants
The project was based on 8 experimental variants, each experimental variant completed in triplicate: V1—control, gauze substrate illuminated with sunlight; V2—control, biochar substrate illuminated with sunlight; V3—gauze substrate illuminated with white LED; V4—biochar substrate illuminated with white LED; V5—gauze substrate illuminated with blue LED; V6—biochar substrate illuminated with blue LED; V7—gauze substrate illuminated with red LED; V8—biochar substrate illuminated with red LED.
2.4. The Biochemical Analyses
The biochemical analyses were achieved using a methanolic extract obtained by grinding the whole sprouts, including radicles, in methanol 100% (rate 1 fresh tissue: 4 methanol). Each variant cultivated on gauze (V1, V3, V5, V7) was completed in triplicate (3 recipients for each variant). For each repetition (recipient) used for extraction, we randomly took several sprouts sufficient for an optimal volume of extraction to determine the polyphenol and flavonoid content and antioxidant capacity. The methanolic extract was kept for 4 days for extraction and then centrifuged at 15,000 rpm. The supernatant was used for the biochemical analyses.
The biochemical analyses regarding polyphenol and flavonoid contents and antioxidant activity were not accomplished for samples germinated on biochar substrate (V2, V4, V6, and V8) because the biochar prevented the process of extraction.
2.4.1. The Polyphenol Content
The polyphenols from methanolic extracts were determined using the Folin–Ciocâlteu method [14]. Gallic acid was used as a standard for the calibration curve. The concentration of polyphenols was expressed in mg gallic acid equivalent (GAE)/g fresh weight.
2.4.2. The Antioxidant Capacity
Antioxidant activity was determined using Marxen et al.’s 2007 method [15], with 2,2-diphenyl-1-picrylhydrazyl (DPPH) and a calibration curve with Trolox as standard. The antioxidant activity was expressed in mMTrolox/g fresh weight.
2.4.3. The Flavonoid Compounds
The concentration of flavonoids in methanolic extracts was measured using Zhishen et al.’s method from 1999 [16] modified with aluminum chloride. The rutin was the standard used in a calibration curve. The flavonoid content was expressed in mg rutin equivalent/g fresh weight.
2.5. Statistical Procedures
For the experiment, 30 garden cress (Lepidium sativum L.) seeds were used per recipient. The measurements were realized in triplicate from three recipients per variant. Data acquired from the experiment were statistically investigated and were expressed as the mean ± SD (standard deviation). Comparisons between groups on gauze (V1 control, illuminated with sunlight; V3, illuminated with white LED; V5, illuminated with blue LED; and V7, illuminated with red LED experimental variant) or biochar (V2 control, illuminated with sunlight; V4, illuminated white LED; V6, illuminated with blue LED; and V8, illuminated with red LED experimental variant), were evaluated by one-way ANOVA [17]. A value of p < 0.05 was considered statistically significant. The values with different letters are significantly different (p < 0.05). For the realized graphs, we used WPS Office Software Program (Microsoft Excel). The LSD (Least Significant Difference) test determined the statistical significance of differences between experimental variants.
3. Results
All the seeds in the recipient sprouted; the sprouting rate was 100%. Furthermore, the seeds started sprouting after 24 h, with a noticeable daily growth.
3.1. Morphometric and Gravimetric Measurements
3.1.1. The Sprouts’ Length
The overall sprout length can be seen in Figure 1, where average length values were compared. In this figure, the highest values are obtained under sunlight, 6.00 ± 1.22 a cm on biochar V2 and 6.25 ± 1.64 a cm on gauze V1, and we would like to note that radicles are part of the lengths in this figure. The lowest values are in the cases of white LED light and biochar, 2.66 ± 0.63 b cm (V4), and blue LED light and gauze, 2.96 ± 0.56 b cm (V5). The other values obtained for the samples cultivated on gauze were the following: 5.74 ± 1.75 a (V3) and 4.33 ± 1.85 ab (V7). The other values for the average sprout lengths cultivated on biochar were 4.01 ± 1.4 b (V6) and 3.18 ± 1.5 b (V8).

Figure 1.
The medium values of Lepidium sativum L. sprout lengths on gauze (V1 control, illuminated with sunlight; V3, illuminated with white LED; V5, illuminated with blue LED; V7, illuminated with red LED experimental variant) or biochar (V2 control, illuminated with sunlight; V4, illuminated white LED; V6, illuminated with blue LED; and V8, illuminated with red LED experimental variant). Data acquired from the experiment were statistically investigated and were expressed as the mean ± SD (standard deviation). Bars are one standard deviation.
Analyzing the effect of illuminated with LED on sprouts cultivated on gauze/biochar, the ANOVA test revealed the following results in Table 1.

Table 1.
A one-way ANOVA test for Lepidium sativum L. length sprouts.
The sprout lengths for the sample treated with different types of LED compared with control, represented by sunlight, demonstrated a significant (high) statistical difference (p < 0.001) for both types of substrates.
3.1.2. The Radicle Length
Radicle length assessment shows that using gauze as a substrate along with white LED light (4.00 ± 0.92 a cm—V3) has a positive effect (or a negative effect because radicles are not meant to be eaten). The lowest values were obtained under red LED light and on biochar (0.87 ± 0.36 b cm—V8). While under white and red LEDs and sunlight and on biochar, radicle lengths were visibly shorter than on gauze, under blue LED, radicles on biochar were one cm longer than on gauze. As shown in Figure 2, there were high shifts concerning radicle lengths. The values for samples cultivated on gauze were the following: 3.33 ± 2.1 a for V1, 1.57 ± 0.85 b for V5, and 2.42 ± 1.4 ab for V7. The values for samples cultivated on biochar were: 2.41 ± 1.8 a for V2, 1.13 ± 0.7 b for V4, and 2.55 ± 1.3 a for V6.
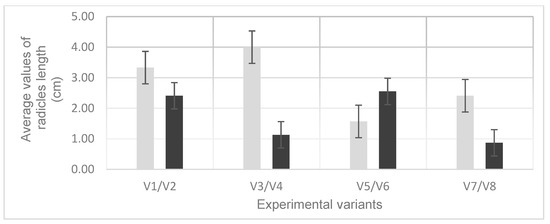
Figure 2.
The medium values of radicles’ length of Lepidium sativum L. sprouts on gauze (V1 control, illuminated sunlight; V3, illuminated with white LED; V5, illuminated with blue LED; and V7, illuminated with red LED experimental variant) or biochar (V2 control, illuminated sunlight; V4, illuminated with white LED; V6, illuminated with blue LED; and V8, illuminated with red LED experimental variant). Data acquired from the experiment were statistically investigated and were expressed as the mean ± SD (standard deviation). Bars are one standard deviation.
The effect of illumination with different types of LED light on radicle length sprouts cultivated on gauze/biochar is included in the following ANOVA test table (Table 2).
Table 2.
A one-way ANOVA test for radicle lengths of Lepidium sativum L. sprouts.
The ANOVA test results emphasized that a highly significant statistical difference (p < 0.001) existed between the treated sample cultivated on gauze/biochar illuminated with LED light and control (sunlight).
3.1.3. The Sprouts’ Weight
Following Figure 3, it can be noticed that biochar, despite the source of light, achieved higher values than gauze. The highest value obtained was in the case of using natural sunlight and biochar with 0.70 ± 0.18 a g (V2). This value is followed closely by its gauze counterpart and by red LED and biochar with 0.66 ± 0.26 a g both (V1 and V8). The lowest value was reported when using white LED and gauze (0.5 ± 0.19 b—V3). The other values obtained were: 0.54 ± 0.18 a for V4, 0.58 ± 0.17 abc for V5, 0.59 ± 0.18 a for V6, and 0.61 ± 0.25 ac for V7.
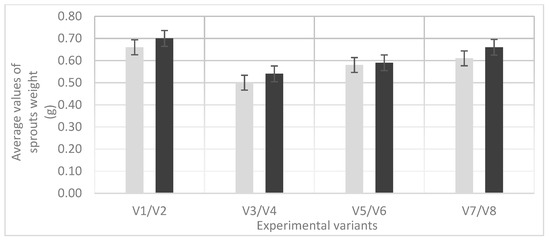
Figure 3.
The medium values of Lepidium sativum L. sprouts’ weight on gauze (V1 control, illuminated with sunlight; V3, illuminated with white LED; V5, illuminated with blue LED; and V7, illuminated with red LED experimental variant) or biochar (V2 control, illuminated with sunlight; V4, illuminated with blue LED; V6, illuminated with blue LED; and V8, illuminated with blue LED experimental variant). Data acquired from the experiment were statistically investigated and were expressed as the mean ± SD (standard deviation). Bars are one standard deviation.
The ANOVA test applied to results obtained from Lepidium sativum L. sprouts’ weight (Table 3) demonstrated a significant statistical difference (p < 0.01, but higher than p < 0.001).
Table 3.
A one-way ANOVA test for Lepidium sativum L. sprouts’ weight.
Observing the weight of the sprouts, the p-value here, in comparison to the other two parameters analyzed, has a notable difference in regard to the treatment used. In the gauze variants, the p-value is between 0.05 and 0.001, while concerning the biochar variant, the p-value is lower than 0.001, only proving that the biochar treatment bested the gauze treatment. Further rejecting the null hypothesis—that the treatments are not statistically supported—are the values of F and F crit. Even though they are in relatively proximity to the other two results from above, not to be disregarded is the fact that F has a higher value than F crit.
When looking at how this experiment influenced the weight and length of Lepidium sativum L. sprouts, a big difference can be observed in the case of white LED light and biochar as substrate (V4). Comparing this case with its sunlight counterpart (V2) and even with the gauze and sunlight variant (V1), where the weight and the length remained high from both points of view, V4 somewhat did not abide by the normal course.
3.2. Estimation of the Bioactive Compound and Antioxidant Activity
3.2.1. The Polyphenol Content
In Figure 4, it can be observed that the polyphenols were accumulated in a higher concentration in the garden cress sprout grown under blue LED light (2.76 ± 1.05 b—V5) compared to the red (1.78 ± 0.37 a—V7) and white LEDs (1.94 ± 0.39 a—V3) or control (1.92 ± 0.11 a—V1). The results are in concordance with those obtained by Azad et al. in 2018 [18], who noticed that growing soybean sprouts under artificial blue LED light created the highest total phenol content.
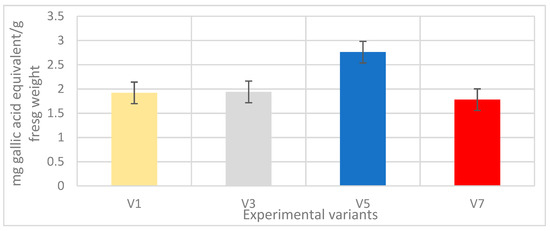
Figure 4.
The polyphenol contents in Lepidium sativum L. sprouts on gauze substrate (V1 control, illuminated with sunlight; V3, illuminated with white LED; V5, illuminated with blue LED; and V7, illuminated with red LED experimental variants). Data acquired from the experiment were statistically investigated and are expressed as the mean ± SD (standard deviation). Bars are one standard deviation.
The results from Figure 4 are confirmed by a one-way ANOVA test for the polyphenols in Lepidium sativum L. sprouts’ weight (Table 4).
Table 4.
A one-way ANOVA test for the polyphenols in Lepidium sativum L. sprouts’ weight.
3.2.2. The Antioxidant Activity
Figure 5 shows that higher free radical activity (DPPH) or antioxidant activity is found in white LED light (5.53 ± 0.49 b—V3) compared with control (3.54 ± 0.28 a—V1) and red (3.59 ± 1.11 a—V7) and blue (4.24 ± 2.67 a—V5) LEDs. The antioxidant properties of the sprouted vegetables were greatly enhanced by the white LED treatment.
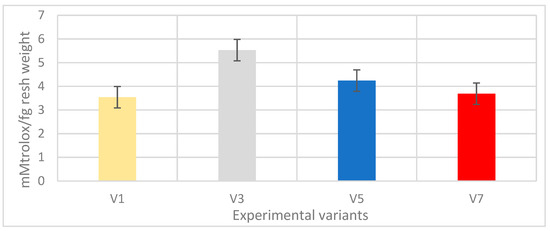
Figure 5.
The antioxidant activity in Lepidium sativum L. sprouts on gauze substrate (V1 control, illuminated with sunlight; V3, illuminated with white LED; V5, illuminated with blue LED; and V7, illuminated with red LED experimental variants). Data acquired from the experiment were statistically investigated and are expressed as the mean ± SD (standard deviation). Bars are one standard deviation.
The results from Figure 5 are confirmed by a one-way ANOVA test for the polyphenols in Lepidium sativum L. sprouts’ weight (Table 5).
Table 5.
A one-way ANOVA test for the antioxidant activity in Lepidium sativum L. sprouts.
3.2.3. The Flavonoid Concentration
In Figure 6, it can be observed that the blue LED (2.22 ± 0.40 a—V5) induced an enhanced value of flavonoid concentration compared with control sunlight (2.13 ± 0.09 a—V1) or white LED (2.03 ± 0.24 a—V3) compared with the red LED (1.88 ± 0.26 a—V7). The biosynthesis of flavonoids is amplified during sprouting due to the catalytic activity of enzymes, such as hydrolases and polyphenol oxidases, which are reported to be activated in the sprouting process [19], and additionally, the blue LED enhances enzyme synthesis, with the result being the accumulation of secondary compounds. Many studies showed that blue light is the most effective lighting source for the synthesis of flavonoid compounds [18] by stimulating PAL, CHS (chalcone synthesis), and DFR (dihydroflavonol–4–reductase) gene expression [20].
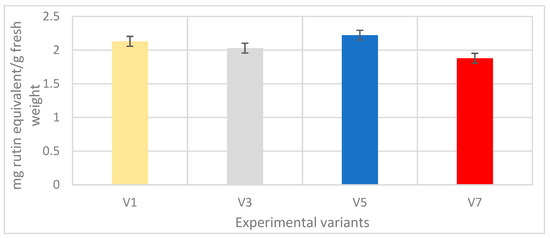
Figure 6.
The flavonoid concentration in Lepidium sativum L. sprouts on gauze substrate (V1 control, illuminated with sunlight; V3, illuminated with white LED; V5, illuminated with blue LED; and V7, illuminated with red LED experimental variants). Data acquired from the experiment were statistically investigated and were expressed as the mean ± SD (standard deviation). Bars are one standard deviation.
The results from Figure 4 are confirmed by a one-way ANOVA test for the polyphenols in Lepidium sativum L. sprouts’ weight (Table 6).
Table 6.
A one-way ANOVA test for flavonoid concentration in Lepidium sativum L. sprouts.
The LSD test was applied to determine the statistical significance
4. Discussion
4.1. Morphometric and Gravimetric Measurements
On the third day of the project, the most developed sprouts were the V8 ones, where the sprouts were almost the same as by the end of the experiment. V6 followed in terms of development but was not as high as the V8 counterpart. V5 had the smallest and underdeveloped sprouts but continued growing, observing a delay in growth compared with the other variants. The other variants were average in the means of growth and development, thus requiring more time to completely develop.
Concerning the nature of one of the substrates, e.g., pure biochar, as it has not been used before in this conjuncture and form, a literature comparison does not exist, or if it does, it is not significant in this matter.
4.1.1. The Sprout’s Length
A comparison between gauze and biochar is subject to interpretation since the difference in the control variant shows little difference. The statistical difference in both supports is significant (p < 0.001). Discerning the two kinds, it is shown that in the biochar case, the statistical difference is even smaller than the gauze variants, further promoting the rejection of the null hypothesis. Further approving the results obtained, the value of F is quite greater than the value of F crit, additionally supporting the positive implications of the treatments used. Keeping in mind the LED component of the experiment, blue LED light and biochar had a positive action on the sprouts, as also stated by Cioć et al. in 2017 [21], where blue LED light also positively influenced the development of Myrtus communis L.
4.1.2. The Radicles’ Length
Biochar used as a radicle support matrix overall proved to create discrepancies depending on the light treatment used. This result creates the opportunity to directly use pairs, biochar, and light treatment to influence the development of radicles. Being near each other, both gauze and biochar effects showed significant (p < 0.001) statistical difference, yet the biochar substrate claimed the best result, with a lower p-value than gauze. Additionally, such as in the previous case where sprout length was discussed, the higher value of F compared to F crit strengthens the hypothesis of the significance of the treatments applied.
The results can be broadly compared with the results obtained by Mølmann and Johansen in 2020 [22], in which the red and far-red LED treatments showed potential greening inhibition in potato cultivars. Their results only support a hypothesis of the high versatility and malleability of LED treatments to help deliver any desired outcome.
4.1.3. The Sprout’s Weight
Major differences are not to be observed between the substrate types used, hence why the light treatment played a role in regard to weight. As Wu et al. [19] stated in 2007, LED light greatly influences weight, and in this particular experiment, blue LED light developed the heaviest pea sprouts, with red LED coming in second. Concerning strictly LED light, in our experiment, blue LED light came in second place, in favor of red LED light, which helped develop the heaviest sprouts of all the LED variants.
4.1.4. Correlating the Results
Correlating the results above (Section 4.1.1, Section 4.1.2, Section 4.1.3), a difference can be discerned between the types of light (LED or sunlight) and the types of substrates (biochar or gauze) used in the experiment.
The growth of radicles was influenced in many different ways by the light and the substrate used. White LED and gauze promoted the longest radicles, but sunlight and gauze induced a higher weight of radicles. Biochar seems to be, to some extent, not adequate for radicle growth. To be more explicit, biochar and red LED light create the smallest and lightest radicles.
4.2. Estimation of the Bioactive Compound and Antioxidant Activity
Correlating the Results from an ANOVA Test Completed on the Studied Biochemical Profile
A one-way ANOVA test on the content of polyphenols, flavonoids, and antioxidant activity of sprouts illuminated with sunlight (control), white, blue, and red LEDs demonstrated that there is no statistical significance (p > 0.05) in the sample analyses, despite the averages for polyphenol, flavonoid, and antioxidant activity being different. The p-value varying between 0.247432 and 0.527117 supported the null hypothesis H0, and the value of F was not in the rejection region; it was smaller than F crit.
4.3. Correlating the Results for Morphometric and Gravimetric Measurements with the Results for the Estimation of the Bioactive Compound and Antioxidant Activity
Our previous studies regarding the effect of illumination with blue LED revealed an enhancement of the metabolic pathways for the biosynthesis of proteins and flavonoids, polyphenols of Cannabis sativa L. sprouts [12]. Similarly, [11] reported that the polyphenol content of sprouts buckwheat (sprouting from seeds with testa) illuminated with blue LED was higher in comparison with treatment with white and red LED light. Other results have shown that red light increased total phenolic compounds, flavonoid contents in green perilla (Perilla frutescens L. Britton), and Chinese foxglove (Rehmannia glutinosa Libos.) plants in contrast to white light; moreover, blue light was much more efficient at synthesizing bioactive ingredients than red light [23,24].
All the aspects analyzed will open new future directions for research studies regarding the detection of new compounds with antioxidant effects induced by LED treatments, using different types of substrates (other than biochar) and monitoring the accumulation of these metabolites without interfering in the biochemical assay.
The LSD test applied after ANOVA for comparisons between groups revealed that the statistical differences between variants concerning the treatment with LED are recorded in the following cases: the weight of the sprout for variants V1/V3 and V3/V7 (Figure 9); the sprout lengths (Figure 7) for all variants, less so V1/V3; and sprouts radicles length (Figure 8) for all variants, less so V4/V8 and V2/V6. In all other analyzed variants, there were no statistical differences between the analyzed samples (Figure 7, Figure 8, Figure 9, Figure 10, Figure 11 and Figure 12)
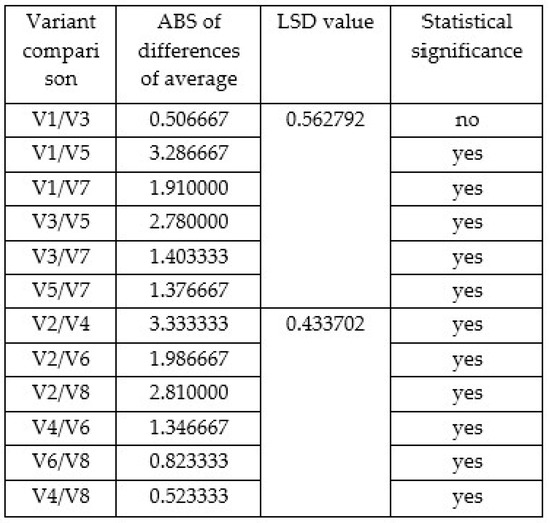
Figure 7.
The statistical significance determined by LSD (Least Significant Difference) test values of Lepidium sativum L. sprouts’ length on gauze (V1 control, illuminated with sunlight; V3, illuminated with white LED; V5, illuminated with blue LED; and V7, illuminated with red LED experimental variant) or biochar (V2 control, illuminated with sunlight; V4, illuminated with white LED; V6, illuminated with blue LED; and V8, illuminated with red LED experimental variant), t crit value = 1.980626.
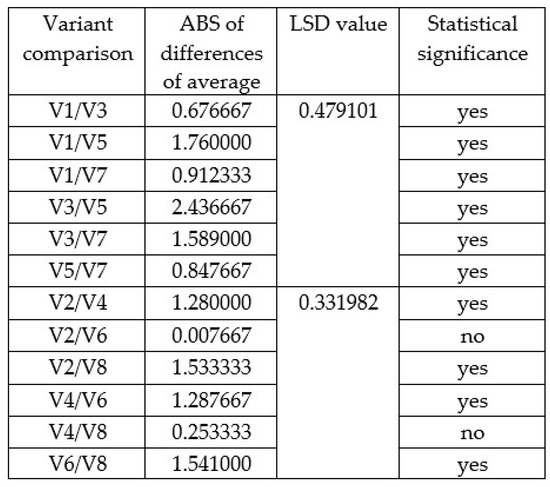
Figure 8.
The statistical significance determined by LSD (Least Significant Difference) test values of Lepidium sativum L. sprout radicles’ length on gauze (V1 control, illuminated with sunlight; V3, illuminated with white LED; V5, illuminated with blue LED; and V7, illuminated with red LED experimental variant) or biochar (V2 control, illuminated with sunlight; V4, illuminated with white LED; V6, illuminated with blue LED; and V8, illuminated with red LED experimental variant,) t crit value = 1.980626.
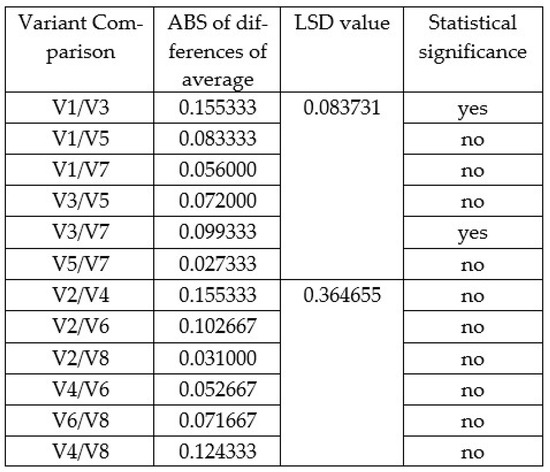
Figure 9.
The statistical significance determined by LSD (Least Significant Difference) test values of Lepidium sativum L. sprouts weight on gauze (V1 control, illuminated with sunlight; V3, illuminated with white LED; V5, illuminated with blue LED; and V7, illuminated with red LED experimental variant) or biochar (V2 control, illuminated with sunlight; V4, illuminated with white LED; V6, illuminated with blue LED; and V8, illuminated with red LED experimental variant,) t crit value = 1.980626002.
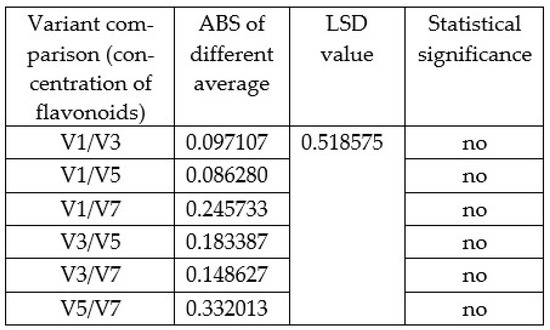
Figure 10.
The statistical significance determined by LSD (Least Significant Difference) test values of flavonoid concentration in Lepidium sativum L. sprouts cultivated on gauze (V1 control, illuminated with sunlight; V3, illuminated with white LED; V5, illuminated with blue LED; and V7, illuminated with red LED experimental variant), t crit value = 2.306004.
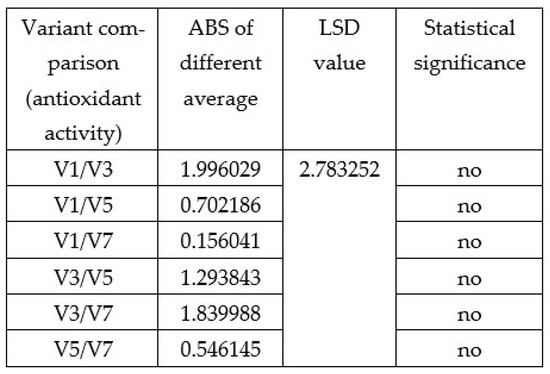
Figure 11.
The statistical significance determined by LSD (Least Significant Difference) test values of antioxidant activity in Lepidium sativum L. sprouts cultivated on gauze (V1 control, illuminated with sunlight; V3, illuminated with white LED; V5, illuminated with blue LED; and V7, illuminated with red LED experimental variant), t crit value = 2.306004.
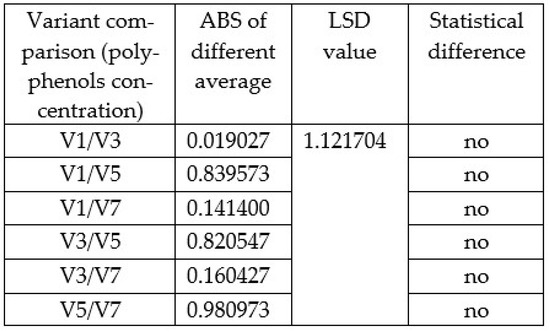
Figure 12.
The statistical significance determined by LSD (Least Significant Difference) test values of polyphenols concentration in Lepidium sativum L. sprouts cultivated on gauze (V1 control, illuminated with sunlight; V3, illuminated with white LED; V5, illuminated with blue LED; and V7, illuminated with red LED experimental variant), t crit value = 2.306004.
5. Conclusions
Both LED light and biochar had an overall beneficial influence on Lepidium sativum L. sprouts.
The sprouting rate was 100% for all 30 seeds per recipient sprouted, independent of light treatments (LEDs—white, blue, red, and sunlight) and the different substrates (gauze and biochar).
The length and weight were best stimulated by biochar and sunlight treatment, while the others had different results in this case (the weight increased instead of length, and vice versa).
If radicles are not of interest, then it is best to use biochar as a substrate conjunctively with red LED light; otherwise, gauze with white LED or sunlight recorded the highest values.
Growing garden cress sprouts illuminated with blue and red LED light showed the highest polyphenol content. The flavonoid concentration was stimulated by blue LED illumination the most. White LED light improved the growth of radicles’ length along with the antioxidant activity of sprouts using gauze as substrate, blue LED light was efficient in enhancing the content of flavonoids and polyphenols.
Author Contributions
Conceptualization methodology and formal analysis—O.L.; statistics, irradiation treatments—O.L., C.-P.Ș. and A.D.R.; statistics, biochemical analyses, and extraction protocol optimization—C.M.; software and graphs—C.-P.Ș.; writing—all authors; project administration—O.L. and C.M. Authorship is limited to those who have contributed substantially to the work reported. All authors have read and agreed to the published version of the manuscript.
Funding
The biochemical analyses were supported by project no. RO1567-IBB06/2021 financed by Romanian Academy, “Plant biotechnologies for biodiversity conservation and sustainable development”.
Institutional Review Board Statement
Not applicable.
Informed Consent Statement
Not applicable.
Data Availability Statement
Not applicable.
Acknowledgments
The authors acknowledge the administrative support to USAMVB, Faculty of Biotechnologies.
Conflicts of Interest
The authors declare no conflict of interest. The funders had no role in the design of the study; in the collection, analyses, or interpretation of data; in the writing of the manuscript; or in the decision to publish the results.
References
- Conforti, F.; Sosa, S.; Marrelli, M.; Menichini, F.; Statti, G.A.; Uzunov, D.; Tubaro, A.; Menichini, F. The protective ability of Mediterranean dietary plants against the oxidative damage: The Role of Radical Oxygen Species in Inflammation and Polyphenol, Flavonoid and Sterol Contents. Food Chem. 2009, 112, 587–594. [Google Scholar] [CrossRef]
- Potter, J.D.; Steinmetz, K. Vegetables, fruit and phytoestrogens as preventive agents. IARC Sci. Publ. 1996, 139, 61–90. [Google Scholar]
- Tim, J.O.; Wong, L.S.; Williams, D.J.; Pun, S. Papaya (Carica papaya) as a source of glucotropaeolin and its active derivative, benzyl-isothiocyanate. In Proceedings of the Human Nutrition and Health Conference 2008, Couran Cove Island Resort, Gold Coast, Australia, 8–11 November 2008; p. 197. [Google Scholar]
- Blanco, H.; Lal, R. Principles of Soil Conservation and Management; Springer: New York, NY, USA, 2010; pp. 449–450. [Google Scholar]
- Glaser, B.; Lehmann, J.; Steiner, C.; Nehls, T.; Yousaf, M.; Zech, W. Potential of pyrolyzed organic matter in soil amelioration. In Proceedings of the 12th ISCO Conference, Beijing, China, 26–31 May 2002; pp. 421–427. [Google Scholar] [CrossRef]
- Antal, M.J.; Gronli, M. The Art, Science, and Technology of Charcoal Production. Ind. Eng. Chem. Res. 2003, 42, 1619–1640. [Google Scholar] [CrossRef]
- Woolf, D.; Lehmann, J.; Joseph, S.; Campbell, C.; Christo, F.C.; Angenent, L.T. An open-source biomass pyrolysis reactor. Biofuels Bioprod. Biorefin. 2017, 11, 945–954. [Google Scholar] [CrossRef]
- Deenik, J.L.; McClellan, T.; Uehara, G.; Antal, M.J.; Campbell, S. Charcoal Volatile Matter Content Influences Plant Growth and Soil Nitrogen Transformations. Soil Sci. Soc. Am. J. 2010, 74, 1259–1270. [Google Scholar] [CrossRef]
- Fiutak, G.; Michalczyk, M.; Filipczak-Fiutak, M.; Fiedor, L.; Surówka, K. The impact of LED lighting on the yield, morphological structure and some bioactive components in alfalfa (Medicago sativa L.) sprouts. Food Chem. 2019, 285, 53–58. [Google Scholar] [CrossRef]
- Gherghina, E.; Luță, G.; Dobrin, E.; Drăghici, E.M.; Bălan, D.; Martinez, S.A. Biochemical changes under artificial led lighting in some Lactuca sativa L.varieties. AgroLife Sci. J. 2020, 9, 141. [Google Scholar]
- Livadariu, O.; Maximilian, C. Studies Regarding Treatments of LED-s Emitted Light on Sprouting Fagopyrum esculentum Moench. Bull. UASVM Anim. Sci. Biotechnol. 2017, 74, 102–111. [Google Scholar] [CrossRef][Green Version]
- Livadariu, O.; Raiciu, D.; Maximilian, C.; Căpitanu, E. Studies regarding treatments of LED-s emitted light on sprouting hemp (Cannabis sativa L.). Rom. Biotechnol. Lett. 2019, 24, 485–490. [Google Scholar] [CrossRef]
- Enache, I.M.; Livadariu, O. Preliminary results regarding the testing of treatments with light emitting diode (LED) on the seed germination of Artemisia dracunculus L. Sci. Bull. Ser. F. Biotechnol. 2016, XX, 52–53. [Google Scholar]
- Mihailović, V.; Matić, S.; Mišić, D.; Solujić, S.; Stanić, S.; Katanić, J.; Mladenović, M.; Stanković, N. Chemical composition, antioxidant and antigenotoxic activities of different fractions of Gentiana asclepiadea L. Roots Extract. EXCLI J. 2013, 12, 807–823. [Google Scholar] [PubMed]
- Marxen, K.; Vanselow, K.H.; Lippemeier, S.; Hintze, R.; Ruser, A.; Hansen, U.-P. Determination of DPPH radical oxidation caused by methanolic extracts of some Microalgal Species by linear regression analysis of spectrophotometric measurements. Sensors 2007, 7, 2080–2095. [Google Scholar] [CrossRef] [PubMed]
- Zhishen, J.; Mengcheng, T.; Jianming, W. The determination of flavonoid contents in mulberry and their scavenging effects on superoxide radicals. Food Chem. 1999, 64, 555–559. [Google Scholar] [CrossRef]
- Azad, M.O.K.; Kim, W.W.; Park, C.H.; Cho, D.H. Effect of Artificial LED Light and Far Infrared Irradiation on Phenolic Compound, Isoflavones and Antioxidant Capacity in Soybean (Glycine max L.) Sprout. Foods 2018, 7, 174. [Google Scholar] [CrossRef] [PubMed]
- Pelcaru, C.F.; Ene, M.; Petrache, A.-M.; Neguț, D.C. Low Doses of Gamma Irradiation Stimulate Synthesis of Bioactive Compounds with Antioxidant Activity in Fomes fomentarius Living Mycelium. Appl. Sci. 2021, 11, 4236. [Google Scholar] [CrossRef]
- Wu, M.-C.; Hou, C.-Y.; Jiang, C.-M.; Wang, Y.-T.; Wang, C.-Y.; Chen, H.-H.; Chang, H.-M. A novel approach of LED light radiation improves the antioxidant activity of pea seedlings. Food Chem. 2007, 101, 1753–1758. [Google Scholar] [CrossRef]
- Cevallos-Casals, B.A.; Cisneros-Zevallos, L. Impact of germination on phenolic content and antioxidant activity of 13 edible seed species. Food Chem. 2010, 119, 1485–1490. [Google Scholar] [CrossRef]
- Cioć, M.; Szewczyk, A.; Żupnik, M.; Kalisz, A.; Pawłowska, B. LED lighting affects plant growth, morphogenesis and phytochemical contents of Myrtus communis L. in vitro. Plant Cell Tissue Organ Cult. (PCTOC) 2017, 132, 433–447. [Google Scholar] [CrossRef]
- Mølmann, J.A.; Johansen, T.J. Sprout growth inhibition and photomorphogenic development of potato seed tubers (Solanum tuberosum L.) under different LED light colours. Potato Res. 2020, 63, 199–215. [Google Scholar] [CrossRef]
- Lee, J.S.; Lee, C.A.; Kim, Y.H.; Yun, S.J. Shorter wavelength blue light promotes growth of green perilla (Perilla frutescens). Int. J. Agric. Biol. 2014, 16, 1172–1182. [Google Scholar] [CrossRef]
- Manivannan, A.; Soundararajan, P.; Halimah, N.; Ko, C.H.; Jeong, B.R. Blue LED light enhances growth, phytochemical contents, and antioxidant enzyme activities of Rehmannia glutinosa cultured in vitro. Hortic. Environ. Biotechnol. 2015, 56, 105–113. [Google Scholar] [CrossRef]


Publisher’s Note: MDPI stays neutral with regard to jurisdictional claims in published maps and institutional affiliations. |
© 2022 by the authors. Licensee MDPI, Basel, Switzerland. This article is an open access article distributed under the terms and conditions of the Creative Commons Attribution (CC BY) license (https://creativecommons.org/licenses/by/4.0/).