Article

Influence of Process Parameters on Filling and Feeding Capacity during High-Pressure Die-Casting Process

1
College of Electromechanical Engineering, Qingdao University of Science and Technology, Qingdao 260061, China
2
Ningbo Institute of Dalian, University of Technology, Ningbo 315016, China
3
Ningbo Haitian Die-Casting Equipment Co., Ltd., Ningbo 315821, China
*
Author to whom correspondence should be addressed.
Appl. Sci. 2022, 12(9), 4757; https://doi.org/10.3390/app12094757
Submission received: 8 April 2022 / Revised: 30 April 2022 / Accepted: 4 May 2022 / Published: 9 May 2022

Abstract

:
The quality of high-pressure die casting (HPDC) is largely determined by the process parameters. The objective is to study the influence of process parameters on melt filling and feeding capacity. The research is carried out by means of numerical simulations and orthogonal experiments. The results show that the influence of process parameters is different. The piston velocity of the fast stage has the most obvious impact. As the piston velocity of the fast stage increases, the filling capacity and feeding capacity also increase. The melt injection temperature should not be too low; otherwise, it would be easy to cause gas porosity. The piston velocity of the slow stage should not be too high; otherwise, it would cause air entrainment. The influence of the pressure maintaining time is not obvious due to the ingate solidifying prematurely. The recommended process parameters are a melt injection temperature of 660–680 °C, a piston velocity of 0.1–0.2 m/s in the slow stage, and a piston velocity 2.4–3.2 m/s in the fast stage. This also suggests that appropriate technology should be adopted to delay the solidification time of the ingate in order to realize the feeding effect of pressurization.

1. Introduction

The application of high-pressure die casting (HPDC) could enable mass production of cast alloy components with high dimensional accuracy and great efficiency. However, defects such as entrapped air, misrun and shrinkage cavity, etc. are commonly and randomly distributed in the HPDC components, which would deteriorate the mechanical properties [1,2]. The design and layout of casting systems (sprue, ingate, overflow, dross trap and chill vent) as well as a suitable configuration of the process parameters are vital factors in influencing the melt flow characteristics and solidification process during HPDC process [3,4,5]. Properly configured casting systems plus optimal process parameters could lead to good die casting microstructures and high mechanical properties. Zhao et al. found that ADC12 die castings could have better mechanical properties with more even distribution and smaller porosity in conditions with the same level of gas entrapment [6]. Jiao et al. found that the slow-shot speed could significantly influence the distribution of primary silicon particles and porosity [7]. Qin et al. studied the effects of process parameters on the injection chamber pre-crystallization and the flow of molten metal [8]. Han and Zhang studied the fluidity of alloys under HPDC conditions, and a large amount of pre-solidified dendrites were collected in the runner adjacent to the ingate [9].
The application of numerical simulations has become a trend in casting industries due to its great efficiency and reliability. Based on numerical simulations, the influence of process parameters on melt flow, solidification and defect formation in an HPDC process, which cannot be easily observed during actual practice, could be obtained. Anglada et al. used thermomechanical simulations to predict the final dimensions of a component manufactured in an aluminum alloy by HPDC [10]. Kwon optimized the gate and runner design of an automobile part according to the filling simulation results using the software AnyCasting [11]. Gu et al. predicted the grain structure of cast aluminum alloys in an HPDC process using an integrated computational materials engineering (ICME) approach [12].
A comprehensive application of die-casting experiments and computer-aided engineering (CAE) would be helpful in studying the characteristics of die-casting processes. In this way, a direct link between the casting system design, the process conditions and the casting quality could be established, which is practical, economical and efficient for HPDC processes. Cao et al. investigated the filling condition and the porosity formation in HPDC processes by direct observation and based on a numerical simulation [13]. Dargusch et al. investigated the influence of in-cavity pressure on the porosity formation of A380 alloy during an HPDC process [14]. Dou et al. studied the influence of piston slow-shot profiles on the mechanical properties of an A356 aluminum alloy based on a small number of experiments and numerical simulation [15]. Yu et al. used 3D reconstruction methods to study the processing, microstructure and properties correlation of an HPDC AZ91D alloy [16]. Blondheim et al. studied the macro porosity formation in an HPDC process by means of experiment and simulation, which could help avoid macro porosity-related quality issues in manufacturing [17].
In this work, the influence of HPDC process parameters on melt filling and feeding capacity were investigated. It comprehensively adopted the numerical simulation and the orthogonal experiment methods without applying a large number of experiments. It would be beneficial for evaluating and optimizing the process parameters.

2. Materials and Methods

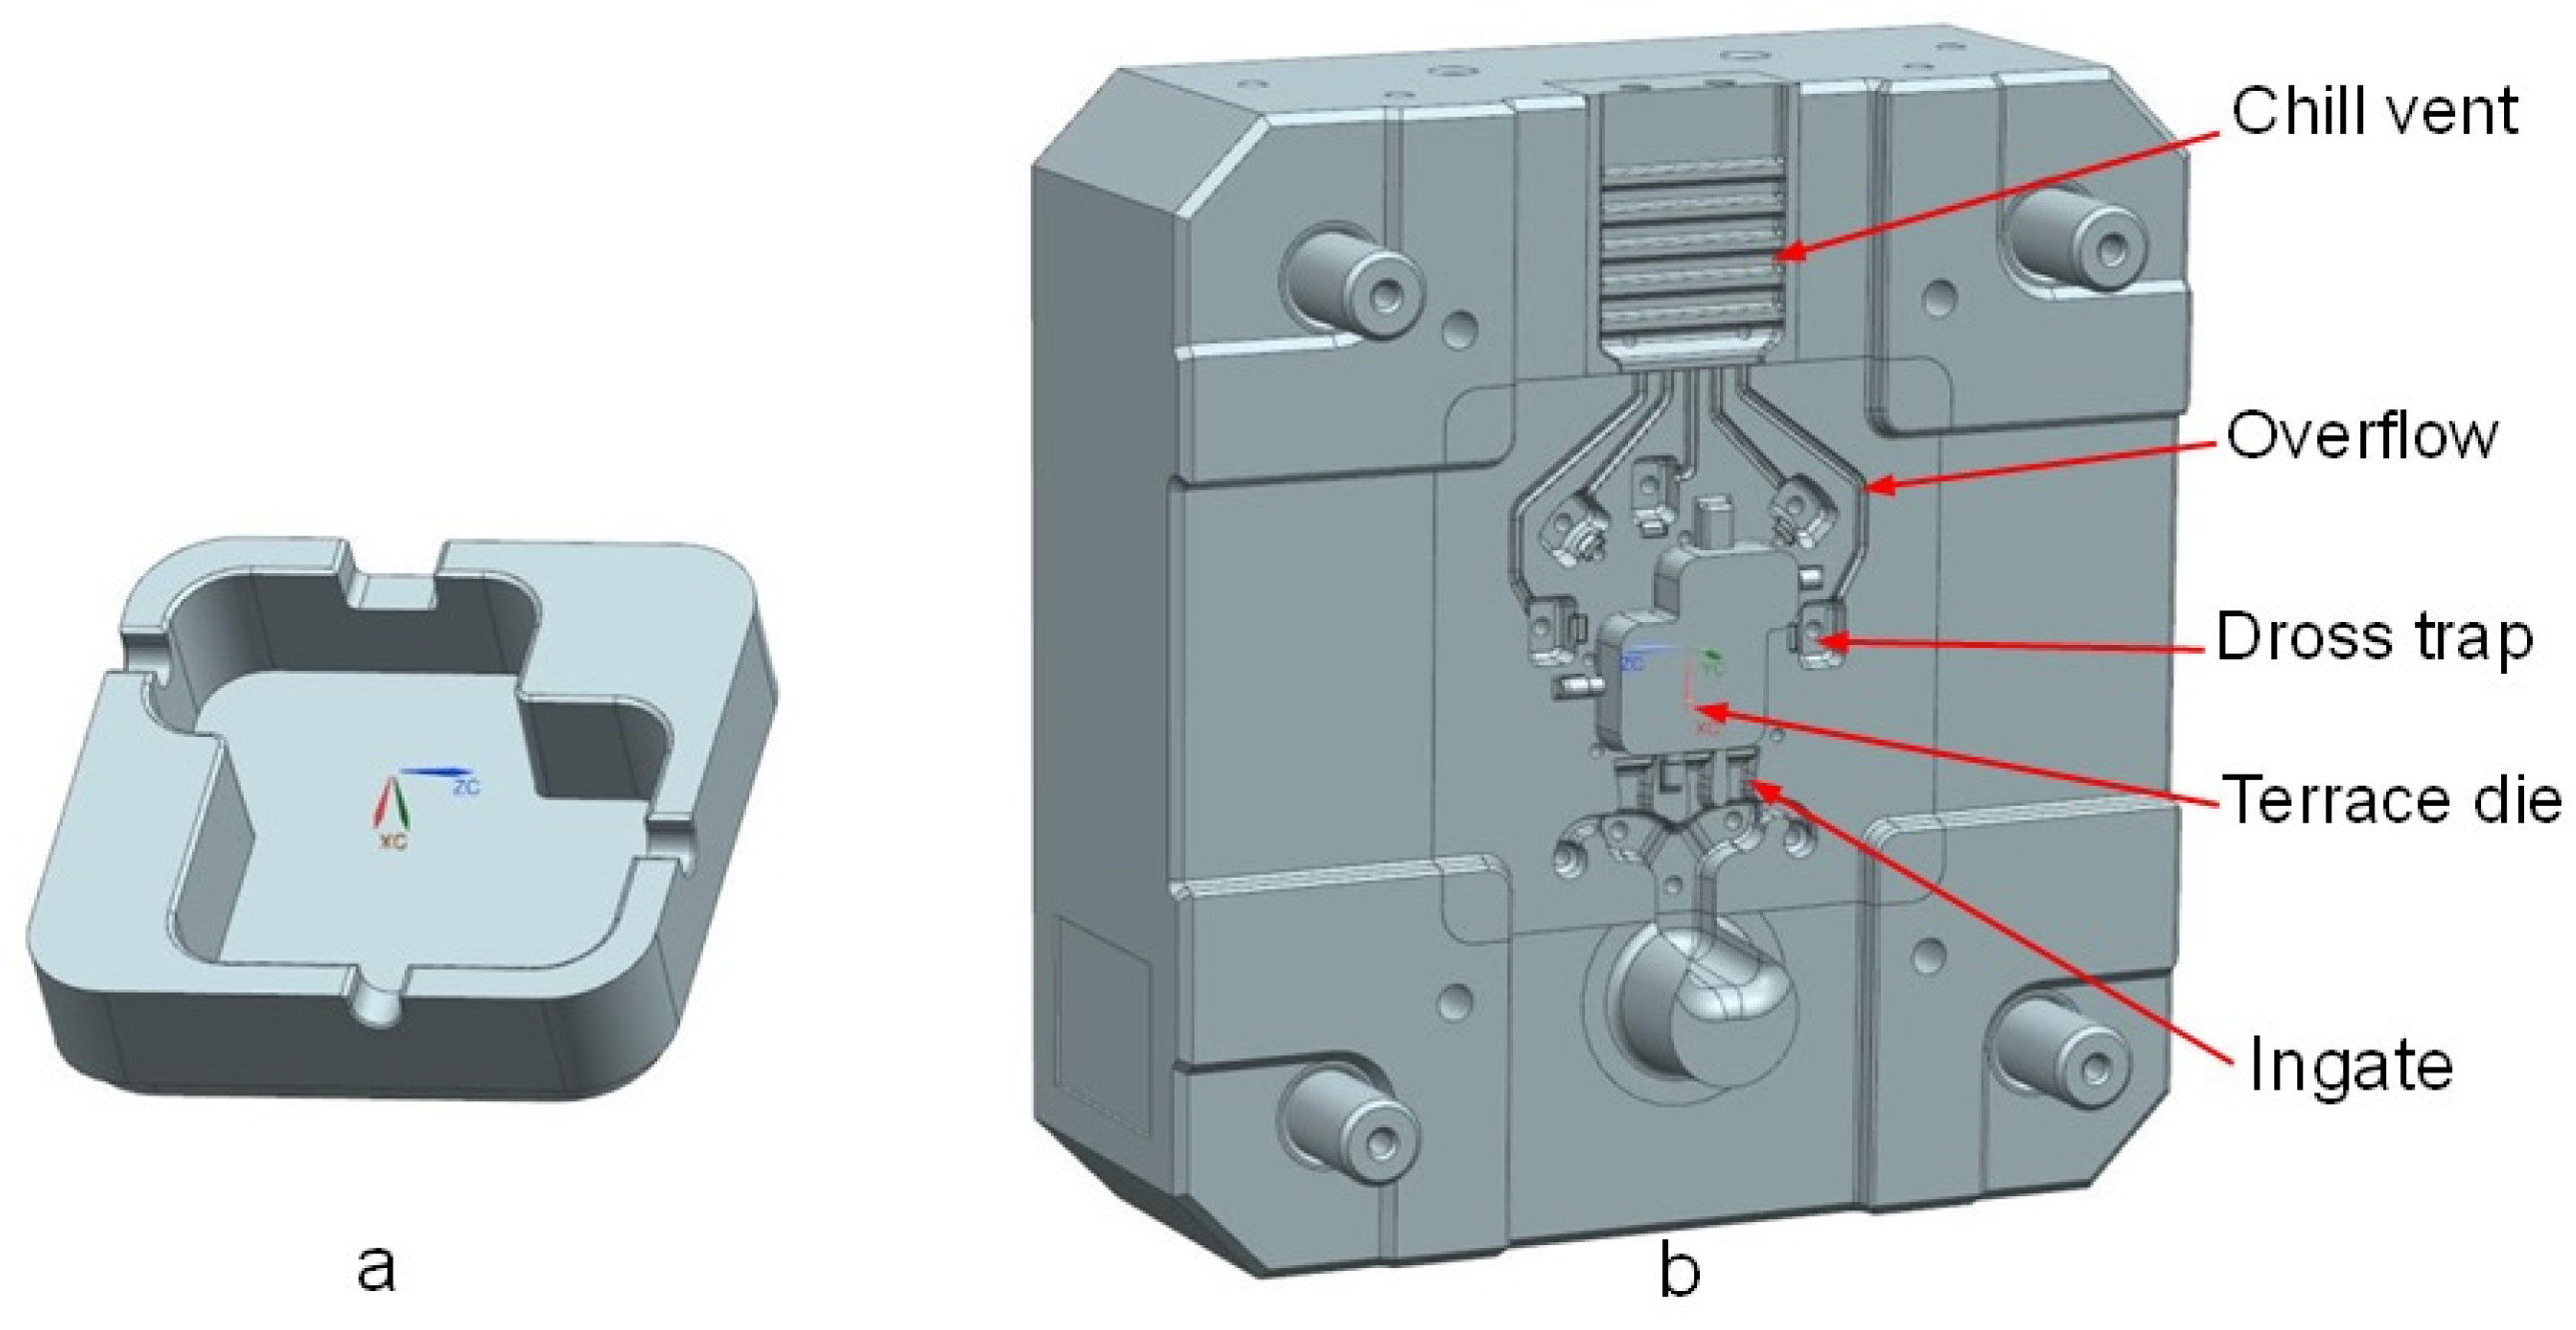
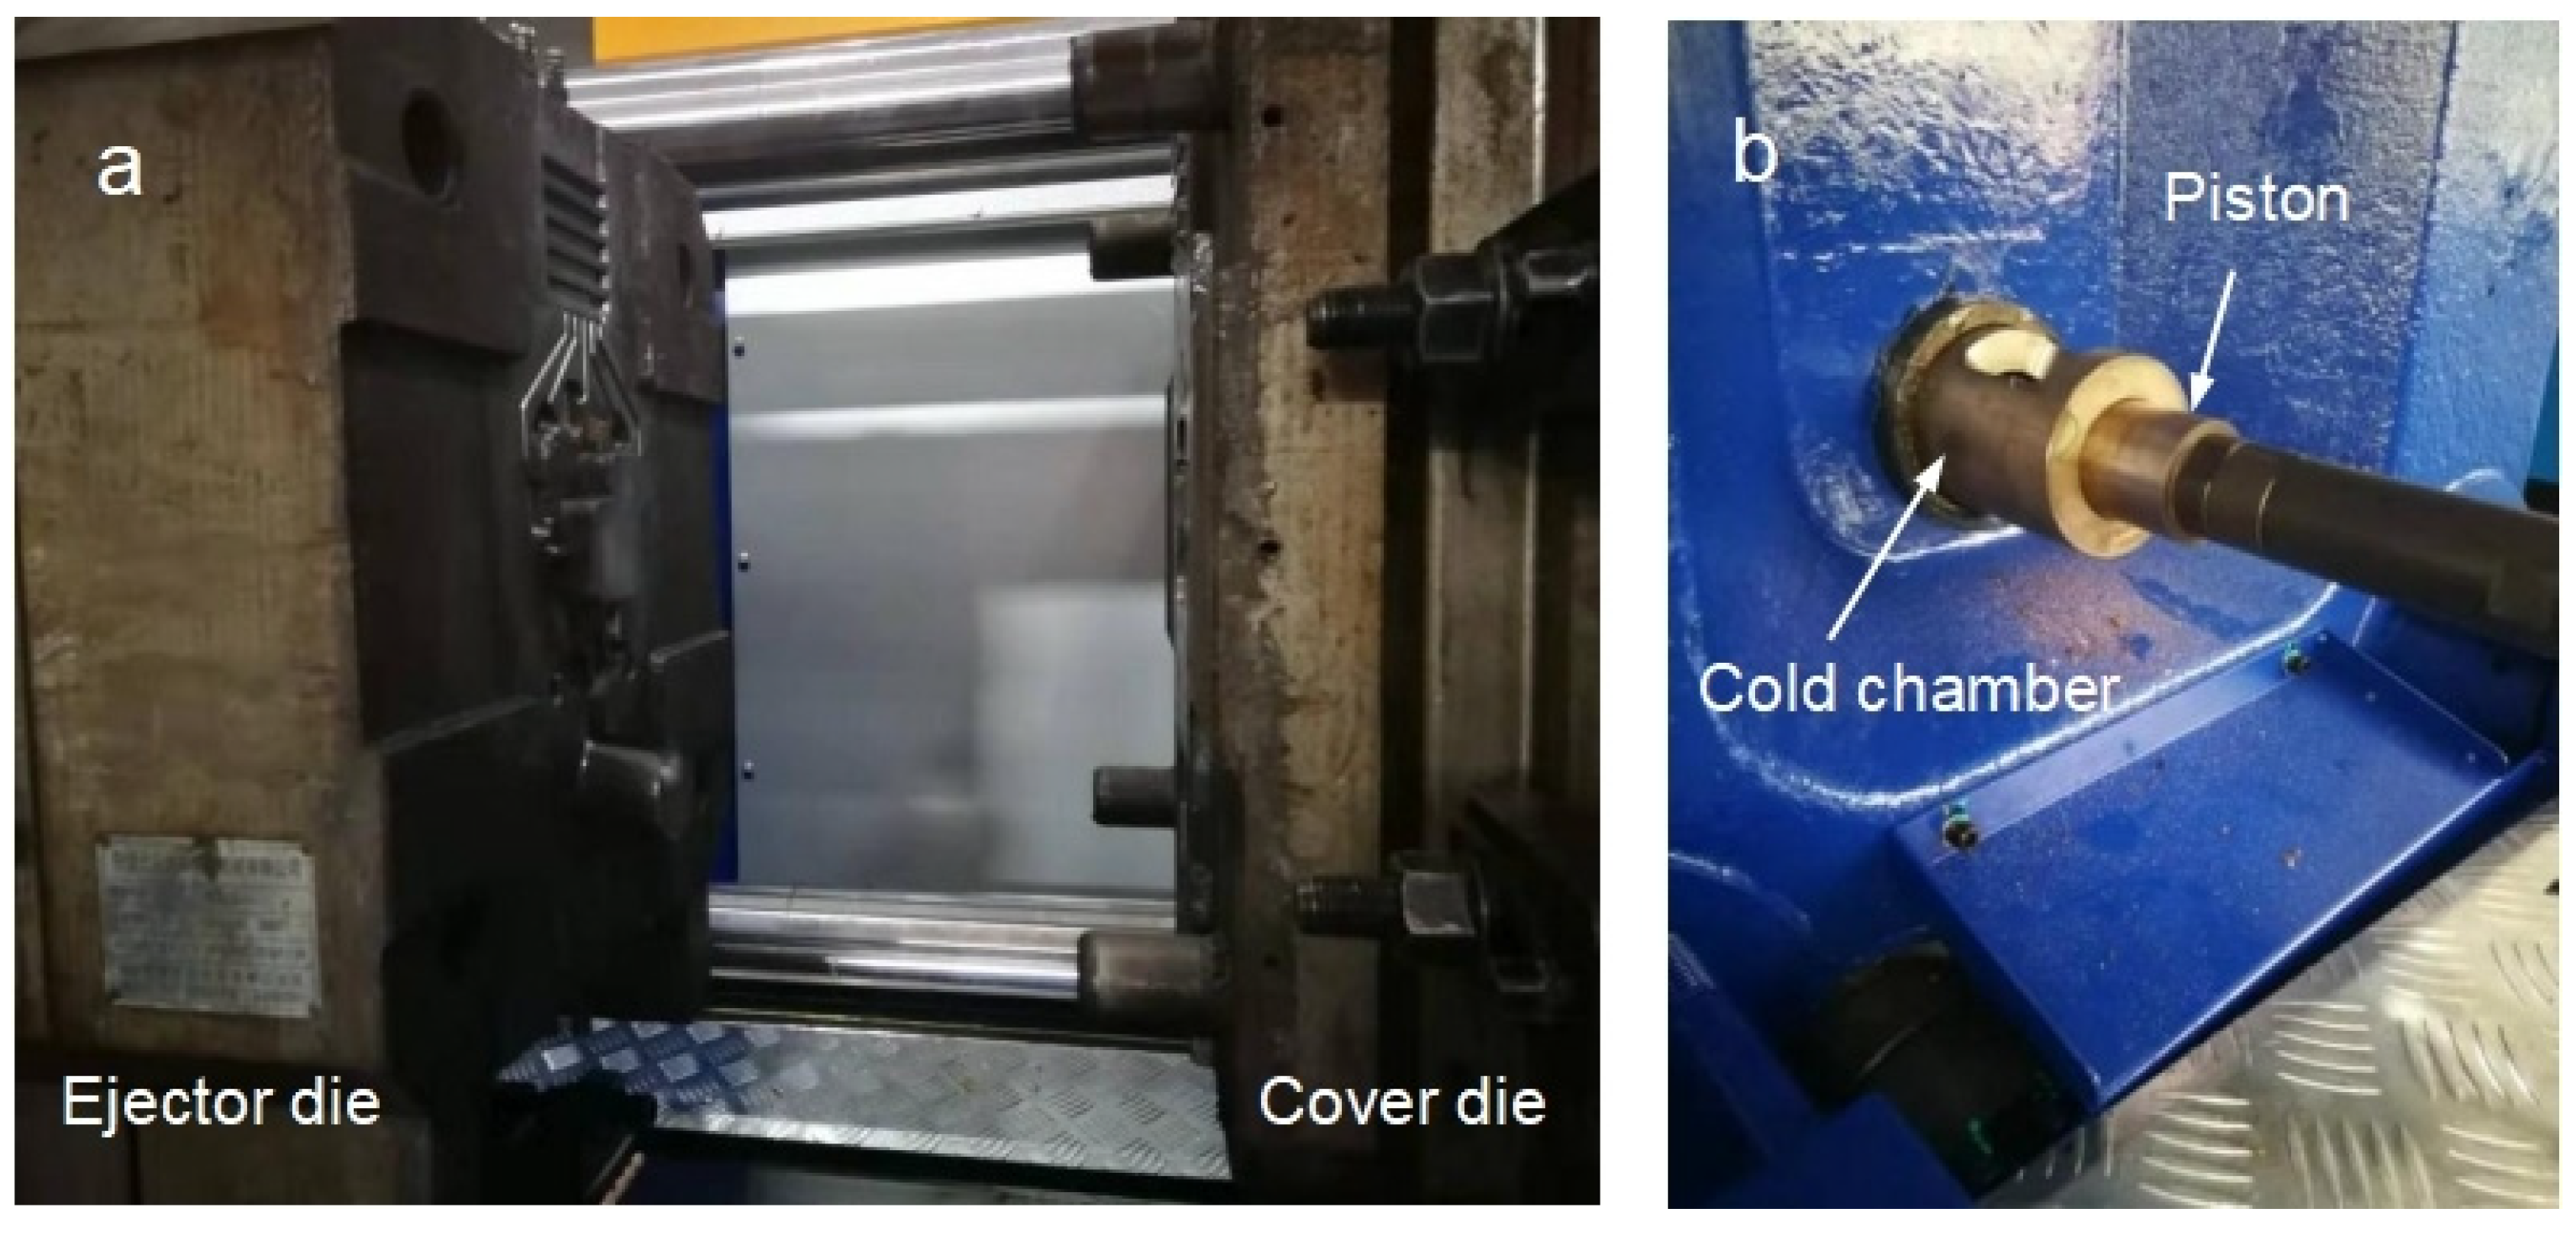
2.1. Experimental Procedures

An ashtray style sample with thin walls and two thick corners was used for studying the filling and feeding capacity under different HPDC conditions. According to Figure 1, the components of a die include the ingate, terrace die, dross trap, overflow, chill vent, etc. The chill vent is trapezoidal. It has the abilities of exhausting air and cooling liquid alloy injected into it. Therefore, the alloy injected into the chill vent could be used to determine the feeding ability of an alloy under different HPDC parameters. The volume of the die casting (including the sample, ingate, dross trap, overflow and chill vent) is about 164 cm3. The thickness of the ingate is 2 mm, and the sectional area is about 100 mm2.
As shown in Figure 2, the HPDC experiments were conducted using a cold-chamber die-cast machine HDC350-SF, which was manufactured by Ningbo Haitian Die-Casting Equipment Co., Ltd, Ningbo, China. The die mold was made of H13, and the composition of the cast aluminum alloy ADC12, essentially A383, is given in Table 1. The experiments were designed based on orthogonal experiment method. According to the characteristics of die-casting processes, four factors (i.e., melt injection temperature, piston velocity of slow stage, piston velocity of fast stage and pressure maintaining time) were selected as influencing factors, and each factor was set with four levels (shown in Table 2). The intensification pressure was set to 400 bar. To obtain a quasi-steady-state temperature in the shot sleeve and dies, 20 shots were made before producing the investigated castings. During the HPDC process, the temperature distribution of the dies was measured by an infrared camera. After obtaining the die castings, the porosity distribution in the castings was detected by an industrial CT.

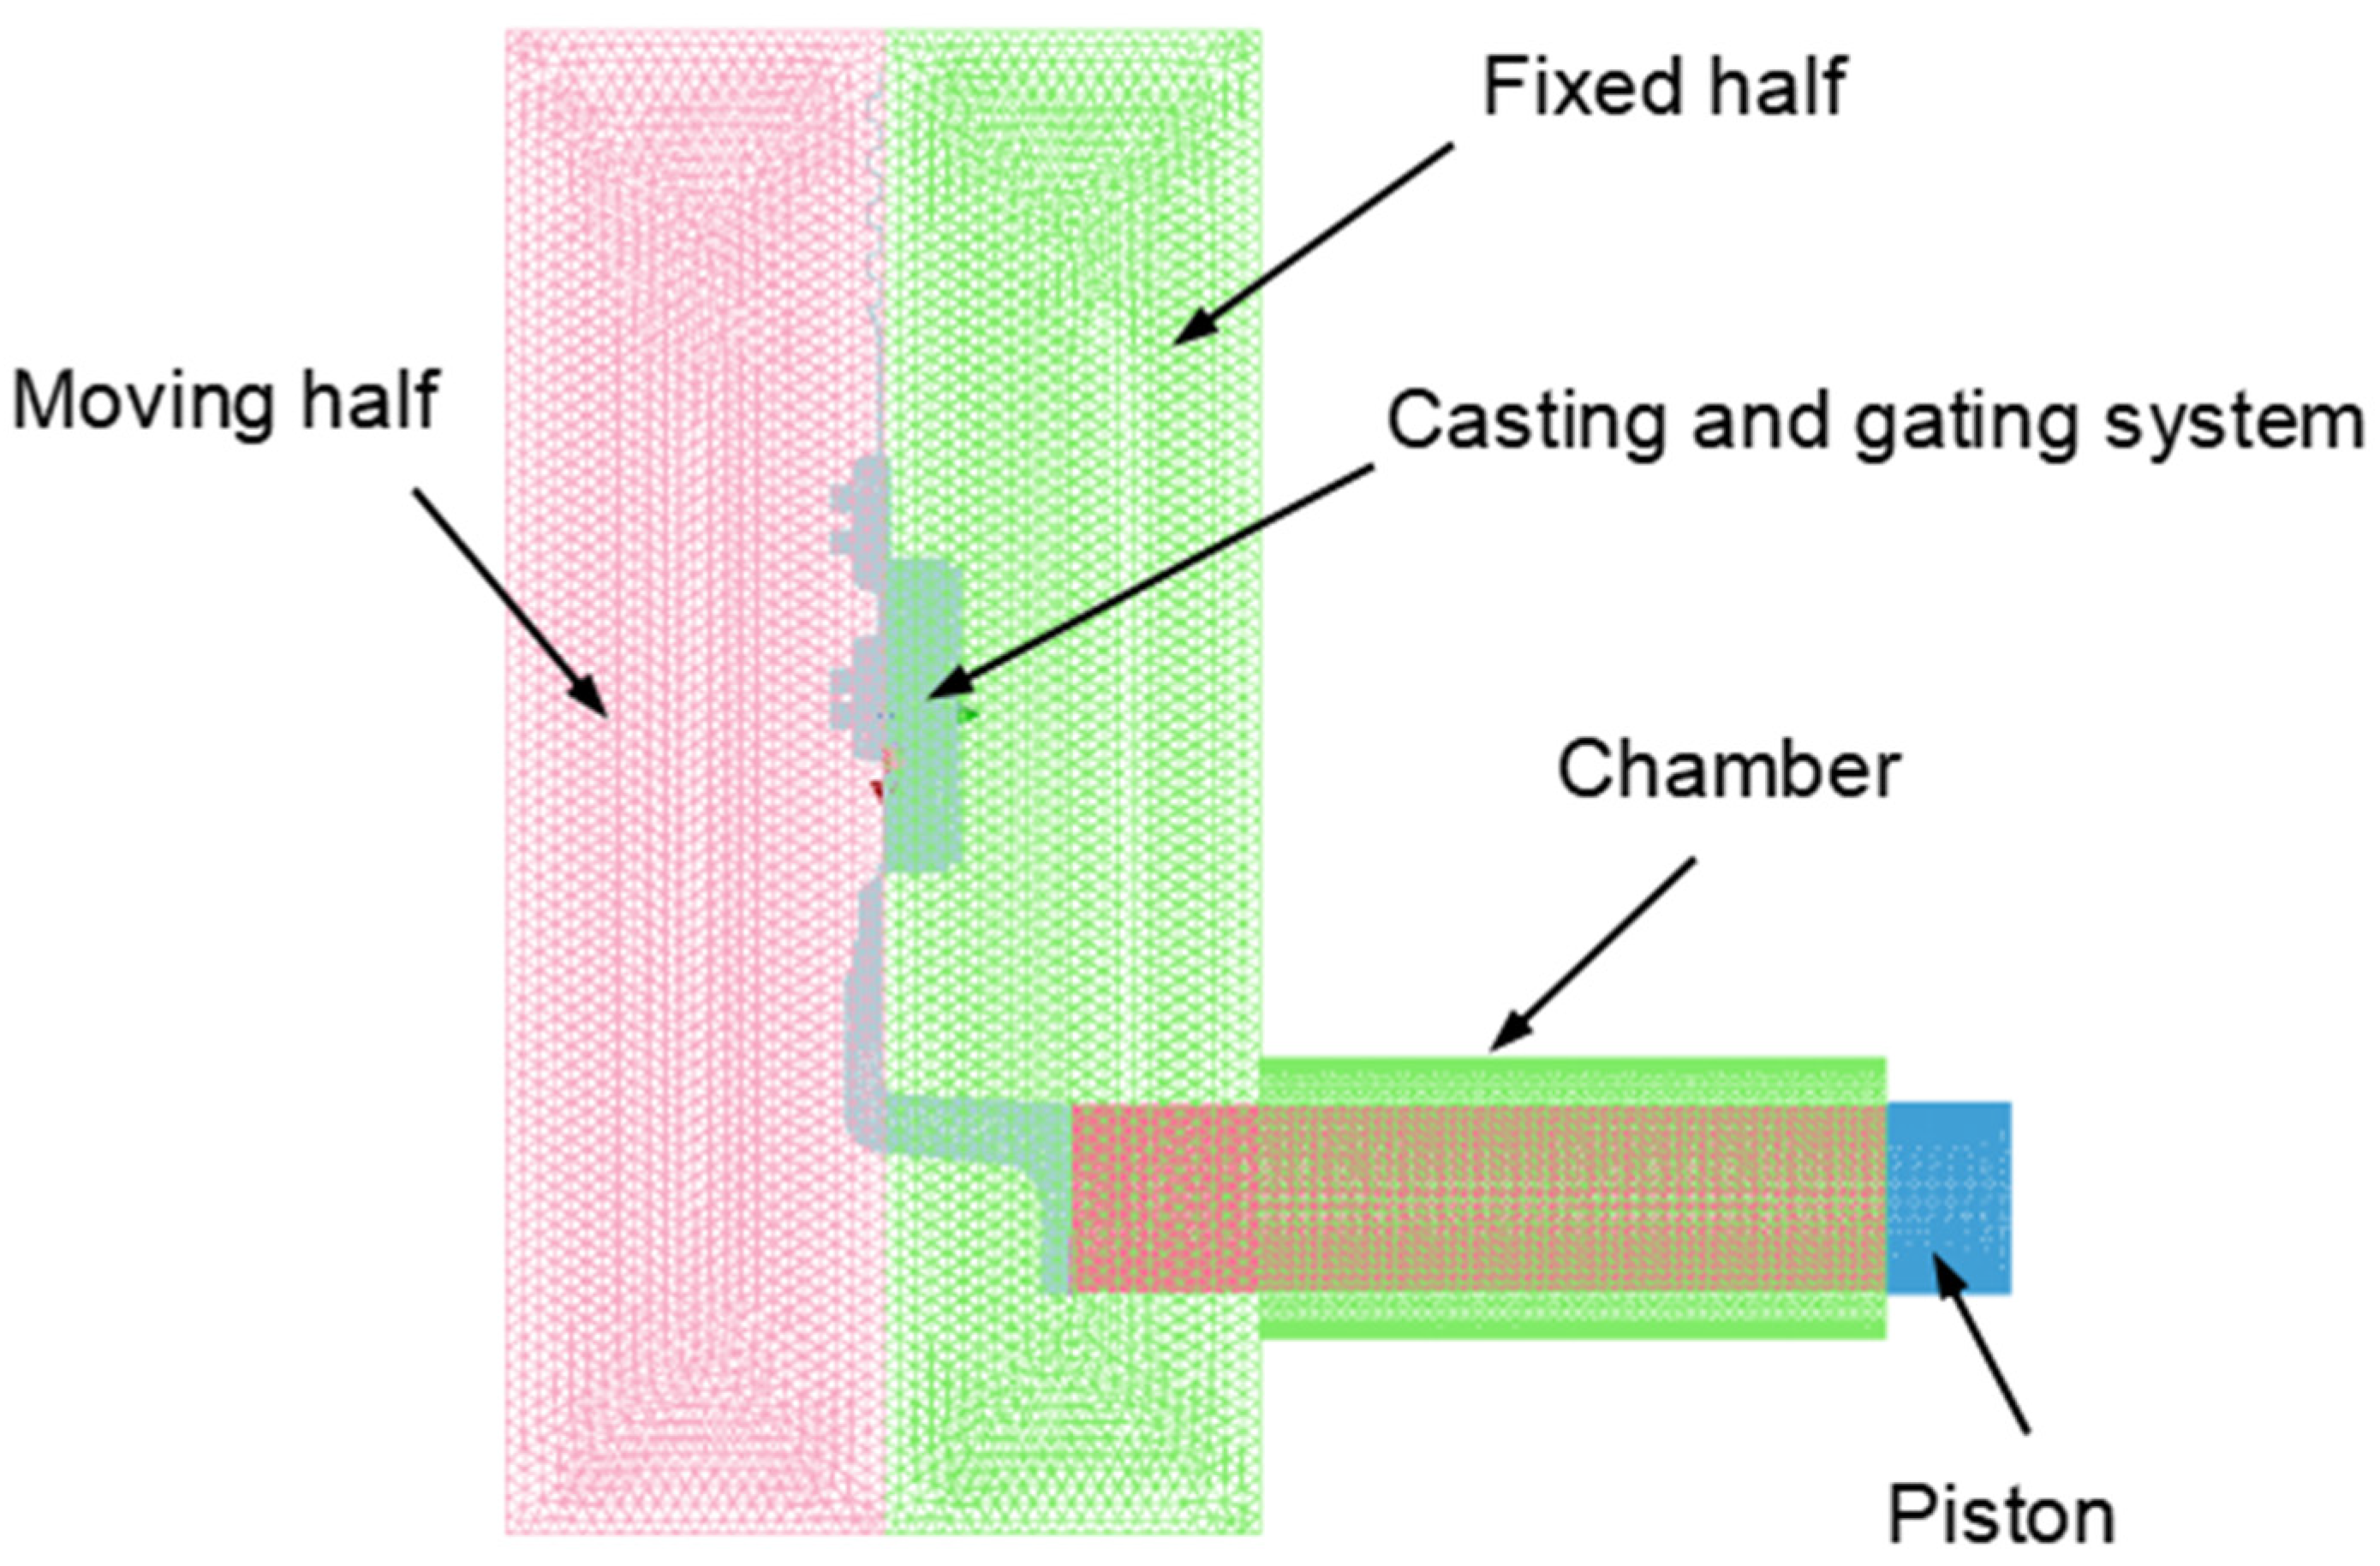
2.2. Modelling of High-Pressure Die-Casting Process

In this study, the commercial software ProCAST was employed to solve the thermal and fluid equations in the casting systems, which could identify the filling and solidification features in the HPDC process. This commercial software is based on the finite element method, which includes three interactive modules: Visual-Mesh, Visual-Cast and VisualViewer for FEM mesh generation, model discretization/calculation and result analysis, respectively. After the CAD files were imported and assembled in the commercial software, hybrid FEM meshes of the entire model were generated. Various mesh sizes should be defined according to the geometrical features and the desired calculation precision. Specifically, the die mold (including the ejector die and the cover die) mesh size was set to 8 mm, the chamber mesh size was set 4 mm, and the casting and gating system mesh size was set to 2 mm. Afterwards, the 2D and 3D meshes could be generated by the commercial software automatically (shown in Figure 3). The initial and boundary conditions of the HPDC process were defined in accordance with the actual casting practice, as shown in Table 3.

3. Results and Discussions

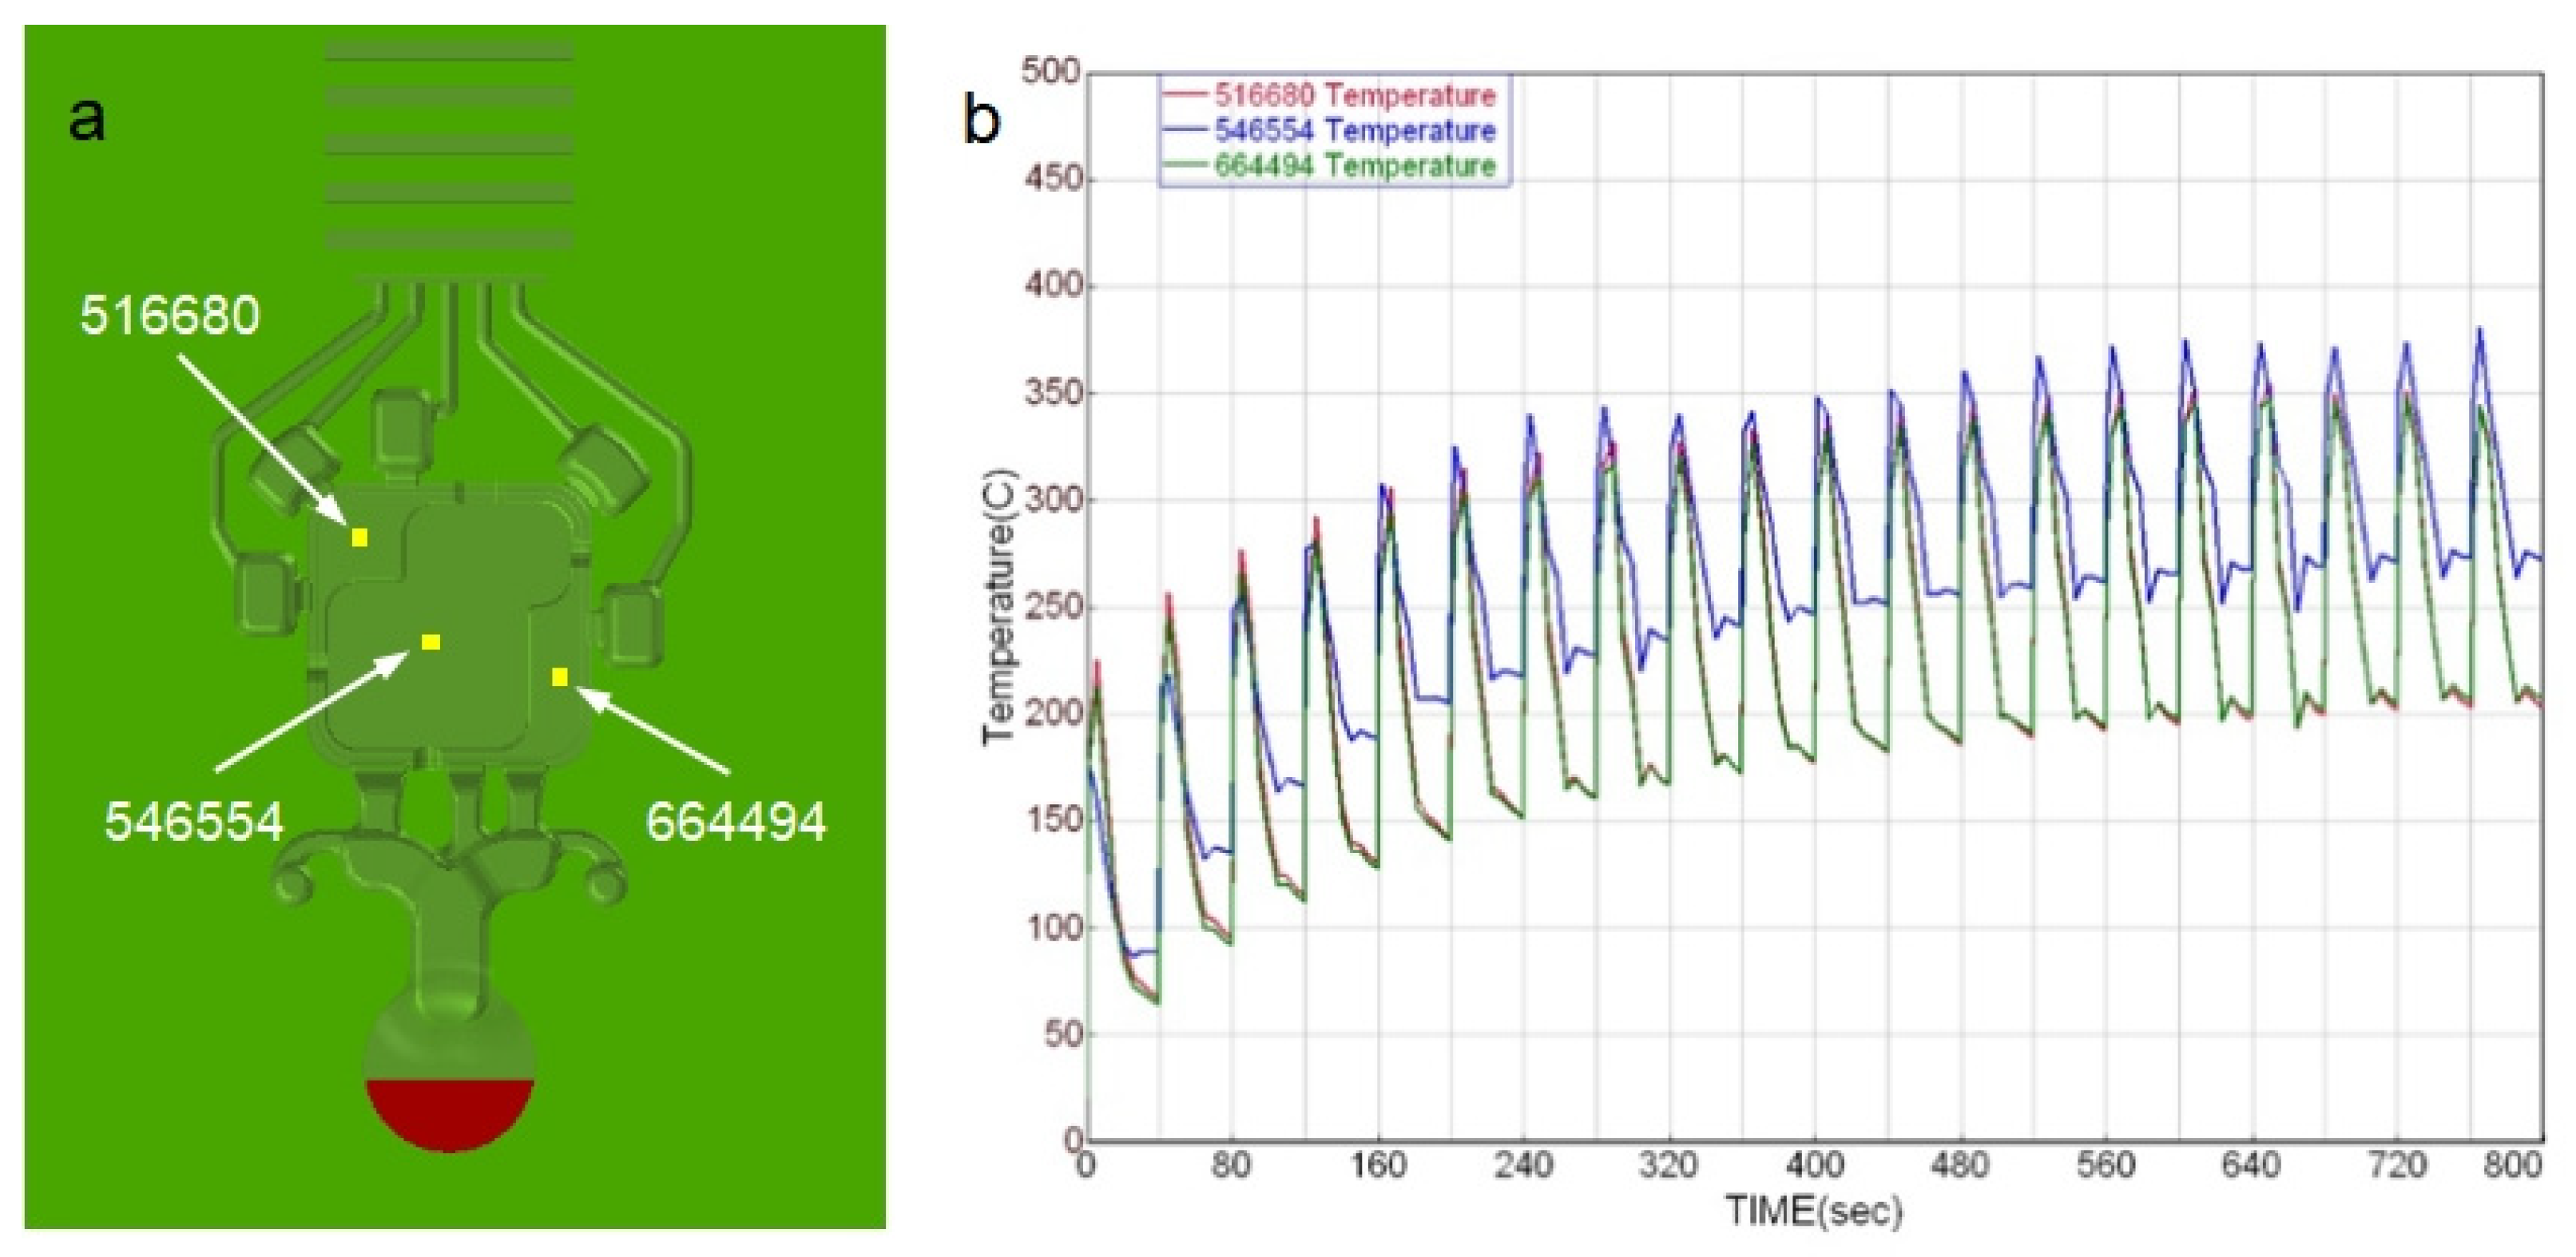
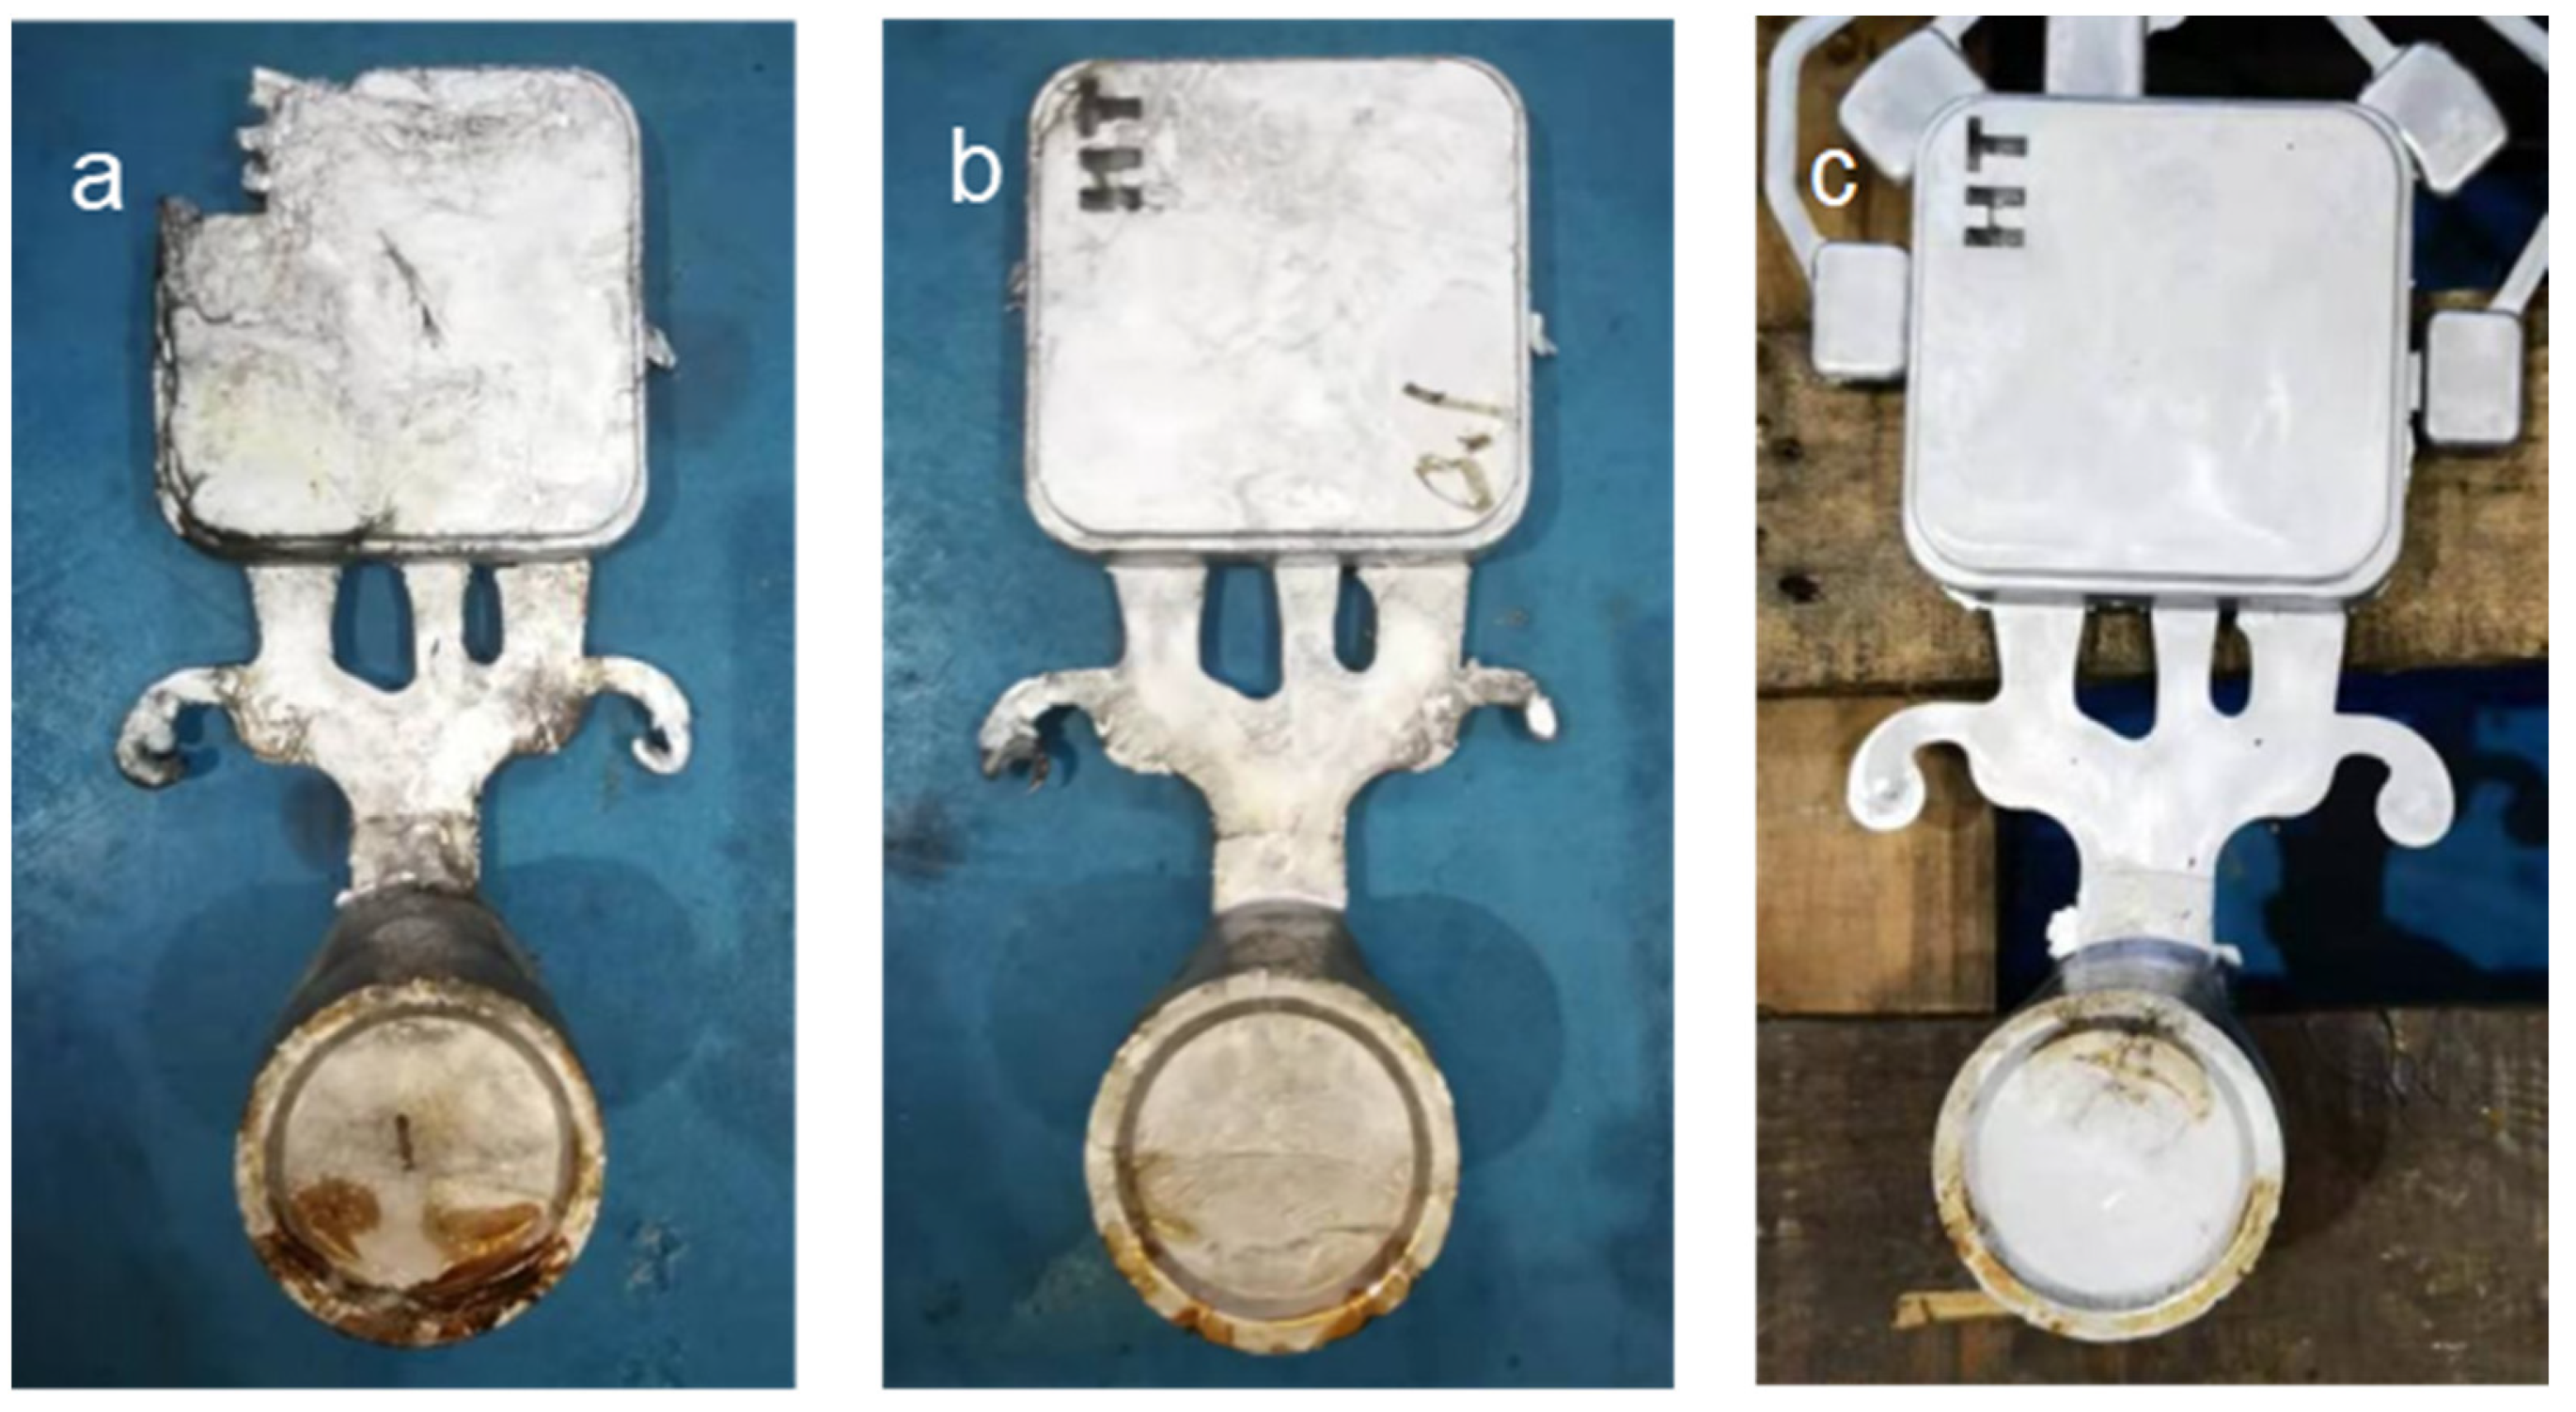
3.1. Preheating Cycles

Initially, the die temperature was assumed to be consistent with that of ambient air (20 °C). Before the formal orthogonal experiments of the HPDC process, preheating cycles were run in advance to make the die mold meet the temperature requirement. The simulation result of the die surface temperature during preheating cycles is shown in Figure 4. When the die cavity was filled with liquid metal, the die/cavity interface temperature increased rapidly due to the heat transfer. After the solidified casting was ejected from the die cavity, the die surface temperature was cooled by the spraying coolant and blowing air. After some cycles of preheating, the temperature of the die surface increased to achieve a quasi-steady state. Several castings produced during the preheating process are shown in Figure 5. It clearly shows the effect of preheating cycles on the die surface temperature.

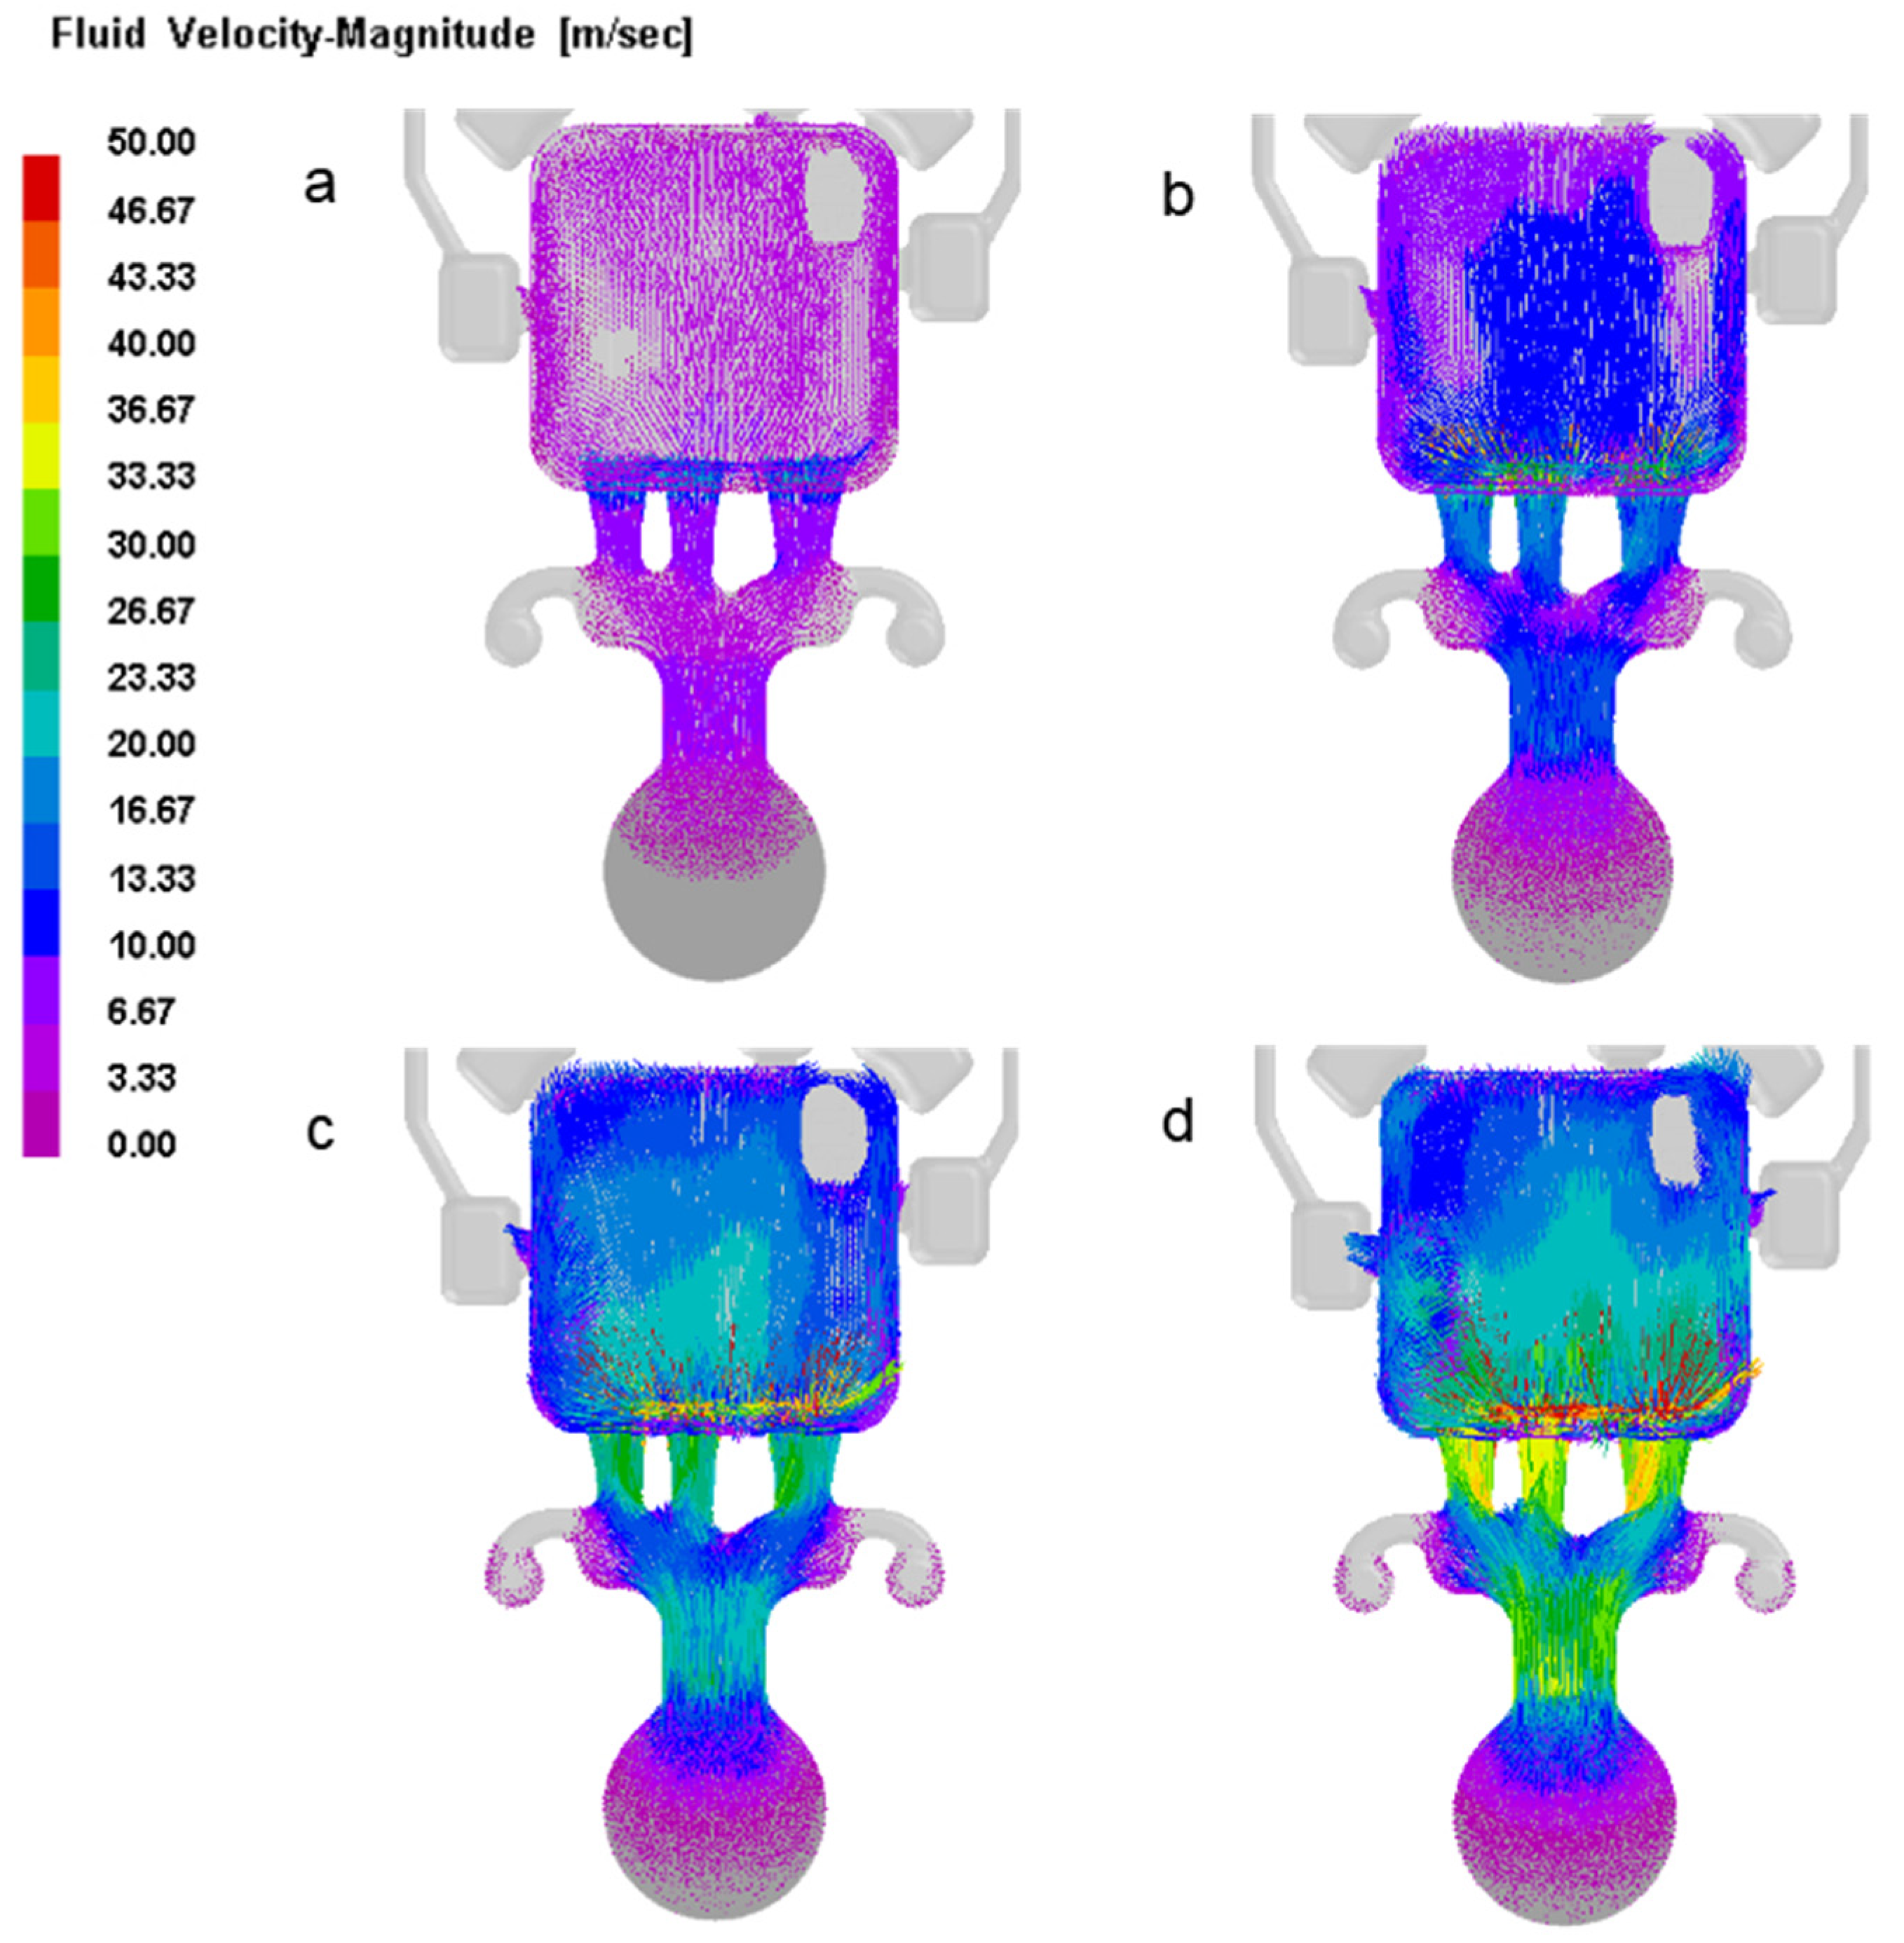
3.2. Flow Distribution at Chamber, Ingate and Die Cavity

After the liquid metal was poured into the chamber, there was still some air above the liquid surface. In order to build up a wave that could force the air to the front and to prevent the entrapment of air during the injection process, the piston should be moved forward slowly [18]. The simulation results of the flow distribution in the chamber during the slow stage of injection are shown in Figure 6. As the piston velocity increased, the liquid wave also increased gradually. When the piston velocity was set to 0.1 m/s or 0.2 m/s, the liquid metal remained relatively stable. As the piston moved forward and the liquid metal rose steadily, the air was forced to the front and was discharged out of the chamber. When the piston velocity reached 0.4 m/s, the liquid wave became more obvious. When the piston velocity exceeded 0.4 m/s, it had the potential to cause a breaking wave, which would result in air entrapment.
When the liquid metal reached the ingate, the slow stage of injection switched rapidly to the fast stage of injection for the die cavity filling. In this process, the flow velocity at the ingate increased rapidly, and the flow velocity of liquid metal at the die cavity increased accordingly. The simulation results of the flow distribution at the ingate and the die cavity during the fast stage of injection are shown in Figure 7. When the piston velocity was set to 0.8 m/s, the velocity of liquid metal at the ingate was about 23 m/s. When the liquid metal entered the die cavity, the velocity of liquid metal was small, and the density of fluid vectors was small accordingly. When the piston velocity was up to 3.2 m/s, the flow rate of liquid metal at the ingate was about 90 m/s. Compared with the above conditions, when the liquid metal entered the die cavity, the liquid metal flow rate was larger and the density of fluid vectors was also significantly increased, which would help to improve the filling and feeding capacity of die castings.

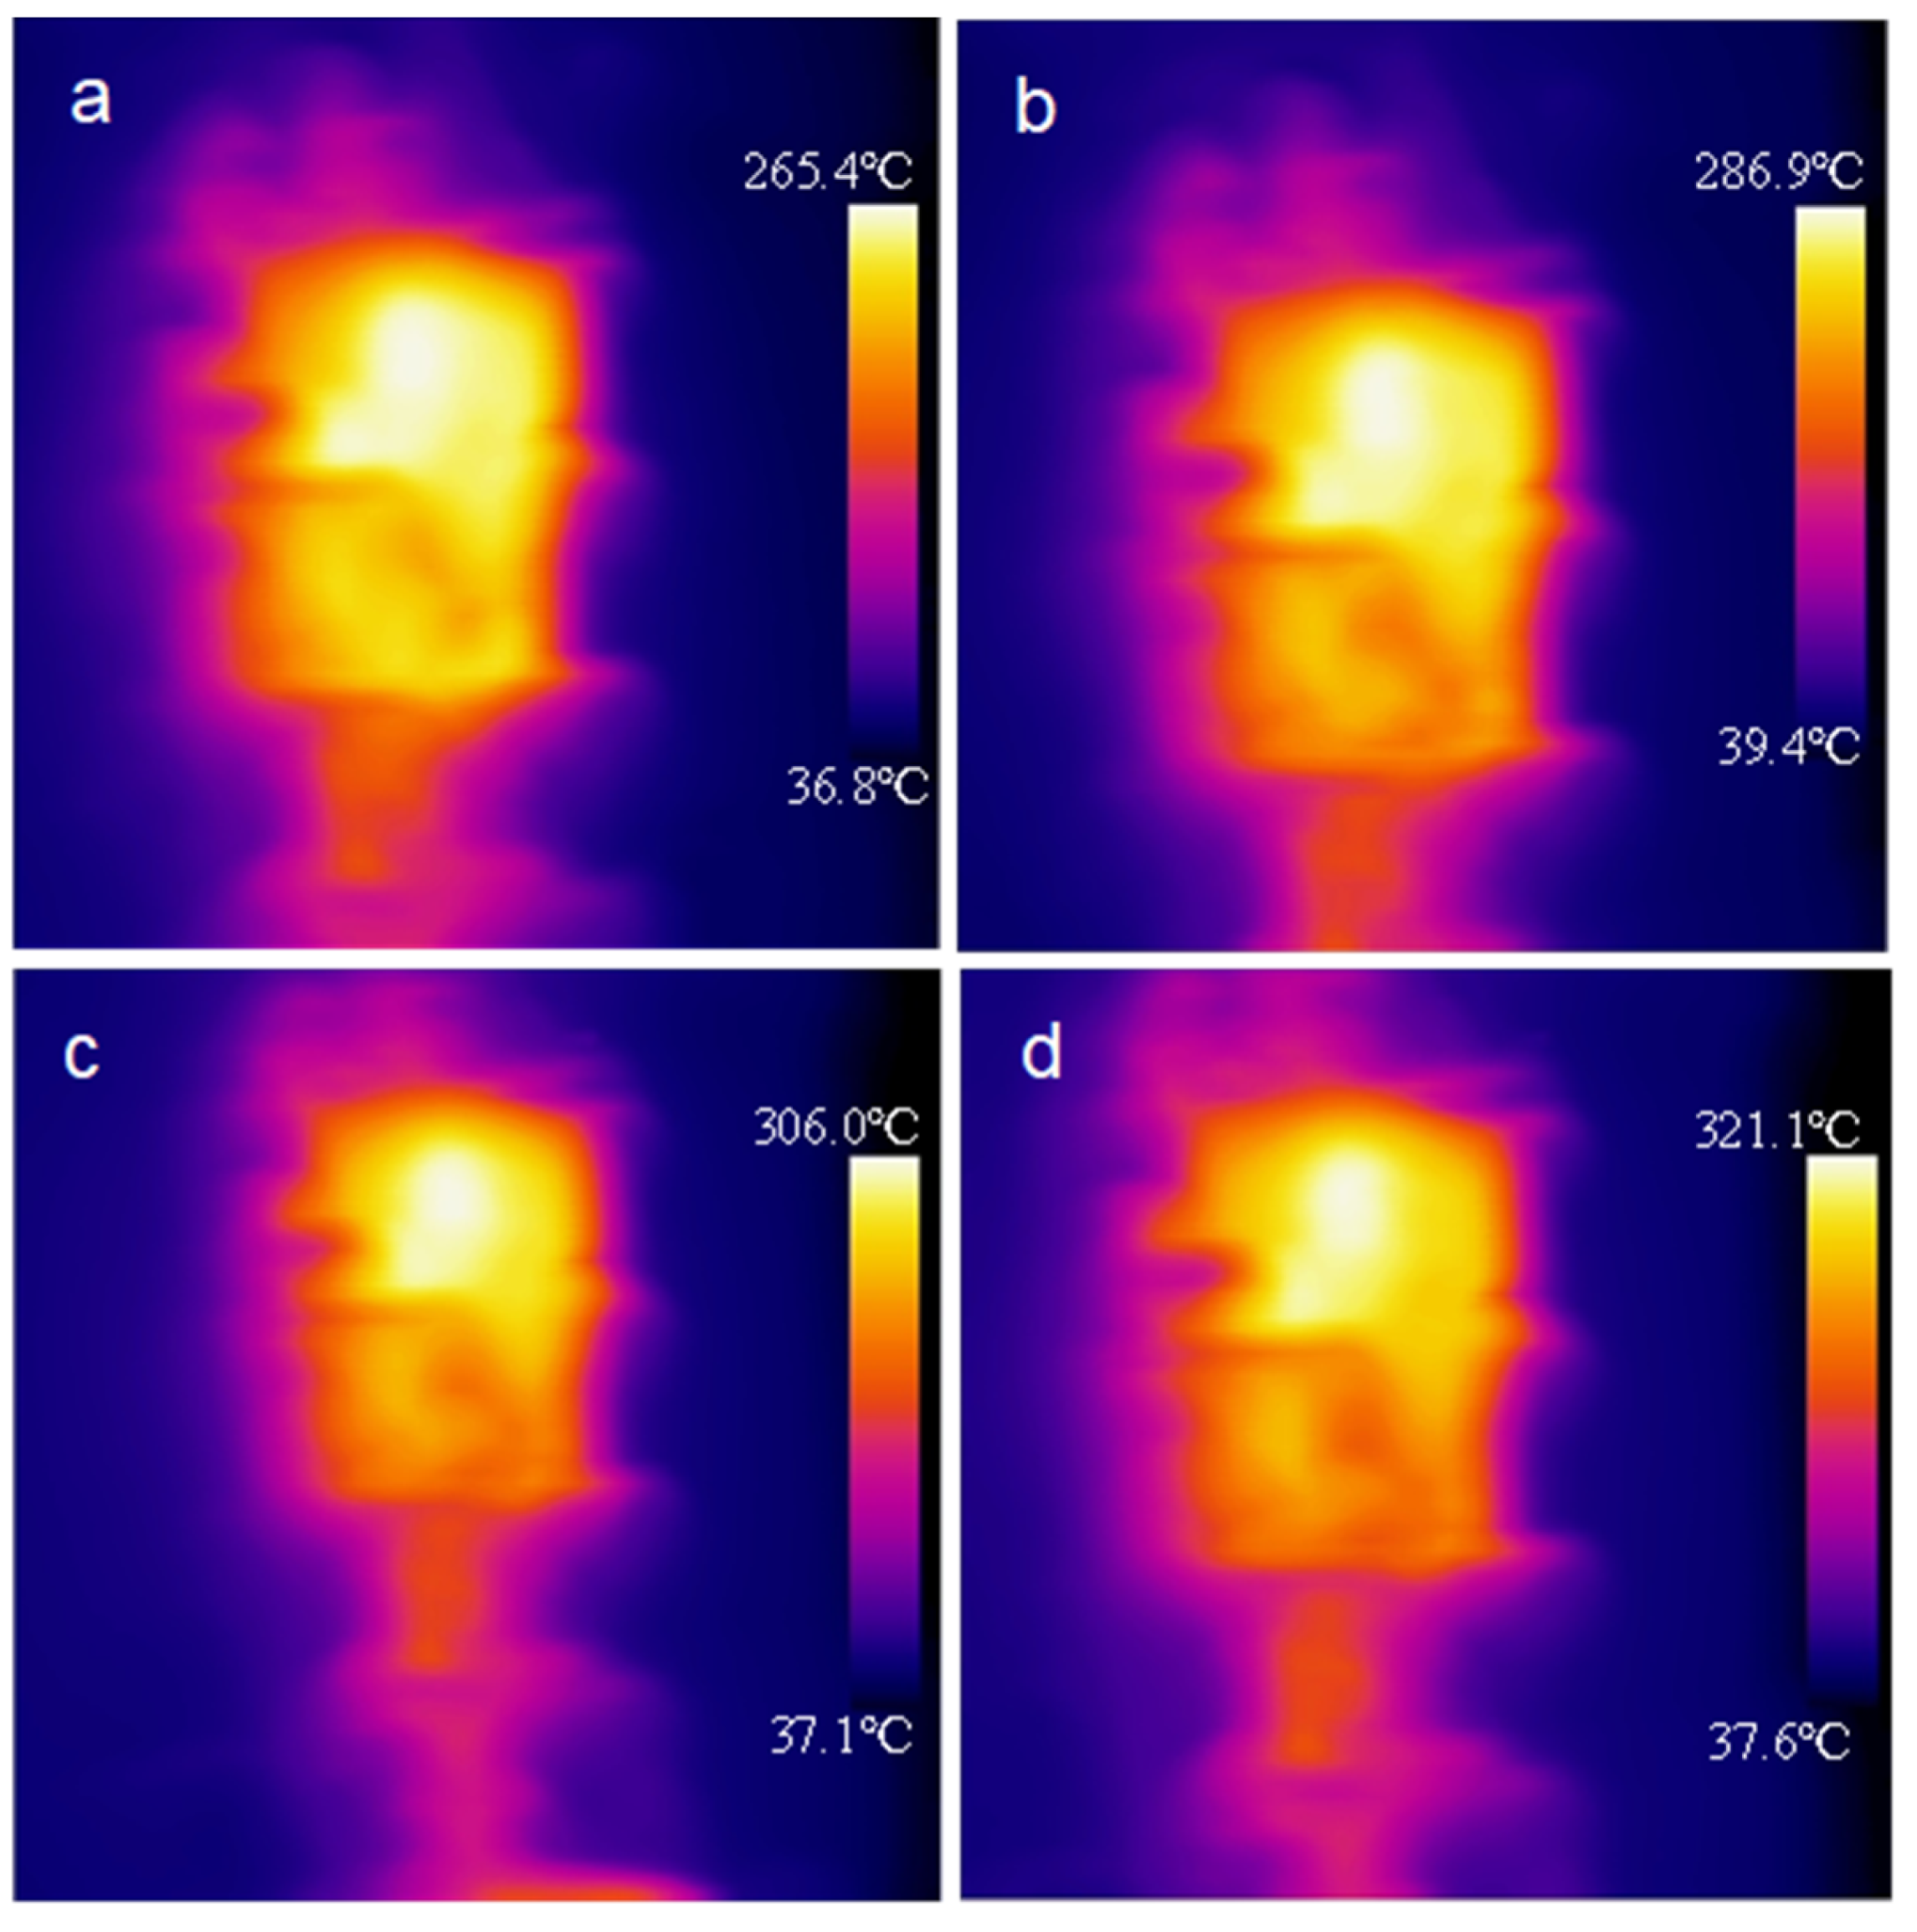
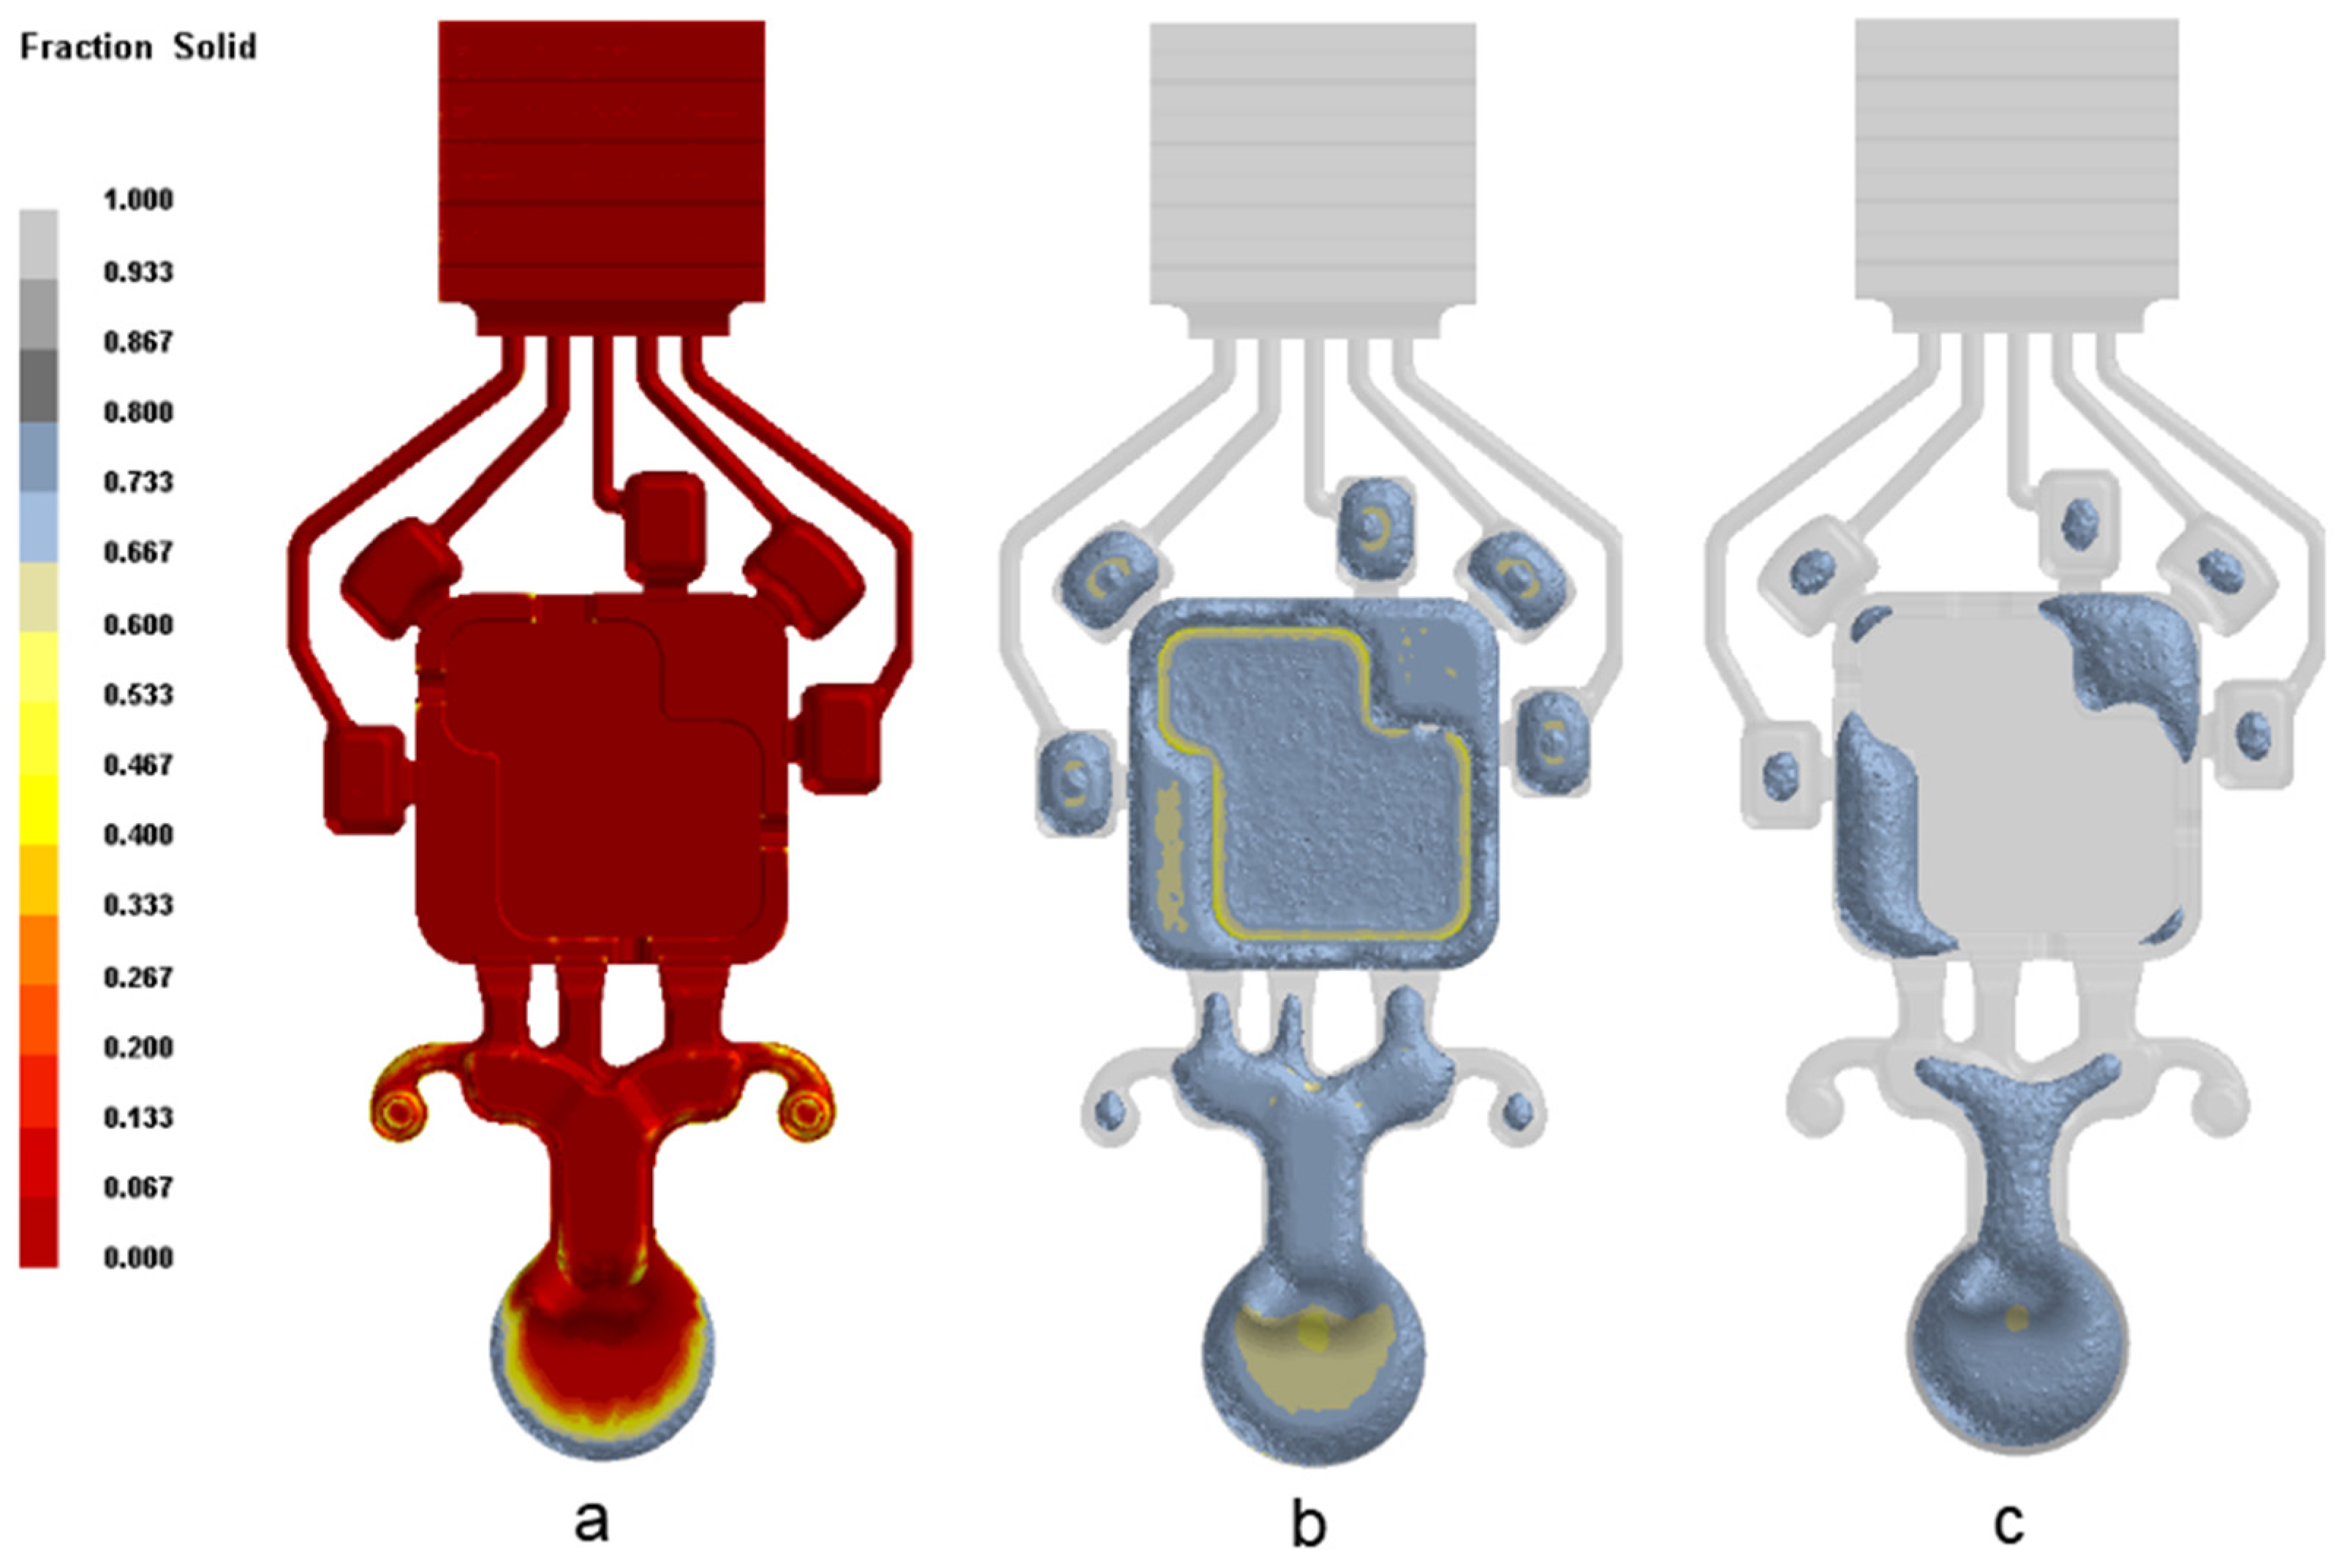
3.3. Temperature Distribution and Solidification Process

The surface temperature of the moving die mold was captured by a thermal image (shown in Figure 8). When the die mold was in a position where it made direct contacted with the liquid metal, it had the highest temperature. The temperature of the internal position of the die mold decreased sharply. Additionally, as the melt injection temperature increased, the die surface temperature increased accordingly. When the melt injection temperature was 620 °C, the highest die surface temperature was about 265 °C. When the melt injection temperature was increased to 680 °C, the highest die surface temperature was 321 °C.
The simulation results of the casting solidification are shown in Figure 9. The ingate solidified rapidly due to its lack of thickness and the strong cooling capacity of the die. Because of the uneven thickness of the casting body and dross trap, the solidification process of the whole part was different. Specifically, the thin wall and edge of the casting solidified first, and the casting body and dross trap solidified later. The solidification time of hot spots was much longer than that of the ingate. It could be seen that the solidification time of the ingate was very short. When the ingate was solidified, the solidifying metal in the die cavity was difficult to feed; therefore, it was easy to form shrinkage porosity in the hot spots.

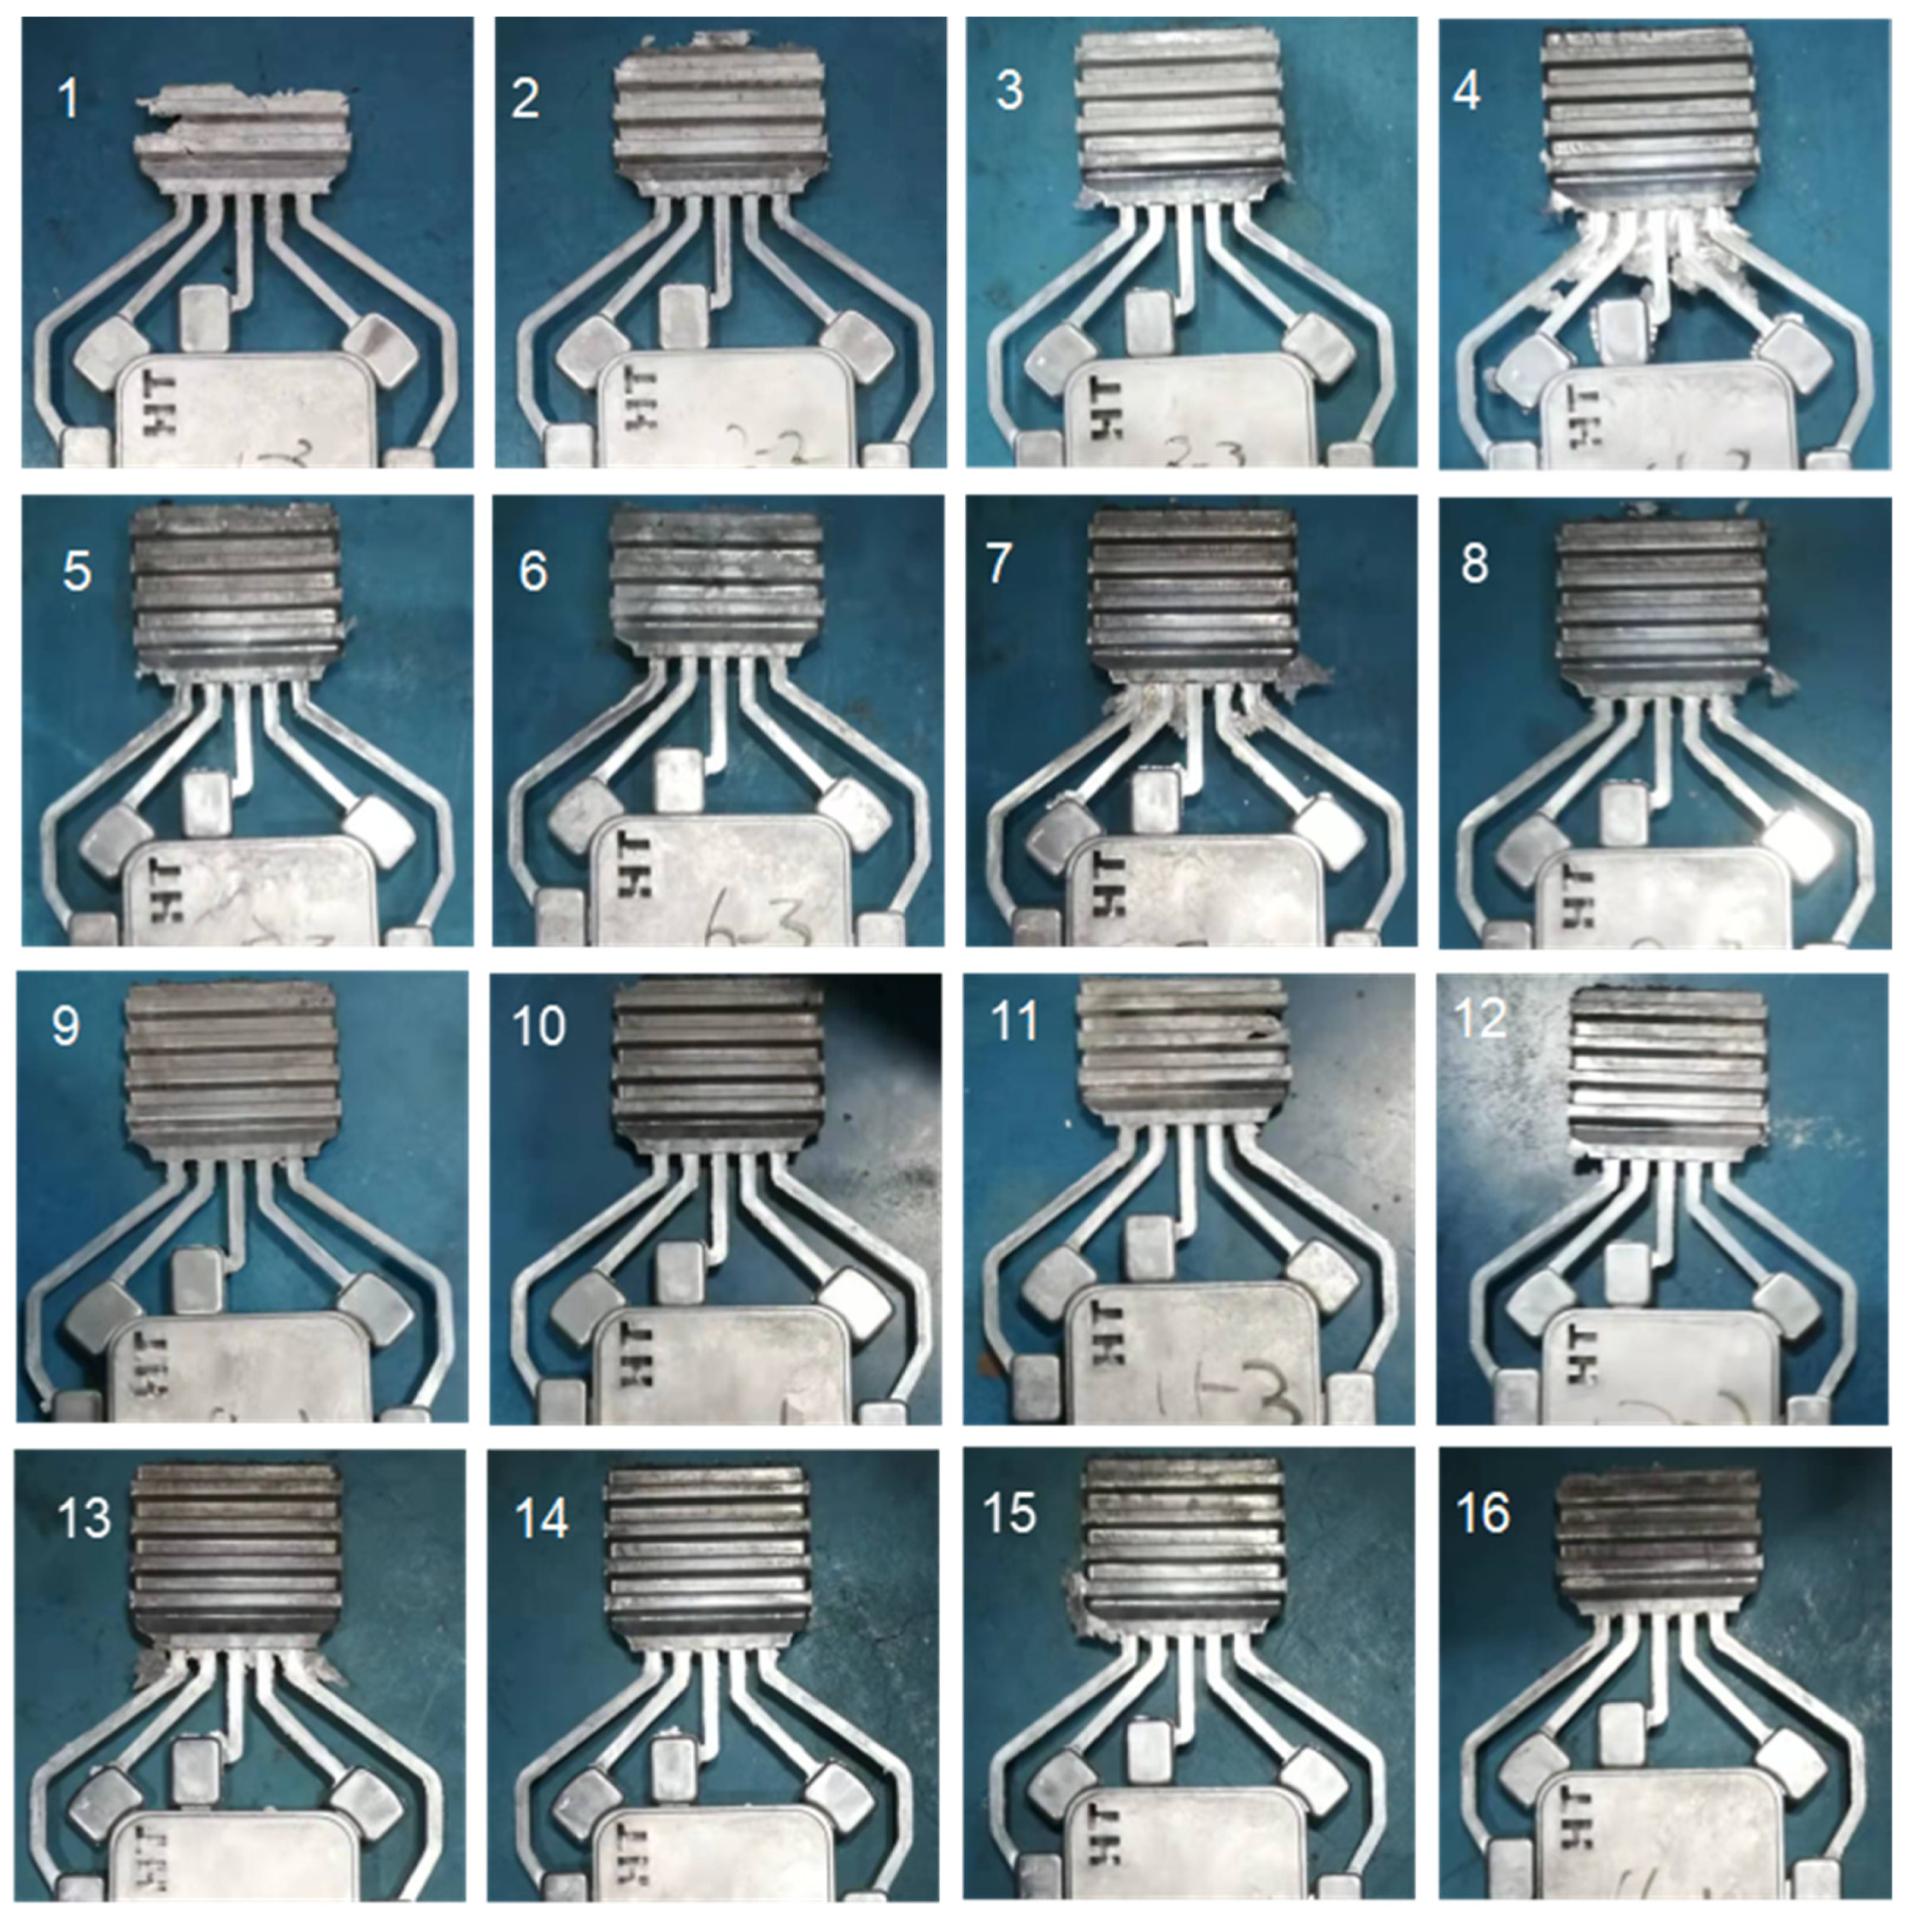
3.4. Filling Capacity under Different Process Conditions

The die castings with a chill vent produced by different pouring conditions are shown in Figure 10. It could be noticed that all die castings had complete shapes and smooth surfaces, but the filling length of the chill vent varied with different process conditions. Therefore, the chill vent could be used to evaluate the filling capacity under different process conditions.
The filling capacity results are summarized in Table 4. The results indicate that the filling length of the chill vent varied from two grids to four grids. Specially, under the process condition of test No. 1, the chill vent was filled with two grids. Under the process condition of test No. 2, 6, 11 and 16, the chill vent was filled with three grids. Under the process condition of test No. 3 and 4, the chill vent was filled with 3.5 grids. Under the process condition of test No. 5, 7, 8, 9, 10, 12, 13, 14 and 15, the chill vent was filled with four grids. Additionally, under the process condition of test No. 4, 7 and 13, there was obvious flash in front of the chill vent.
The test results were processed utilizing the range analysis method (shown in Table 5). The results of range analysis show that the piston velocity of fast stage had an obvious impact. A comparison of the results between 0.8 m/s, 1.6 m/s, 2.4 m/s and 3.2 m/s indicated that an increase in the piston velocity of the fast stage led to a better filling capacity. The melt injection temperature could also affect the filling capacity. The filling capacity would be limited in the condition of the low melt injection temperature. When the melt injection temperature was higher than a certain value, there would be no obvious change in the filling capacity. There was no significant difference between the application of different levels in the filling capacity for both the piston velocity of the slow stage and the pressure maintaining time. Therefore, the filling capacity did not show obvious dependency on the piston velocity of slow stage and the pressure maintaining time.

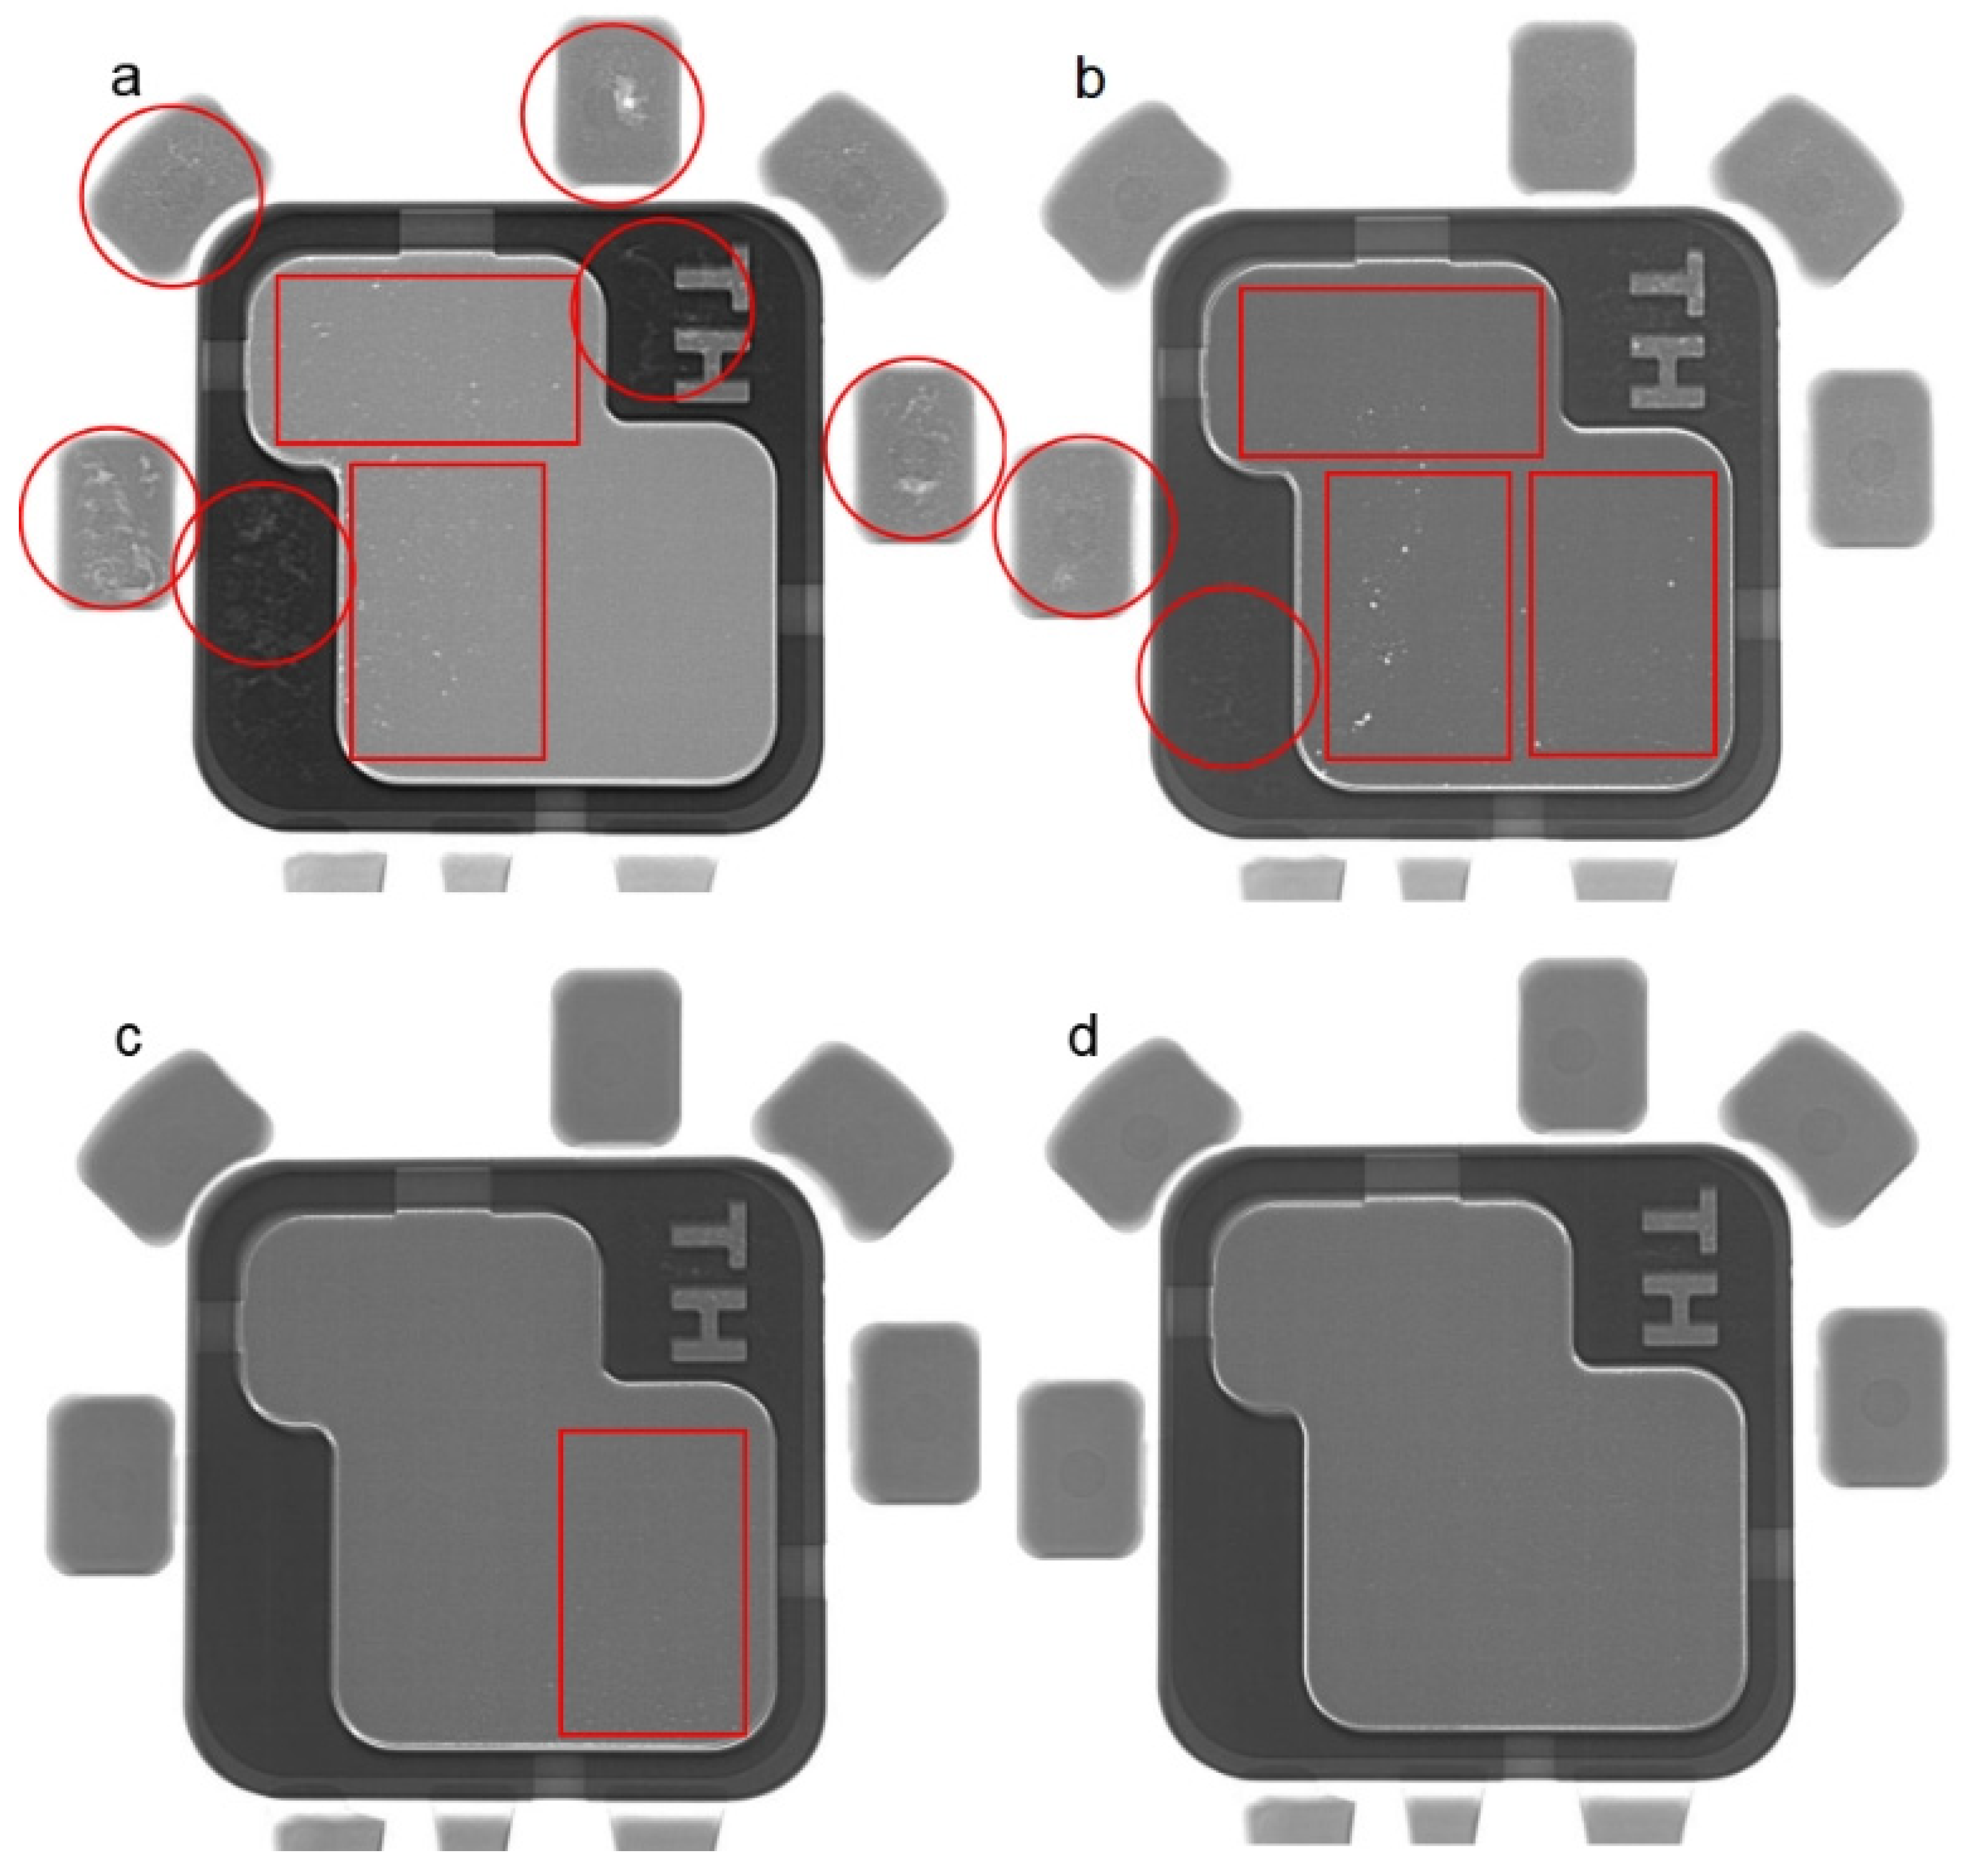
3.5. Feeding Capacity under Different Process Conditions

In order to evaluate the shrinkage porosity, seven locations were detected: five dross traps and two thick parts (lower left corner and upper right corner). If more than half of them had obvious shrinkage porosity, the risk level was set as 2. If less than half of them had slight shrinkage porosity, the risk level was set as 1. If no shrinkage porosity was found, the risk level was set as 0. In order to evaluate the gas porosity, three locations were detected: two parts near the ingate and one part far from the ingate. If more than half of them had obvious gas porosity, the risk level was set as 2. If less than half of them had slight gas porosity, the risk level was set as 1. If no gas porosity was found, the risk level was set as 0. The typical scanning results of industrial CT are shown in Figure 11. It could be found that the degree of shrinkage porosity was different under different process conditions. Specifically, under the process conditions of test No. 1, 6, 11 and 16, there existed obvious shrinkage porosity in the thick position of the casting body and in the dross trap. Under the process conditions of test No. 2, 5 and 12, there existed slight shrinkage porosity. Under the process conditions of test No. 3, 4, 7, 8, 9, 10, 13, 14 and 15, there was no shrinkage detected. The shrinkage porosity results are summarized in Table 4, and the orange analysis results are shown in Table 6. The results show that the piston velocity of fast stage had obvious impact. If the piston velocity of fast stage was increased, the shrinkage porosity could be reduced to a large extent. Comparatively, the melt injection temperature and the piston velocity of the slow stage did not show an obvious influence on reducing the shrinkage porosity.
According to Figure 11, it could be found that the degree of gas porosity was different under different process conditions. Specifically, under the process conditions of test No. 1 and 2, the gas porosity was widely distributed in the large plane of casting. Under the process conditions of test No. 3, 4, 5, 6, 8, 11, 12, 15 and 16, a small amount of gas porosity was found around the ingate. Under the process conditions of test No. 7, 9, 10, 13 and 14, there was no gas porosity detected. The gas porosity results are summarized in Table 4, and the orange analysis results are shown in Table 7. The results show that the melt injection temperature and the piston velocity of fast stage had obvious impact. With increasing the melt injection temperature and the piston velocity of fast stage, the gas porosity could be reduced to a large extent. The amount of gas porosity in Level 4 is larger than that in Level 1 for the piston velocity of the slow stage. This is due to the increase in air entrainment caused by the melt wave in chamber under the condition with a larger piston velocity during the slow stage.

4. Conclusions

The influence of HPDC process parameters on melt filling and feeding capacity has been studied by means of numerical simulations and orthogonal experiments. Based on the numerical simulation, information on the liquid state in the injection chamber, the flow field at the ingate and at the die cavity, the temperature field of the die and solidification of the casting could be obtained, which could provide reliable process characteristics. Through the orthogonal experiments, some die castings with different filling lengths, shrinkage porosity, gas porosity and appearances have been obtained, which could provide reliable results for evaluating the filling capacity and the feeding capacity under different HPDC process conditions.
According to the results of the numerical simulations and orthogonal experiments, the influences of HPDC process parameters on melt filling and feeding capacity are different. The piston velocity of the fast stage has the most obvious influence on the melt filling and feeding capacity. As the piston velocity of the fast stage increases, the filling capacity increases. The influence of melt injection temperature on gas porosity is also obvious. If the melt injection temperature is too low, the gas porosity can occur easily. The piston velocity of slow stage has an influence on the gas porosity, which could induce air entrainment in the injection chamber. Although the influence of intensification pressure is not obvious because the ingate solidifies prematurely, it is still recommended to adopt appropriate technology to delay the solidification time of the ingate to maintain pressure.

Author Contributions

Conceptualization, T.W. and S.Y.; methodology, T.W. and S.Y.; software, T.W. and H.F.; validation, T.W., J.H., H.F. and K.Y.; investigation, T.W., J.H., H.F. and K.Y.; resources, S.Y. and K.Y.; data curation, T.W. and H.F.; writing—original draft preparation, T.W.; writing—review and editing, T.W.; supervision, S.Y.; project administration, T.W.; funding acquisition, S.Y. All authors have read and agreed to the published version of the manuscript.

Funding

This research was funded by Ningbo Municipal Bureau of Science and Technology, grant number 2020Z018.

Institutional Review Board Statement

Not applicable.

Informed Consent Statement

Not applicable.

Data Availability Statement

Not applicable.

Conflicts of Interest

The authors declare no conflict of interest.

References

  1. Otarawanna, S.; Laukli, H.I.; Gourlay, C.M.; Dahle, A.K. Feeding Mechanisms in High-Pressure Die Castings. Metall. Mater. Trans. A 2010, 41A, 1836–1846. [Google Scholar] [CrossRef]
  2. Yalçin, B.; Koru, M.; Ipek, O.; Özgür, A.E. Effect of Injection Parameters and Vacuum on the Strength and Porosity Amount of Die-Casted A380 Alloy. Int. J. Metalcast. 2017, 11, 195–206. [Google Scholar] [CrossRef]
  3. Bonollo, F.; Gramegna, N.; Timelli, G. High-Pressure Die-Casting: Contradictions and Challenges. Jom 2015, 67, 901–908. [Google Scholar] [CrossRef]
  4. Agarwal, M.; Srivastava, R. Influence of processing parameters on microstructure and mechanical response of a high-pressure die cast aluminum alloy. Mater. Manuf. Process. 2019, 34, 462–472. [Google Scholar] [CrossRef]
  5. Cica, D.; Kramar, D. Intelligent Process Modeling and Optimization of Porosity Formation in High-Pressure Die Casting. Int. J. Metalcast. 2018, 12, 814–824. [Google Scholar] [CrossRef]
  6. Zhao, H.D.; Wang, F.; Li, Y.Y.; Xia, W. Experimental and numerical analysis of gas entrapment defects in plate ADC12 die castings. J. Mater. Process. Technol. 2009, 209, 4537–4542. [Google Scholar] [CrossRef]
  7. Jiao, X.Y.; Wang, J.; Liu, C.F.; Guo, Z.; Wang, J.; Wang, Z.; Gao, J.; Xiong, S.M. Influence of slow-shot speed on PSPs and porosity of AlSi17Cu2.5 alloy during high pressure die casting. J. Mater. Process. Technol. 2019, 268, 63–69. [Google Scholar] [CrossRef]
  8. Qin, X.Y.; Su, Y.; Chen, J.; Liu, L.J. Finite element analysis for die casting parameters in high-pressure die casting process. China Foundry 2019, 16, 272–276. [Google Scholar] [CrossRef] [Green Version]
  9. Han, Q.; Zhang, J. Fluidity of Alloys under High-Pressure Die Casting Conditions: Flow-Choking Mechanisms. Metall. Mater. Trans. B 2020, 51, 1795–1804. [Google Scholar] [CrossRef]
  10. Anglada, E.; Melendez, A.; Vicario, I.; Idoiaga, J.K.; Mugarza, A.; Arratibel, E. Prediction and validation of shape distortions in the simulation of high pressure die casting. J. Manuf. Process. 2018, 33, 228–237. [Google Scholar] [CrossRef]
  11. Kwon, H.J.; Kwon, H.K. Computer aided engineering (CAE) simulation for the design optimization of gate system on high pressure die casting (HPDC) process. Robot. Comput.-Integr. Manuf. 2019, 55, 147–153. [Google Scholar] [CrossRef]
  12. Gu, C.; Lu, Y.; Cinkilic, E.; Miao, J.; Klarner, A.; Yan, X.; Luo, A.A. Predicting grain structure in high pressure die casting of aluminum alloys: A coupled cellular automaton and process model. Comp. Mater. Sci. 2019, 161, 64–75. [Google Scholar] [CrossRef]
  13. Cao, H.X.; Shen, C.; Wang, C.C.; Xu, H.; Zhu, J. Direct Observation of Filling Process and Porosity Prediction in High Pressure Die Casting. Materials 2019, 12, 1099. [Google Scholar] [CrossRef] [PubMed] [Green Version]
  14. Dargusch, M.S.; Hamasaaid, A.; Dour, G.; Balasubramani, N.; StJohn, D.H. The Influence of In-Cavity Pressure on Heat Transfer and Porosity Formation during High-Pressure Die Casting of A380 Alloy. Jom 2020, 72, 3798–3805. [Google Scholar] [CrossRef]
  15. Dou, K.; Lordan, E.; Zhang, Y.J.; Jacot, A.; Fan, Z. A novel approach to optimize mechanical properties for aluminium alloy in High pressure die casting (HPDC) process combining experiment and modelling. J. Mater. Process. Technol. 2021, 296, 1–13. [Google Scholar] [CrossRef]
  16. Yu, W.B.; Ma, C.S.; Ma, Y.H.; Xiong, S. Correlation of 3D defect-band morphologies and mechanical properties in high pressure die casting magnesium alloy. J. Mater. Process. Technol. 2021, 288, 116853. [Google Scholar] [CrossRef]
  17. Blondheim, D.; Monroe, A. Macro Porosity Formation: A Study in High Pressure Die Casting. Int. J. Metalcast. 2022, 16, 330–341. [Google Scholar] [CrossRef]
  18. Sharifi, P.; Jamali, J.; Sadayappan, K.; Wood, J.T. Quantitative Experimental Study of Defects Induced by Process Parameters in the High-Pressure Die Cast Process. Metall. Mater. Trans. A 2018, 49A, 3080–3090. [Google Scholar] [CrossRef]
Figure 1. Three-dimensional models of the sample and the corresponding moving die: (a) an ashtray style sample and (b) components of the moving die.
Applsci 12 04757 g001
Figure 2. The die mold and injection chamber installed on a die-casting machine: (a) ejector die and cover die of the die mold, and (b) cold chamber and piston.
Applsci 12 04757 g002
Figure 3. Components and meshes of the numerical simulation model.
Applsci 12 04757 g003
Figure 4. Simulation results of die surface temperature during preheating cycles: (a) selected points on die surface and (b) simulation results of temperature curves of selected points.
Applsci 12 04757 g004
Figure 5. Castings produced during the preheating cycles: (a) casting obtained during the first cycle, (b) casting obtained during the fourth cycle and (c) casting obtained during the tenth cycle.
Applsci 12 04757 g005
Figure 6. Simulation results of the liquid wave and air entrainment in a chamber during the slow stage of injection: (a) piston velocity was 0.1 m/s, (b) piston velocity was 0.2 m/s, (c) piston velocity was 0.3 m/s and (d) piston velocity was 0.4 m/s.
Applsci 12 04757 g006
Figure 7. Simulation results of a fluid vector at the ingate and the cavity during the fast stage of piston velocity: (a) piston velocity was 0.8 m/s, (b) piston velocity was 1.6 m/s, (c) piston velocity was 2.4 m/s and (d) piston velocity was 3.2 m/s.
Applsci 12 04757 g007
Figure 8. Thermography images of ejector die after the castings being ejected under conditions of different melt injection temperature: (a) melt injection temperature was 620 °C, (b) melt injection temperature was 640 °C, (c) melt injection temperature was 660 °C and (d) melt injection temperature was 680 °C.
Applsci 12 04757 g008
Figure 9. Solidification process of the die casting: (a) just beginning to solidify, ts = 0 s; (b) ingate solidified, ts = 2.1 s; and (c) hot spots position, ts = 4.3 s.
Applsci 12 04757 g009
Figure 10. Filling capacity of a chill vent under different process conditions (The number in Figure is corresponding to the Test No.).
Applsci 12 04757 g010
Figure 11. The typical scanning results of industrial CT (The red circle indicates the area of shrinkage porosity and the red rectangle indicates the area of gas porosity): (a) under the process conditions of test No. 1, (b) under the process conditions of test No. 2, (c) under the process conditions of test No. 3 and (d) under the process conditions of test No. 10.
Applsci 12 04757 g011
Table 1. The composition of the cast aluminum alloy ADC12.
CompositionAlSiCuMgSnFeNiMn
Mass content85.8510.301.800.1400.0080.8890.0510.221
Table 2. Factors and levels of the HPDC orthogonal experiments.
LevelsFactors
Melt Injection Temperature
(°C)
Piston Velocity of Slow Stage
(m/s)
Piston Velocity of Fast Stage (m/s)Pressure
Maintaining Time
(s)
16200.10.81.0
26400.21.62.0
36600.32.43.0
46800.43.24.0
Table 3. The initial and boundary conditions of the HPDC process.
ParameterCondition
Cast aluminum alloyADC12
Die mold materialH13
Piston diameter (mm)60
H.T. coefficient between mold and casting (W/m2·K)4000
Air coefficient (W/m2·K)20
Air temperature (°C)20
Spray coefficient (W/m2·K)1000
Mold opening time (s)6
Part ejection time (s)10
Start time of the die spraying (s)20
End time of the die spraying (s)25
Duration of the cycle (s)40
Table 4. The process plan and results of orthogonal experiments.
Test
No.
FactorsResults
Melt Injection
Temperature A (°C)
Piston Velocity
of Slow Stage
B (m/s)
Piston Velocity
of Fast Stage
C (m/s)
Pressure Maintaining Time
D (s)
Filling
Capacity
(Grid)
Shrinkage
Porosity
(Risk Level)
Gas
Porosity
(Risk Level)
16200.100.81.02.02.02.0
26200.201.62.03.01.02.0
36200.302.43.03.50.01.0
46200.403.24.03.50.01.0
56400.101.63.04.01.01.0
66400.200.84.03.02.01.0
76400.303.21.04.00.00.0
86400.402.42.04.00.01.0
96600.102.44.04.00.00.0
106600.203.23.04.00.00.0
116600.300.82.03.02.01.0
126600.401.61.04.01.01.0
136800.103.22.04.00.00.0
146800.202.41.04.00.00.0
156800.301.64.04.00.01.0
166800.400.83.03.02.01.0
Table 5. The analysis table of filling capacity by means of range analysis method.
FactorsMelt Injection Temperature
A (°C)
Piston Velocity
of Slow Stage
B (m/s)
Piston Velocity
of Fast Stage
C (m/s)
Pressure
Maintaining Time
D (s)
K112.0014.0011.0014.00
K215.0014.0015.0014.00
K315.0014.5015.5014.50
K415.0014.5015.5014.50
k13.003.502.753.50
k23.753.503.753.50
k33.753.633.883.63
k43.753.633.883.63
Range0.750.131.130.13
SequenceC > A > D > B
Optimization LevelA4B4C4D4
Optimum E. R. A4 B4 C4 D4
Table 6. Table of shrinkage porosity by means of range analysis.
FactorsMelt Injection Temperature
A (°C)
Piston Velocity
of Slow Stage
B (m/s)
Piston Velocity
of Fast Stage
C (m/s)
Pressure
Maintaining Time
D (s)
K13.003.008.003.00
K23.003.003.003.00
K33.002.000.003.00
K42.003.000.002.00
k10.750.752.000.75
k20.750.750.750.75
k30.750.500.000.75
k40.500.750.000.50
Range0.250.252.000.25
SequenceC > A > D > B
Optimization LevelA4B3C4D4
Optimum E. R.A4 B4 C4 D4
Table 7. Table of gas porosity by means of range analysis.
FactorsMelt Injection Temperature
A (°C)
Piston Velocity
of Slow Stage
B (m/s)
Piston Velocity
of Fast Stage
C (m/s)
Pressure
Maintaining Time
D (s)
K16.003.005.003.00
K23.003.005.004.00
K32.003.002.003.00
K42.004.001.003.00
k11.500.751.250.75
k20.750.751.251.00
k30.500.750.500.75
k40.501.000.250.75
Range1.000.251.000.25
SequenceC > A > D > B
Optimization LevelA4B1C4D4
Optimum E.R.A4 B4 C4 D4
Publisher’s Note: MDPI stays neutral with regard to jurisdictional claims in published maps and institutional affiliations.

