1. Introduction
There are many factors that have negative impacts on a driver’s behavior and proficiency. One of them is the human exposure to vibrations, which can have a significant direct or indirect influence on driving comfort and safety. The nature of the car’s vibrations transmitted from the road to an occupant plays a significant role in evaluating the effects of vibration on human function.
Periodically during the use of a vehicle, its technical condition is checked. These inspections can potentially be used to evaluate occupants’ exposure to the adverse impact of vibrations. Permissible technical modifications of car components can have quite a considerable effect on change in the nature of vibrations experienced by users.
The effects of vibrations of various frequencies and amplitudes have been assessed. Exposure to whole-body vibrations in a variety of industries and in various workplaces has also been analyzed [
1,
2,
3,
4]. Vehicles of various kinds are a primary source of exposure to vibrations. This area has also been broadly analyzed [
5,
6]. In particular, the impact of vibrations on users for various kinds of heavy equipment was also analyzed [
7]. Irrespective of the fact that vehicles move on both good- and bad-quality roads, road unevenness is a source of kinematic excitation and dynamic components of contact force between a vehicle’s wheels and the road [
8]. The vibrations caused by road unevenness are transferred through a vehicle into its driver and passengers [
9]. One research paper presented the results of a vehicle’s vibrations, with measurements carried out during a journey on the road [
10]. During their analysis, the arrangement of vibrations at selected points of the vehicle was taken into particular consideration. The results obtained during the road tests were compared with ones achieved during laboratory research. The identification of the structure and directional distribution of vibrations throughout a vehicle is also a relevant issue [
11,
12]. Drivers and passengers of different vehicles are exposed at varying degrees to the effects of the vibration of a vehicle resulting from road unevenness. These issues were analyzed, among others, by Konieczny and Burdzik in their publications. During their research, they tested vibration signals in three orthogonal axes. The distribution of vibrations acting in different directions was perceived subjectively by individuals at varying levels of intensity. In addition, attention should also be paid to the fact that, in the case of automotive vehicles, the elements of the propulsion system of the vehicle itself, as well as from other vehicle components, can also be sources of vibration for a vehicle in addition to road unevenness [
13,
14].
The influence of vibrations on humans depends mainly on vibration amplitudes and frequencies. Research and observations have confirmed that vibrations can cause a number of adverse effects in humans. Effects related to the impact of vibrations on humans were presented and discussed, among others, in Griffin’s publication [
15]. The effects of vibrations on humans can vary considerably, depending on organism predisposition and immunity [
16]. However, under no circumstances can they be ignored. That is why actions are taken to prevent this adverse impact and ensure the highest possible comfort for vehicle users [
17,
18]. Various vehicle vibrations measurement and evaluation methods are applied [
19,
20].
Industry safety standards for various groups of vehicles have been created to protect vehicle users against the effects of exposure to vibrations. These safety requirements also underwent analysis and evaluation [
21,
22] as we continue to gain a greater understanding of how to protect users more effectively against the unwelcome consequences of using mechanical tools, machines, and vehicles.
When designing vehicles, their bodies, and equipment, manufacturers follow guidelines included in the relevant standards. Compliance with the adopted guidelines is essential due to the necessity of obtaining positive vehicle homologation before entry into sale. This also refers to vehicle seats, which have to fulfill the requirements of existing standards concerning the influence of vibrations on human bodies. The scope of these requirements is laid down in ISO standard 2631-1 [
23].
Noticeable discomfort that is the result of low-frequency oscillations can be a consequence of pitch and fore-and-aft acceleration in the plane of the seat. Therefore, in this case, vibrations occur in the pitch and fore-and-aft axes, and there are pitch and fore-and-aft oscillations in an occupant’s body. As stated in [
24], the feeling of discomfort at such oscillations depends not only on the frequency and acceleration values, but also on the way a passenger’s back is supported. The backrest of a passenger seat can increase discomfort at frequencies higher than 0.63 Hz. Based on vibration measurements, one can predict to a large extent how a passenger subsequently feels, making it possible to evaluate travel comfort. Modeling methods are used at the stages of designing and development of vehicle prototypes, and they allow for the optimization of designs at these early stages [
25,
26,
27,
28,
29]. In the area of vehicle suspension, work is also underway on new issues [
30,
31,
32]. However, during the service lives of vehicles, the assessment of vehicle elements responsible for vibration damping is practically limited to inspecting the conditions of shock absorbers. This takes place, for example, during periodic technical inspections. The possibilities for evaluating the functionality of various vehicle components are becoming broader. Kinematic excitation can be used to analyze types of damage to shock absorbers. A vibration analysis with the application of the short-time Fourier transform method was employed by Konieczny et al. [
33] to assess the volume of oil inside a shock absorber.
The shock absorber’s damping characteristics change over time, and they are influenced by all components of the shock absorbers [
34]. That is why periodic testing of their condition is essential. Usually, evaluation of the technical condition of shock absorbers is carried out using mechanical vibration exciters. Vibrating plates on which a vehicle’s wheels are aligned are the elements that excite movement during such a test [
35].
In order to improve driving comfort, suspension seats are used in vehicles. Passive, semi-active, and active dampers are applied. It seems that there is still room for the enhancement of existing solutions to provide even better comfort [
36,
37]. Reducing the vibrations of a vehicle that are caused by road surface unevenness can be obtained thanks to the proper functioning of shock absorbers. The choice of damping characteristics is very significant. The characteristics of shock absorbers are selected for the average, most typical operating conditions of a given type of vehicle. This means that, if the range of excitation is broader, the possibilities of the effective operation of shock absorbers is limited.
Frequently, vehicle users themselves decide to make changes in vehicle suspension and are willing to adjust its characteristics to their expectations. Most often, these are young users who want to use vehicles for dynamic driving. They introduce modifications themselves or use the services of mechanic shops specializing in this field. These modifications entail changes in the comfort of passengers, and they usually lead to higher exposure of the passengers to vibrations.
2. Materials and Methods
A mathematical model of a car suspension system (described later in this paper) was adapted for vibration analyses of the sprung and unsprung mass of vehicles. The obtained results of the calculations allowed for evaluation of the range of differences of characteristics of vehicle suspension that can be found in passenger vehicles. Then, the characteristics were compared with the results obtained during tests on vibrating plates.
The aim of the conducted research was to evaluate the possibility of using periodic technical inspections of vehicles to specify the level at which users of these vehicles were exposed to vibrations.
The measurement of the vibrations of chosen vehicle parts was carried out using a typical device for testing the damping efficiency of a vehicle’s suspension system. The device was a UKA-3,5E-type instrument, which allowed the testing of a car with a maximum permissible mass not exceeding 3.5 Mg. Such devices are widely used for periodic technical inspections of vehicles. The test stand allows the application of vibrations to a vehicle’s wheels, which are placed on the test plates of the device. The UKA-3,5E shock absorber test bench enables the determination of the damping effectiveness of a vehicle’s shock absorbers according to the EUSAMA control method. The device consisted of two measuring units: a left one and a right one. After the car drove over the measuring platforms, there was a change in the output voltage of the strain gauges placed underneath. The change was proportional to the load; therefore, it allowed the determination of the force of the pressure of the vehicle’s wheels on the ground. The resulting tension, which was caused by the load, was measured with the aid of an analogue-to-digital converter (ADC) controlled by a microprocessor placed on every device that excited vibrations.
One can observe three stages of the test: the first one was increase in the vibration frequency of the plate (the highest frequency was about 25 Hz), the second phase was excitation with a constant frequency, and the last phase was decrease in the plate vibration, i.e., the phase of fading vibration, during which there was passage through the resonant frequencies of the vibrations of sprung and unsprung mass.
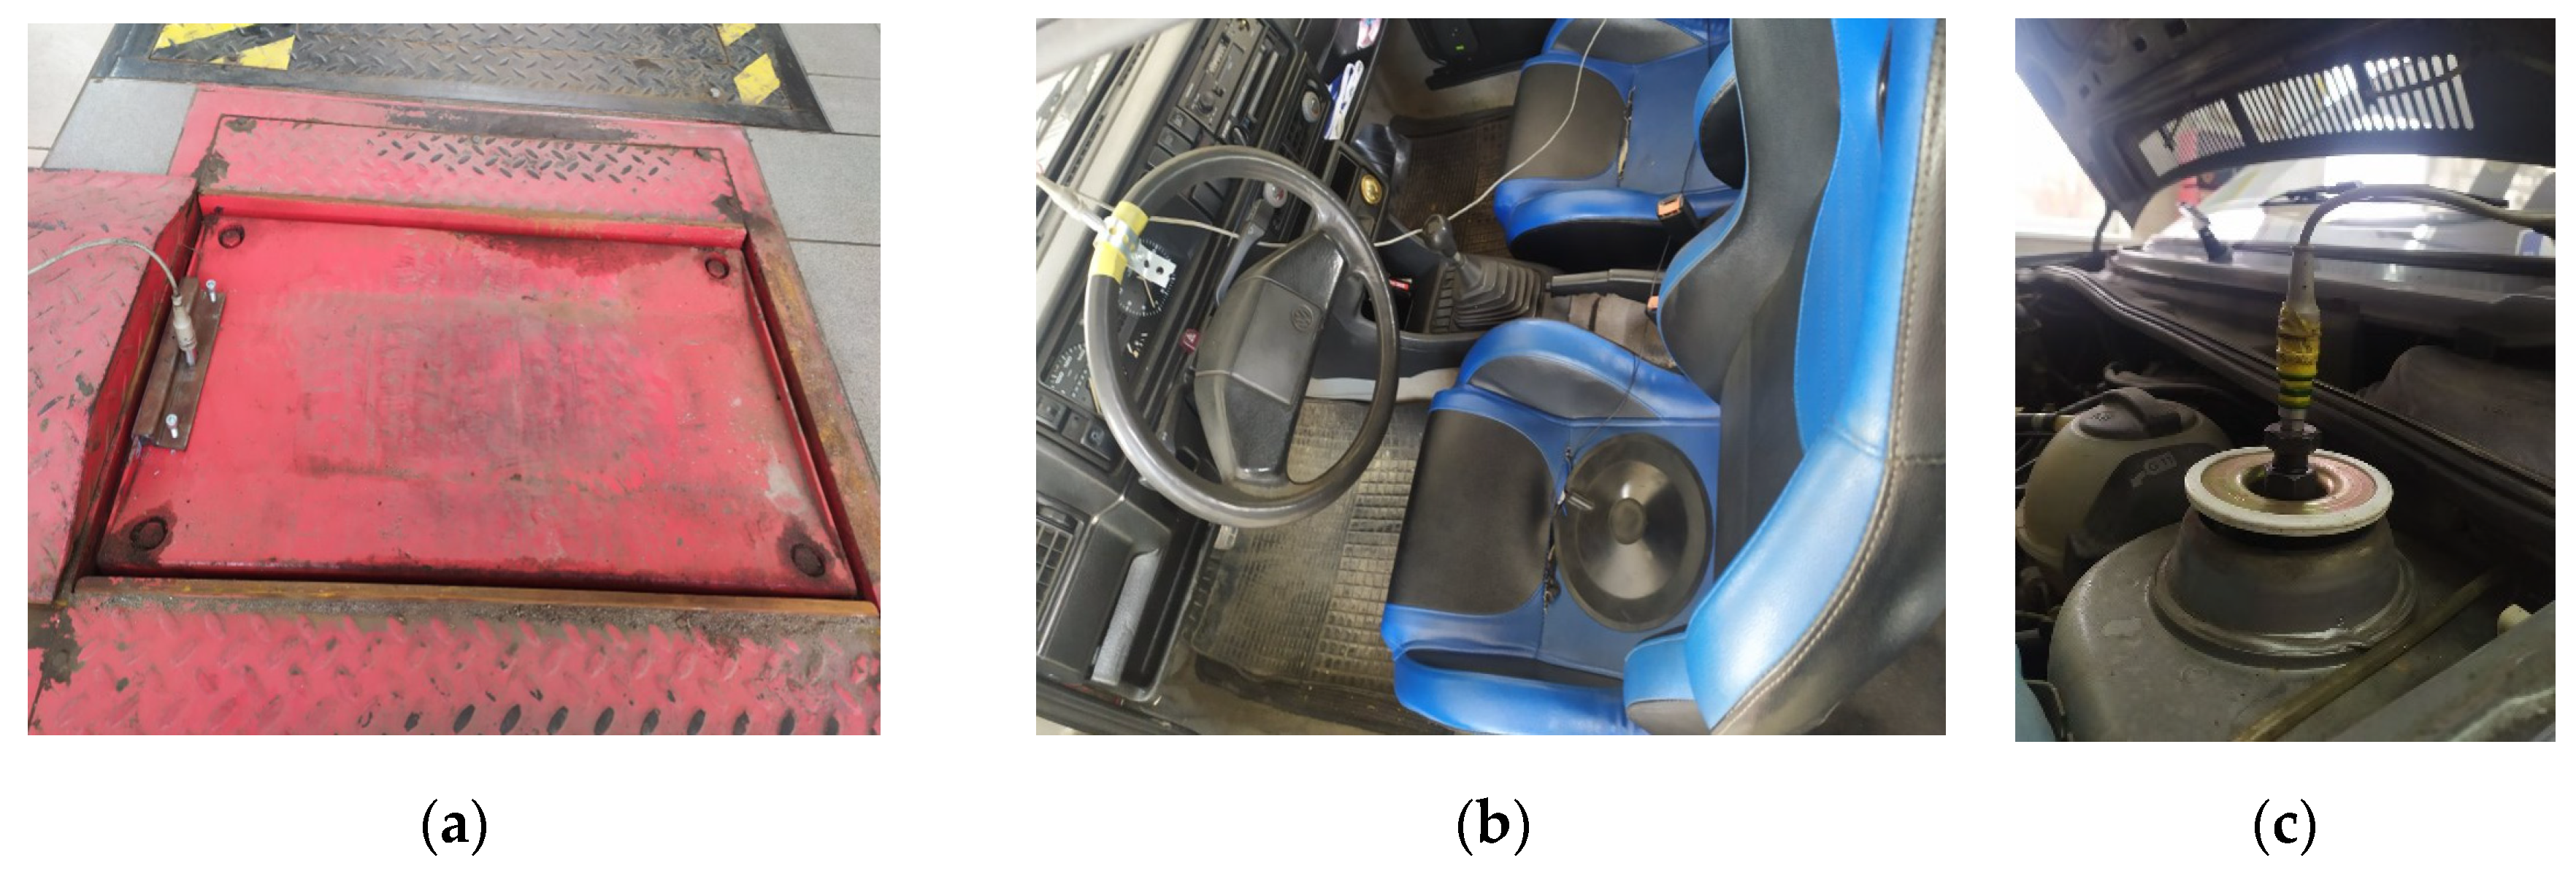
Two types of accelerometers (B-12-type acceleration sensors from Hottinger Baldwin Messtechnik (HBM) and an ADXL150 accelerometer from Analog Devices, Inc. Wilmington, MA, USA) were used for measuring the acceleration of chosen elements of the vehicle, as well as of the test plates of the monitoring device. During the research, a Spider 8 amplifier from the same company and Catman data acquisition software were used. Before the measurements were performed, the acceleration sensors were calibrated according to the manufacturer’s recommendations. The sensors were placed on the following elements: the driver’s seat (ADXL150); the steering wheel; the front suspension (McPherson strut); and the exciter plate of the UKA-3,5E device.
While driving, vibrations are transmitted through the driver’s seat to the lumbar spine and back. The feeling of vibrations on a driver’s feet and hands is caused by the transmission of vibrations through the floor panel and steering wheel. Therefore, attention was devoted in particular to these elements.
Figure 1 shows the arrangement of acceleration sensors during measurement.
The Spider 8 measuring amplifier enabled data acquisition simultaneously on 8 channels. All the channels were equipped with an analogue-to-digital converter (ADC), a filter, and power supply equipment for measuring transducers. Catman software allowed for the creation of measurement modules, online and offline processing of the measurement results, and exporting data to various formats. The software functions also enabled the visualization and graphical analysis of the obtained results. During the measurements, a 100 Hz sample rate was used, and the “auto” option was chosen in the Catman software configuration, which allowed for the adjustment of the filter to the selected sample rate. A Bessel filter was applied as an anti-aliasing filter.
The damping characteristics of the shock absorbers were measured on an AB 602 POLMO-PIMOT test stand, as shown in
Figure 2. The test stand was equipped with a crank gear. An electric motor with controlled RPM was applied for propulsion. Such a test stand enabled stepless stroke adjustment of the tested shock absorbers in the range from 1 to 100 mm. The measurements made on the test stand allowed for the estimation of the suspension damping coefficient values.
Middle-class cars with independent suspensions were used for the tests. On the front wheels, both vehicles were equipped with a McPherson suspension system. In one of the vehicles, modifications were introduced in relation to the standard equipment laid down by the manufacturer. The modifications involved change in the driver and passenger seats in the front of the car, as well as change in the shock absorbers.
3. Mathematical Model
The developed model adopted a two-degrees-of-freedom (DOF) quarter-car suspension system. The quarter-car suspension model has been widely used in the literature since the 1970s [
38,
39,
40]. The implemented model described vertical vibrations of the sprung mass (vehicle body) and unsprung mass (including wheels, elements of suspension, and brake system). The general equations of motion for the nonlinear quarter-car model can be presented as follows [
41]:
where:
is the sprung mass;
is the unsprung mass;
is the vertical displacement of the sprung mass;
is the vertical displacement of the unsprung mass;
is the elasticity force between the sprung and unsprung masses (suspension elasticity);
is the damping force between sprung and unsprung masses (suspension damping);
is the elasticity force between the road and unsprung mass (tire elasticity);
is the damping force between the road and unsprung mass (tire damping).
The elasticity and damping forces are usually approximated by polynomials, the degrees of which depend on the suspension and tire characteristics. A suspension system with asymmetric (different for compression and rebound) and progressive elastic-damping elements may even require a 5th-degree polynomial:
where
is the suspension deflection, and
and
are coefficients of the polynomials.
Similar formulas can be given for tires. However, it should be noted that pneumatic tires mostly show linear characteristics with negligibly low damping forces.
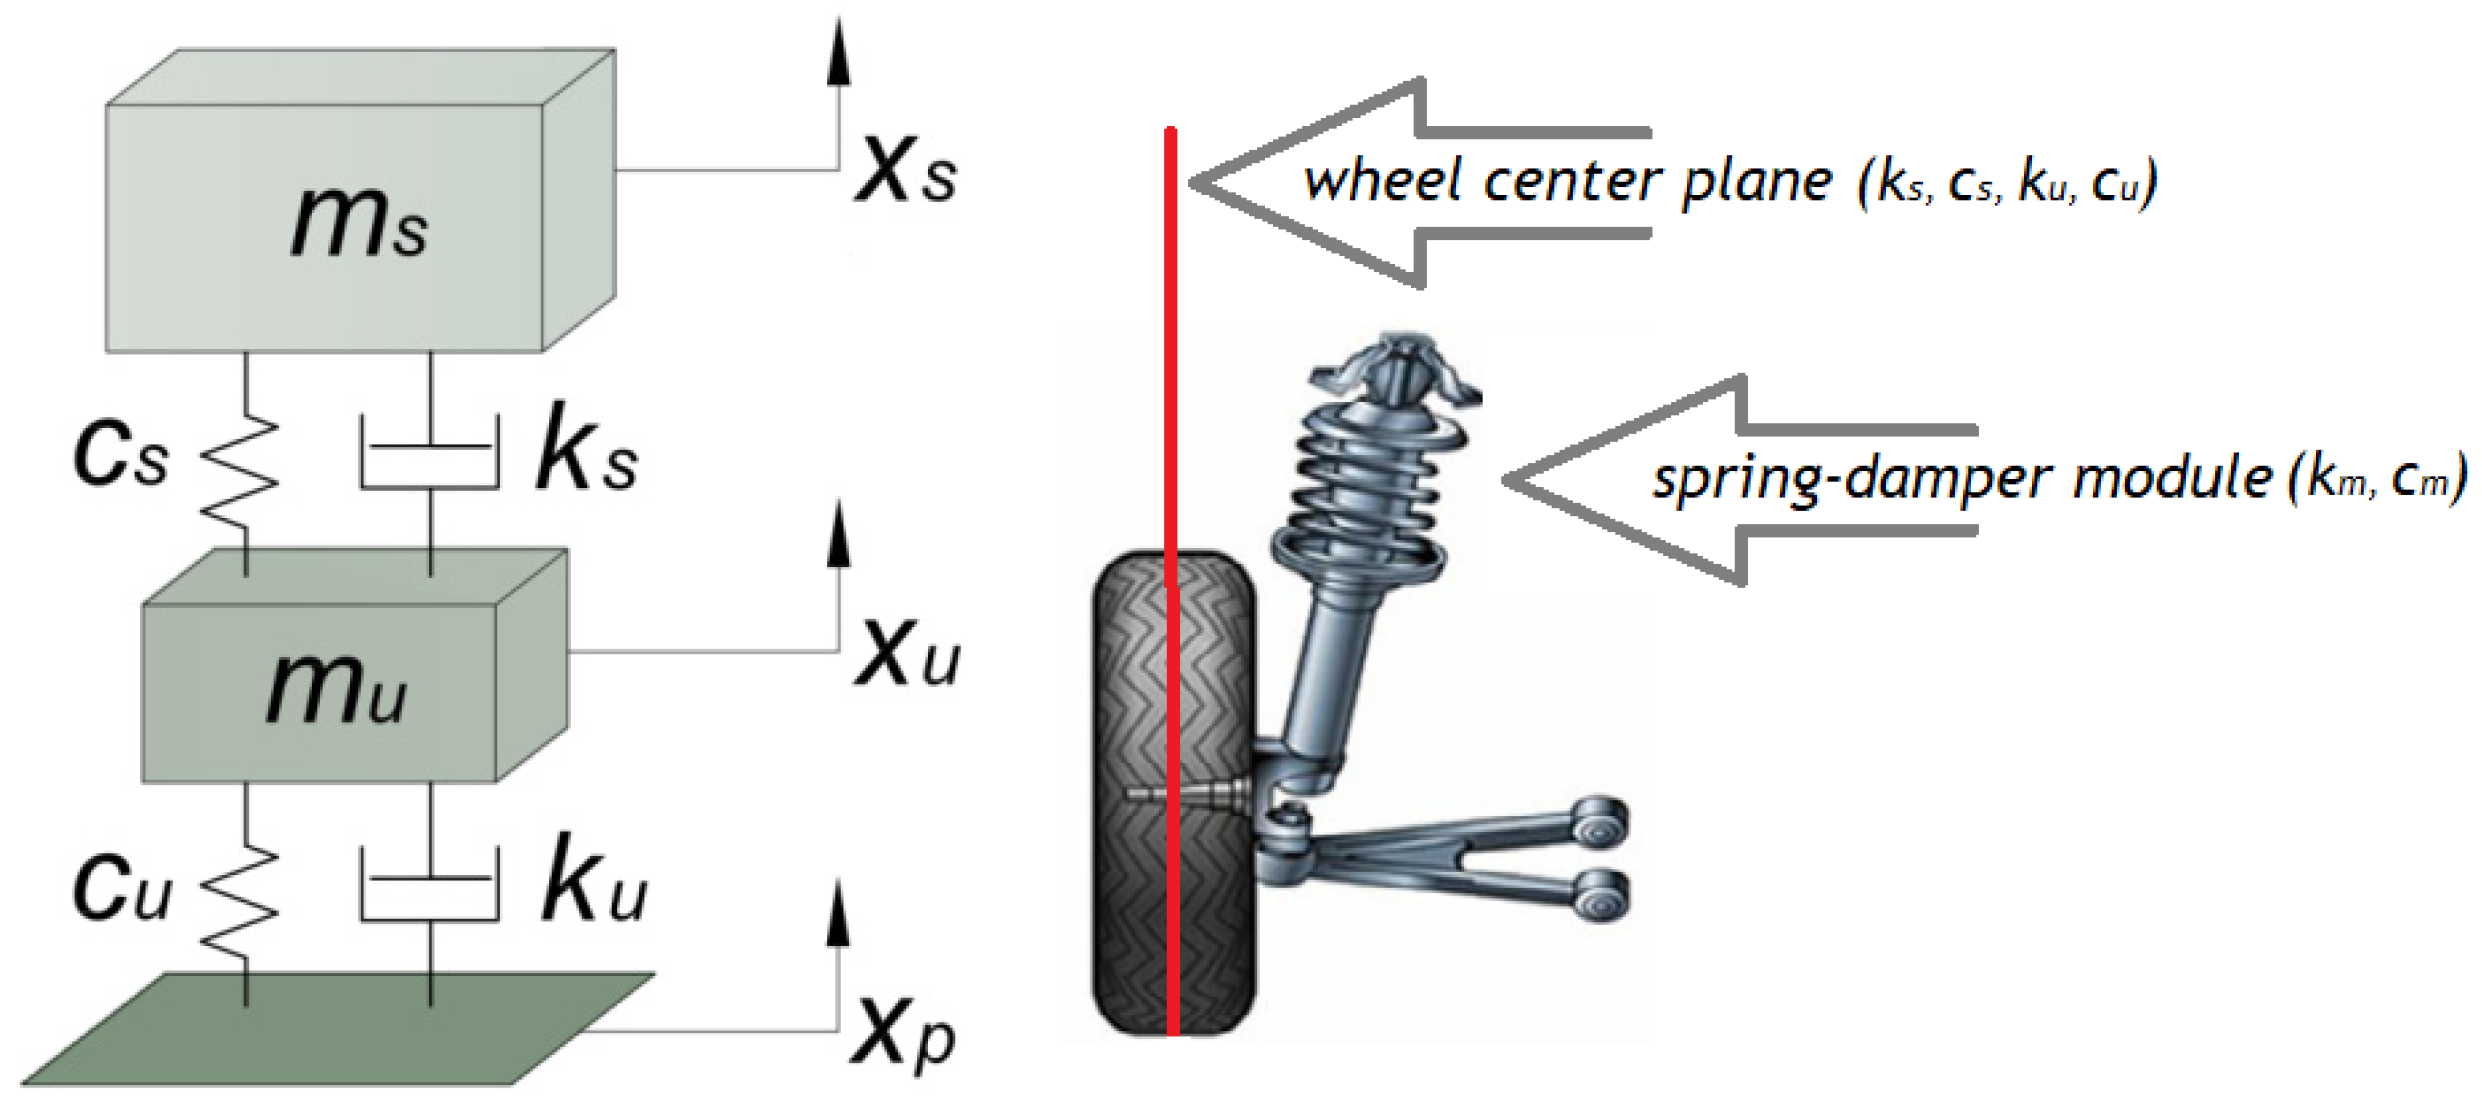
The presented model was adapted to the case considered during the research experiment. The one-sided amplitude of the test plate (showed in previous section) was equal to 3 mm. Thus, the deflections of the suspension and tires were very limited. For this reason, the application of a simple linear model was fully justified in further analysis (confirmed by simulations). The mass elements of the system were connected by a spring-damper linear module representing properties of the wheel suspension (
Figure 3). The spring-damper linear module between the unsprung mass and the ground represented the wheel properties in the radial direction.
The linear system with two-DOF can be described using Newton or Euler–Lagrange methodology by a system of two differential equations in the following form [
39]:
where:
is the suspension damping coefficient;
is the tire damping coefficient;
is the suspension stiffness coefficient;
is the tire radial stiffness coefficient;
is the vertical displacement of the suspension test plate.
In the above model, two assumptions must be noted:
The adopted equations of motion can be presented in a more expedient state–space form:
where
x as a state vector and u as a control input can be written as follows:
Taking the above into account, the adopted model can be presented in matrix form:
After minor transformations, the model can be written as follows:
Matrix (6) was implemented in Mathworks Matlab, where a numerical solution was obtained using the Runge–Kutte method.
4. Estimation of the Model Coefficients
It is worth mentioning here that the coefficients
ks and
cs related to the center plane of the wheel (
Figure 3), and they could not be directly equated with the damping and spring elements (shock absorbers and coil spring). These coefficients could be determined in two ways:
The first of the mentioned methods is inconvenient in practical implementation. In this case, the spring element and damper should be dismantled to obtain their characteristics on a special test stand. Moreover, an accurate suspension scheme is needed for the determination of the suspension ratio. In the second approach, the measurements are realized on the entire vehicle. This test does not require penetration into the vehicle or knowledge of the suspension structure. Additionally, performing the measurements on a complete car allows for the consideration of forces and torques resulting from friction in the suspension joints. Therefore, such a measurement better reflects the real working conditions of suspension. The suspension stiffness coefficient ks (as well as the tire radial stiffness coefficient ku) may be determined relatively easily in this way (static experiment). The damping coefficients are much more difficult to determine because dynamic conditions for testing are required (in the adopted model, the damping forces depended on the speed of the moving mass). Therefore, for the purposes of this study, the values of these coefficients were taken from the literature.
The suspension stiffness characteristic and tire radial stiffness characteristic were determined in accordance with Polish standard BN-57/3615-06 [
42]. The wheels of the analyzed axle were placed on the scales (
Figure 3). Suspension deflection is usually accompanied by changes in the wheelbase or the toe-in. Rotary-sliding plates between the wheels and the plates of the scales ensured the elimination of tangential forces (the suspension was only then loaded with vertical force). During measurement, the considered suspension should be overloaded by an amount equal to 50% of the static load (passenger car).
The wheels of the considered axle were loaded approximately equally. The changes in the vertical forces acting on each wheel were realized by a screw jack, which was used to lift the vehicle body. In every measurement step, the following parameters were noted: normal forces (masses denoted from the scales), heights of previously defined points on the bodywork (right and left sides;
Figure 4), and heights of previously defined points on the rims (right and left sides;
Figure 4). The obtained data allowed for the performance of the stiffness characteristics for suspension and tires in the radial direction. The characteristics presented the dependence of the vertical force on the deflection of the suspension or tires. On this basis, the stiffness coefficients (
ku and
ks) could be determined.
Figure 5 depicts the tested vehicles during measurement of the suspension stiffness coefficient.
Exemplary stiffness characteristics (for tires and suspension) and their linear approximations are shown in
Figure 6. A summary of the model parameters for the two considered vehicles is presented in
Table 1.
5. Simulations
The electrically driven diagnostic plates reciprocated in a vertical direction. Under ideal conditions, the
xp coordinate associated with a plate could be described by the following equation:
where
A is the one-sided amplitude of the test plate (
A = 3 mm),
f is the frequency, and
t is time.
The velocity of excitation was then as follows:
6. Results of Research and Discussion
In order to estimate the vibration characteristics of the cars, a previously described mathematical model was applied. The calculations of the displacement and acceleration of both the sprung and unsprung masses were performed. With the aim of comparing suspension characteristics during technical inspections of vehicles (which are supposed to be diagnostic in character), a simplified model was chosen. The parameters characterizing both vehicles selected for comparison were used for the calculations. Therefore, the first vehicle (vehicle 1) was fitted with standard equipment that conformed to the specifications of the manufacturer, as described earlier. Shock absorbers with sport-like damping characteristics were mounted on the second vehicle (vehicle 2). Calculations were made for the wheel vibrations of the vehicles corresponding to the operation of a vibration exciter control device for car shock absorbers at a frequency of 25 Hz and an amplitude of 6 mm.
In the case of unsprung mass for both vehicles, we observed that both displacement and acceleration had the same pattern. This was understandable due to the identical conditions of movement excitation applied to the wheels of both vehicles. As can be seen from the juxtapositions, damping changes resulting from modification of the suspension components were visibly evident in the case of unsprung mass vibrations. For resonant frequency, i.e., about 12 Hz, the acceleration of the unsprung mass was more than 0.6 m/s2 higher for the vehicle with a modified sport suspension. In the case of this modified suspension, the displacement of the sprung mass was also higher, and the differences increased with decrease in the vibration frequency. At low frequencies, which are responsible for discomfort resulting in travel sickness, the differences could be almost three times higher.
Vibrations experienced by vehicle users can be divided into two main categories. The first category includes vibrations classified as general vibrations, which have an impact on humans through the lower limbs, pelvis, and back. Local vibrations, which have an impact on humans through the upper limbs, belong to the second category. The vibrations on the driver’s seat and on the steering wheel were analyzed.
Acceleration measurements of the vehicles during the entire test are presented in
Figure 11. As shown, in the phase of exciting vibrations, the observed accelerations had values higher by 30% for vehicle 2. In addition, as can be seen in the second phase of the test, in the case of vehicle 2 there was a decrease in these values related to the damping of vibrations. The comparison of the obtained results highlights the differences in the suspension characteristics of the tested vehicles.
Vertical acceleration measurements of the driver’s seat surface are presented in
Figure 12. As shown, the maximum values recorded during the whole test differed by more than 100%. The differences were most clearly visible in the phase of exciting vibrations, as well as in the final phase of the test, when we observed fading vibrations. Following the immobilization of the exciter plate, the differences could be seen.
Analogous dependents could be indicated in the case of vibrations observed for the steering wheels, as shown in
Figure 13. Here, the noticed differences were smaller. The maximum acceleration values registered during testing for the vehicle with standard shock absorbers reached 2.5 m/s
2. However, these values reached up to 3.7 m/s
2 for the vehicle with changed shock absorbers, which implied differences in the region of 50%.
Further analyses of the registered vibration signals showing the acceleration amounts of the vehicles, the steering wheels, and the driver’s seats were carried out following time–frequency decomposition.
Figure 14 shows the frequency range of exciting vibrations when moving the plate of the test stand. Following the activation of the test stand, the plate reached a frequency of 25 Hz at an amplitude of 6 mm.
Subsequently,
Figure 15 shows the frequency range of the vibrations of the car body corresponding to the forced oscillations. In the chart, the results obtained for both configurations of vehicles are compared. Differences were visible in the area of resonant frequencies. In this respect, the observed acceleration values were higher for vehicle 2 than for vehicle 1.
In the next image (
Figure 16), the frequency range of the driver’s seat vibrations corresponding to the forced oscillations is depicted. In the chart, the results obtained for both configurations of vehicles are compared. With regard to standard shock absorbers and a standard driver’s seat, the acceleration of the seat surface was considerably smaller than in case of the modified vehicle with bucket seats and a sport suspension system. A particularly significant difference was visible in the area of resonant frequencies. In this respect, the observed acceleration values were three times higher for the modified vehicle than for the standard car. Such differences also occurred at frequencies lower than resonance. This meant that the biggest differences were observed for these frequencies, which can be felt by occupants and cause more distinct discomfort.
Analogous dependence could be observed in the case of steering wheel vibrations, which is depicted in
Figure 17. The values of the acceleration levels registered on the steering wheel were three times higher for the modified vehicle. Such big differences could be observed for the whole range of frequencies, although the values were lower than the forced oscillations.
The obtained results show that there were significant differences in the frequency distribution and vibration amplitude present on the steering wheel and in the driver’s seat during the tests conducted on the exciter plates. Vehicle users themselves also saw the differences, as shown in the subjective perception of stimuli during the tests. They described these impressions as “distinct vibrations on the steering wheel”. Therefore, the differences measured are also relevant from the point of view of driver wellbeing. The large internal organs of humans have frequencies of up to about 18 Hz. This range includes the resonant frequencies of vehicles. This means that the operation of a vehicle’s suspension is particularly important in this scope. The lowest frequency ranges require similar consideration since symptoms of travel sickness occur at frequencies of about 2 Hz.
The authors of [
20] analyzed, among others, vertical acceleration when driving on different qualities of roads. They showed that particular attention was paid to low-frequency vibrations due to motion sickness and lack of comfort, which are generated during the movement of a vehicle on a road. This range of frequencies can be tested on vibration plates during the inspection of car suspensions.
When a vehicle is in motion on the road, excitation resulting from road unevenness is the source of vibrations. These issues have been analyzed in the publications of Burdzik [
6,
10]. The vibrations of a vehicle moving on a road at two different speeds were analyzed. The research results indicated that the frequency range below 25 Hz corresponded to the highest values of acceleration. These regularities were confirmed irrespective of the other sources of vibration we observed as the vehicles were driven.
Verros et al. [
43] described results of the calculation of vibrations for vehicles with different suspensions under random road excitation levels based on a quarter-car model. In the same frequency range, they indicated the highest values of acceleration for the body of a vehicle traveling on a road.
In relation to the values of the limits of acceptable accelerations provided in the ISO 2631 standard [
23], the fatigue-decreased proficiency limit and the exposure limit were exceeded within the vibration frequency range mentioned. This confirms that attention should be drawn to this frequency range during the potential inspection of vehicles.
Zdanowicz [
41] compared the vibrations of a vehicle examined with a suspension tester and vibrations during motion on a road. It was stated that the forces generated by shock absorbers in the conditions of the vibration plate test were not as strong as they could be for the real conditions of a road. This confirms that it was sufficient to use a simplified model for obtaining reliable results for calculations.
Based on the measurement results on the movable plates of the test stand, the analysis of vibrations of the lowest frequencies (below 1–2 Hz) was more difficult than that of higher frequencies. This resulted from the short duration of the test itself and, therefore, the small timeframe in which vibrations of the lowest frequencies could be registered. The vibrations in this frequency range are associated with the symptoms of travel sickness. However, the appearance of symptoms depends on individual factors and is not only related to the intensity, frequency, and duration of vibrations. Therefore, it seems that, from the point of view of the vibration evaluation discussed here, the lowest frequencies were of less importance. European standards referring to the impact of vibrations on humans also do not include vibrations of frequencies below 1 Hz.
Coil springs with nonlinear characteristics are the springing parts of a vehicle suspension system. Strongly nonlinear and asymmetrical damping characteristics can also be indicated as the features of suspension struts. Therefore, this yields a nonlinear, vibrating mechanical system. The simplified model was sufficient to evaluate the intensity of car body vibrations. The results of the comparison of the suspension characteristics of the various vehicles described above confirm this.
The measurement results indicate that the consequences of introducing modifications of the seat and suspension were not only directly felt by users, but they also could contribute to increasing adverse effects on users’ bodies.
Ensuring the comfort of drivers is currently given particular attention. More favorable travel conditions contribute to reducing fatigue and maintaining the full capacity of a vehicle operator. All of this is tremendously significant from the point of view of road safety. Damping the vibrations to which passengers are exposed is an essential element for providing comfort. Vehicle manufacturers have launched further solutions to contribute to ensuring even better conditions for car users. The possibility of evaluating the changes in the level of undesirable vibration exposure of drivers during the use of vehicles is also relevant.
7. Conclusions
Changes in the damping characteristics of suspension systems have a significant influence on the vibrations experienced by drivers. These changes are the consequence of damage to the elements of a vehicle suspension system or replacement of the suspension components and modifications introduced by users.
Based on the conducted research, the values of the vibration amplitudes of both the driver’s seat and the steering wheel could increase up to three-fold. Such significant differences could be observed for the whole range of frequencies, i.e., from 1 to 25 Hz.
The analyses of the vibration signals from the steering wheel and driver’s seat that were carried out following time–frequency decomposition were useful for assessing the exposure of a driver to vibrations. Especially during the test, it was possible to analyze the range of resonant frequencies of a vehicle. In this frequency range, the impact of vibrations on humans was very significant.
Vibration measurement carried out during the inspection of vehicle suspension could allow for the evaluation of vibration propagation on vehicle users.
During the test on the vibration plates, it was possible to evaluate the vibrations within the most significant range from the point of view of vibration influence on a driver, i.e., from 2 to about 18 Hz.
Testing of shock absorber damping during periodic technical inspections could easily be broadened to evaluate driver exposure to vibrations.


