Abstract
In Chinese megacity centers, substandard housing is being removed. The inhabitants are relocated to peripheral large-scale residential areas, and we call them “relocatees”. After the relocation, their housing quality is improved but travel quality may worsen. Little attention has been paid to the change in travel equity over time for shopping-related trips of relocatees and non-relocatees in these areas in rapidly developing countries, especially for the change before and after the major built environment development, such as a shopping plaza’s opening. To fill this research gap, we conducted two surveys before and after Wanda Shopping Plaza’s opening. We used statistical analysis, estimated discrete choice models focusing on mode choice, and calculated consumer surplus as a measurement of travel equity. Results show a relocatee has a lower travel quality for shopping-related trips. Travel equity between relocatees and non-relocatees for shopping-related trips becomes worse after Wanda’s opening. Differences in consumer surplus between relocatees and non-relocatees provide a reference for the travel subsidy policy.
1. Introduction
China is a developing country with the largest population in the world [1]. Most of the country is experiencing rapid urbanization, while some megacities are gradually suburbanizing [2]. In the suburbanization process, city residents, either voluntarily or involuntarily, are moving to the peripheral city areas. By involuntarily, we mean some city-center residents moved to affordable large-scale residential areas in the suburbs of a large city because their original substandard downtown housing is demolished. In this paper, we call these involuntary movers “relocatees”. In the past decade, the suburbanization in Chinese megacities, such as Beijing, Shanghai, Guangzhou, etc., mainly result from the development of these residential programs in peripheral city areas [3].
Unlike the voluntary displacement due to urban regeneration in western countries, such migration in China is passive relocation [4]. However, the massive passive relocation in China and its travel-equity issues are not well understood [3]. Travel inequity between relocatees and other population groups requires studies to explore.
So far, most studies that have investigated this topic used the overall or commute trips in developing countries. Very few studies have focused on shopping-related trips, which are the second most frequent trip purpose in these areas (the first most frequent trip purpose is commuting to work or school) [5]. These will be discussed in detail in the next section. For shopping-related trips, is the travel equity of relocatees different from non-relocatees? How does the travel equity change over time (for example, before and after the opening of a major shopping plaza nearby)? This study was developed to answer these questions.
In this study, we aim to investigate the relocatees’ shopping travel characteristics and the change in travel equity over time for relocatees and non-relocatees’ shopping-related trips on the periphery of a megacity in a developing country. The travel quality of shopping trips affects the life quality of residents. Studying residents or relocatees’ shopping travel behavior and travel equity in such areas will not only contribute to the understanding of suburban travel behavior for megacities in developing countries but also support policy decisions and urban transportation planning for these areas. Following this, we can improve relocatees’ quality of life and travel equity.
2. Literature Review
The population group, relocatees, results from a special type of passive residential relocation [4]. Controversial issues are raised in both residential displacement and passive relocation. The former is common in developed countries due to urban regeneration, while the latter occurs mainly in developing countries. [4]. One of the issues is the travel-behavior change and dissatisfaction towards the transport services of the new home area after the relocation [2,5]. Previously, researchers have paid much attention to residential mobility and displacement in Western countries. Much research has been performed in this area. In this section, we do not overly focus on residential displacement in developed countries (for details, please refer to [4,6,7]). Instead, the passive relocation in Eastern countries will be our main focus. Eastern megacities’ involuntary relocation has mainly occurred in past decades. Multiple studies have focused on the relocatees’ travel behavior and welfare (for a detailed review of such relocation and travel behavior of the relocatees and non-relocatees in Eastern and developing countries, please see [2,3,4]). However, only a little research has focused on relocatees’ travel equity and quality issues after the relocation in these peripheral megacity areas in developing countries.
According to previous research, mobility inequality occurs in developing countries [8,9,10,11]. In China, the decreased mobility reduces involuntary movers’ perceptions of urban livability [12], and moving to the city periphery reduced happiness for involuntary movers [13,14]. Guan and Xu found that in one trip, relocatees’ travel quality was 6.88 CNY/person lower than that of voluntary movers when choosing a travel mode, which was related to the travel-equity issue. It showed that from a travel-equity perspective, the relocation process and the development of megacity periphery would have a greater impact on the travel of relocatees than on other people [3,5].
So far, most studies that investigated this topic have used the overall or commute trips in developing countries. Only some studies have focused on shopping-related trips. They studied the travel behavior to retail centers and assessed local or regional impacts of a new mall on the road traffic, focusing on trip generation (trip frequency and duration) and trip types [15,16,17,18,19], etc. Lee and Yong examined changes in shopping-related trips of metropolitan residents after the establishment of a new shopping area in Tampines New Town, which was out of the center of Singapore. In Tampines Regional Center, many people used to buy daily necessities in the new town and go shopping for other goods in the city center. After the opening of the new shopping area, they could partially meet their needs for both in the local retail stores. Those out-shoppers who frequently visited the city center and neighborhood centers would be likely to reduce their out-shopping trips after the center was fully developed [20].
As for travel-mode choice, Handy and Clifton found that local retail stores had the least impact on car usage. “Most of the walks to stores did, in fact, appear to substitute for driving” in Austin [21]. In Prague, Newmark et al., used the data before and after retail land use shifted to illustrate how shopping travel behaviors shifted with it. They found some apparent changes: residents tended to shop less frequently but for a longer period of time, and they also walked to the store less. After more automobile-oriented developments were constructed, residents disproportionately shifted their travel patterns to increasingly use the car [22]. When studying the influence of retail de-concentration on trips to hypermarkets in Prague, Barb found that, among the people who would shop by car, which accounted for 47%, almost all (92%) of them still shopped by car. However, more than half (56%) of those people who traveled on a non-motorized transportation mode, and one-third of those who used transit, changed to use the car instead. As a result, non-motorized shopping trips decreased to less than 10% of the original [23].
Few studies were able to make contributions to the equity of shopping travel of relocatees and non-relocatees on the megacity periphery in developing countries. A small number of studies have examined differences in shopping travel behaviors before and after. Several of them explicitly pointed out that these changes had positive impacts on gender equality [16,19,24]. After the first suburban shopping malls developed in Prague, Newmark examined the equity change in travel for shopping which resulted from them. Equity analysis was conducted involving gender, income, age, and car ownership. It was found that, as measured by distribution, the choice of travel modes was still inequitable for all population pairings [24].
Until now, few studies have paid attention to the change in travel equity between relocatees and non-relocatees for shopping-related trips on the periphery of a megacity in rapidly developing countries. This study intends to fill the research gap and provide references for policy decision making.
3. Survey Area and Data
3.1. Survey Area
A large-scale residential area, which is located in the suburbs of large cities in developing countries, is the focus of this study. Shanghai, one of the largest cities in China [25], is chosen to be the case area because it is a key instance of large-scale residential area development in the course of megacity suburbanization and redevelopment.
The definition of a “large-scale residential area on the megacity periphery” is: (1) It is large, with a size of 2 km2 and a population of thirty to fifty thousand; (2) It is primarily affordable residential housing; (3) It is located on the megacity periphery, which in the case of Shanghai, means outside of the Outer Ring Highway [25]. Among various large-scale peripheral residential areas, Jinhexincheng (Golden Crane New Area in Chinese) in western Shanghai was chosen based on two criteria: having affordable residential housing for relocatees and non-relocatees, and having a high occupancy rate.
Jinhexincheng covers approximately 2 km2 and has a population of approximately 28,000. It is located to the west of downtown Shanghai. Jinhexincheng has 10 housing projects overall, eight of which are for relocatees, and the others are commercial housing. The inhabitants have moved in since 2005.
3.2. Sampling Method and Survey Data
The planning and development documentations of the Shanghai large-scale residential areas were investigated. We conducted field studies to support the site selection, interviews, and on-site surveys. This was because there was no detailed dataset for this kind of peripheral area.
Two surveys were conducted in Jinhexincheng in March 2011 and August 2012, respectively, to explore the change in travel-equity overtime for relocatees and non-relocatees in the area. In June 2011, Wanda Shopping Plaza (Wanda for short) was opened. It is located 500 m to the east of Jinhexincheng and has an area of approximately 0.25 km2. It includes grocery stores, department stores, supermarkets, karaoke bars, children’s play areas, restaurants, clothing stores, digital or appliance stores, book stores, and a cinema [26]. The opening of Wanda fell into the gap between the two survey periods. Other than that, there was no major built environment change in the area.
In both surveys, the following were conducted: (1) Field studies of local transportation and land use; (2) Questionnaires; and (3) Interviews with residents. For the two surveys, two different groups of sample residents were asked to finish a questionnaire. The sampling approach was the same for both surveys: using stratified sampling to select the buildings and random sampling to select households in each building. It is worth noting that because this area’s housing and demographic data were not location-specific, the survey was conducted based on the author’s best estimation of a representative sample of the peripheral population in an emerging area.
More details about the completion of the two questionnaire surveys are specified separately as follows:
Survey 1: 500 invitations were mailed to households and 413 persons replied to it. One person in each household who was 12 years old and above was asked to participate. Eventually, we collected a total of 320 valid resident questionnaires, where at least 70% of the questions were answered. The response rate for this survey was high because it was approved by the Shanghai Municipal Government. The residential committees also helped with its announcement. The questionnaire was either self-reported and mailed back or answered with the help of an interviewer.
Respondents answered with their individual and household demographic characteristics and their most frequent trip, including its purpose, origin, destination, travel mode, departure time, and travel time. We collected 320 valid trips of 320 residents, one trip per person. Among these trips, 239 were shopping-related trips. So far, most previous studies have investigated the overall or commute trips in this type of area. As for shopping-related trips, few studies have focused on it. Thus, this study focuses on the shopping-related trips in this survey. After data cleaning, it had a valid sample size of 304 individuals’ 304 trips.
Survey 2: This was performed after the Wanda Shopping Plaza’s opening. We used similar survey methods as for Survey 1. The difference was that: (1) The questionnaire survey was performed in-house with the guidance of the interviewer; (2) In each household, household and personal demographic characteristics and a travel diary were completed by any residents above 6 years old. The sampling rate was about 2% in Jinhexincheng and its sample size was 1291 residents. After data cleaning, it had a valid sample size of 1017 individuals’ 2117 trips.
4. Before and After Travel Characteristic Analysis
In this section, the changes in shopping destinations, travel time, and mode share are analyzed using the samples before and after Wanda Shopping Plaza was opened. Overall trips and shopping-related trips are the focus. We simply compared the characteristics of the samples before and after the opening of Wanda, without drawing any conclusion about whether these changes happened because of the opening of Wanda.
4.1. Shopping Destination Change
Two heat maps are drawn to show the changes in shopping destinations (Figure 1). As shown in the black circles in Figure 1, the hottest spot before the opening of Wanda Shopping Plaza was located at Jiangqiao Business District (JBD). After the opening of Wanda, the hottest spot moved to Wanda.
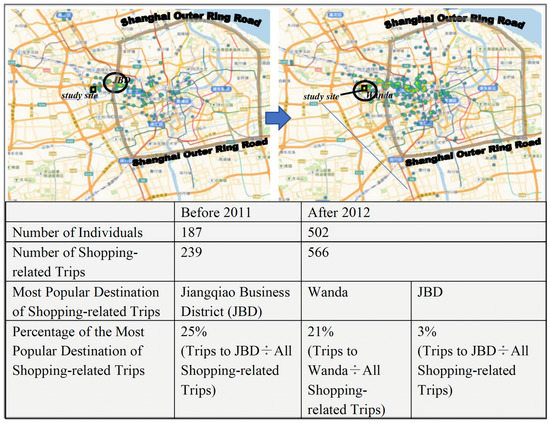
Figure 1.
Shopping-Related Trips’ Destinations Before and After Wanda Shopping Plaza was open (Left Heat Map: Before Wanda Shopping Plaza was open, in 2011; Right Heat Map: After Wanda Shopping Plaza was open, in 2012; Wanda and JBD are shown as the red spots within the black circles in the two maps).
The detailed sample sizes and percentages of the shopping destinations are shown at the bottom of Figure 1. We focus on shopping-related trips in this table, which include the travel purposes of shopping for necessaries, dining out, social or recreational events, family or personal errands, and entertainment.
Before the opening of Wanda Shopping Plaza, 25% of shopping-related trips’ destinations are located at Jiangqiao Business District, including Jiangqiao RT-Mart, Jiangqiao Fabric Market, and Jiangqiao Wal-Mart. After the opening of Wanda Shopping Plaza, 21% of shopping-related trips’ destinations are Wanda Shopping Plaza and the visit percentage of Jiangqiao Business District declined sharply to 3%.
4.2. Travel Time
The average travel time for three groups of the population is studied in this section. These groups include overall samples, relocatees, and non-relocatees. The average travel time before and after Wanda for these three groups reveals some interesting results. After Wanda’s opening, for all three groups, the shopping-related trips’ average travel time decreases (third and fourth rows in Table 1) even though the average travel time for all trips increases (first two rows in Table 1). We cannot draw any conclusion on causal effects on this basis, but we found this travel time change in these two time periods (before and after Wanda’s opening) for the two different samples in our study site. Wanda may have contributed to this, but further studies are required to confirm this.

Table 1.
Travel time (minutes) and travel mode shares for relocatees, non-relocatees, and overall sample before and after Wanda Shopping Plaza was opened (p-values are shown in the blue arrows; valid sample size is shown in parentheses).
Table 1 also shows that the average travel time of relocatees is always greater than that of non-relocatees, no matter whether for all trips or shopping-related trips, and no matter whether before or after Wanda’s opening (comparing the columns of relocatees and non-relocatees). These differences are always significant as well (p-values shown in the blue arrows). The average travel time of relocatees is significantly larger than that of non-relocatees. The possible reason for this could be that, compared to relocatees, non-relocatees had the initiative to choose a place of residence and thus tend to have a lower travel time for either overall trips or shopping-related trips.
This finding matches the conclusion in a previous study, which showed that from a travel-equity perspective, the relocation process and the development of the megacity periphery would have a greater impact on the travel of relocatees than other populations, and relocatees would have a lower travel quality than non-relocatees in developing countries [3]. The previous finding focused on overall travel purposes. What we find in this study can extend this from overall trips to shopping-related trips as well.
4.3. Travel Mode Share
There are seven travel modes: bike, moped/motorcycle, public transit (bus and metro), taxi, walking, shuttle bus (includes shuttle bus for shops, companies, communities, and so on), and car in the area. The mode shares are shown in Table 1 (bottom).
For all three groups (overall samples, relocatees, and non-relocatees), after the opening of Wanda, especially for the shopping-related trips, the share of shuttle bus decreases while the share of walking increases. This may be related to a nearer shopping mall providing higher accessibility by foot.
It can also be observed that the non-relocatees experience a larger increase in car share for either regular trips or shopping-related trips, while the share of bus and metro decreases for the non-relocatees. This may be because, compared to the relocatees, those who chose to live in the area are younger and richer, and more of them are working [3]. Thus, non-relocatees may have more willingness, initiative, and ability to improve their travel condition, and they may also find it easier to purchase a car, which makes them more likely to change their previous travel options. Hence, the increase in car share for the non-relocatees is reasonably higher than the other group. The relocatees are more likely to remain a similar share of the car travel mode for both periods.
5. Before and after Travel-Mode Choice Model Analysis
The travel-equity change over time is analyzed using travel-mode choice models in this section. Models are estimated using Biogeme [27] with data collected from the two surveys.
5.1. Travel-Mode Choice Model Analysis before the Opening of Wanda Shopping Plaza
In the first survey before the opening of Wanda Shopping Plaza, 304 persons’ 304 valid trip and travel-mode samples were collected. Using this data, travel-mode choice models were estimated. The travel-mode choice set in the survey consists of six travel modes: shopping shuttle bus, walking, bike, motorcycle/moped, car, public transit (including bus and metro). The data input of the model includes travel-mode selection, mode availability, demographic characteristics, and other characteristics (travel time and cost of each mode). The demographic characteristics consist of age, gender, Shanghai city permanent residency, education, working status, relocatee status, years living locally, household size, apartment size, and driver’s license.
Table 2 shows the mixed logit models for travel-mode selection. Among all the estimated models, we finally chose the mixed logit model with a log-normal distribution of time value because we only have hundreds of samples and it is not sufficient to estimate significant travel-time and cost coefficients. With likelihood ratio tests, we find this model is the best model among all other estimated models, including but not limited to the multinomial logit model and the mixed logit model with time value as a value.
Table 2.
Travel-mode choice logit models before and after the opening of Wanda (male and retired are both treated as dummy variables. CNY means Chinese Yuan; at the time of the survey, 1 United States Dollar (USD) = 6.25 CNY).
As shown in Table 2, there are two groups of alternative-specific constants (ASCs) for maintenance and subsistence travel, respectively, in the model. Subsistence travel is that which has the purpose of going to school or work. Maintenance travel is that which has the purpose of going shopping for life necessaries, going to the hospital, or picking up others. Among all demographic characteristics, only the male dummy variable (1 for male and 0 for others) and the retired dummy variable (1 for retired people and 0 for others) are significant. Among all travel-mode correlations, the correlation of “motorcycle or moped” and “bicycle” has the most significant result. This may be related to the fact that they have a similar riding style, so the correlation is reasonable and is kept in the model.
In Table 2, the model before Wanda opened has a time value distributed log-normally. This model is acceptable since a log-normal distribution for the time value is sensible. It is reasonable because the time value in China is 0.15–0.57 CNY/min (i.e., 1.44–5.44 USD/h) which is the shaded area in the distribution figure above. The time-value log-normal distribution’s median is 3.94 USD/h, and variance is 0.20. This model is only using the most frequent trips, so the median time value of 3.94 USD/h is closer to the upper bound of 5.44 USD/h. Thus, it is acceptable.
5.2. Travel-Mode Choice Model Analysis after the Opening of Wanda Shopping Plaza
In this multinomial logit model, 2117 trips of 1017 individuals collected from the second survey (after the opening of Wanda) are studied. We have sufficient samples to estimate significant travel time and cost coefficients, thus a multinomial logit model is used instead of a mixed logit model, which can allow parameters to be distributed. The choice set includes nine travel modes: bike, bus, car, metro, moped, motorcycle, shuttle, taxi, and walking. Compared to the survey before Wanda shopping plaza’s opening, we spread the previous six modes into nine modes in the survey after Wanda’s opening to make it closer to how people perceived travel modes and easier for the respondents to understand. There was no new mode added. For example, public transit was split into bus and metro. This was because, when the survey before Wanda shopping plaza’s opening was conducted, some respondents did not fully understand what exactly public transit was. Thus, we made it clearer by offering bus and metro as two modes in the survey after Wanda’s opening. Another example of this was that motorcycle/moped was treated as one single mode in the survey before Wanda’s opening. To make it clearer, we split motorcycle and moped into two modes.
The model includes the male dummy variable (1 for male and 0 for others) and the retired dummy variable (1 for retired people and 0 for others) because only these two variables are significant among all demographic characteristics.
The adjusted rho-square, 0.726, shows that the model is acceptable. For mode preference and demographic characteristics, the model shows that after the opening of the shopping plaza, males tend to travel by motorcycle, moped, and bike, while before, they tended to travel by car (Table 3). A reasonable inference is that the opening of the shopping plaza near Jinhexincheng brings about shorter travel distances for the residents to go shopping; thus, people are more likely to choose short-distance travel modes such as motorcycle, moped, and bike. The retired tend to choose moped and car, while they preferred motorcycle/moped, shopping shuttle, and transit before (Table 3). The reduced choice of shopping shuttle and transit is perhaps also because people are making fewer visits to shopping plazas that are far from the residential area after the shopping plaza near Jinhexincheng opened.
Table 3.
Comparison of Time Value, Mode Preference, and Travel Equity Before and After the Opening of Wanda.
In Table 2, the “after” model shows that the time value is 0.51 CNY/min (i.e., 30.75 CNY/hour or 4.94 USD/h). This falls into the Chinese value of time range, which is 0.15–0.57 CNY/min (i.e., 9–34 CNY/hour or 1.44–5.46 USD/h) according to the Chinese value-of-time literature (see Table 2 bottom). Thus, the time value is sensible and the model is acceptable.
Table 3 combines the two model results of the samples before and after the opening of Wanda Shopping Plaza. The time value was compared with 0.41 CNY/min (second row in Table 3), which is the median of time value before the opening of Wanda Shopping Plaza; 0.51 CNY/min is greater, which could be because of economic development and an increase in residents’ income occurred between the first (in 2011) and the second survey (in 2012).
From the travel-mode choice model, we can calculate consumer surplus and use it to measure travel equity. Table 3 shows that travel equity of relocatees and non-relocatees for shopping-related trips becomes worse after the opening of Wanda Shopping Plaza (the difference between the relocatees and non-relocatees has become greater rather than smaller in the consumer surplus row in Table 3). Relocatees always have a lower travel quality for shopping-related trips no matter whether before or after the opening of Wanda Shopping Plaza. The distributions show that over time, relocatees and non-relocatees are more likely to have a similar distribution shape.
6. Discussion and Conclusions
In China’s megacities, the government demolishes downtown substandard housing and relocates residents (called relocatees in this study) to affordable large-scale residential areas in the suburbs of large cities. We have questions regarding this compulsory relocation and travel equity: is relocatees’ travel equity different from that of non-relocatees? How does the travel equity alter over time (before and after the opening of a major shopping plaza nearby)? In the existing studies, it is difficult to obtain a good knowledge of the answers to those questions, especially for shopping trips in megacities during the suburbanization process in developing countries.
To answer these questions, we conducted two surveys before and after the opening of Wanda Shopping Plaza, a large shopping mall near the study site in Shanghai. Statistical analysis is conducted to understand how relocatees and non-relocatees’ shopping destination, travel time, and travel mode change before and after the opening of Wanda on the megacity periphery. Two travel-mode choice logit models are estimated and consumer surplus is calculated to measure travel-equity change over time. Results suggest that:
(1) A total of 25% of shopping-related trips’ destinations were located at Jiangqiao Business District (JBD) before the opening of Wanda. After the opening of Wanda, 21% of shopping-related trips’ destinations was Wanda and the visit percentage of JBD declined sharply to 3%. In the heat maps in Figure 1, after the opening of Wanda, the hottest spot for shopping destinations moved from JBD to Wanda.
(2) Shopping-related trips’ average travel time decreases even though the average travel time for all trips increases (first two rows in Table 1) after Wanda’s opening. In addition, the average travel time of relocatees is always significantly greater than that of non-relocatees, no matter whether for all trips or shopping-related trips, and no matter whether before or after Wanda’s opening.
This finding matches the conclusion in a previous study, which showed that from a travel-equity perspective, the relocation process and the development of the megacity periphery would have a greater impact on the travel of relocatees than other populations, and relocatees would have a lower travel quality than non-relocatees in developing countries [3]. The previous finding focused on overall travel purposes. What we find in this study can extend this from overall trips to shopping-related trips as well.
(3) The share of shopping shuttle buses became less while the share of walking grew after the opening of Wanda, especially for shopping-related trips. This may be related to a nearer shopping mall providing higher accessibility by foot.
Compared to relocatees, non-relocatees experience a larger increase in the car share, and their share of bus and metro use decreases for both regular trips and shopping-related trips (Table 1). Relocatees retain a similar share of car use for both periods. This may be because, compared to the relocatees, those who chose to live in the area are younger, richer, and more of them are working [3], thus they have more willingness, initiative, and ability to improve their travel condition.
(4) Two travel-mode choice Logit models with samples before and after the opening of Wanda are estimated. Model results show that the median time value before Wanda opened was 0.41 CNY/min. After Wanda’s opening, the value was 0.51 CNY/min (Table 3).
Travel equity is measured by consumer surplus, which is calculated from the travel-mode choice models. Relocatees always have a lower travel quality for shopping-related trips no matter whether before or after the opening of Wanda Shopping Plaza. Over time, relocatees and non-relocatees are more likely to have a similar distribution shape.
However, the travel equity between relocatees and non-relocatees for shopping-related trips becomes worse after the opening of Wanda Shopping Plaza. This is the innovative contribution of this study, which quantitatively uses consumer surplus to evaluate the change in travel equity before and after the opening of a shopping plaza nearby, for shopping-related trips of relocatees and non-relocatees in city-peripheral large-scale-residential areas in a rapidly developing country.
The results of this study are similar to the findings of previous studies; the wide inequity between different groups has become a common companion in the process of urban development [9,11,35,36,37,38,39,40,41,42]. Myrdal (1957) initially found that in the process of economic development, some regions achieved advanced development due to initial spatial advantages, and the developed regions formed a contrast with underdeveloped regions. This means that economic geographical development progress does not occur in every place and group at the same time and evenly, but is characterized by polarization [36,39]. In this study, the relocatees in Shanghai experienced involuntary relocation, moving from the developed core area to the underdeveloped peripheral area, forming the group polarization in the peripheral area. The socio-economic conditions of relocatees and non-relocatees show a polarized difference, which leads to a gap in travel for shopping trips. Briefly, inequity has become the companion of polarization [10,35,36,39,42]. Previous studies on travel inequity have supported the claim that the difference in travel reflects a variety of general socio-economic inequities, which usually occur in the process of urban growth and transformation [9,11,40,43]. Travel inequity is found to be highly related with respondents’ socio-economic attributes, such as income, gender, age, or immigration status [9,37,38], which is similar to the findings of this study.
Overall, in the process of suburbanization of megacities in developing countries, there are various and wide inequitable phenomena. The findings of this study contribute to exploring the travel inequity of shopping trips in this process, focusing on the specific quantitative calculation results of the travel inequity of shopping trips between relocatees and non-relocatees, as well as the changes in the travel inequity of shopping trips of relocatees before and after the construction of commercial buildings. Besides this, due to the polarization effect, inequity may gradually expand over time [39,44,45]. Therefore, based on the findings of this study, a possible result is that the travel equity of relocatees and non-relocatees may become worse rather than better over time with economic growth and the development of the peripheral area. This is worth considering by the government and policymakers.
Policy intervention has been confirmed to play a significant role in eliminating social inequity [36,46,47,48,49]. Friedmann (1966) discussed the impact of government intervention on weakening regional inequity through a case study of Venezuela. Generally, when urban development enters the growth stage, the inequity in society would show an obvious dual structure, which is usually reflected in the gradual expansion of the socio-economic gap between different groups [36,47,50,51,52]. The government can weaken inequity through policy interventions [36,46,47,50,51,52]. During this study, Shanghai was in the stage of urban growth; we found that the travel inequity of shopping trips in the peripheral areas was expanding through quantitative analysis. Appropriate government intervention is needed, controlling the travel inequity of shopping trips between relocatees and non-relocatees within an acceptable range. Therefore, the authors thought that the magnitude difference of consumer surplus between relocatees and non-relocatees would be a reference for possible travel subsidies that can be provided to the relocatees.
The findings of this study can support policy decisions and urban transportation planning for large-scale residential areas in the suburbs of megacities. Besides this, the procedure and the results of this research can also be used in the analysis of other similar cases. The study limitations are: we cannot draw any conclusion on whether all of those travel behavior differences before and after the Wanda Shopping Plaza opened were truly caused by the opening of Wanda. Further studies are required to clarify this. Furthermore, only one shopping mall and one site were studied. In the future, we can extend this to other similar residential areas.
Author Contributions
Formal analysis, J.G., K.Z., J.Z. and X.Z. All authors have read and agreed to the published version of the manuscript.
Funding
This research received no external funding.
Acknowledgments
The authors thank the research team of Intelligent Transportation Systems Lab at MIT and Fuyuan Lai of Tsinghua University for their support and suggestions.
Conflicts of Interest
The authors declare no conflict of interest.
References
- United Nations Population Division. World Population Prospects 2017. Available online: https://population.un.org/wpp/ (accessed on 17 February 2019).
- Guan, J.; Yang, D. Residents’ characteristics and transport policy analysis in large-scale residential areas on a city periphery: Case study of Jinhexincheng, Shanghai, China. Transp. Res. Rec. 2015, 2512, 11–21. [Google Scholar] [CrossRef]
- Guan, J.; Xu, C. Are relocatees different from others? Relocatee’s travel mode choice and travel equity analysis in large-scale residential areas on the periphery of megacity Shanghai, China. Transp. Res. Part A Policy Pract. 2018, 111, 162–173. [Google Scholar] [CrossRef]
- Wu, F. Residential relocation under market-oriented redevelopment: The process and outcomes in urban China. Geoforum 2004, 35, 453–470. [Google Scholar] [CrossRef]
- Guan, J. Travel Behavior Characteristics of Different Social Groups in Large-Scale Residential Areas on City Periphery: Case Study of Shanghai, China. Doctoral Dissertation, Tongji University, Shanghai, China, 2015. [Google Scholar]
- Cadwallader, M.T. Migration and Residential Mobility: Macro and Micro Approaches; University of Wisconsin Press: Madison, WI, USA, 1992. [Google Scholar]
- Clark, W.A.; Onaka, J.L. Life cycle and housing adjustment as explanations of residential mobility. Urban Stud. 1983, 20, 47–57. [Google Scholar] [CrossRef]
- Guan, J.; Zhang, K.; Shen, Q.; He, Y. Dynamic Modal Accessibility Gap: Measurement and Application Using Travel Routes Data. Transp. Res. Part D Transp. Environ. 2020, 81, 102272. [Google Scholar] [CrossRef]
- Hidayati, I.; Yamu, C.; Tan, W. The emergence of mobility inequality in greater Jakarta, Indonesia: A socio-spatial analysis of path dependencies in transport-land use policies. Sustainability 2019, 11, 5115. [Google Scholar] [CrossRef]
- Modai-Snir, T.; van Ham, M. Neighbourhood change and spatial polarization: The roles of increasing inequality and divergent urban development. Cities 2018, 82, 108–118. [Google Scholar] [CrossRef]
- Wei, Y.D.; Wu, Y.; Liao, F.H.; Zhang, L. Regional inequality, spatial polarization and place mobility in provincial China: A case study of Jiangsu province. Appl. Geogr. 2020, 124, 102296. [Google Scholar] [CrossRef]
- Pan, H.; Wang, X.; Day, J. Travel characteristics and its impact on social segregation and urban livability. Urban Plan. Forum 2010, 6, 61–67. [Google Scholar]
- Day, J. Effects of Involuntary Residential Relocation on Household Satisfaction in Shanghai, China. Urban Policy Res. 2013, 31, 93–117. [Google Scholar] [CrossRef]
- Day, J.; Cervero, R. Effects of residential relocation on household and commuting expenditures in Shanghai, China. Int. J. Urban Reg. Res. 2010, 34, 762–788. [Google Scholar] [CrossRef] [PubMed]
- Kamall, F. Trip patterns at newly developed commercial centres: Do these off-centre developments increase the total trips or simply re-distribute them? Plan. Transp. Res. Comput. 1991, P341, 47–57. [Google Scholar]
- Levinson, D.; Kumar, A. Activity, travel, and the allocation of time. J. Am. Plan. Assoc. 1995, 61, 458–470. [Google Scholar] [CrossRef]
- Marjanen, H. Longitudinal study on consumer spatial shopping behaviour with special reference to out-of-town shopping: Experiences from Turku, Finland. J. Retail. Consum. Serv. 1995, 2, 163–174. [Google Scholar] [CrossRef]
- Shiftan, Y.; Newmark, G.L. Effects of in-fill retail center development on regional travel patterns. Transp. Res. Rec. 2002, 1805, 53–59. [Google Scholar] [CrossRef]
- Yee, J.L.; Niemeier, D.A. Analysis of activity duration using the Puget sound transportation panel. Transp. Res. Part A Policy Pract. 2000, 34, 607–624. [Google Scholar] [CrossRef]
- Lee, S.L.; Yong, G.S. Singapore’s revised concept plan and retailing: Impact of the Tampines regional centre on shopping patterns. J. Retail. Consum. Serv. 1998, 5, 33–43. [Google Scholar] [CrossRef]
- Handy, S.L.; Clifton, K.J. Local shopping as a strategy for reducing automobile travel. Transportation 2001, 28, 317–346. [Google Scholar] [CrossRef]
- Newmark, G.L.; Plaut, P.O.; Garb, Y. Shopping Travel Behaviors in an Era of Rapid Economic Transition: Evidence from Newly Built Malls in Prague, Czech Republic. Transp. Res. Rec. J. Transp. Res. Board 2004, 1898, 165–174. [Google Scholar] [CrossRef]
- Garb, Y. The impact of retail deconcentration on travel to hypermarkets in Prague. In Employment Deconcentration in European Metropolitan Areas; Springer: Berlin/Heidelberg, Germany, 2007; pp. 235–264. [Google Scholar]
- Newmark, G.L. Assessing the Equity of Changing Travel Behaviors. Berkeley Plan. J. 2014, 27. [Google Scholar] [CrossRef]
- Shanghai Bureau of Statistics. Shanghai Statistical Yearbook; China Statistics Press: Beijing, China, 2016. [Google Scholar]
- Wanda. Wanda Plazas—Dalian Wanda Commercial Management Group Co., Ltd. 2021. Available online: http://www.wandaplazas.com/intro/plaza/ (accessed on 6 April 2021).
- Bierlaire, M. BIOGEME: A free package for the estimation of discrete choice models. In Proceedings of the 3rd Swiss Transport Research Conference, Ascona, Switzerland, 19–21 March 2003. [Google Scholar]
- Chen, X.; Liu, Q.; Du, G. Estimation of Travel Time Values for Urban Public Transport Passengers Based on SP Survey. J. Transp. Syst. Eng. Inf. Technol. 2011, 11, 77–84. [Google Scholar] [CrossRef]
- Fu, W.; Jin, W.; Lin, F. Calculation of time value for urban public travel with MNL model. J. Transp. Syst. Eng. Inf. Technol. 2010, 10, 148–152. [Google Scholar]
- Jiang, Y.; Li, T.; Richard, F.D.B. Value of travel time: An SP survey in Tianjin. Urban Transp. China 2009, 7, 68–73. [Google Scholar]
- Wang, X. Passenger transport contribution rate of multiple modes of transport in transport corridor. J. Railw. Sci. Eng. 2012, 9, 119–125. [Google Scholar]
- Zhang, T.; Yang, D.; Ye, L.; Wang, Q. Application of Mixed Logit Model to estimating heterogeneous travel time value. Comput. Commun. 2007, 25, 55–58. [Google Scholar]
- Zhao, B.; Zhao, S.; Wang, Y. Self-Organizing Relation between Resident Trip Mode Choice and Transit Priority Policy—Case Study in Changchun, China. In CICTP 2012: Multimodal Transportation Systems—Convenient, Safe, Cost-Effective, Efficient; American Society of Civil Engineers: Reston, VA, USA, 2012. [Google Scholar] [CrossRef]
- Zhao, S.; Zhao, B. Value of travel time of urban resident under multifactor influence. J. Jilin Univ. Eng. Technol. Ed. 2011, 41, 46–50. [Google Scholar]
- Arundel, R.; Hochstenbach, C. The spatial polarization of housing markets and wealth accumulation. In Centre for Urban Studies Working Paper Series No 32; Centre for Urban Studies, University of Amsterdam: Amsterdam, The Netherlands, 2018. [Google Scholar]
- Badcock, B. Restructuring and spatial polarization in cities. Prog. Hum. Geogr. 1997, 21, 251–262. [Google Scholar] [CrossRef]
- Delbosc, A.; Currie, G. The spatial context of transport disadvantage, social exclusion and well-being. J. Transp. Geogr. 2011, 19, 1130–1137. [Google Scholar] [CrossRef]
- Dodson, J.; Gleeson, B.; Evans, R.; Sipe, N. Investigating the Social Dimensions of Transport Disadvantage II: From Concepts to Methods through an Empirical Case Study. Urban Policy Res. 2007, 25, 63–89. [Google Scholar] [CrossRef]
- Hirschman, A.O. The Strategy of Economic Development (No. 04; HD82, H5.); Yale University Press: New Haven, CT, USA, 1958. [Google Scholar]
- Kwan, M.P.; Schwanen, T. Geographies of mobility. Ann. Am. Assoc. Geogr. 2016, 106, 1–14. [Google Scholar] [CrossRef]
- Myrdal, G. Economic Theory and Under-Developed Regions; Gerald Duckworth & Co.: London, UK, 1957. [Google Scholar]
- Townshend, I.; Miller, B.; Evans, L. Socio-Spatial Polarization in an-Age of Income Inequality: An Exploration of Neighbourhood Change in Calgary’s “Three Cities”. In Neighbourhood Change Research Partnership; Factor-Inwentash Faculty of Social Work, University of Toronto: Toronto, ON, Canada, 2018; p. 36. [Google Scholar]
- Wachs, M.; Kumagai, T. Physical accessibility as a social indicator. Socio-Econ. Plan. Sci. 1973, 7, 437–456. [Google Scholar] [CrossRef]
- Andersen, R.; Curtis, J. The polarizing effect of economic inequality on class identification: Evidence from 44 countries. Res. Soc. Strat. Mobil. 2012, 30, 129–141. [Google Scholar] [CrossRef]
- Azomahou, T.T.; Diene, M. Polarization patterns in economic development and innovation. Struct. Chang. Econ. Dyn. 2012, 23, 421–436. [Google Scholar] [CrossRef]
- Barca, F.; McCann, P.; Rodríguez-Pose, A. The case for regional development intervention: Place-based versus place-neutral approaches. J. Reg. Sci. 2012, 52, 134–152. [Google Scholar] [CrossRef]
- Friedmann, J.E. Regional Development and Policy: A Case Study of Venezuela by J. Friedmann; M.I.T. Press: Cambridge, MA, USA, 1966. [Google Scholar]
- Hudson, R. Uneven development, socio-spatial polarization and political responses. In Understanding Geographies of Polarization and Peripheralization; Palgrave Macmillan: London, UK, 2015; pp. 25–39. [Google Scholar]
- Martin, R. Institutional approaches in economic geography. In A Companion to Economic Geography; Blackwell Publishing Ltd.: Hoboken, NJ, USA, 2000; pp. 77–94. [Google Scholar]
- Ascani, A.; Crescenzi, R.; Iammarino, S. Regional Economic Development. A Review; SEARCH WP01/03; European Commission: Brussels, Belgium, 2012; pp. 2–26. [Google Scholar]
- Ruecker, A.; Trah, G. Local and Regional Economic Development. Towards a Common Framework for GTZ’s LRED Interventions in South Africa; GTZ: Eschborn, Germany, 2007. [Google Scholar]
- Stimson, R.J.; Stough, R.R.; Roberts, B.H. Regional Economic Development: Analysis and Planning Strategy; Springer Science & Business Media: Berlin/Heidelberg, Germany, 2006. [Google Scholar]


Disclaimer/Publisher’s Note: The statements, opinions and data contained in all publications are solely those of the individual author(s) and contributor(s) and not of MDPI and/or the editor(s). MDPI and/or the editor(s) disclaim responsibility for any injury to people or property resulting from any ideas, methods, instructions or products referred to in the content. |
© 2022 by the authors. Licensee MDPI, Basel, Switzerland. This article is an open access article distributed under the terms and conditions of the Creative Commons Attribution (CC BY) license (https://creativecommons.org/licenses/by/4.0/).