Article

Optimization of Image Quality in Digital Mammography with the Response of a Selenium Detector by Monte Carlo Simulation

1
Katowice Cancer Center, 40-074 Katowice, Poland
2
Institute of Physics, University of Silesia in Katowice, 40-007 Katowice, Poland
*
Author to whom correspondence should be addressed.
Appl. Sci. 2023, 13(1), 171; https://doi.org/10.3390/app13010171
Submission received: 28 November 2022 / Revised: 18 December 2022 / Accepted: 18 December 2022 / Published: 23 December 2022

Abstract

:
Mammography machines must meet high requirements to ensure the quality of the generated images. On the other hand, due to the use of ionizing radiation, there is a need to minimize the dose received by patients. To optimize both of these parameters (dose and image quality), the response characteristics of image detectors and, depending on the composition of the breasts, the physical contrast of the examined structures should be considered. This study aimed to determine the optimal voltage values for a given breast thickness during imaging with the use of a selenium image detector. Analysis was carried out using the Monte Carlo simulation method with the GEANT4 code. Our results reveal that the combination of Mo anode together with Mo filtration (the system recommended in analog mammography) was the least favorable combination among those used in digital mammography machines with a selenium detector. Moreover, the use of Rh filtration instead of Mo was advantageous regardless of the thickness of the breast and resulted in a significant improvement in image quality with the same dose absorbed in the breast. The most advantageous solution was found to be an X-ray tube with a W anode. The highest values of the image quality-to-dose ratio were observed for breasts with dimensions ranging from 53 mm to 60 mm in thickness. Lower image quality was observed for breasts with smaller dimensions due to high breast glandularity, resulting in the deterioration of the physical contrast.

1. Introduction

Breast cancer is the most common malignant neoplasm in women in the world, with the highest mortality rate. At the same time, its share in the total number of cases and deaths due to malignant neoplasms is constantly growing. According to the WHO, in 2020, this disease was diagnosed in 2.3 million women and 7.8 million in the last five years [1]. More than 30% of diagnosed cases end in death. Therefore, the prevention, diagnosis, and therapy of breast cancer constitutes a serious challenge for modern oncology. An early diagnosis of breast tumors increases the chance of successful radical treatment and thus reduces mortality [2]. Notably, the 5-year survival rate for the tumors detected at one stage of clinical advancement earlier increases by approximately 25 percentage points. The diagnostic method that allows the early detection of breast cancer is mammography (radiographic examination of the breast). It is used as a screening test to detect tumors in asymptomatic stages [3,4,5,6]. The sensitivity of the test is estimated at 80–95%, depending on the structure of the breast. Due to the insufficient specificity of the method, tests such as biopsy are necessary for verification and to differentiate between benign and malignant lesions. The use of ionizing radiation in diagnostic or therapeutic techniques always carries a risk due to the possibility of tumor induction [7,8]. This is of particular importance in the context of mammographic screening, as a large number of potentially healthy women are exposed to this risk during screening [9]. Another danger is related to the insufficient quality of these studies. Unsatisfactory image quality may result in the lack of detection of focal lesions in mammograms. On the other hand, false positives may occur as a result of, among other things, interpretation errors or image artifacts. Due to the prevalence of mammography in diagnostics compared with other radiographic methods, and its significant impact on diagnostic decisions, the monitoring of the quality of mammographic procedures is especially important and should be emphasized [10]. Therefore, achieving a balance between optimized doses versus diagnostic image quality in routine tests becomes particularly important [11]. Thus, this study aimed to optimize the parameters of X-ray beams used in digital mammography with selenium detectors using Monte Carlo simulation. For this purpose, a virtual model of a digital mammography machine with a selenium detector was built in the GEANT4 environment. A series of simulations were carried out for virtual breast phantoms with thicknesses ranging from 32 to 90 mm for various voltages and anode filtration systems. Based on the obtained results and their analysis, the exposure parameters for breasts of different thicknesses were optimized. Optimization was performed to minimize the dose received by patients undergoing mammography with the simultaneous improvement in the quality of the recorded diagnostic image. Several studies addressed the problem of the optimal selection of anode and filter material for image detectors. The authors of these studies used both empirical [12,13] and computational methods based on the Monte Carlo method [13,14,15]. However, most of these studies considered breasts with glandularity of 50% independent of the thickness of the breasts. Therefore, to simplify calculations, the authors assumed that the breast is made up of 50% glandular tissue and 50% adipose tissue [16] or calculations are made for one selected breast thickness [17]. It is now known that such a model is not an accurate representation, and therefore, cannot be used for the optimization of image quality in digital mammography [18].

2. Materials and Method

2.1. Simulation

2.1.1. Monte Carlo Software

The GEANT4 code was used in this research because it includes multiple validated models of physical processes related to ionizing radiation during mammography. In this study, the low energy electromagnetic physics Livermore models were used, which simulate the interactions of photons and electrons with matter down to about 250 eV, close to the K-shell Auger peak value of carbon atoms. This model package uses interpolated data tables based on the Livermore library [19], and its models were validated by Lechner et al. [20], Cirrone et al. [21], and Kadri et al. [22].

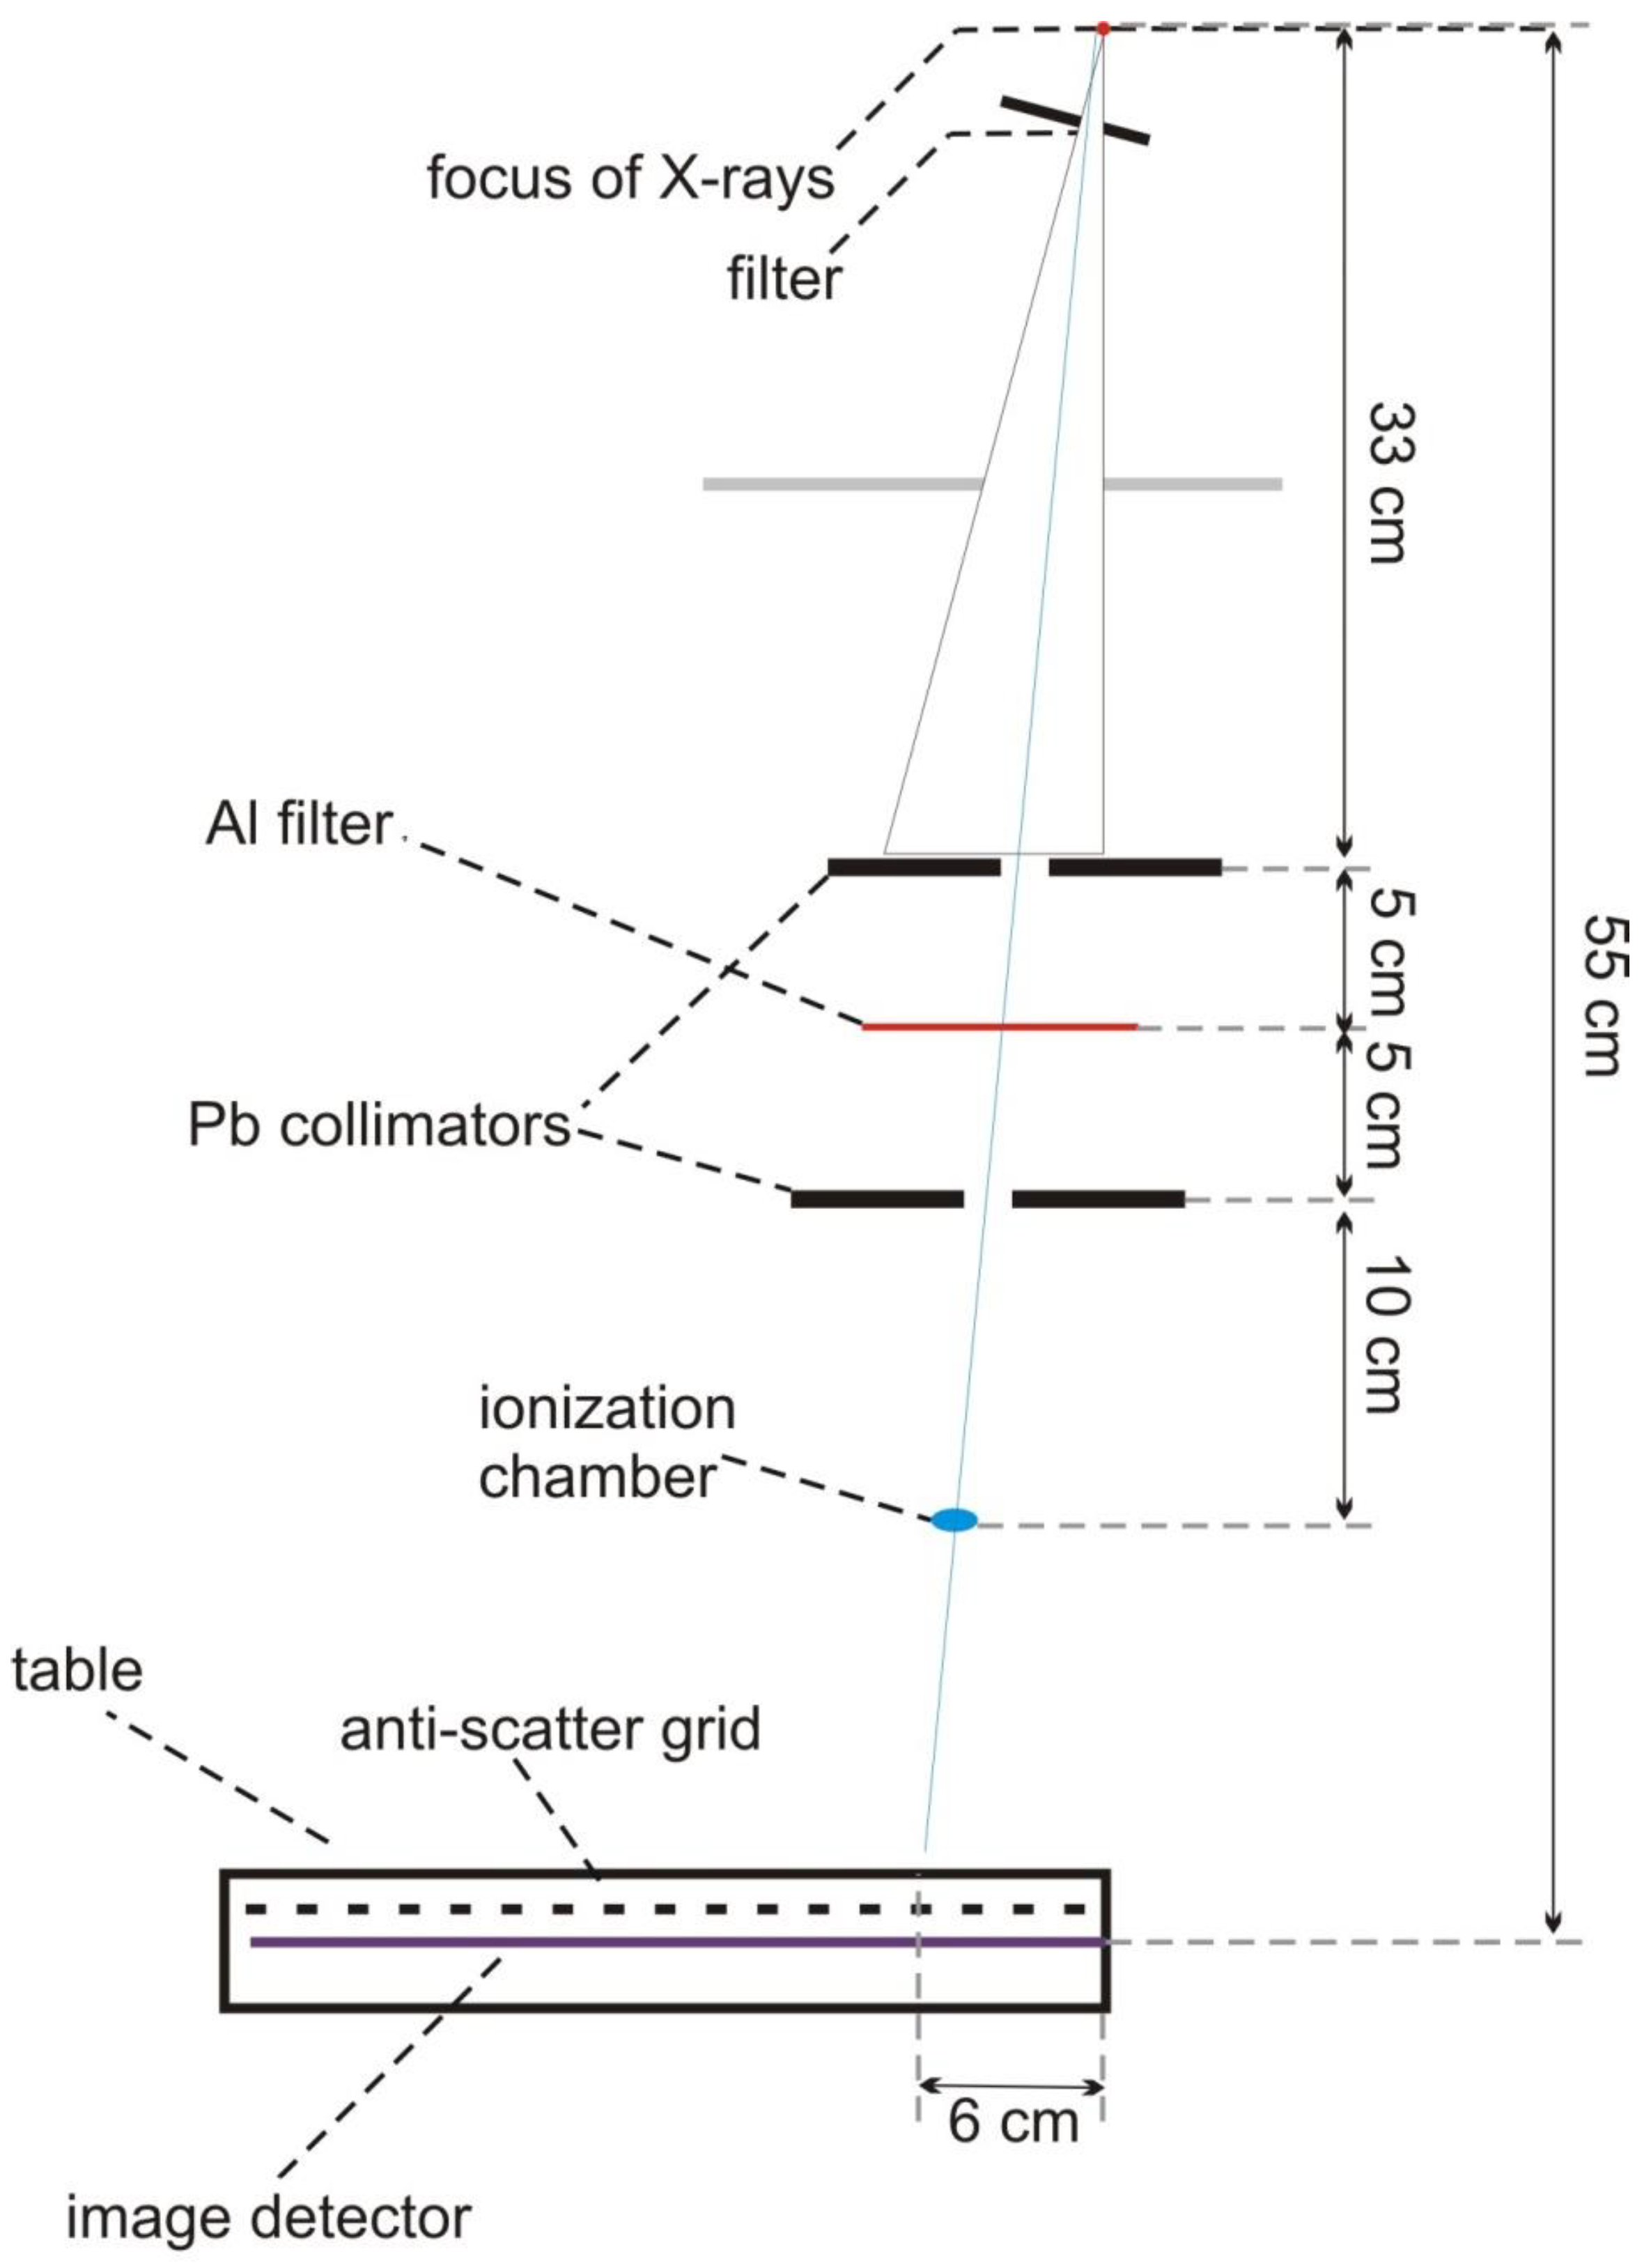
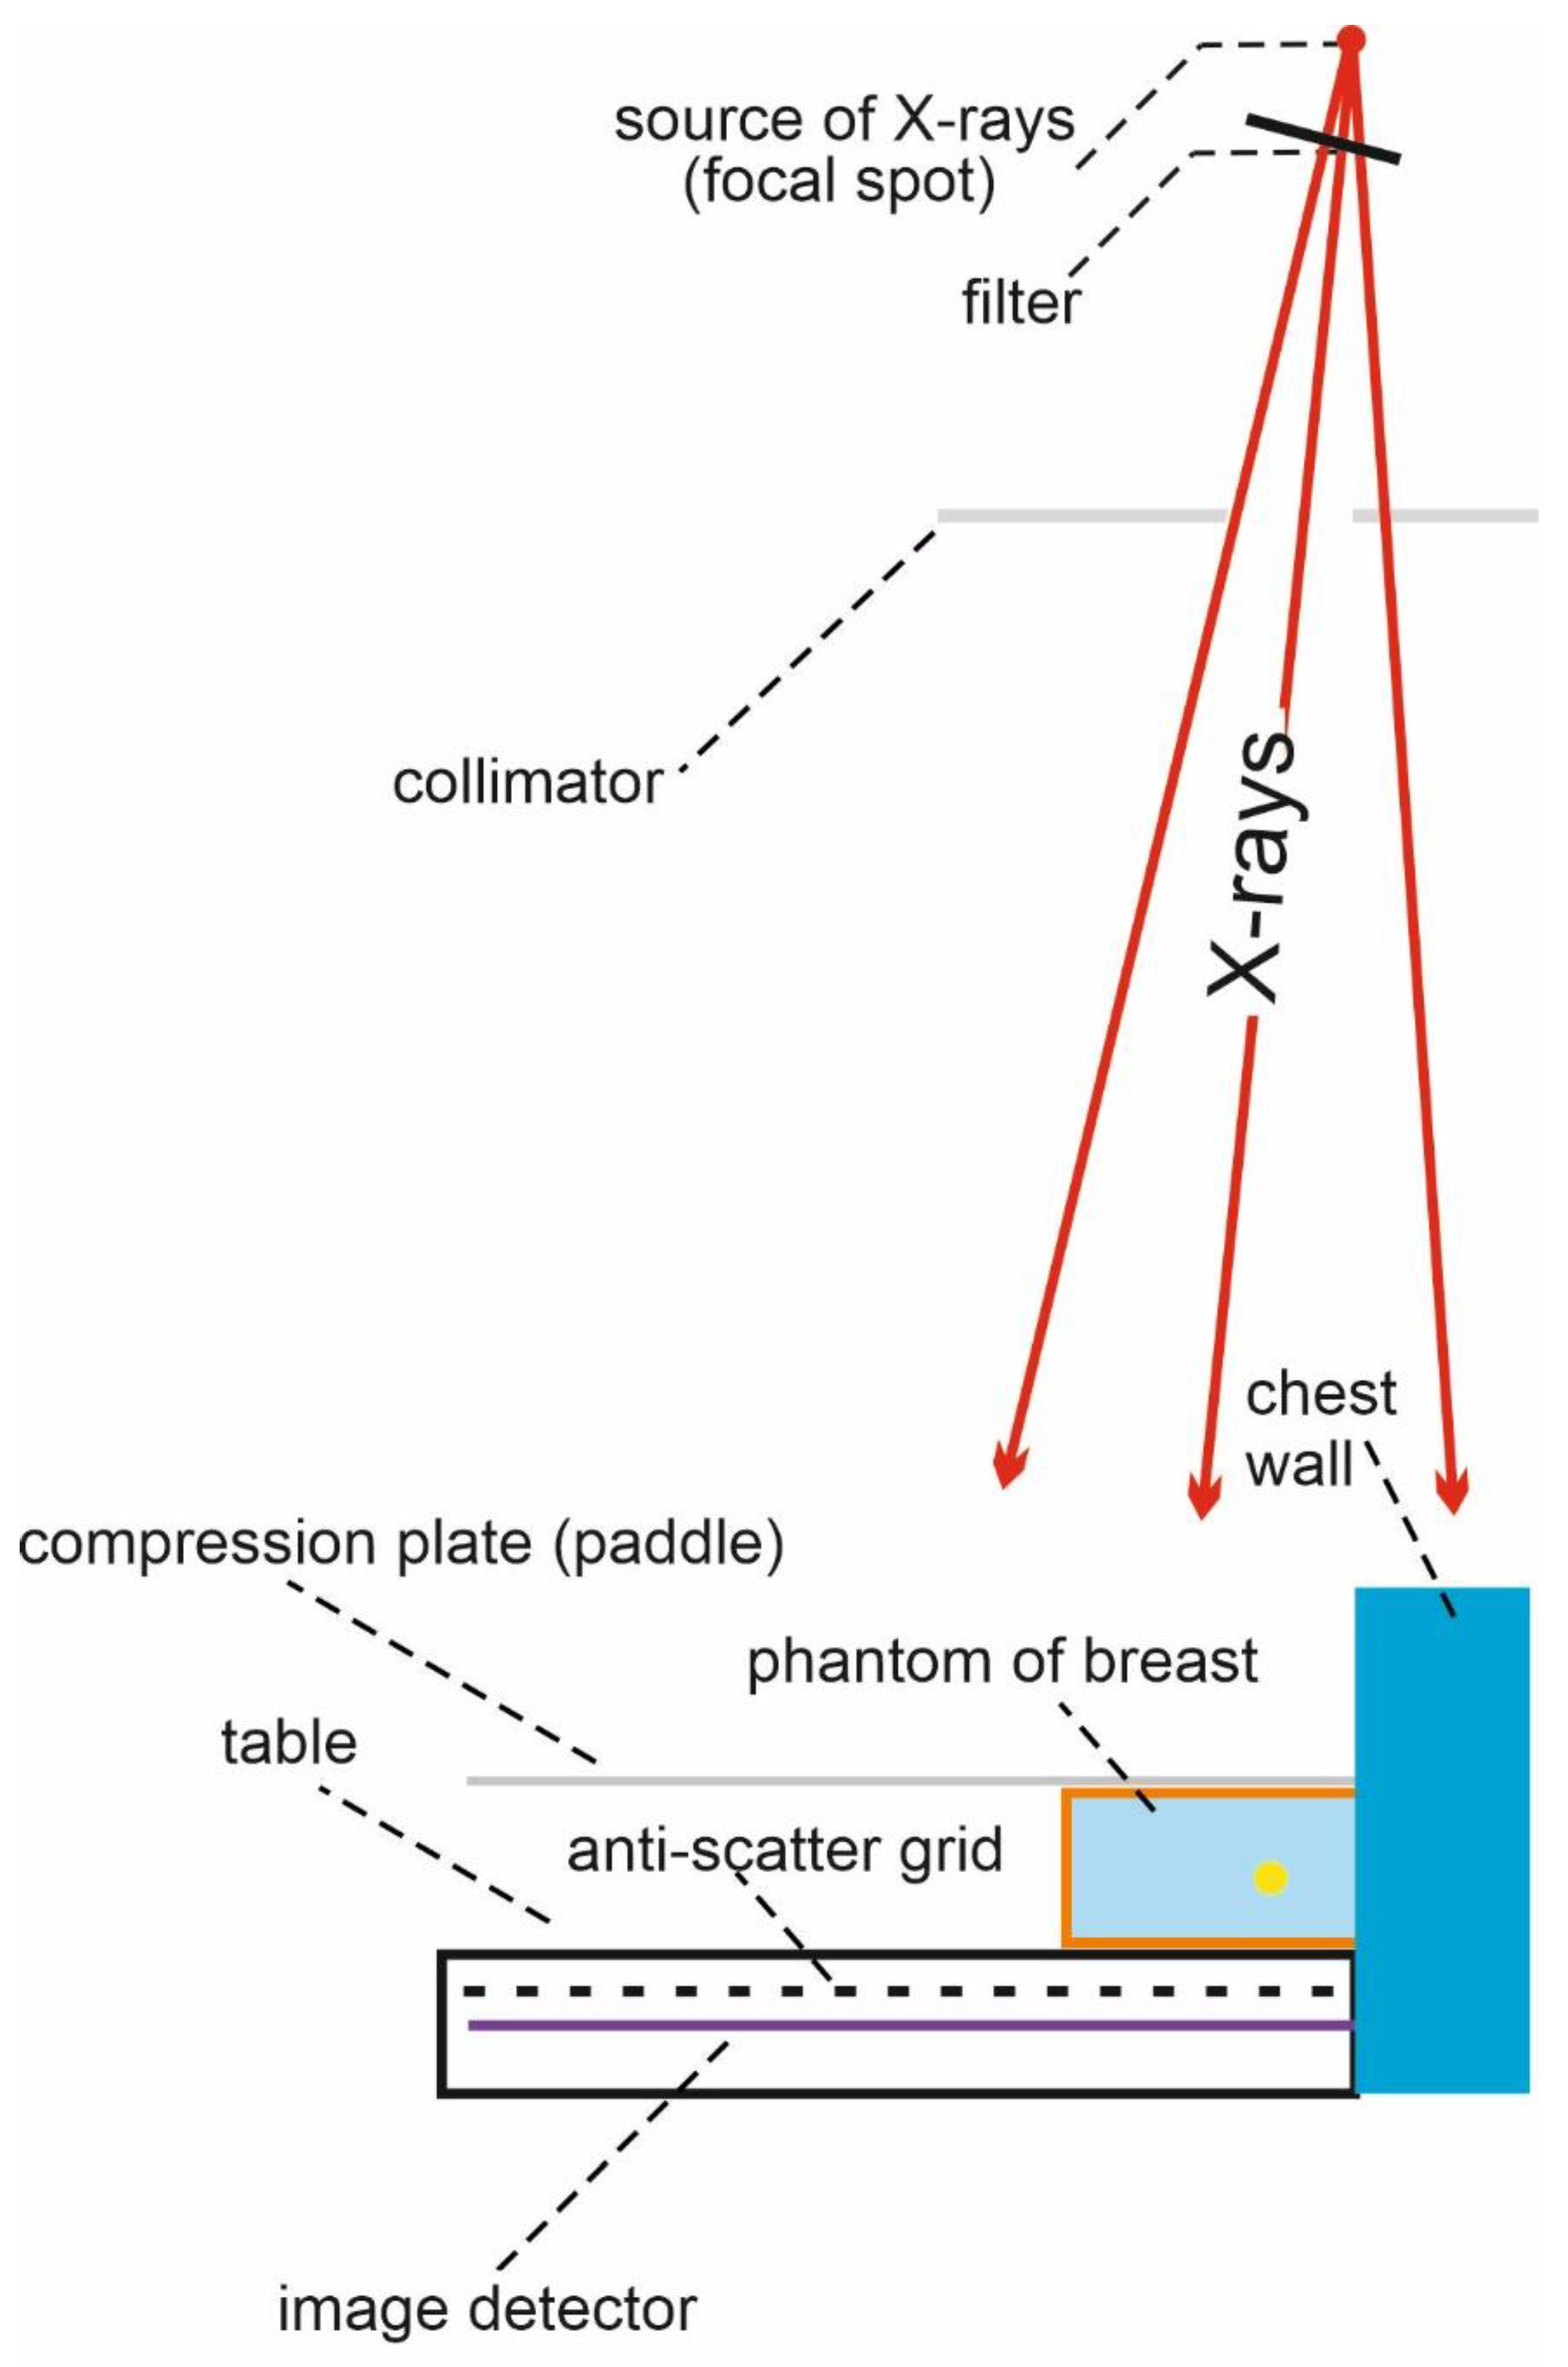
2.1.2. The Simulated System

To simulate in the GEANT4 environment, a virtual mammography machine model with a set of breast phantoms and a radiation source model were built. The entire system was built in a 1 m cube filled with 1.290 mg/cm3 air corresponding to normal conditions. This cube was the area of the laboratory in which the simulations were performed. The geometry of the simulated system is shown in Figure 1. The mammography machine model included all the most important structural elements of real devices that affect image quality and the radiation dose absorbed by the breast.

2.1.3. The Simulation of the X-ray Source

The X-ray tube was not simulated due to the low efficiency in converting the kinetic energy of electrons to X-rays. Instead, X-ray was simulated using ready-made photon spectra generated by following the method proposed by Boone et al. [23], who developed an algorithm based on the measured spectra of molybdenum, rhodium, and tungsten X-ray tubes, which enabled the generation of the above-mentioned spectra in the form of histograms with a resolution of 0.5 keV for any voltage ranging from 18 kV to 40 kV. These spectra account for filtration in the X-ray tubes themselves but are not modified by additional filtration.
To simulate the X-ray source based on the above-mentioned histogram, the G4GeneralParticleSource (GPS) class was used in the simulation program [20]. This class allows the simulation of primary photons, with their energy distribution based on the histogram. An example of spectra used in the simulations is presented in Figure 2.
In the simulations, the X-ray source was defined as the focus of the X-ray beam of the real X-ray tube. The center of the source was at the SID (source image distance) equal to 65 cm from the detector surface, above its edge from the chest side, and symmetrically to the left and right sides. At a distance of 3 cm from the X-ray source, there was an additional filter modifying the photon spectrum. The filter materials and their thicknesses were related to the anode–filter combination and corresponded to the real systems used in mammography (Table 1). The angle of the filter to the plane of the image detector was 20°.

2.1.4. Collimator

The 2 mm-thick collimator was placed 8.5 cm below the source and was made of stainless steel. It limited the beam of emitted photons to a rectangular field covering the detector surface corresponding to the image size of 18 cm × 24 cm with a 5 mm margin on each side.

2.1.5. Table with an Anti-Scatter Grid

A carbon fiber table with dimensions of 25.5 cm × 30.5 cm × 4 cm was modeled as a part of the simulated system. The surface of the table was placed at a source table distance (STD) of 63 cm from the X-ray source. Inside the table, an anti-scatter grid and an image detector were used. The model of the anti-scatter grid with dimensions of 24.4 cm × 29.4 cm and a thickness of 1.35 mm was characterized by 31 lines per cm. The grid consisted of strips made of absorbing material, namely Pb, separated by paper (spacing material) with a density of ρ = 1.0 g/cm3. The grid was positioned 1 cm above the image detector. The strips were focused, and the angle of inclination αn of the nth strip was determined according to the following equation:
α n = a r c t g ( x n S I D ) ,
where xn is the distance of the nth strip from the center of the detector.

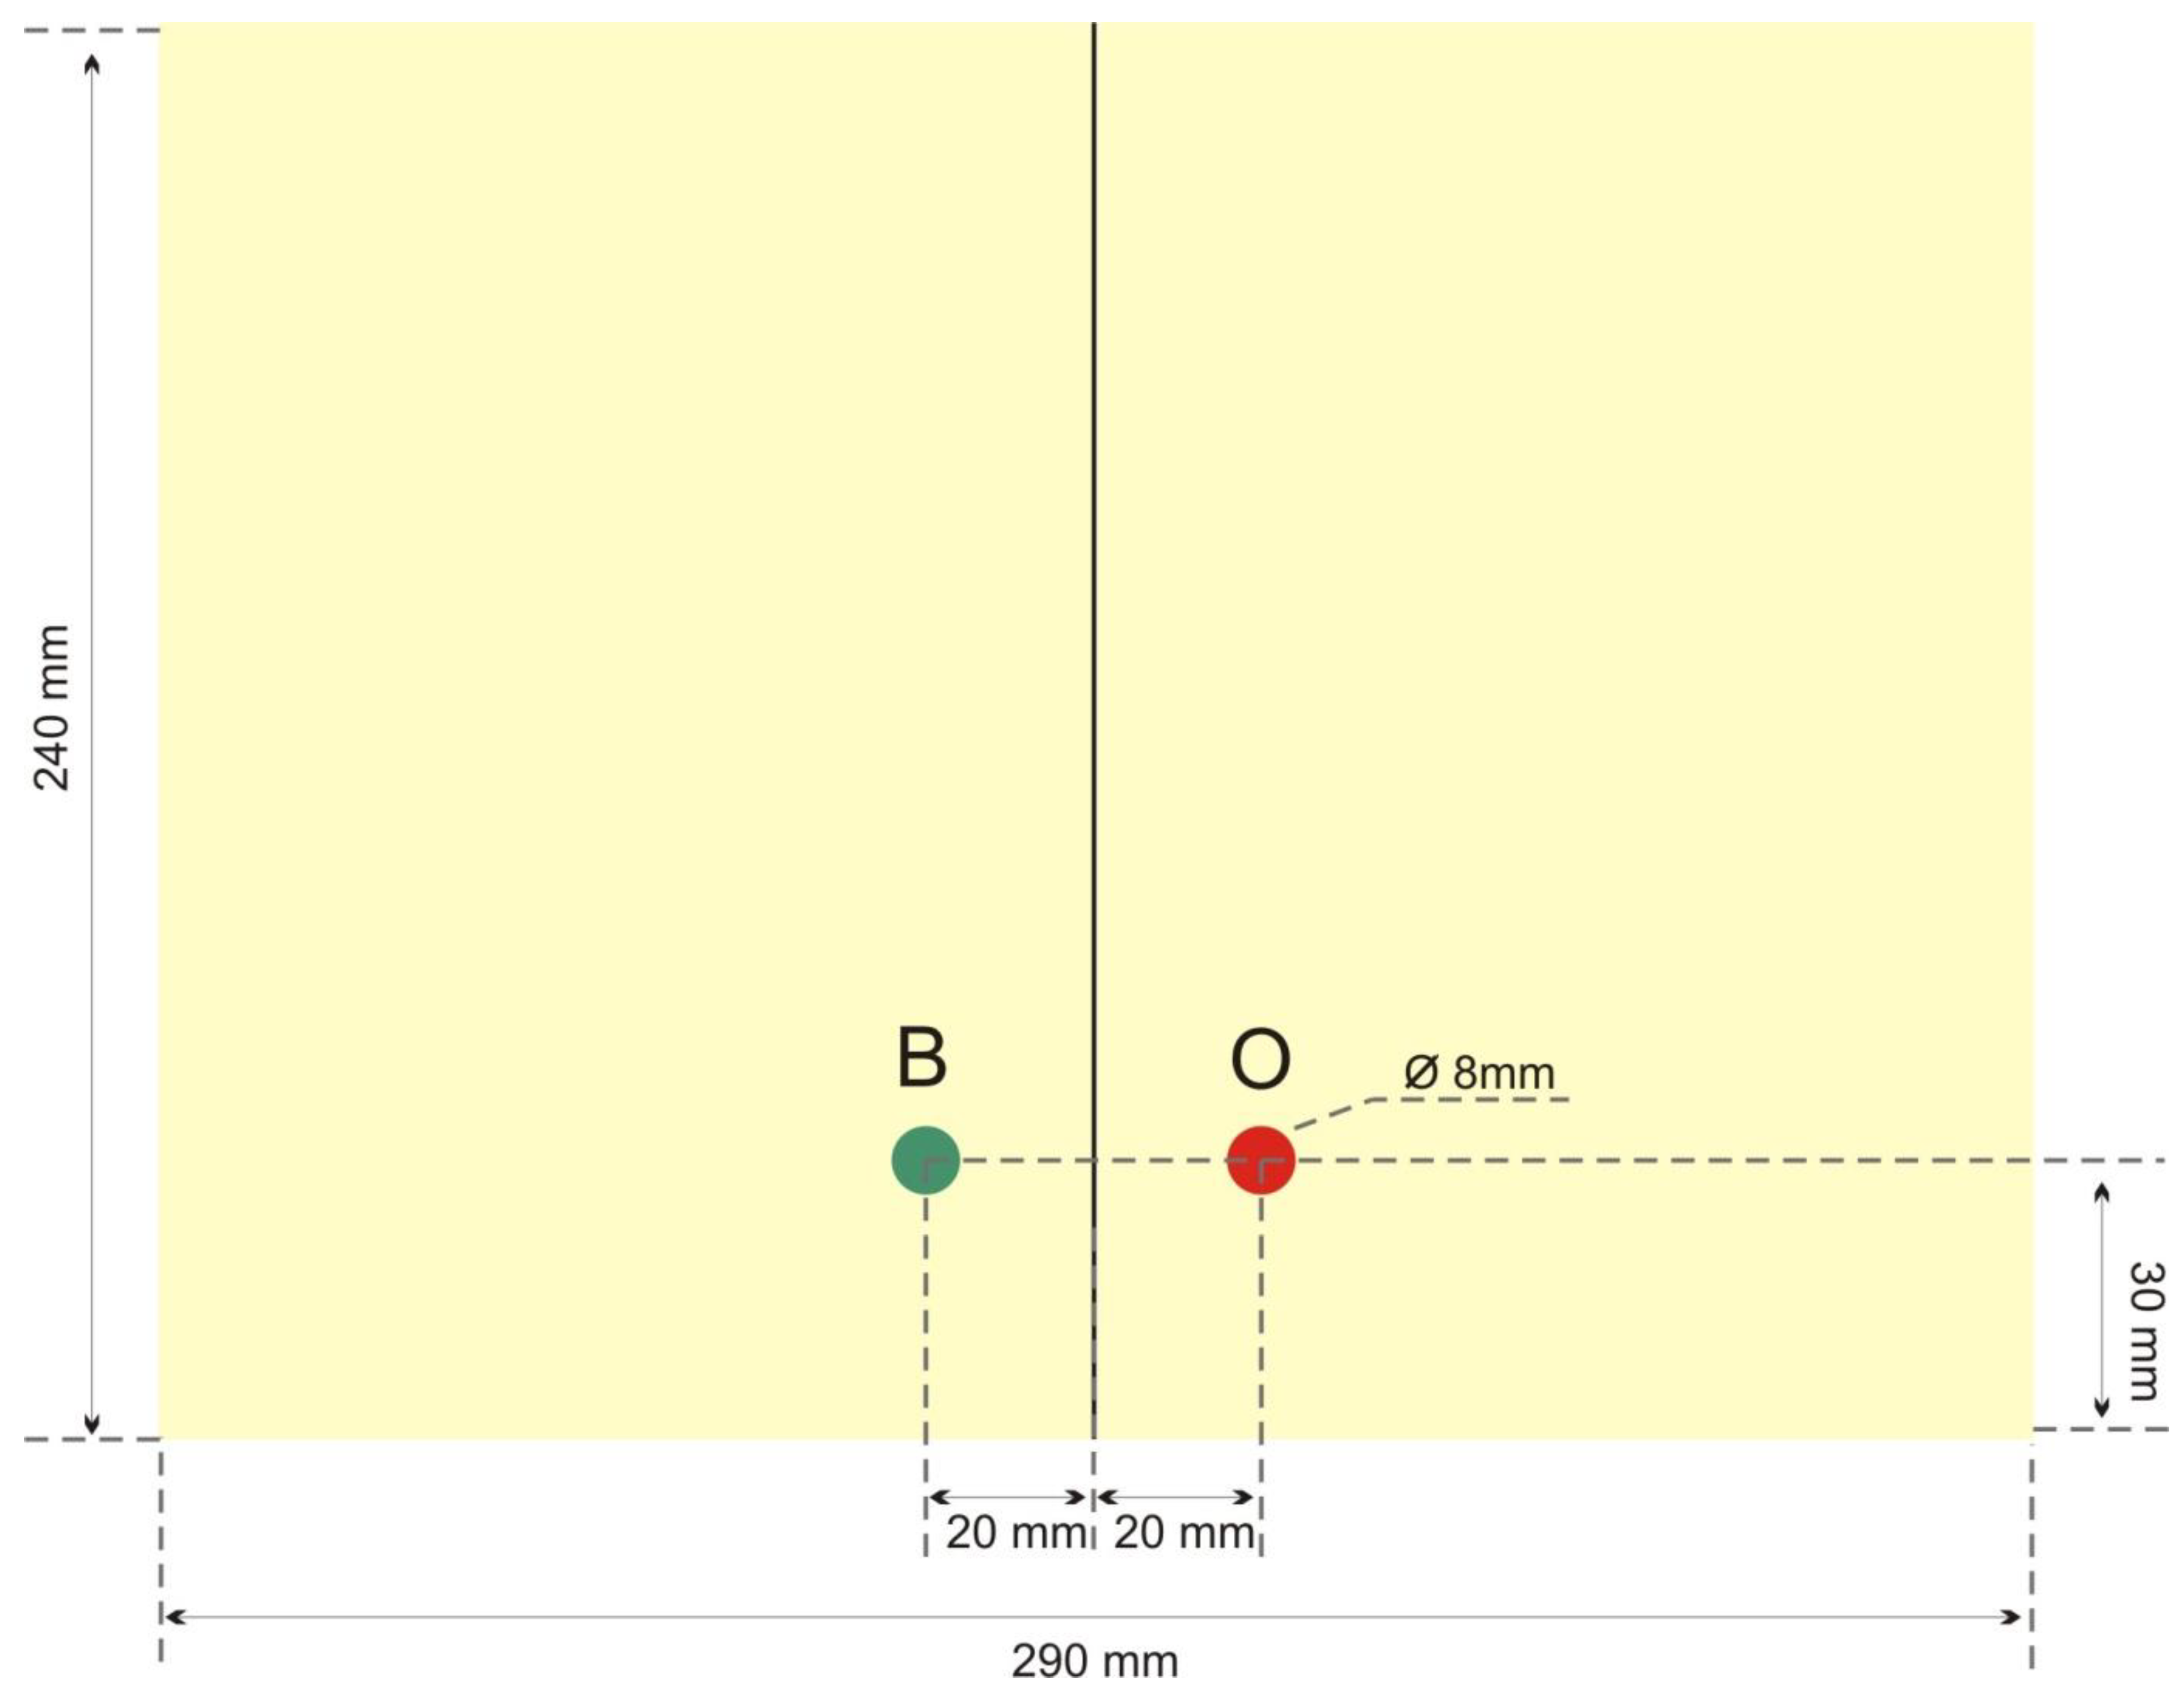
2.1.6. Image Detector
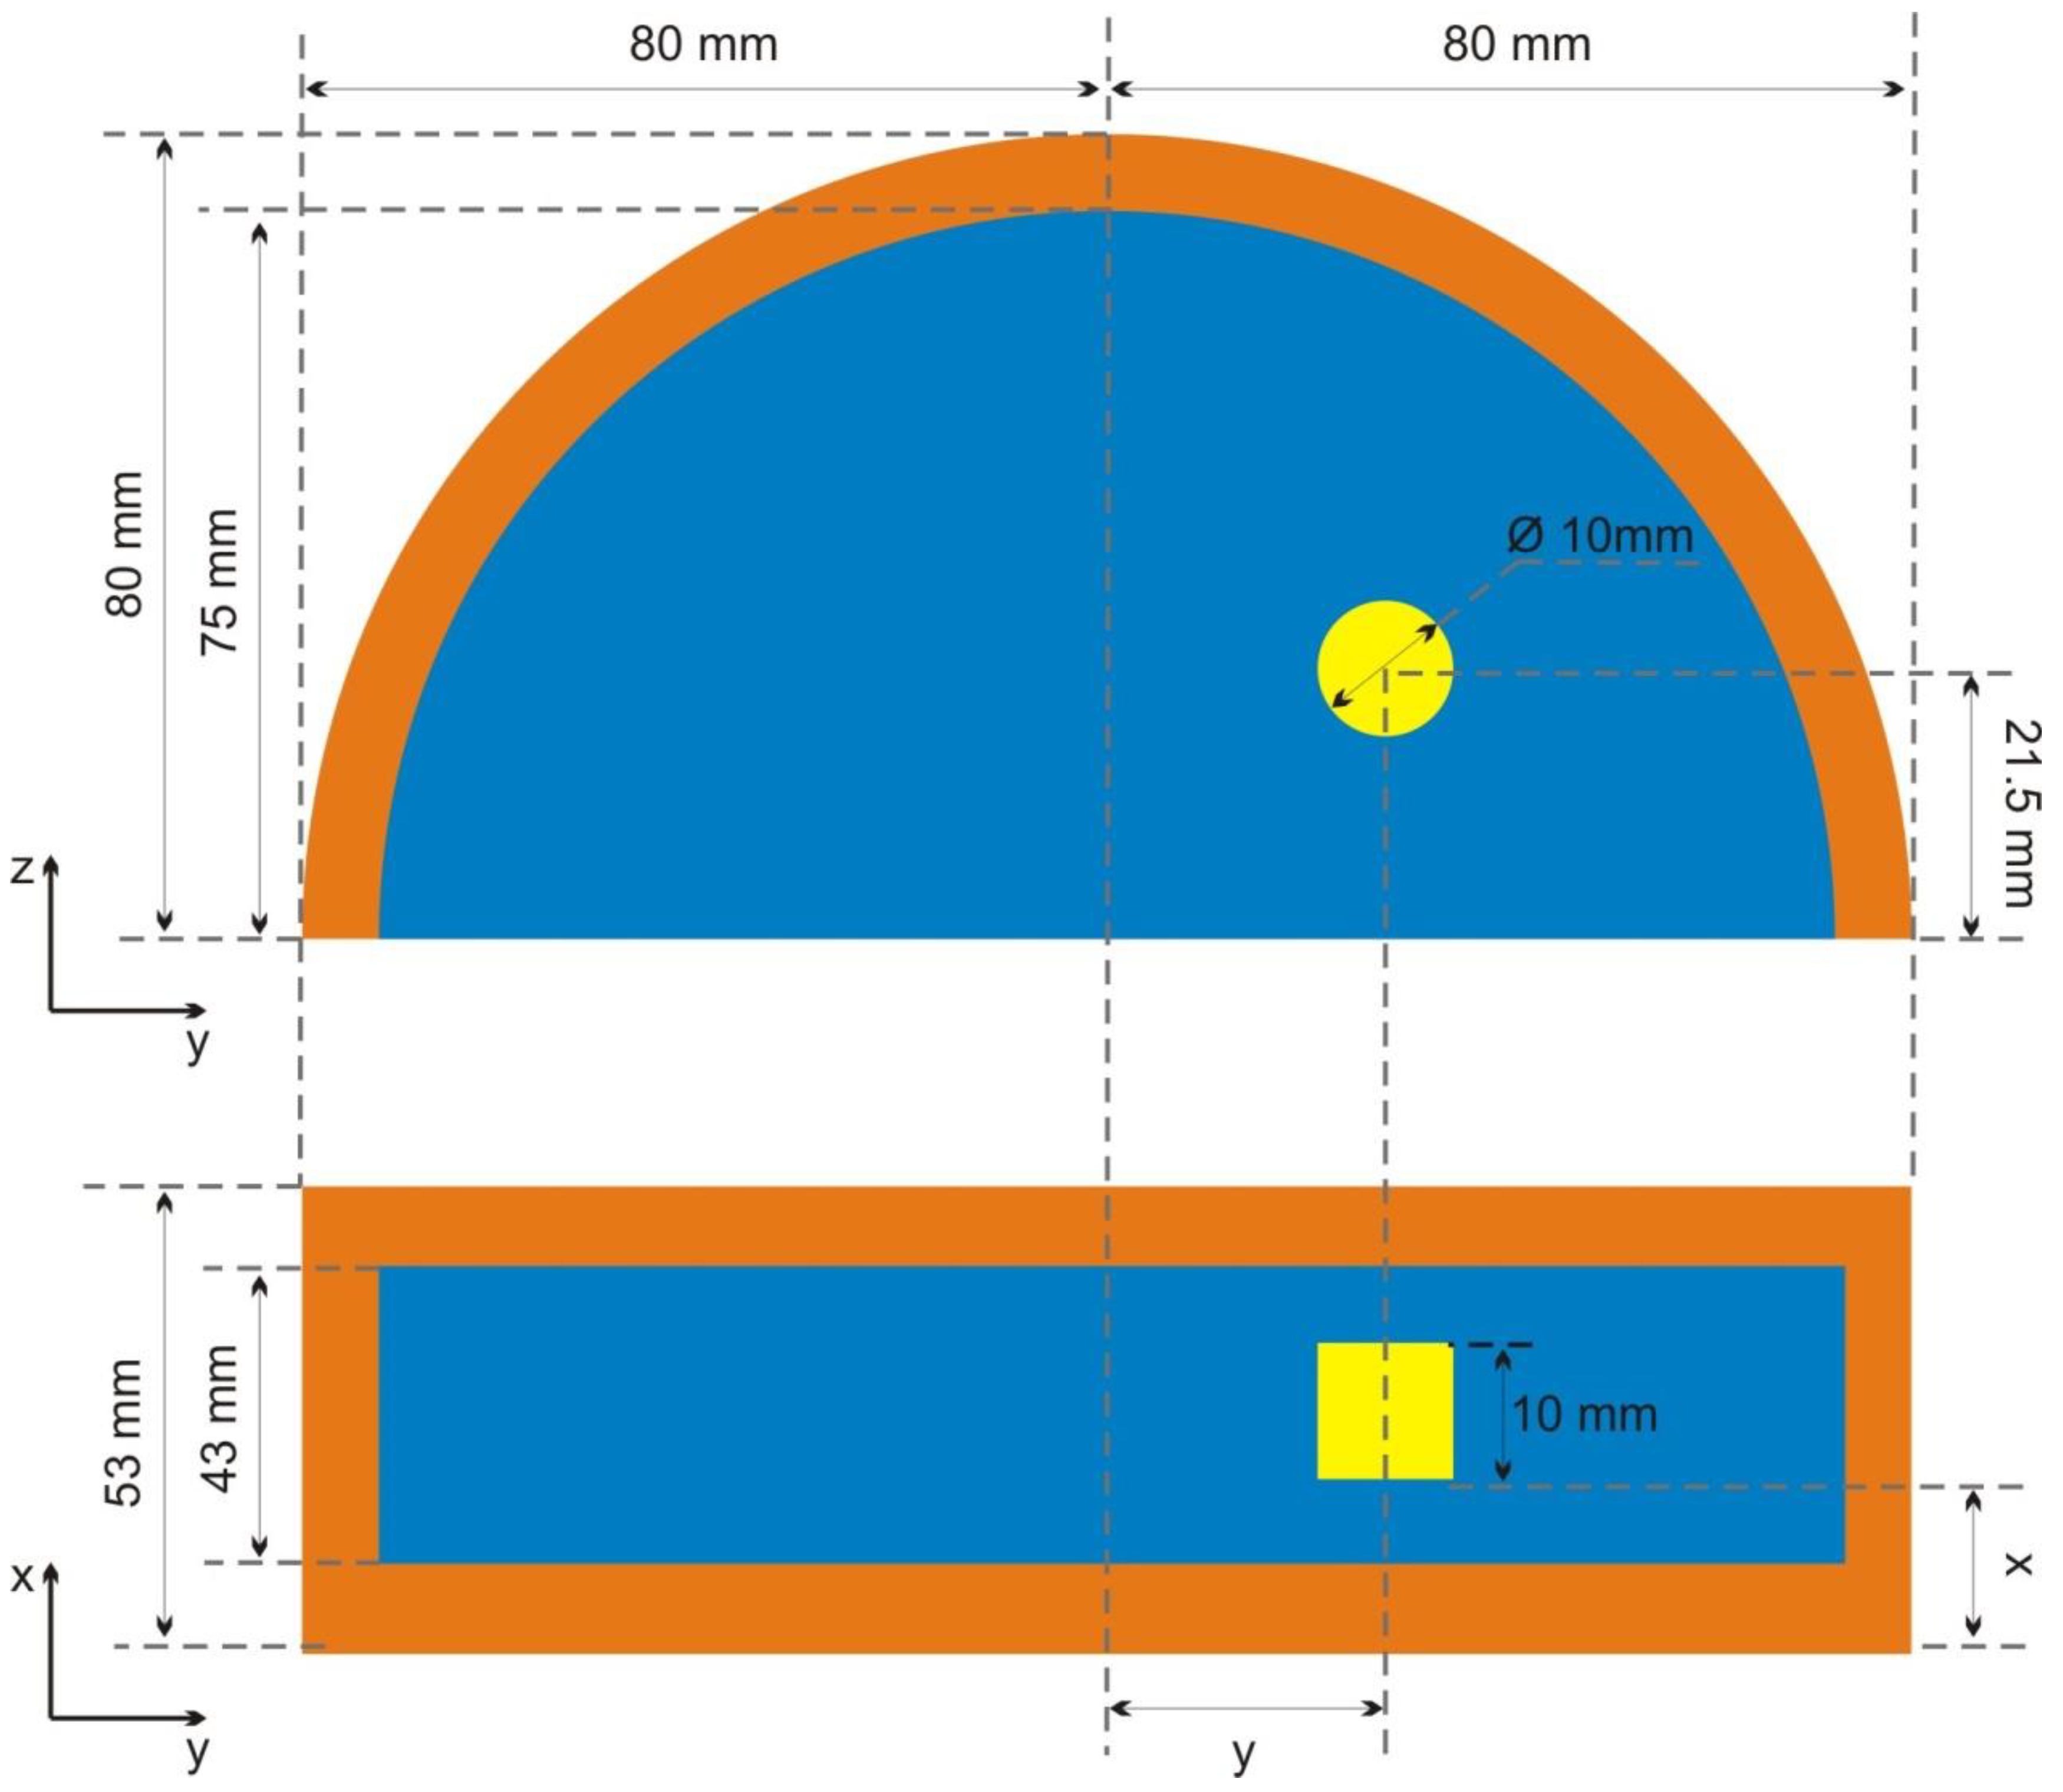
In the modeled system, the selenium image detector (Z = 34, A = 78.96 g/mol, and ρ = 4.79 g/cm3) had the shape of a cuboid with a rectangular base of 24 cm × 29 cm and a height of 250 μm. Two areas in the detector served as logical detectors. Their arrangement is shown in Figure 3. The detector marked with the symbol O was located in the “shadow” of the tumor simulated in the virtual breast model. Detector B was the reference detector. In the simulations, all energy deposits in these logical detectors were recorded. The sum of the energy deposits was a measure of the signal at the logical detector, and the mean square error was a measure of noise.
The Q parameter was used as a measure of the image quality-to-dose ratio and defined as follows:
Q = S D N R 2 D f ,
where Df is the absorbed dose in the inner part of the breast phantom (see Figure 4), and the SDNR parameter is the signal-to-noise ratio, determined according to the following formula:
S D N R = ε B ε O σ b 2 + σ O 2 2 ,
where εB and εO indicate the energy deposited in the logical detector in the background image and the object image, respectively; σb and σO indicate the standard deviations of energy deposits in the logical detector in the background image and the object image, respectively.
Optimization was performed so that high voltage values were searched for a given breast phantom thickness, at which the Q parameter reached its maximum.

2.1.7. Breast Model

A set of six breast phantoms of different thicknesses was used in the simulations. These virtual phantoms enabled a simplified simulation of the anatomical structure of the breast (Figure 4). The phantoms had the shape of a half cylinder with a radius of r = 8 cm. Their structure was similar to that of the model used in computer simulations for dosimetry [24,25,26,27,28,29]. The location of the modeled tumor (cylinder 1 cm in diameter and 1 cm high) depended on the thickness of the phantom. The tumor’s x and y coordinates were determined so that the tumor would be projected onto the highlighted area of the image detector. The coordinates of the center of the simulated tumor are as follows:
x = x d e t S I D ( S T D 0.5 h p )
and
y = y d e t S I D ( S T D 0.5 h p ) ,
where hp is a breast phantom thickness.
The outer part, with a thickness of 5 mm, was made of adipose tissue, and the inner part consisted of a mixture of glandular and adipose tissue in the proportions determined by the level of glandularity (Table 2). The composition of the simulated tissues and the density of adipose tissue (ρa) and glandular tissue (ρg) were determined based on the work of Hammerstein et al. [30]. It was assumed that the neoplastic tissue has the same composition as the glandular tissue, but it is characterized by a higher density (ρt) [31,32]. Detailed data on the elemental composition and tissue density are presented in Table 3.
The density of the tissue mixture in the inner part of the breast phantom was determined using the following equations (according to Boone [25]):
ρ m = ρ a v a + ρ g v g
and
v g = ( 1 g ρ g g ρ a + 1 ) 1 ,
where g is glandularity (mass fraction), vg is the glandular tissue volume, and va is the adipose tissue volume.
The inner part of the phantom was defined as a logical detector to register the dose absorbed in the breast. Using the simulation program, the energy deposited in this area was recorded, and the dose value was then determined. The use of logical detectors was discussed in [34]. The dose recorded in this way was considered equivalent to the average glandular dose. The simulations, in a simplified manner, factored in the effect of radiation scattering through tissues not directly subject to imaging, such as a chest and a compression plate. The chest was defined as a 15 cm × 25 cm × 5 cm cuboid filled with water (ρ = 1.0 g/cm3), adjacent to the edge of the table and the breast phantom. The pressure plate closely adhered to the breast surface, which determined its position in the simulations. The dimensions of the plate were similar to those of the image detector (24 cm × 30 cm). The plate thickness of 2.6 mm corresponded to the thickness of real plates found in digital mammography. It was assumed that the element was made of polycarbonate with a density of ρ = 1.2 g/cm3.

2.2. Experimental Verification of Simulations

This experimental verification was aimed at detecting possible errors in the simulations, i.e., errors in defining the materials, shapes, and sizes of the simulated objects or in the original spectrum of X-rays and other errors at various stages of the simulations. The simulations were verified through a comparison of thicknesses of the half-value layer HVL obtained from the simulations and experiments. Using a Siemens Novation mammography machine (Siemens, Munich, Germany) (serial number 2654, mobile installation at the Maria Skłodowska-Curie National Oncology Institute in Gliwice), equipped with a two-path X-ray tube (Mo and W anode), the thickness of the half-value layer HVL was measured. The experiment was carried out for 3 voltages (24 kV, 28 kV, and 32 kV) and 3 anode–filter combinations (Mo-Mo, Mo-Rh, and W-Rh). Measurement in the narrow beam conditions was made with a Marcus ionization chamber with a volume of 0.055 cm3 (PTW 23343, serial number 2810, PTW, Freiburg, Germany) and a PTW Unidos electrometer (type 10001, serial number 10612, PTW, Freiburg, Germany). The radiation emitted from the X-ray tube was limited by a system of two lead collimators, each 3 mm thick. The first one was 33 cm from the lamp’s focal point, while the second one was 43 cm away. Round holes were placed in collimators with a diameter of 3 cm. Aluminum filters (Gammex 115H, serial number 800051-1809, purity 0.999) were placed between the collimators. An ionization chamber was located below the collimators, 53 cm from the focus. The geometry used in measurements is schematically presented in Figure 5. The thickness of the half-value layer was determined by the logarithmic interpolation method [30] using the following formula:
H V L = X 1 ( 2 R 2 R 0 ) X 2 ( 2 R 1 R 0 ) ln ( R 2 R 1 ) ,
where X1 and X2 indicate the thicknesses of the filters (X1 > X2); R0 is the electrometer reading for exposures without Al filters; R1 and R2 are the electrometer readings for exposures with an additional filter with a thickness of X1 and X2, respectively.

3. Results

3.1. Simulation Verification

The simulations were verified by comparing the measured HVL values with those determined in the simulations. The results of the comparison for the selected tube voltages and anode–filter combinations are presented in Table 4. In the simulations carried out using the GEANT4 code, the range of the secondary radiation is determined by the cut value parameter. In this work, secondary radiation consisted of photons, electrons, and positrons produced as a result of the electromagnetic interactions of X-rays from an X-ray tube. In all the simulations, the cut value parameter was set at 0.001 mm. This value allowed for high accuracy in calculations within a reasonable simulation time.
Based on the results presented in Table 4, it can be inferred that the HVL values determined using the measurement method were consistent with simulation results taking into account the uncertainties.

3.2. Image Quality Optimization

The main simulations to optimize the image quality for the selenium detector were carried out for six phantom thicknesses (32 mm, 45 mm, 53 mm, 60 mm, 75 mm, and 90 mm) and three additional filter options (30 μm Mo, 25 μm Rh, and 50 μm Rh) (see Table 1). The simulations were performed for voltages ranging from 20 kV to 40 kV every 1 kV. The number of simulated primary X-rays emitted for a single simulation ranged from 109 for small phantom thicknesses to 1010 for large phantom thicknesses. To reduce statistical uncertainty, some low-voltage simulations were repeated with a different value of the starting parameter of the pseudorandom number generator. Figure 6 illustrates the Q parameter as a function of the tube voltage for the 75 mm-thick breast and various anode–filter combinations.
Table 5 presents the determined optimal voltages corresponding to the maximum values of the Q parameter (Qmax) for breasts of various structures and thicknesses after the breast compression. The obtained results show that the optimal configuration for a digital mammography machine with a selenium image detector is a tungsten X-ray tube with rhodium filtration (the highest values parameter Qmax). The least preferred system is the Mo-Mo combination, which is routinely used in analog mammography.
The reason for this is that the spectrum of the tungsten X-ray tube exhibited higher energy than that of the X-ray tubes made of the other considered materials. Although the object’s contrast decreased with increasing energy, as the cross-section area for the photoelectric effect decreased, the decrease in object contrast was compensated by the improvement in SNR that occurred for the selenium detector. In the case of analog mammography, this effect cannot be used due to the limited dynamics of the X-ray film. At the same time, amorphous selenium is characterized by a greater cross-section for the absorption of photons with higher energy than the Gd2O2S, which is the material used for reinforcement screens [35].

4. Discussion

The comparison of the Qmax values for the various considered variants revealed that, with the same dose for the patient, the image quality using the W-Rh combination was about 3.5% higher than that of the Mo-Mo system for breasts with a thickness of 32 mm, about 83% higher for 45 mm-thick breasts, and over 2.4 times greater for 90 mm-thick breasts. The tungsten X-ray tube lost its superiority in performance only for the smallest considered breast thickness. In this case, better image quality was obtained with the combination of Rh-Rh and Mo-Rh. However, rhodium X-ray tubes are not used in mammography systems with the type of image detector considered in this study. The advantage of X-ray tubes with a tungsten anode over other solutions was confirmed in the published results of previous experimental studies [12,13] and those using Monte Carlo methods [14,17]. The conclusions regarding the Rh-Rh combination derived from Dance et al. [17] are partially different from those presented in this paper. The authors of this previous study concluded that such a combination is never optimal, which contradicts the results shown in this paper for breasts with a thickness of 32 mm. The significant differences in the used methodology are most likely responsible for the discrepancy between the conclusions of the two studies. Dance et al. performed simulations for breast phantoms with thicknesses of 2 cm, 4 cm, and 6 cm and a granularity of 50%, as well as thicknesses of 8 cm and 10 cm with a granularity of 10%, which, in the light of subsequent reports on the typical structure of the breast [17], is a far-reaching simplification. Moreover, their simulations were performed for a contrasting object of the 5 mm glandular tissue, only for four voltages, but also considered the contrast with microcalcifications. In the present study, the highest values of the Qmax parameter were observed for breasts with thicknesses ranging from 53 mm to 60 mm (25–28 kV). Lower image quality for breasts with smaller dimensions is due to their high glandularity, resulting in a deterioration of the physical contrast. For large breasts (over 60 mm after compression), the increase in tissue volume is not sufficiently compensated by the decreasing content of glandular tissue, and therefore the image quality in this case also decreases. This observed tendency is different from that presented by Bernhardt et al. [14], who revealed that the highest quality of imaging was associated with small breasts with thicknesses of 2 cm to 3 cm. This discrepancy is because Bernhardt et al. adopted a breast model with a constant tissue composition independent of breast thickness.
In modern digital mammography machines, the automatic exposure control (AEC) system is used to select exposure parameters. This selection is most often made based on breast thickness information derived from the position of the compression plate. Some systems additionally assess the absorption properties of tissues during the so-called pre-exposure, in which case the voltage and type of additional filtration are also the factors involved in the selection. Data on the signal level during the exposure are derived from the image detector. When the set signal level is reached, the exposure is interrupted. The end-of-exposure threshold can be adjusted, which has an impact on the image quality and dose to a breast [13,36]. According to the recommendations of the European Guidelines for Quality Assurance in Breast Cancer Screening and Diagnosis (4th Edition) [12,36], the AEC system is calibrated using a PMMA phantom and an aluminum object as the contrast area; however, such a system significantly differs from the real structure of the breast. The data obtained in this study can be used to interpret the settings of AEC systems for a phantom made of PMMA.

5. Conclusions

Based on Monte Carlo simulations, it was shown that the combination of a molybdenum anode and molybdenum filter, which is typically used in analog mammography, performed the worst in terms of the image quality-to-dose ratio, regardless of the breast thickness after compression. Therefore, since all mammography machines with selenium image detectors and Mo anodes can use rhodium filtration, such filtration should be used for each exposure.
The results obtained using Monte Carlo simulations reveal that the combination of a rhodium anode and rhodium filter was a more advantageous solution than the Mo-Rh system, and in the case of breasts with a small thickness (32 mm), the optimal one.
A tungsten X-ray tube with a 50 μm rhodium filter was the optimal solution for the type of digital mammography machine considered in this study. This finding is particularly important for healthcare providers planning to purchase new devices for digital mammography.
Imaging quality assessment was carried out following the European guidelines and should be considered with caution, due to the differences between PMMA phantom breasts and Al objects and the real clinical settings involving breasts with different compositions.

Author Contributions

Methodology, M.S.; Software, M.S. and A.K.; Validation, M.S.; Formal analysis, M.S.; Resources, A.K.; Writing—original draft, A.K.; Writing—review & editing, A.K.; Project administration, M.S. All authors have read and agreed to the published version of the manuscript.

Funding

This research received no external funding.

Institutional Review Board Statement

Not applicable.

Informed Consent Statement

Not applicable.

Data Availability Statement

Conflicts of Interest

The authors declare no conflict of interest.

References

  1. WHO. 2021. Available online: https://www.who.int/news-room/fact-sheets/detail/breast-cancer (accessed on 20 November 2022).
  2. Vogelstein, B.; Papadopoulos, N.; Velculescu, V.E.; Zhou, S.; Diaz, L.A.; Kinzler, K.W. Cancer Genome Landscapes. Science 2013, 339, 1546–1558. [Google Scholar] [CrossRef] [PubMed]
  3. Herrmann, C.; Vounatsou, P.; Thürlimann, B.; Probst-Hensch, N.; Rothermundt, C.; Ess, S. Impact of mammography screening programmes on breast cancer mortality in Switzerland, a country with different regional screening policies. BMJ Open 2018, 8, e017806. [Google Scholar] [CrossRef] [PubMed]
  4. Iwamoto, Y.; Kaucher, S.; Lorenz, E.; Barnighausen, T.; Winkler, V. Development of breast cancer mortalityconsidering the implementation of mammography screening programs-acomparison of western European countries. BMC Public Health 2019, 19, 823. [Google Scholar] [CrossRef] [PubMed] [Green Version]
  5. Berry, D.A.; Cronin, K.A.; Plevritis, S.K.; Fryback, D.G.; Clarke, J.; Zelen, M.; Mandelblatt, J.S.; Yakovlev, A.Y.; Habbema, J.D.F.; Feuer, E.J. Effect of screening and adjuvant therapy on mortality from breast cancer. N. Engl. J. Med. 2005, 353, 1784–1792. [Google Scholar] [CrossRef] [PubMed]
  6. The Swedish Organised Service Screening Evaluation Group. Reduction in breast cancer mortality from organized service screening with mammography: 1. Further confirmation with extended data. Cancer Epidemiol. Biomark. Prev. 2006, 15, 45–51. [Google Scholar] [CrossRef] [Green Version]
  7. Preston, D.L.; Mattsson, A.; Holmberg, E.; Shore, R.; Hildreth, N.G.; Boice, J.D., Jr. Radiation effects on breast cancer risk: A pooled analysis of eight cohorts. Radiat. Res. 2002, 158, 220–235. [Google Scholar] [CrossRef]
  8. Pauwels, E.K.; Foray, N. Bourguignon MH. Breast cancer induced by X-ray mammography screening? A review based on recent understanding of low-dose radiobiology. Med. Princ. Pract. 2016, 25, 101–109. [Google Scholar] [CrossRef]
  9. Zewde, N.; Ria, F.; Rehani, M.M. Organ doses and cancer risk assessment in patients exposed to high doses from recurrent CT exams. Eur. J. Radiol. 2022, 149, 110224. [Google Scholar] [CrossRef]
  10. International Atomic Energy Agency, IAEA. Human Health Series 17. Quality Assurance Programme for Digital Mammography, Vienna. 2011. Available online: https://www.iaea.org/publications/8560/quality-assurance-programme-for-digital-mammography (accessed on 1 November 2022).
  11. Dalmazo, J.; Elias, J.J.; Brocchi, M.A.C. Radiation dose optimization in routine computed tomography: A study of feasibility in a University Hospital. Radiol. Bras. 2010, 43, 241–248. [Google Scholar] [CrossRef] [Green Version]
  12. Oduko, J.M.; Young, K.C.; Burch, A.; Castellano, E.; Kulama, E.; Lawinski, C.; Marshall, N. Review of Measurements on Full Field Digital Mammography Systems—NHSBSP Equipment Report 0901; NHS Cancer Screening Programmes: London, UK, 2009. [Google Scholar]
  13. Young, K.C.; Oduko, J.M.; Woolley, L. Technical Evaluation of the Hologic Selenia Full Field Digital Mammography System—NHSBSP Equipment Report 0701; NHS Cancer Screening Programmes: London, UK, 2007. [Google Scholar]
  14. Bernhardt, P.; Mertelmeier, T.; Hoheisel, M. X-ray spectrum optimization of full-field digital mammography: Simulation and phantom study. Med. Phys. 2010, 33, 4337–4349. [Google Scholar] [CrossRef]
  15. Hoye, J.; Sharma, S.; Zhang, Y.; Fu, W.; Ria, F.; Kapadia, A.; Segars, W.P.; Wilson, J.; Samei, E. Organ doses from CT localizer radiographs: Development, validation, and application of a Monte Carlo estimation technique. Med. Phys. 2019, 46, 5262–5272. [Google Scholar] [CrossRef]
  16. Dance, D.R.; Thilander, A.K.; Sandborg, M.; Skinner, C.L.; Castellano, I.A.; Carlsson, G.A. Infuence of anode/filter material and tube potential on contrast, signal-to-noise ratio and average absorbed dose in mammography: A Monte Carlo study. Br. J. Radiol. 2000, 73, 1056–1067. [Google Scholar] [CrossRef] [PubMed]
  17. Villarreal, O.A.M.; Velasco, F.G.; Fausto, A.M.F.; Milian, F.M.; Mol, A.W.; Capizzi, K.R.; Ambrosio, P. Optimization of the exposure parameters in digital mammography for diverse glandularities using the contrast-detail metric. Phys. Med. 2022, 101, 112–119. [Google Scholar] [CrossRef]
  18. Yaffe, M.J.; Boone, J.M.; Packard, N.; Alonzo-Proulx, O.; Huang, S.Y.; Peressotti, C.L.; Al-Mayah, A.; Brock, K. The myth of the 50-50 breast. Med. Phys. 2009, 36, 5437–5443. [Google Scholar] [CrossRef] [PubMed]
  19. Cullen, D.E. EPICS2014: Electron Photon Interaction Cross Sections; Documentation Series of the IAEA Nuclear Data Section; The Nuclear Energy Agency: Paris, France, 2015. [Google Scholar]
  20. Lechner, A.; Ivanchenko, V.N.; Knobloch, J. Validation of recent Geant4 physics models for application in carbon ion therapy. Nucl. Instrum. Methods B 2010, 268, 2343–2354. [Google Scholar] [CrossRef]
  21. Cirrone, G.A.P.; Cuttone, G.; Di Rosa, F.; Pandola, L.; Romano, F.; Zhang, Q. Validation of the Geant4 electromagnetic photon cross sections for elements and compounds. Nucl. Instrum. Methods Phys. Res. A 2010, 618, 315–322. [Google Scholar]
  22. Kadri, O.; Ivanchenko, V.N.; Gharbi, F.; Trabelsi, A. GEANT4 simulation of electron energy deposition in extended media. Nucl. Instrum. Methods Phys. Res. B 2007, 258, 381–387. [Google Scholar]
  23. Boone, J.M.; Fewell, T.R.; Jennings, R.J. Molybdenium, rhodium andtungsten anode spectral models using interpolationg polynomials with application to mammography. Med. Phys. 1997, 24, 1863–1874. [Google Scholar] [CrossRef]
  24. Dance, D.R. Monte Carlo calculation of conversion factors for the estimation of mean glandular breast dose. Phys. Med. Biol. 1990, 35, 1211–1219. [Google Scholar] [CrossRef]
  25. Dance, D.R.; Skinner, C.L.; Young, K.C.; Beckett, J.R.; Kotre, C.J. Additional factors for the estimation of mean glandular breast dose using the UK mammography dosimetry protocol. Phys. Med. Biol. 2000, 45, 3225–3240. [Google Scholar] [CrossRef]
  26. Dance, D.R.; Young, K.C.; van Engen, R.E. Further factors for the estimation of mean glandular dose using the United Kingdom, European and IAEA breast dosimetry protocols. Phys. Med. Biol. 2009, 54, 4361–4372. [Google Scholar] [CrossRef] [PubMed]
  27. Jansen, J.T.; Veldkamp, W.J.; Thijssen, M.A.; van Woudenberg, S.; Zoetelief, J. Method for determination of the mean fraction of glandular tissue in individual female breasts using mammography. Phys. Med. Biol. 2005, 50, 5953–5967. [Google Scholar] [CrossRef] [PubMed]
  28. Boone, J.M. Glandular breast dose for monoenergetic and high-energy X-raybeams: Monte Carlo assessment. Radiology 1999, 213, 23–37. [Google Scholar] [CrossRef] [PubMed]
  29. Sarno, A.; Mettivier, G.; Di Lillo, F.; Bliznakova, K.; Sechopoulos, I.; Russo, P. Homogeneous vs. patient specific breast models for Monte Carlo evaluation of mean glandular dose in mammography. Phys. Med. 2018, 51, 56–63. [Google Scholar] [CrossRef] [PubMed] [Green Version]
  30. Hammerstein, G.R.; Miller, D.W.; White, D.R.; Masterson, M.E.; Woodard, H.Q.; Laughlin, J.S. Absorbed radiation dose in mammography. Radiology 1979, 130, 485–491. [Google Scholar] [CrossRef] [PubMed]
  31. Johns, P.C.; Yaffe, M.J. X-ray characterization of normal and neoplastic breast tissues. Phys. Med. Biol. 1987, 32, 675–695. [Google Scholar] [CrossRef] [PubMed]
  32. Ullman, G.; Sandborg, M.; Hunt, R.; Dance, D.R.; Carlsson, G.A. Implementation of Pathologies in the Monte Carlo Model in Chest and Breast Imaging; Report 94; Institutionen för Radiologi, Universitetet in Linköping: Linköping, Sweden, 2003; pp. 1–12. [Google Scholar]
  33. Perry, N.; Broeders, M.; de Wolf, C.; Törnberg, S.; Holland, R.; von Karsa, L. European Guidelines for Quality Assurance in Breast Cancer Screening and Diagnosis, 4th ed.; Office for Official Publications of the European Communities: Luxembourg, 2006. [Google Scholar]
  34. Pietrzak, R.; Konefał, A.; Sokół, M.; Orlef, A. Comparison of depth-dose distributions of proton therapeutic beams calculated by means of logical detectors and ionization chamber modeled in Monte Carlo codes. Nucl. Instrum. Methods Phys. Res. A 2016, 826, 55–59. [Google Scholar] [CrossRef]
  35. Yaffe, M.J.; Rowlands, J.A. X-ray detectors for digital radiography. Phys. Med. Biol. 1997, 42, 1. [Google Scholar] [CrossRef] [PubMed]
  36. Pruszyński, B. Diagnostic Imaging—Theoretical Basis and Research Methodology; Wydawnictwo Lekarskie PZWL: Warsaw, Poland, 2007. (In Polish) [Google Scholar]
Figure 1. The scheme of simulated system.
Applsci 13 00171 g001
Figure 2. Sample spectrum used in simulations, generated for a molybdenum anode at a voltage of 28 kV. The Kα1 and Kβ1 emission lines are visible. Φ, photon fluence; E, energy of photons.
Applsci 13 00171 g002
Figure 3. Image detector model, top view. The logical detector under the tumor (O) is marked in red. The logical detector, which was the reference one and located in the background radiation area (B) during the measurement, is marked in green.
Applsci 13 00171 g003
Figure 4. The virtual breast phantom model with a thickness hp of 53 mm. Visible external (orange) and internal (blue) parts, as well as an element imitating a cancerous tumor (yellow), are shown.
Applsci 13 00171 g004
Figure 5. Scheme of the system for the HVL measurement. An analogous system was simulated to verify the simulation through comparison of the HVL values measured and those determined in simulations.
Applsci 13 00171 g005
Figure 6. Q parameter as a function of high voltage for the 75 mm-thick breast and various anode–filter combinations. The points from the simulation are connected with a line.
Applsci 13 00171 g006
Table 1. Simulated combinations of the anode material and the secondary filtration.
Anode MaterialSecondary Filter Material and Thickness
MoMo 25 μm
MoRh 25 μm
RhRh 50 μm
WRh 50 μm
Table 2. Typical values of glandularity corresponding to breasts of a given thickness after compression according to the European Guidelines for Quality Assurance in Breast Cancer Screening and Diagnosis (4th Edition) [33].
Thickness of Breast (mm)Glandularity (%)
3267
4541
5329
6020
759
904
Table 3. Elemental composition of simulated tissues. The values in the table show the mass fraction of the elements.
ElementAdipose Tissue
ρa = 0.93 g/cm3
Glandular Tissue
ρg = 1.04 g/cm3
Cancerous Tissue
ρt = 1.058 g/cm3
H0.1120.1020.102
C0.6190.1840.184
N0.0170.0320.032
O0.2510.6770.677
S0.000250.001250.00125
P0.000250.001250.00125
K0.000250.001250.00125
Ca0.000250.001250.00125
Table 4. Determined thicknesses of the Al half-value layer; Δ, the expanded uncertainty of measurement/simulation for the 95% confidence level.
Anode–FilterMo-RhMo-Mo W-Rh
Voltage (kV)242832242832242832
measurements
HVL (mm)0.3150.3720.4050.2680.3110.3510.4560.5150.549
Δ (mm)0.0220.0210.0270.0190.0230.0190.0220.0310.026
simulations
HVL (mm)0.3240.3400.3720.2570.3110.3370.4330.4940.572
Δ (mm)0.0150.0140.0180.0100.0100.0150.0130.0400.009
Table 5. Optimal voltages on the X-ray tube in kV for breasts of various structures and the corresponding Qmax (maximum values of parameter Q) for the selenium image detector.
Thickness of Phantom
32 mm45 mm53 mm60 mm75 mm90 mm
Phantom glandularity
67%41%29%20%9%4%
Mo-Movoltage24 kV25 kV25 kV28 kV27 kV29 kV
Qmax0.9911.9592.0291.1711.3121.313
Mo-Rhvoltage24 kV25 kV26 kV27 kV28 kV28 kV
Qmax1.2782.0842.1032.1311.5031.889
Rh-Rhvoltage25 kV25 kV26 kV26 kV27 kV28 kV
Qmax1.9572.2732.4712.4761.8322.150
W-Rhvoltage24 kV25 kV26 kV28 kV28 kV30 kV
Qmax1.0263.5895.3742.9652.1093.200
Disclaimer/Publisher’s Note: The statements, opinions and data contained in all publications are solely those of the individual author(s) and contributor(s) and not of MDPI and/or the editor(s). MDPI and/or the editor(s) disclaim responsibility for any injury to people or property resulting from any ideas, methods, instructions or products referred to in the content.

