Communication

Planar Laser Induced Fluorescence of OH for Thermometry in a Flow Field Based on Two Temperature Point Calibration Method

1
State Key Laboratory of Multiphase Flow in Power Engineering, Xi’an Jiaotong University, Xi’an 710049, China
2
State Key Laboratory of Laser Interaction with Matter, Northwest Institute of Nuclear Technology, Xi’an 710028, China
3
Shanghai Jiao Tong University Sichuan Research Institute, Chengdu 610200, China
*
Authors to whom correspondence should be addressed.
Appl. Sci. 2023, 13(1), 176; https://doi.org/10.3390/app13010176
Submission received: 24 October 2022 / Revised: 12 December 2022 / Accepted: 16 December 2022 / Published: 23 December 2022
(This article belongs to the Section Energy Science and Technology)

Abstract

:
In view of the uncertainty in the calibration process of two-color plane laser-induced fluorescence (PLIF) temperature measurement, a new calibration method is proposed, in which the influence of fluorescence yield is considered. The calibration process was carried out at high and low temperature region, respectively. Then, the bias of thermometry results origin from quenching is restrained. This new calibration method is validated in a jet flame with temperature range of 1300–1800 K. Here, the temperature results from Coherent Anti-Stokes Raman scattering (CARS), single-point calibrated PLIF, and two-point calibrated PLIF are all acquired with the maximum standard errors of 13 K, 36 K, and 37 K, respectively. The temperature deviation between the average results from PLIF and Coherent Anti-Stokes Raman scattering (CARS) is 120 K and 10 K, when the two-point and one-point calibration methods are used. Therefore, the two-point calibrated PLIF is preferred in the combustion field, especially with a large temperature range and strong quenching coefficient.

1. Introduction

Temperature is one of the key parameters in the combustion process. It is important to understand the energy release rate and pollution formation during the combustion process. Many techniques for temperature measurement have been developed so far, but laser-based methods have been developed more rapidly because of their advantages of non-interference and high spatial and time resolution [1,2]. In many optical thermometry techniques, CARS technology has the characteristics of strong anti-interference ability and high precision, but it is more applied to single point measurement [3,4]. The Rayleigh scattering temperature measurement technique can achieve good results only if the Rayleigh scattering cross-section has little change in the flow field [5,6]. PLIF is preferred for two-dimensional temperature measurements with high spatial resolution [7,8,9,10]. Among the various molecular used in PLIF measurements, OH is one of the ideal targets, and the OH-PLIF thermometry method is more widely used [11,12,13,14,15]. The absorption wavelength, fluorescence emission wavelength, energy level distribution, and the quenching intensity of different energy levels of OH is described in detail [16,17,18], which provides the basic parameters for the measurement of OH fluorescence. Generally, a two-color PLIF measurement system is calibrated using only one point, and then the two-dimensional temperature distribution of the flow field can be obtained [19,20]. It is assumed that the ratio of fluorescence yields from two different transition lines at different temperatures remains the same [12,13]. In practical application, the fluorescence yield of those two transitions has a different response to temperature, and the temperature result is different under different calibration conditions [21,22]. Therefore, a correction of the fluorescence yield is needed in the calibration model to resolve this problem. By two points calibrating at both high and low temperature region, an intrinsic calibration coefficient can be obtained, and the application scope of the calibration coefficient is improved.
In a word, in PLIF temperature measurement, the single point calibration is relatively simple, and more suitable for the measurement in combustion with a small temperature range and low quenching effect. The two-point method requires two calibration points at high and low temperature, respectively. Although the two-point calibration increases the workload to some extent, the accuracy of temperature measurement is higher. Thus, the two-point calibration method is suitable for measuring in the flow field with a wide temperature range and strong quenching effect.

2. Principles of PLIF Thermometry

OH is usually in the thermal equilibrium state in a typical combustion environment, and the ground state energy-level distribution is subject to the Boltzmann distribution determined by temperature. Then the temperature of the flow field can be retrieved from the distribution of ground state energy-level. Generally there are two mechanisms used for PLIF thermometry: multi-line fitting and double-line calibration. The multi-line PLIF method can obtain temperature directly by Boltzmann fitting without additional calibration [10,11], but the wavelength tuning process is time-consuming and only suitable for steady-state flow field. In transient process, the two color PLIF is preferred, in which two rotational energy levels with different temperature responses are used [12,13]. In the short period between the two PLIF systems, the change of total particle number is ignored, and the temperature is obtained from the ratio of fluorescence intensity. Due to the influence of temperature and flow components on the transition process, the change in the fluorescence efficiency must be considered, especially in the flow field where the flow parameter varies widely. There have been two typical methods of eliminating the interference of fluorescence quenching. Cattolica excites different ground level to the Co-upper energy level and carries on the broadband measurement [12], which effectively eliminates the interference of fluorescence absorption and fluorescence quenching to the double-line temperature measurement, but the difference of ground state energy level is limited when the Co-upper energy level is excited, and the sensitivity range of this method is limited to the low temperature area of combustion field. Devillers discusses in detail the selection of excitation line and single point calibration method of double-line PLIF temperature measurement [19]. By comparing the results of temperature measurement of different excitation lines, the excitation line with less interference by quenching is obtained, but the selection result is limited to a certain parameter flow field.
In the high temperature region of the combustion flow field, the fluorescence efficiency changes relatively little with the temperature, especially when the calibration environment is similar to the measured flow field. The ratio of fluorescence can be shown as Formula (1):
R ( T ) = ( I B ϕ η ) i ( I B ϕ η ) j 2 J i + 1 2 J j + 1 exp ( E i E j k T ) = C exp ( Δ E i j k T )
I is the energy of the excitation laser, B is the absorption coefficient of the transition level, ϕ is the transition probability or the fluorescence yield of the excited states, η is the efficiency of the measurement system, J is the rotational quantum number of the energy states, E is the energy of the corresponding energy level, and k is the Boltzmann constant. Among them,
C = ( I B ϕ η ) i ( I B ϕ η ) j 2 J i + 1 2 J j + 1
the C is usually acquired from calibration. The fluorescence intensity ratio is R 0 in a flame at temperature T 0 , which is similar to that of the measurement object’s state. The calibration parameter can be written as
C = R 0 exp ( Δ E i j / k T 0 )
Then the temperature of the flow field to be measured can be obtained from the intensity ratio and calibration coefficient C
T = Δ E i j k ln ( C / R )
However, when the temperature of the flow field changes in a large range, the variation of the fluorescence efficiency cannot be ignored. If the single point calibration method is used, the temperature results will deviate from the actual temperature at a region quite different from the calibrated temperature. Then
R ( T ) = ( I B η ) i ( I B η ) j 2 J i + 1 2 J j + 1 ϕ i ( T ) ϕ j ( T ) exp ( E i E j k T )
According to the empirical formula of quenching strength and the fluorescence yield [17,18],
ϕ J = A J A J + Q J
Q ( J ) = Q 0 exp [ J ( J + 1 ) ( a + b T ) ]
where A J is the emission coefficient, and Q 0 is the quenching rate corresponding to the lowest rotation level and parameters a and b for different colliders. Then the correct coefficient of fluorescence yield is introduced into the formula of fluorescence measurement, and the formula is reduced to the following form
R ( T ) = S f i S f j = A exp ( B Δ E i j k T )
A and B coefficients can be obtained when two temperature points are selected for calibration. To verify the effectiveness of two-point calibration scheme, two-color PLIF was carried out in a jet flame, and the CARS thermometry results in the jet were used both for calibration and contrast.

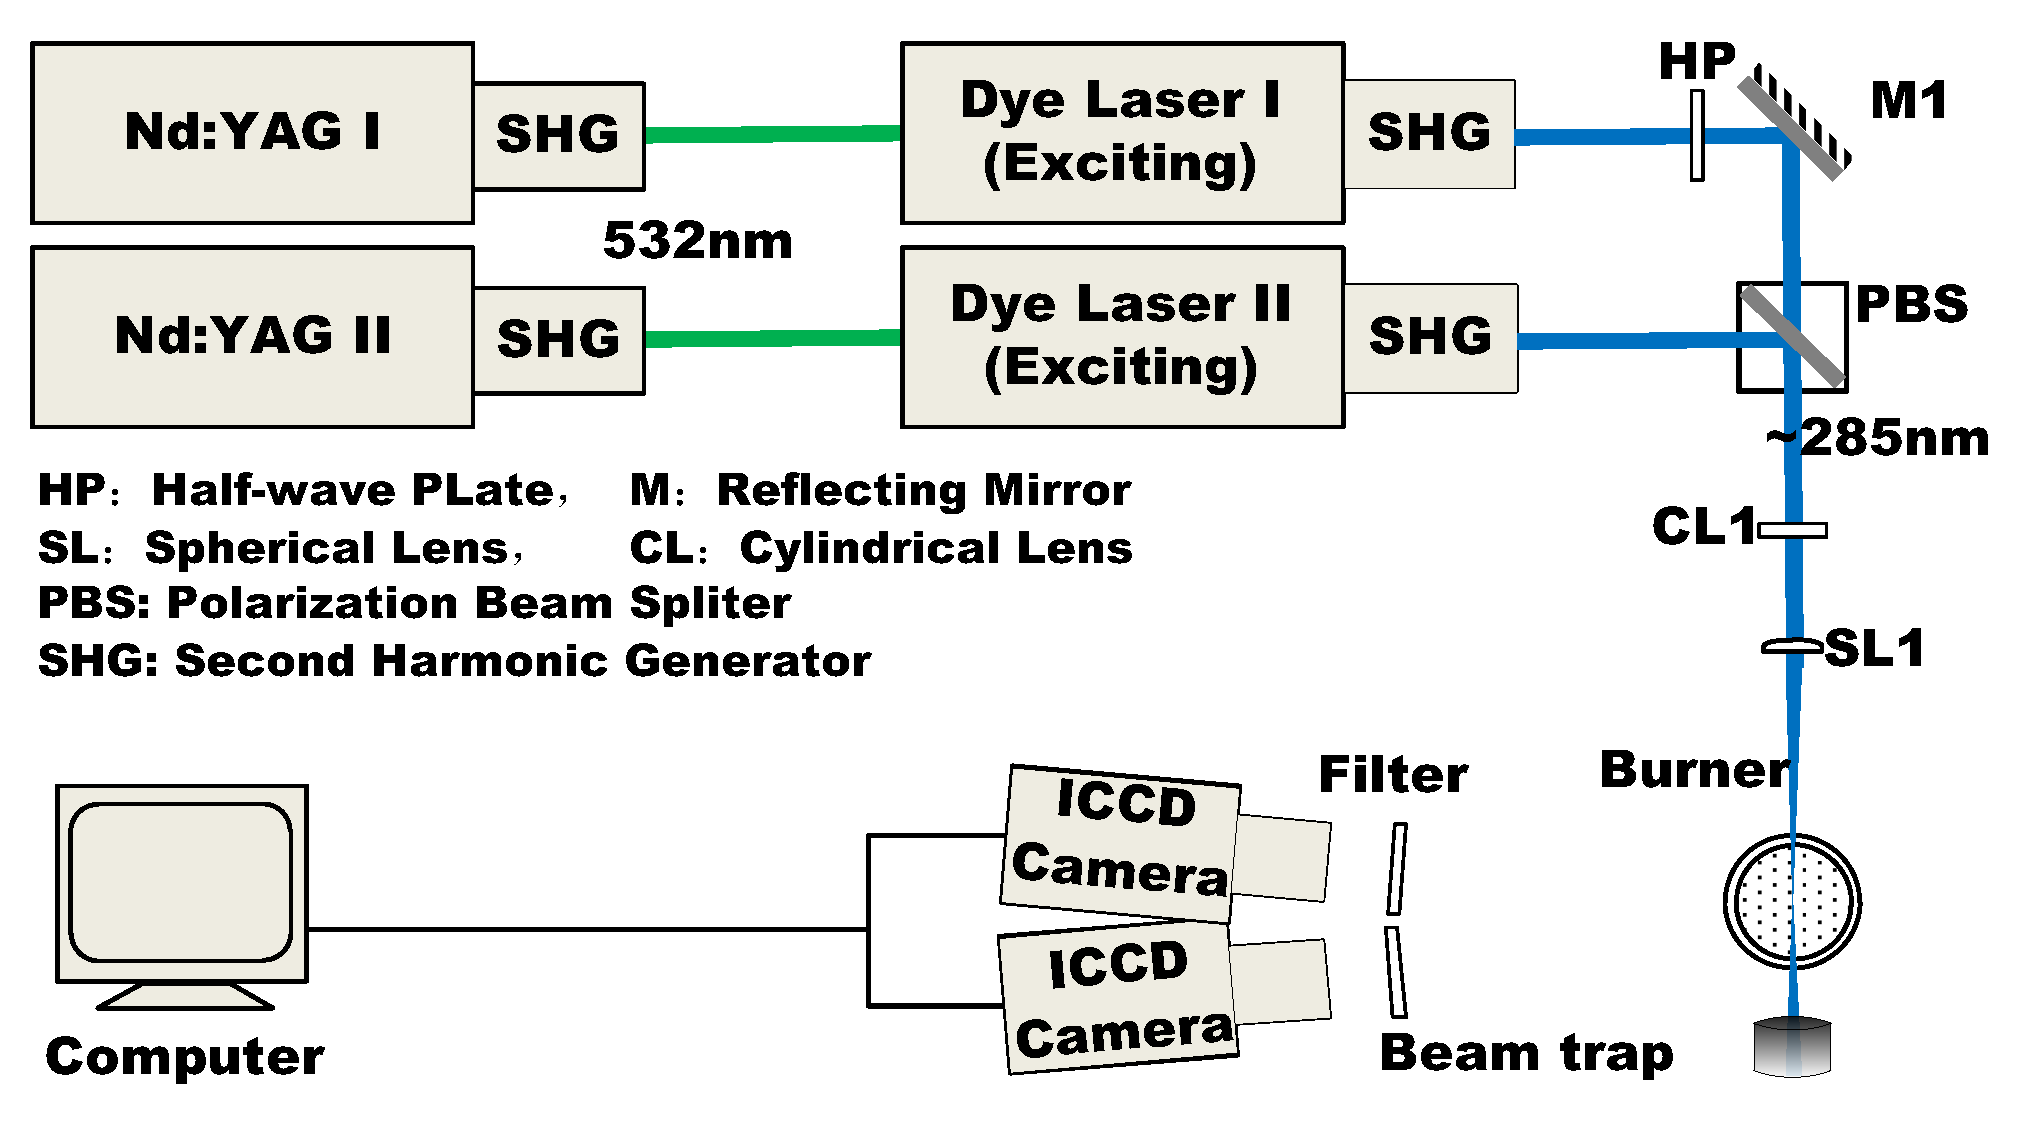
3. Experimental Setting

The jet flame produced in a horizontal furnace with a hole was used as the experimental object. As shown in Figure 1, the diameter of the hole is 9 mm, and the nozzle diameter is 2 mm. Both the wake flame and the jet flame use CH4 as the fuel, and the ratio of CH4 and air is set to stoichiometric ratio. The central hole produces jet flame, the velocity of flow is about 50 m/s, and the temperature is 1000–1900 K at different heights. Its overall structure and the flame self-luminescence photograph are shown below.
As shown in Figure 2, the PLIF system use frequency doubled dye laser to excite the Q2(11) (285.073 nm) and P1(7) (285.004 nm) transitions [13,19] in the A2Σ+(v′ = 1) ← X2Π(v″ = 0) band of OH. Both laser beams were expanded into 50 mm × 0.5 mm laser sheets with energies of 100–200 μJ/mm2 in each sheet and 100 ns apart. The resulting broadband fluorescence at 310 nm was detected by two identical image enhancement cameras (ICCD) located perpendicular to the flow facility. An FF-01-320 (40 nm) interference filter is used to deny the stray signal. Each camera system integrated the fluorescence signal induced from only one of the lasers. The view field of the two cameras was carefully adjusted such that pixel-to-pixel alignment errors were less than 1 pixel (100 μm). Then the fluorescence images were 100 frames averaged and corrected for dark and background signal.
To achieve thermometry calibration and comparison of temperature results, a N2-CARS system is used. The typical CARS experimental facility in the calibrated combustion furnace is shown in Figure 3. The thermometry uncertainty of CARS is better than 3% in the range of 1100–2100 K [23].

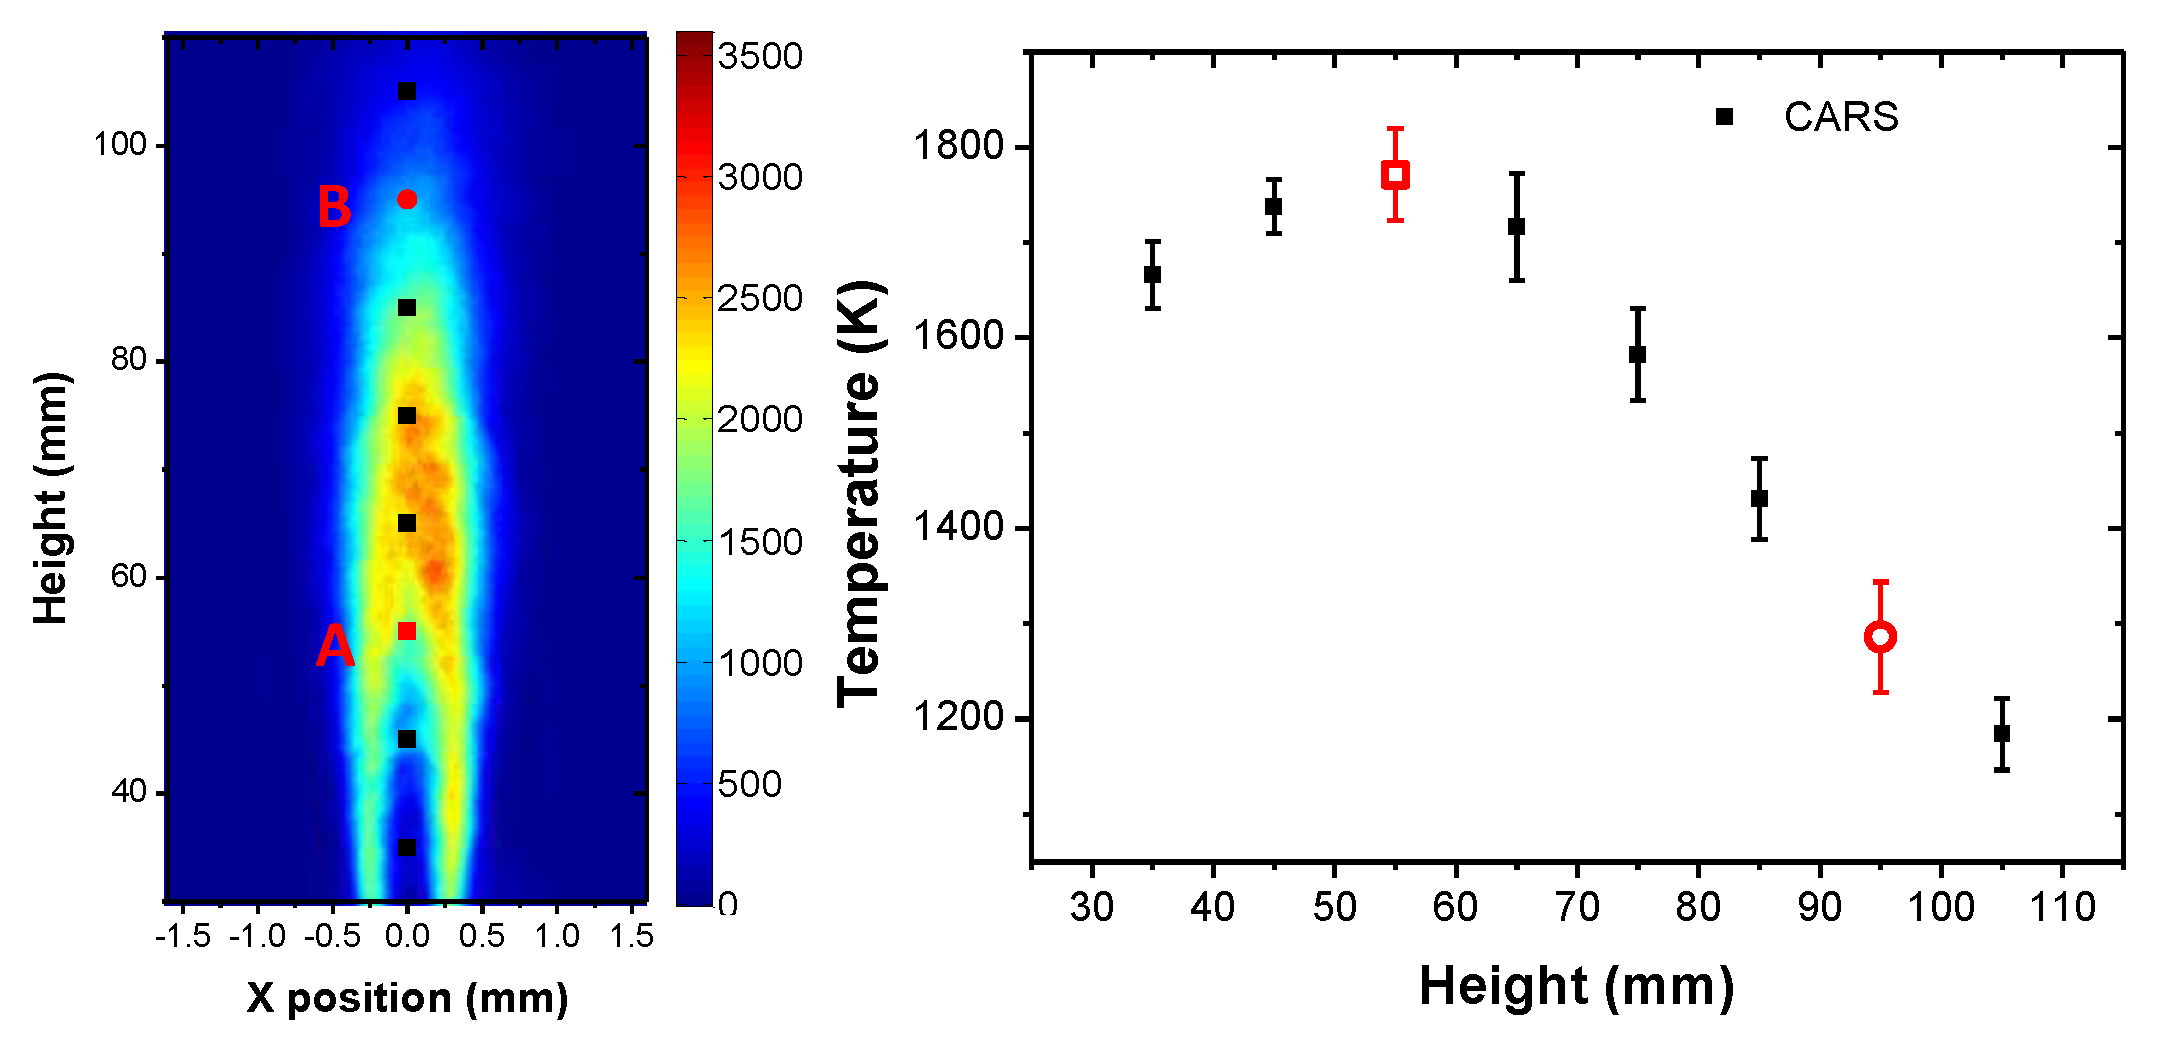
4. Results and Discussion

PLIF fluorescence signals from the P1(7) and Q2(11) transition lines are recorded and the typical image is shown in the left image of Figure 4. The CARS system is vertical scanning to take the temperature at those black rectangular points. The temperature results from CARS are shown in the right graph in Figure 4, with a standard deviation (SD) of 28–58 K. Standard error (SE) of the CARS results is 6–13 K when averaged 20 times.
Within the measuring space of 30–105 mm from the nozzle, the combustion jet can be divided into three areas: the unburned zone, the reaction zone, and the burnout zone. The unburned flow in the center of the jet is heated and the temperature increases with the height. In the reaction zone at a height of 55 mm, the maximum temperature of the flow was obtained. In the burnout zone, the temperature of the hot flow decreased with height for the heat exchange with the surrounding cold air.
Based on the temperature results from the CARS technique, PLIF thermometry calibration was carried out. The temperature results from PLIF are compared with CARS at different heights of jet center axis to obtain the thermometry accuracy of those two calibration methods. The mean temperature and its standard error are obtained by vertical statistic over 49 pixels around the center axis, and the standard deviation and the standard error of the average temperature is shown as
T S D = i = 1 49 ( T i T ¯ ) 48
T ¯ S E = T S D / 49
According to the traditional method, the calibration process is carried out at point A in the left image of Figure 4, from which the calibration coefficient C can be obtained, and then the temperature of other points can be calculated, shown as a red line in Figure 5, with an SE 9–36 K. The average temperature results from PLIF are different from CARS results, especially at those regions where the flow temperature is distinctively different from the calibration point. In terms of the optimized two-point calibration method, the CARS thermometry results at positions A and B are used. Then the calibration parameters of A and B can be calculated, and the optimized temperature results from PLIF are shown as a green line in Figure 5 with an SE 10–37 K. The thermometry results from two-point calibration PLIF agree well with CARS results in the whole region of 1300–1800 K, and the maximum temperature deviation between the PLIF and CARS is only 10 K.

5. Conclusions

In view of the influence of fluorescence yields on thermometry accuracy in two-color PLIF, an optimization of the calibration process in PLIF thermometry was carried out. Compared with the traditional single point calibration method, an additional correction for the fluorescence yield was introduced, and those two calibration coefficients were obtained using two points at high and low temperature region, respectively. In the jet flame, the two-color PLIF thermometry was carried out based on both single point calibration and two-point calibration. The thermometry results from optimized PLIF and CARS are less than 10 K in the entire measured range, compared with 120 K from PLIF calibrated with a single point.
With the CARS results as reference, the maximum temperature deviation of the single point calibration PLIF is 120 K, while for the optimized PLIF, it is only 10 K in the 1300–1800 K range.

Author Contributions

Conceptualization, G.L.; funding acquisition, Z.H. (Zhiyun Hu); methodology, Z.Z., J.Y., S.W., J.S., H.W., and Y.W.; supervision, J.W. and Z.H. (Zuohua Huang); writing—review and editing, G.L. All authors have read and agreed to the published version of the manuscript.

Funding

This work was supported by the National Science and Technology Major Project (J2019-III-0014-0058), Sichuan Science and Technology Program (No.2022YFSY0002), and the Foundation of State Key Laboratory of Laser Interaction with Matter (SKLLIM2206).

Conflicts of Interest

The authors declare no conflict of interest.

References

  1. Eckbreth, A.C. Laser Diagnostics for Combustion Temperature Species, 2nd ed.; CRC Press: Boca Raton, FL, USA, 1996. [Google Scholar]
  2. Kohse-Höinghaus, K.R.; Barlow, S.; Aldén, M.; Wolfrum, J. Combustion at the focus: Laser diagnostics and control. Proc. Combust. Inst. 2005, 30, 89–123. [Google Scholar] [CrossRef]
  3. Alden, M.; Bengtsson, P.; Edner, H. Rotational CARS generation through a multiple four-color interaction. Appl. Opt. 1986, 25, 4493–4500. [Google Scholar] [CrossRef] [Green Version]
  4. Bohlin, A.; Kliewer, C.J. Communication: Two-dimensional gas-phase coherent anti-Stokes Raman spectroscopy (2D-CARS): Simultaneous planar imaging and multiplex spectroscopy in a single laser shot. J. Chem. Phys. 2013, 138, 110–122. [Google Scholar] [CrossRef]
  5. Laurendeau, N.M. Temperature measurements by light-scattering methods. Prog. Energ. Combust. 1988, 14, 147–170. [Google Scholar] [CrossRef]
  6. Wang, S.; Si, J.H.; Shao, J.; Hu, Z.Y.; Ye, J.F.; Liu, J.R. Two-dimensional interferometric Rayleigh scattering velocimetry using multibeam probe laser. Opt. Eng. 2017, 56, 111705. [Google Scholar]
  7. Alden, M.; Grafstroom, P.; Lundberg, H.; Svanberg, S. Spatially resolved temperature measurements in a flame using laser-excited two-line atomic fluorescence and diode-array detection. Opt. Lett. 1983, 8, 241–243. [Google Scholar] [CrossRef]
  8. Boxx, I.; Stöhr, M.; Carter, C.; Meier, W. Temporally resolved planar measurements of transient phenomena in a partially pre-mixed swirl flame in a gas turbine model combustor. Combust. Flame 2010, 157, 1510–1525. [Google Scholar] [CrossRef] [Green Version]
  9. Zhou, B.; Kiefer, J.; Zetterberg, J.; Li, Z.S.; Alden, M. Strategy for PLIF single-shot HCO imaging in turbulent methane/air flames. Combust. Flame 2014, 161, 1566–1574. [Google Scholar] [CrossRef]
  10. Feroughi, O.M.; Kronemayer, H.; Dreier, T.; Schulz, C. Effect of fluctuations on time-averaged multi-line NO-LIF thermometry measurements of the gas-phase temperature. Appl. Phys. B 2015, 120, 429–440. [Google Scholar] [CrossRef]
  11. Chan, C.; Daily, J.W. Measurement of temperature in flames using laser induced fluorescence spectroscopy of OH. Appl. Opt. 1980, 19, 1963–1968. [Google Scholar] [CrossRef]
  12. Cattolica, R. OH rotational temperature from two-line laser-excited fluorescence. Appl. Opt. 1981, 20, 1156–1166. [Google Scholar] [CrossRef]
  13. Seitzman, J.M.; Hanson, R.K.; Debarber, P.A.; Hess, C.F. Application of quantitative two-line OH planar laser-induced fluorescence for temporally resolved planar thermometry in reacting flows. Appl. Opt. 1994, 33, 4000–4012. [Google Scholar] [CrossRef]
  14. Luque, J.; Crosley, D.R. LIFBASE: Database and Spectral Simulation Program (Version 1.5); SRI International: Menlo Park, CA, USA, 1999. [Google Scholar]
  15. Dunn, M.J.; Masri, A.R. A comprehensive model for the quantification of linear and nonlinear regime laser-induced fluorescence of OH under A2Σ+←X2Π(1,0) excitation. Appl. Phys. B 2010, 101, 445–463. [Google Scholar] [CrossRef]
  16. Sharipov, G.L.; Tukhbatullin, A.A.; Abdrakhmanov, A.M. Detection of OH radical and O atom during triboluminescence of hydrated cerium/terbium sulfates. J. Lumin. 2012, 132, 175–177. [Google Scholar] [CrossRef]
  17. Li, L.; Nikiforov, A.; Xiong, Q.; Britun, N.; Snyders, R.; Lu, X.; Leys, C. OH radicals distribution in an Ar-H2O atmospheric plasma jet. Phys. Plasmas 2013, 20, 093502. [Google Scholar] [CrossRef] [Green Version]
  18. Kienle, R.; Lee, M.P.; Kohse-Höinghaus, K. A detailed rate equation model for the simulation of energy transfer in OH laser-induced fluorescence. Appl. Phys. B 1996, 62, 583–599. [Google Scholar] [CrossRef]
  19. Devillers, R.; Bruneaux, G.; Schulz, C. Development of a two-line OH-laser-induced fluorescence thermometry diagnostics strategy for gas-phase temperature measurements in engines. Appl. Opt. 2008, 47, 5871–5885. [Google Scholar] [CrossRef]
  20. Seitzman, J.M.; Hanson, R.K. Two-line planar fluorescence for temporally resolved temperature imaging in a reacting supersonic flow over a body. Appl. Phys. B 1993, 57, 385–391. [Google Scholar] [CrossRef]
  21. Cattolica, R.J.; Mataga, T.G. Rotational-level-dependent quenching of OH by collisions with H2O in a low-pressure flame. Chem. Phys. Lett. 1991, 182, 623–631. [Google Scholar] [CrossRef]
  22. Copeland, R.A.; Dyer, M.J.; Crosley, D.R. Rotational-level dependent quenching of OH and OD. J. Chem Phys. 1985, 82, 4022–4032. [Google Scholar] [CrossRef]
  23. Li, G.H.; Hu, Z.Y.; Wang, S. 2D scanning CARS for temperature distribution measurement. Optics Precis. Eng. 2016, 24, 14–19. [Google Scholar]
Figure 1. Overall structure of the jet flame and self-luminescence photograph of the flame.
Applsci 13 00176 g001
Figure 2. Diagram of two-color PLIF temperature measurement.
Applsci 13 00176 g002
Figure 3. Two-dimensional Scanning CARS experimental facility.
Applsci 13 00176 g003
Figure 4. Fluorescence image of OH and the measured temperature from CARS.
Applsci 13 00176 g004
Figure 5. Temperature results of jet flame from PLIF and CARS.
Applsci 13 00176 g005
Disclaimer/Publisher’s Note: The statements, opinions and data contained in all publications are solely those of the individual author(s) and contributor(s) and not of MDPI and/or the editor(s). MDPI and/or the editor(s) disclaim responsibility for any injury to people or property resulting from any ideas, methods, instructions or products referred to in the content.

