Article

Application of Infrared Spectroscopy and Thermal Analysis in Explaining the Variability of Soil Water Repellency

Department of Soil Science, Faculty of Natural Sciences, Comenius University in Bratislava, 84215 Bratislava, Slovakia
*
Author to whom correspondence should be addressed.
Appl. Sci. 2023, 13(1), 216; https://doi.org/10.3390/app13010216
Submission received: 3 December 2022 / Revised: 21 December 2022 / Accepted: 21 December 2022 / Published: 24 December 2022
(This article belongs to the Section Environmental Sciences)

Abstract

:
Forests play important role in hydrological processes such as evapotranspiration, infiltration, surface runoff, and distribution of precipitation waters. This study evaluates soil water repellency (SWR) in a mountain forest area of Slovakia (Central Europe). Findings of previous studies suggest that the variability of SWR is associated mainly with differences in soil moisture. On the other hand, the role of soil organic matter (SOM) quality in spatial and/or temporal WR changes is less clear, particularly at the plot scale. To measure SOM quality, we used Fourier-transform infrared (FTIR) spectroscopy and thermogravimetry (TG). It was found that FTIR data and the results of thermal analysis are linked to dissimilar wettability of the studied soils. WR samples contained more aliphatic structural units in comparison to wettable soils, which showed a higher relative amount of polar functional groups. Thermogravimetric data suggest that SOM in all 45 samples is relatively labile. This is in accordance with strongly acidic pH and high C/N ratio. The amount of SOM degraded at around 250 °C was significantly correlated with SWR data and at the same time with FTIR peak areas characteristic for aliphatic structural units. This suggests that the accumulation of raw (labile) OM, containing nonpolar functional groups, supports the susceptibility of soils to WR. A significant portion of the variability in WR data was explained by multiple regression analysis, using field water content, FTIR peak areas, and SOM thermal characteristics as predictors. The results confirmed that even the soils occurring in a relatively humid and cold climate may show considerable WR during summer.

1. Introduction

Soil water repellency (SWR) is the inability of soil to absorb water. Upon contact with water repellent soil, water does not penetrate spontaneously into the pore system. Depending on the conditions, water may either create surface runoff, infiltrate through preferential flow patterns, or even evaporate. It was found that SWR is caused by hydrophobic components or structures of soil organic matter (SOM). Waxes, fatty acids, their esters, and salts, phytanes, phytols, and sterols are the compounds with nonpolar structure that were associated with the origin of SWR [1].
The effects of SWR may vary. If the water repellent soils are located on flat terrain, the consequences of SWR are usually less apparent in comparison to slope areas. Uneven distribution of soil moisture, occurrence of dry patches in soil [2], and lower accessibility of soil nutrients [3] are common in water repellent soils in lowlands. SWR may significantly increase the risk of soil erosion in forested hilly and mountain regions, particularly after fire impact [4]. Fire often removes understory vegetation and the litter, leaving the bare soil exposed to rainfall. Hydrophobic substances in litter or surface horizon may evaporate as a result of heating. After the transition into a gaseous phase, the compounds migrate downwards into a colder environment, where they condensate [5].
The important factor which affects soil wettability is obviously soil moisture [6]. Usually, lower soil water contents in the field are associated with increased repellency, whereas for higher moisture levels a less repellent or wettable character of soil is expected. A negative correlation between the two variables was observed in many studies, but it is worth noting that this collinearity is a statistical approximation. Works that studied the phenomenon in detail in the laboratory suggest that soil wettability changes nonlinearly as a function of soil water content [7]. Nonlinear variation of WR with forming one or even two maxima in repellency as a result of decreasing soil moisture was reported by Goebel et al. [8].
Although soil moisture significantly affects SWR, the differences in soil wettability cannot be explained solely by the change in soil water content. There are additional parameters that need to be considered when assessing the susceptibility of soil to WR. The properties of SOM are important [9], as well as the characteristics of soil parent material [10]. Although there are the methods that enable study of the properties of SOM in detail, many of them include laborious sample preparation and the overall costs may be demanding when more samples are evaluated. The same is true for the analysis of inorganic soil components. Additionally, the results of advanced laboratory methods are often too complex, and they are rarely used as simple indicators of soil quality or as predictors in regression models. An exception in this regard is infrared (IR) spectroscopy that has been used as a tool for prediction of various soil properties [11,12,13]. Although cited studies usually analyzed a large number of samples and employed multivariate regression models, the attempts to predict SOM quality are scarce and works aimed at WR quantification are lacking.
This work assesses the topsoil WR in forest ecosystem of the High Tatra mountains (Slovakia, Central Europe) recovering from the impact of a katabatic windstorm. After the trees of the spruce forest were blown down, soil moisture, textural composition, soil wettability, or characteristics of SOM played important roles in ecosystem recovery and affected surface runoff and soil water retention. Up to date works assessing topsoil characteristics (particularly wettability) in relation to wind-induced disturbance of forest ecosystems are lacking. Many studies assessed SWR in arid regions or lowlands and less attention has been paid to SWR occurring in boreal or mountainous areas [14]. This work takes advantage of the rare occasion to examine spatial variability of topsoil properties in unique conditions. The basic information regards the occurrence of SWR in the High Tatras and its relation to windstorm impact and subsequent management practices published previously [15]. This work further elaborates on the subject by focusing more on plot-scale variability of SOM properties and its effect on SWR.

2. Materials and Methods

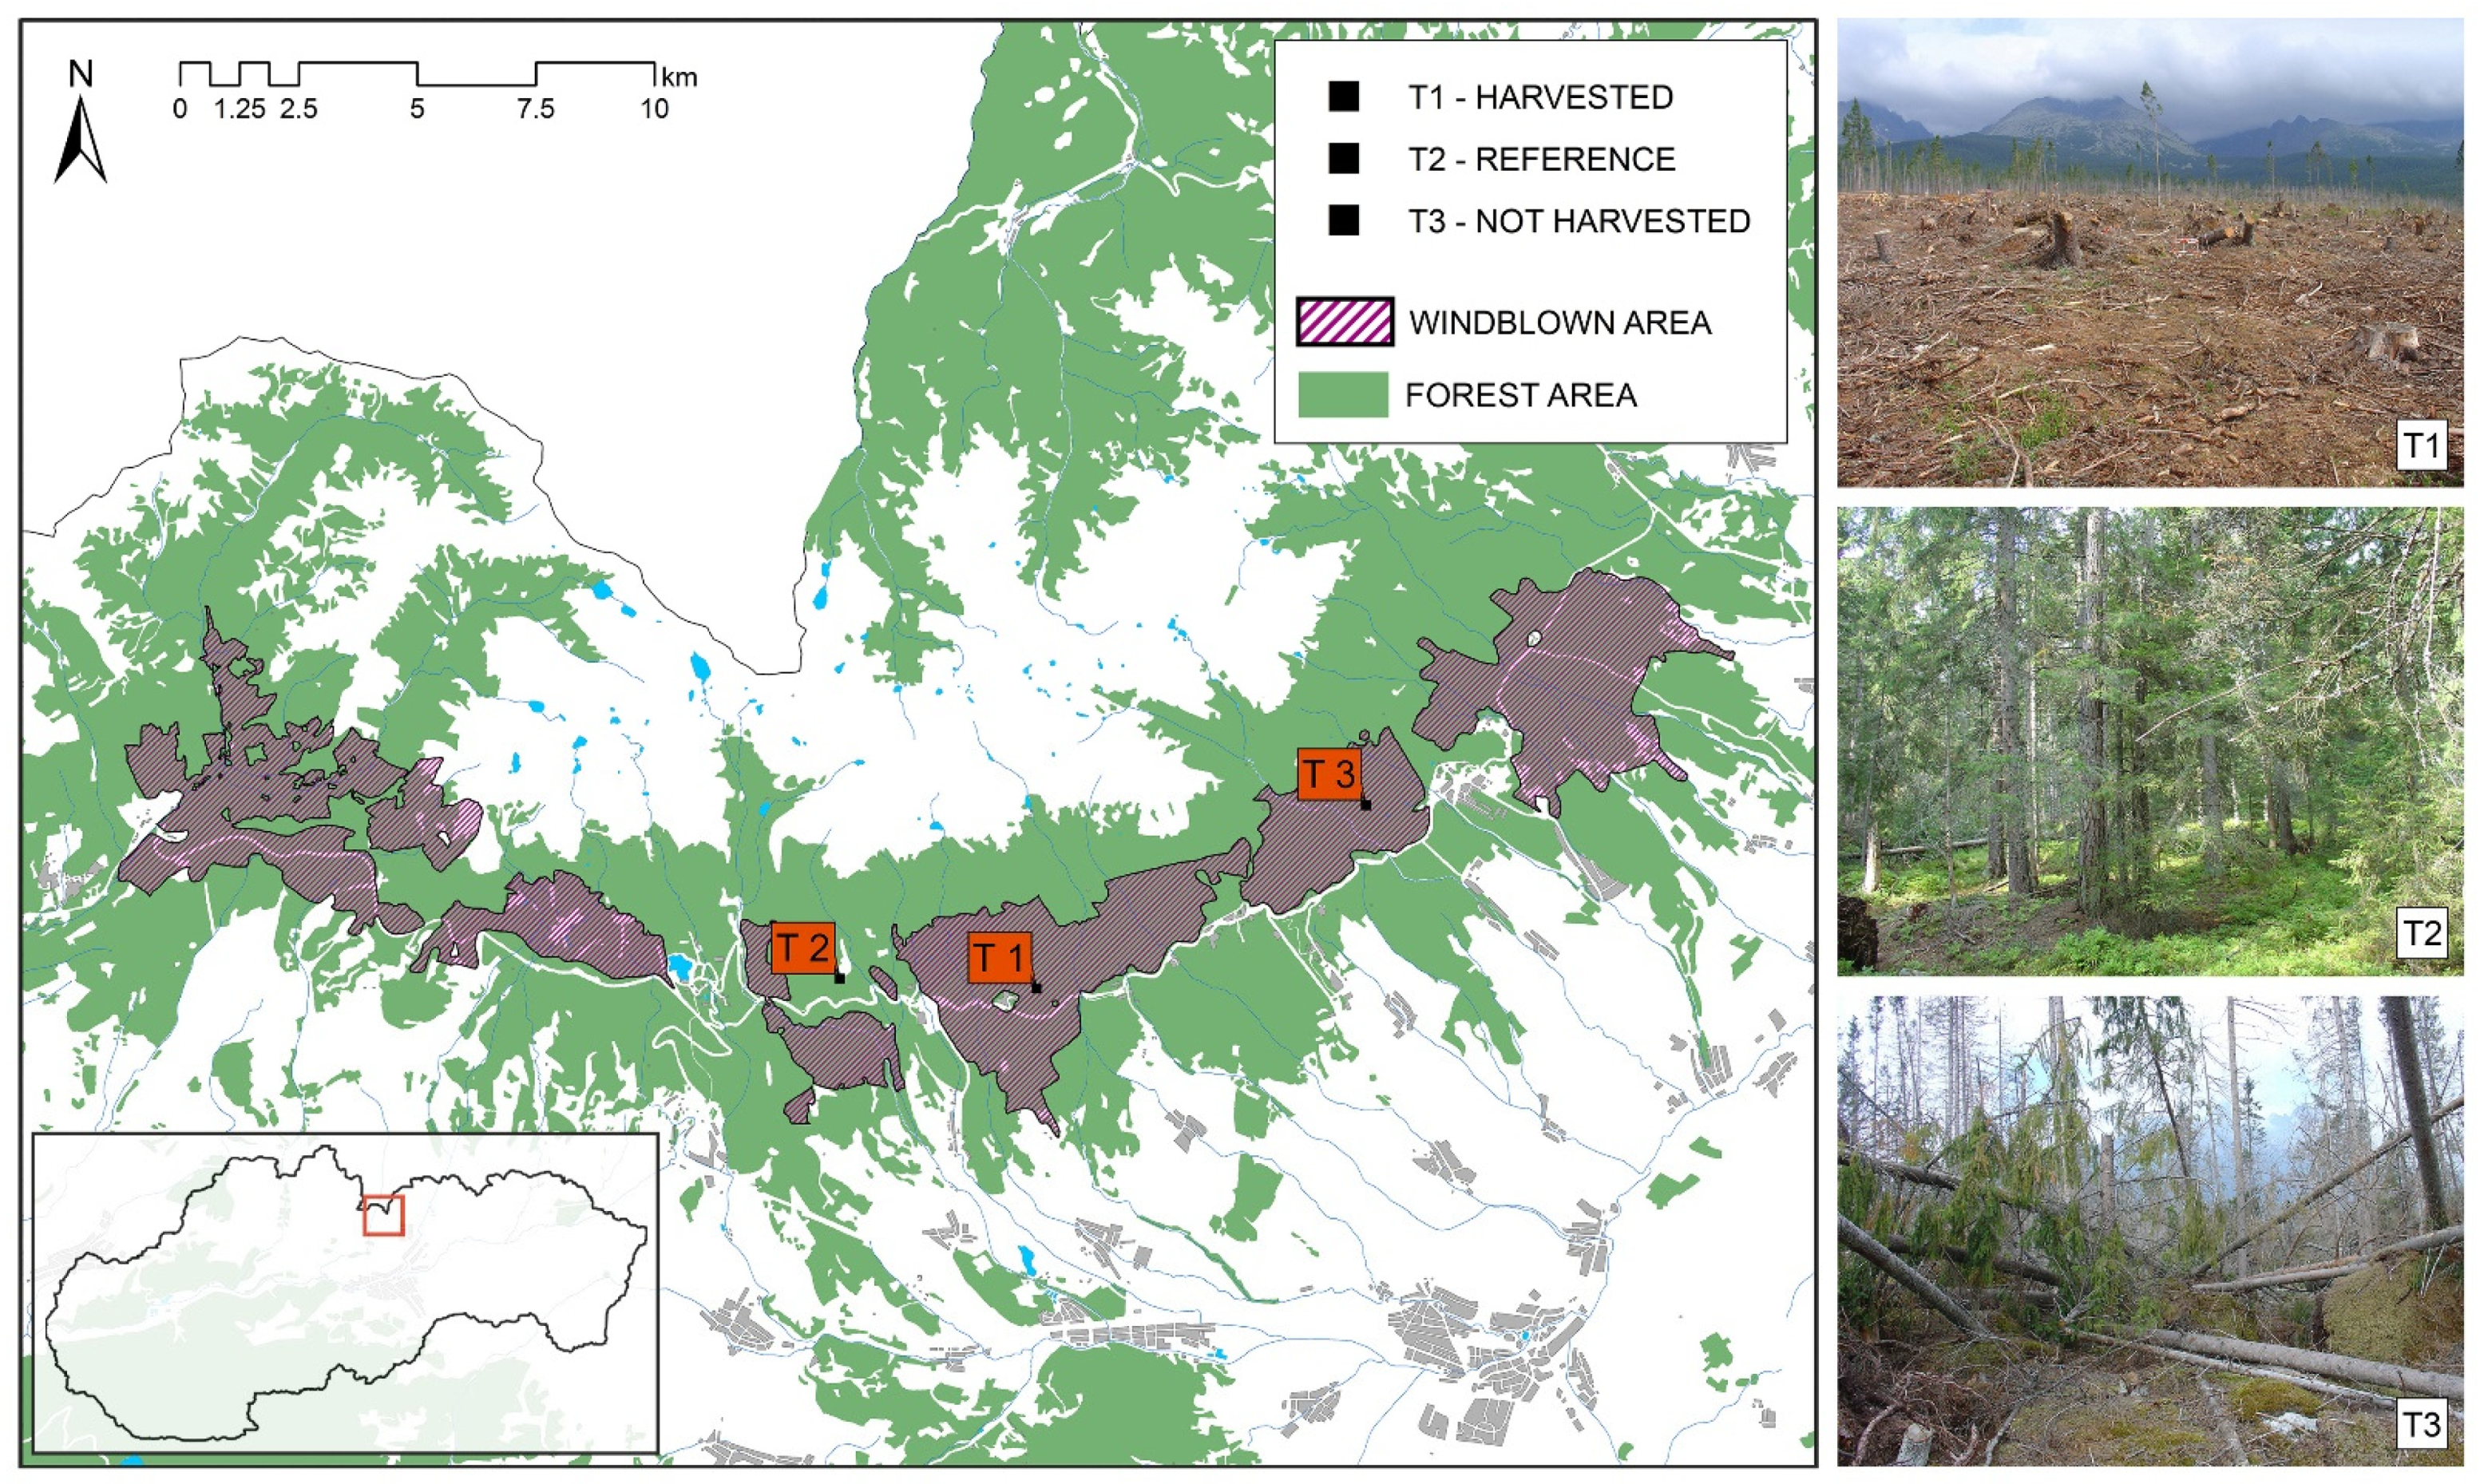
2.1. Studied Area and Soil Sampling

The examined sites are situated in mountain region of the High Tatras, in northern Slovakia (Central Europe), where a bora—katabatic windstorm—swept down 12,500 ha of forest canopy in 2004. Sampled soils were Typic and Humic Dystrudepts [16] developed on a quaternary moraine gravel layer with igneous character. Soil water and temperature regimes were udic and frigid, respectively. Vegetation in the area is characterized by dominance of Picea abies in a tree layer, which is sporadically accompanied by Larix decidua. Main understory plants include Vaccinium (myrtillus, vitis-idaea), Calamagrostis villosa, Avenella flexuosa, and Chamaerion angustifolium.
Soil sampling was carried out during the summer period since lower soil water contents are favorable for WR development. The samples (n = 45) were taken from three stands with diverse topsoil conditions (Figure 1). These comprised one reference and two windblown sites which differed in applied management practices. Site T1 (49°07′12.0″ N, 20°09′47.5″ E, altitude: 1043 m) was situated within an area where wood mass of fallen and broken trees was harvested. Reference site T2 (49°07′17.5″ N, 20°06′16.4″ E, altitude: 1221 m) was located under intact forest. Experimental site T3 (49°09′60.5″ N, 20°15′14.8″ E, altitude: 1067 m) was situated within area where uprooted and broken trees were left without further (human) intervention. Apart from the differences in altitude, all three sites were south-orientated, with relatively similar character of local topographic conditions. In the case of each experimental site, 15 samples of topsoil (depth interval 0–5 cm) were taken from a 400 m2 area at random.

2.2. Sample Preparation and Analysis of Basic Soil Properties

Samples were air-dried at 22 ± 2 °C and passed through a 2 mm sieve. Prior to drying and sieving, the water content of soil was determined gravimetrically and expressed as mass wetness ratio (wF). Soil reaction was determined by a potentiometric method in distilled water using a soil/solution ratio of 1/2.5. As certain chemical analyses applied in this study required relatively small amounts (mg), approximately 5 g of each soil was ground in a zircon oxide mill to achieve homogeneity of the sample. Contents of soil organic carbon (SOC) and total nitrogen were determined by Flash 2000 (Thermo Fisher Scientific, Waltham, MA, USA). Approximately 20 mg of soil was used for the analysis. Soil texture was determined by mechanical analysis (pipette method). Contents of sand (2–0.05), silt (0.05–0.002), and clay (<0.002 mm) fractions were measured, and the results classified according to the USDA-FAO texture triangle [17].

2.3. Soil Water Repellency Measurements

Persistence of WR was assessed by a water drop penetration time (WDPT) test [18]. Similarly to Dekker et al. [19] or Doerr et al. [20], the measurements were carried out on field-moist samples (WDPTA—actual water repellency) and after drying at laboratory temperature (WDPTP—potential water repellency). Soils were placed in Petri dishes and three drops of distilled water (0.05 mL) placed onto the surface of soil sample using a medicinal dropper. The actual time required for complete penetration of the droplet was recorded. To reduce evaporation, the dishes were covered when testing. The average of three WDPT values was used to characterize WR of the sample.
For WR severity assessment, the molarity of an ethanol droplet (MED) test was performed [18]. Standardized ethanol/water solutions were used, ranging from 0.17 mol L−1 to 7.49 mol L−1 (with 1 vol. % increments). Drops (0.05 mL) were applied in increasing concentration order until penetration occurred within 3 s. The corresponding molarity value was taken as representative to characterize the sample’s wettability. The MED test was performed on air-dried samples only to avoid possible dilution of the ethanol solutions by the water contained in field-moist samples. To minimize the extent of disturbance, grinding and sieving procedures were avoided and water/ethanol droplets were applied on a smoothed surface of the loose soil sample after gentle removal of macroscopic plant debris.

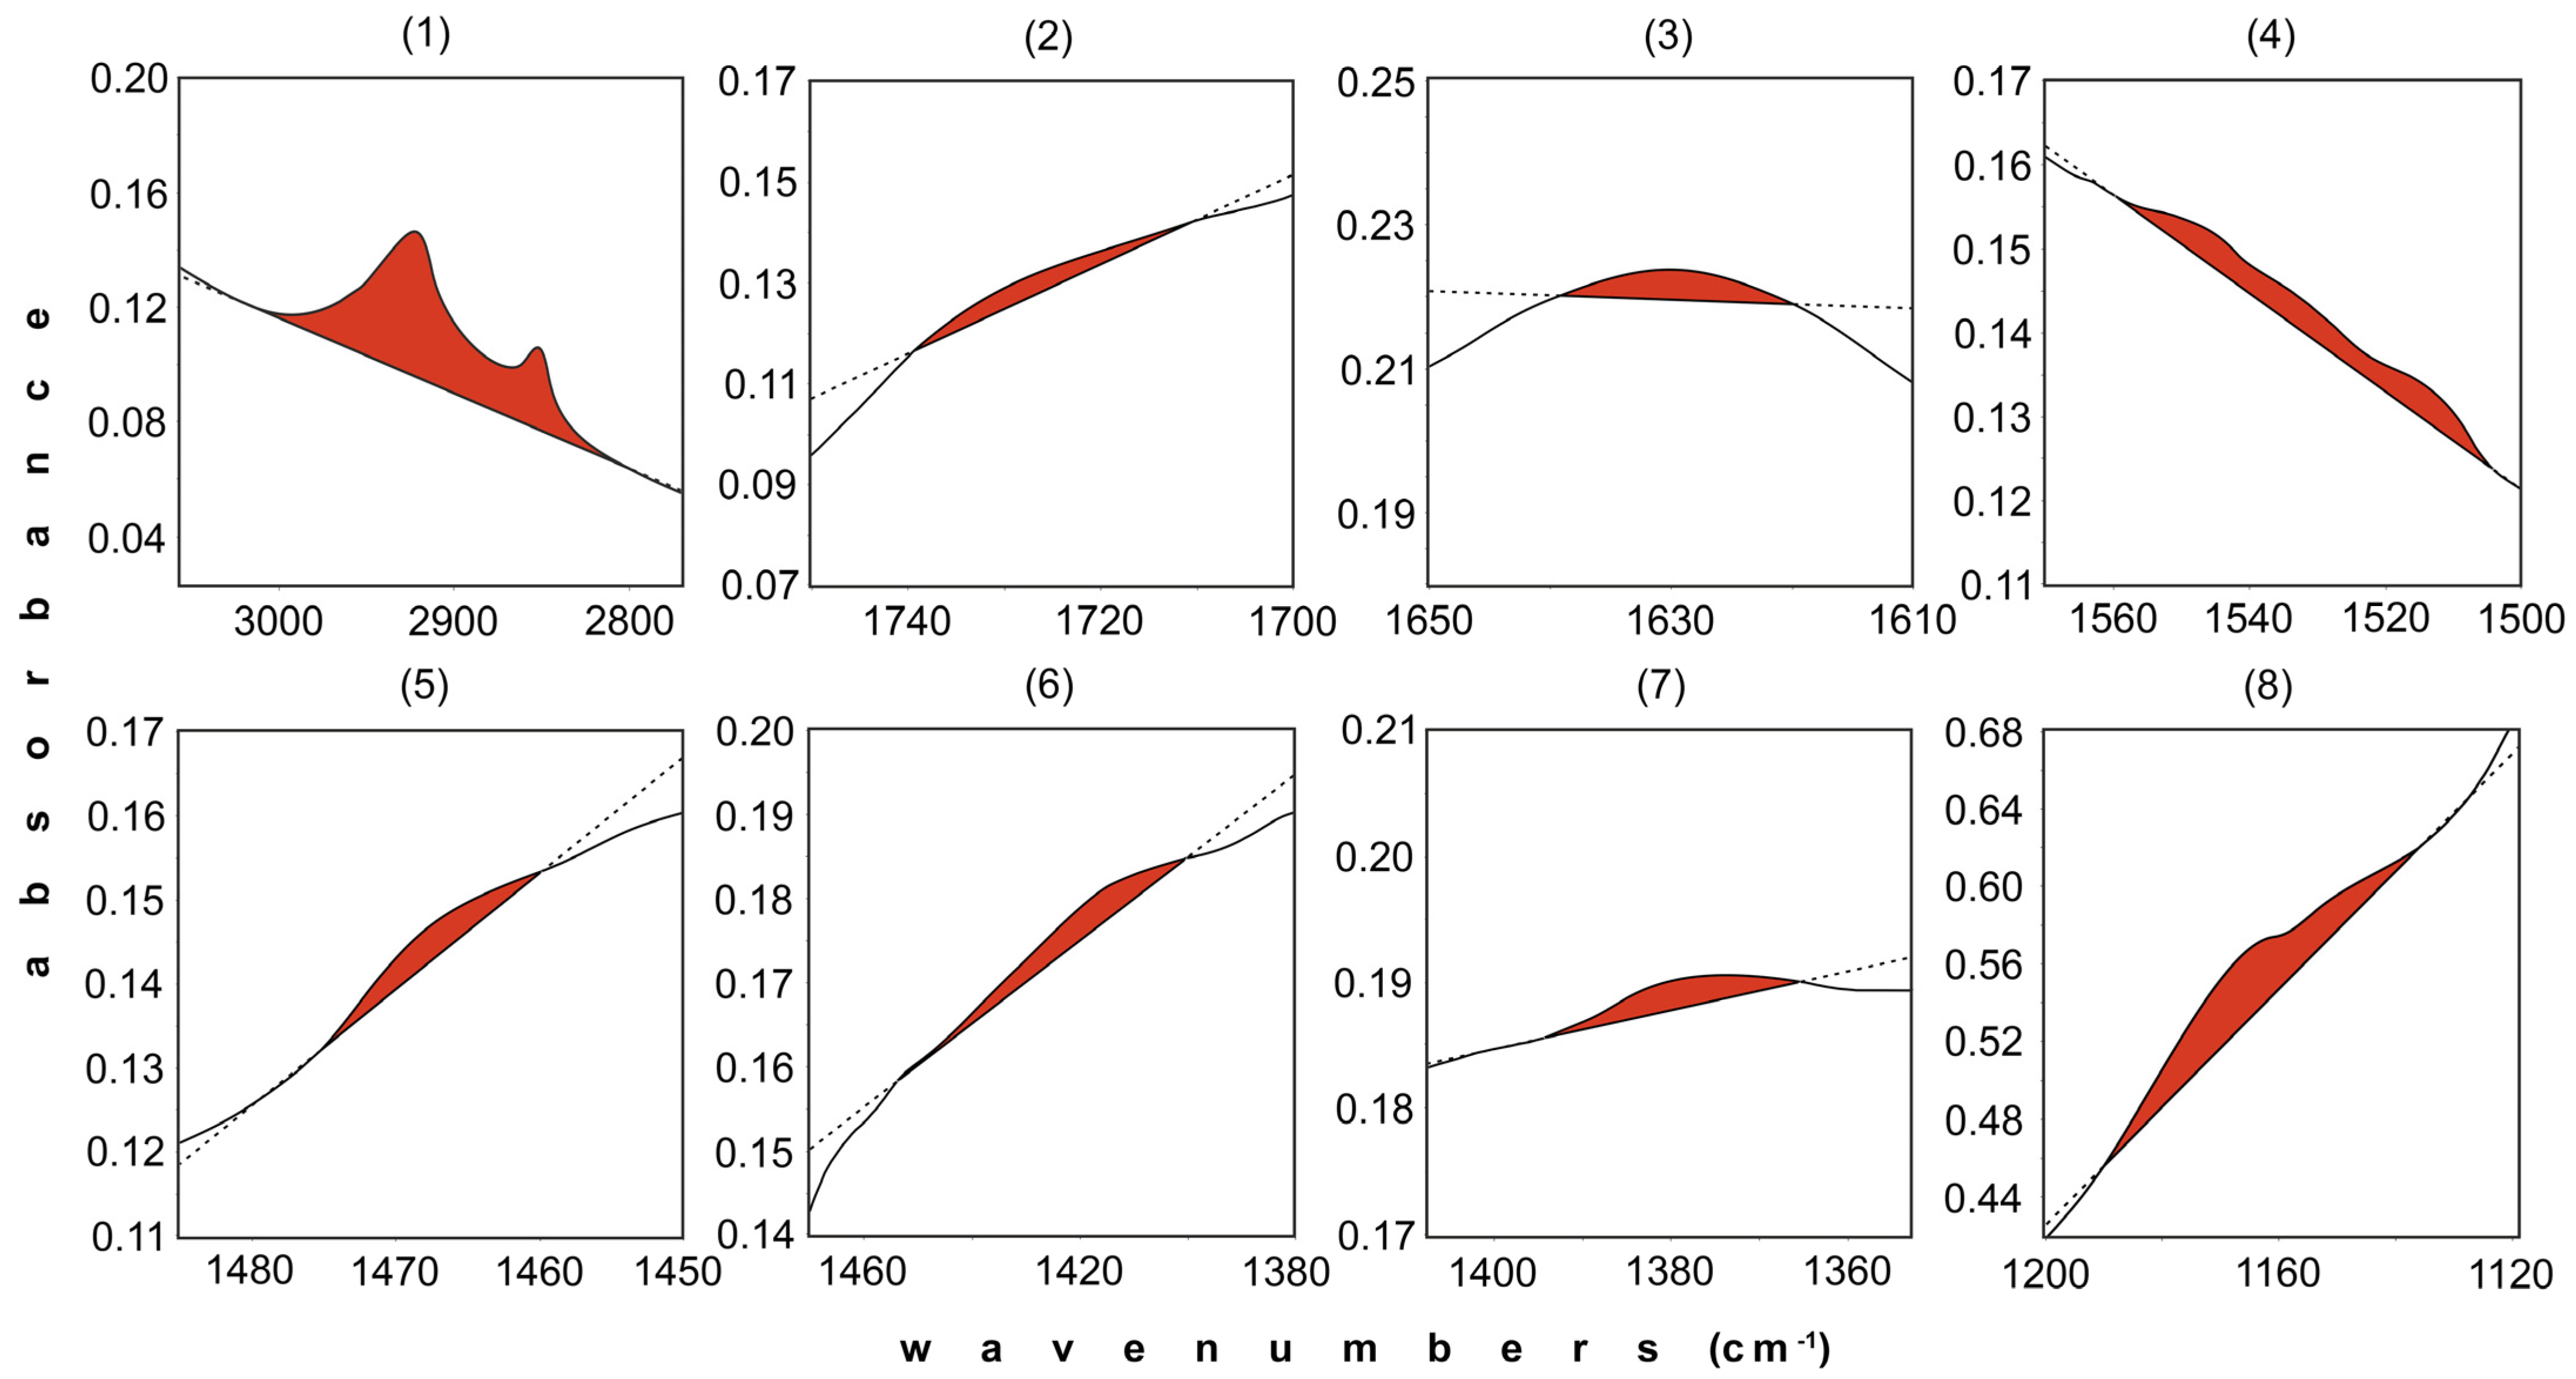
2.4. FTIR Spectroscopy

Fourier-transform infrared (FTIR) spectroscopy was performed using NICOLET 6700 and OMNIC 8 software (Thermo Scientific, Waltham, MA, USA). In the case of each soil, 2 mg was mixed with 200 mg of potassium bromide (KBr) and pressed into a small pellet [21]. The measurement was carried out in transmission mode, in the mid-infrared region (from 4000 to 400 cm−1), providing spectral data in the form of absorbance values. In the case of each sample, 128 scans at a resolution of 4 cm−1 were recorded and averaged. To evaluate possible relations between the FTIR data and the results of WR testing, we quantified the IR absorption in the selected frequency regions. The analysis was performed in eight bands by integration of the peak areas. Peak area calculation is illustrated in Figure 2. In the case of each band, only the area without the background was integrated. Terminal wavenumber values were delimited in accordance with cited references (Table 1). The peak area values were used in correlation and regression analysis.

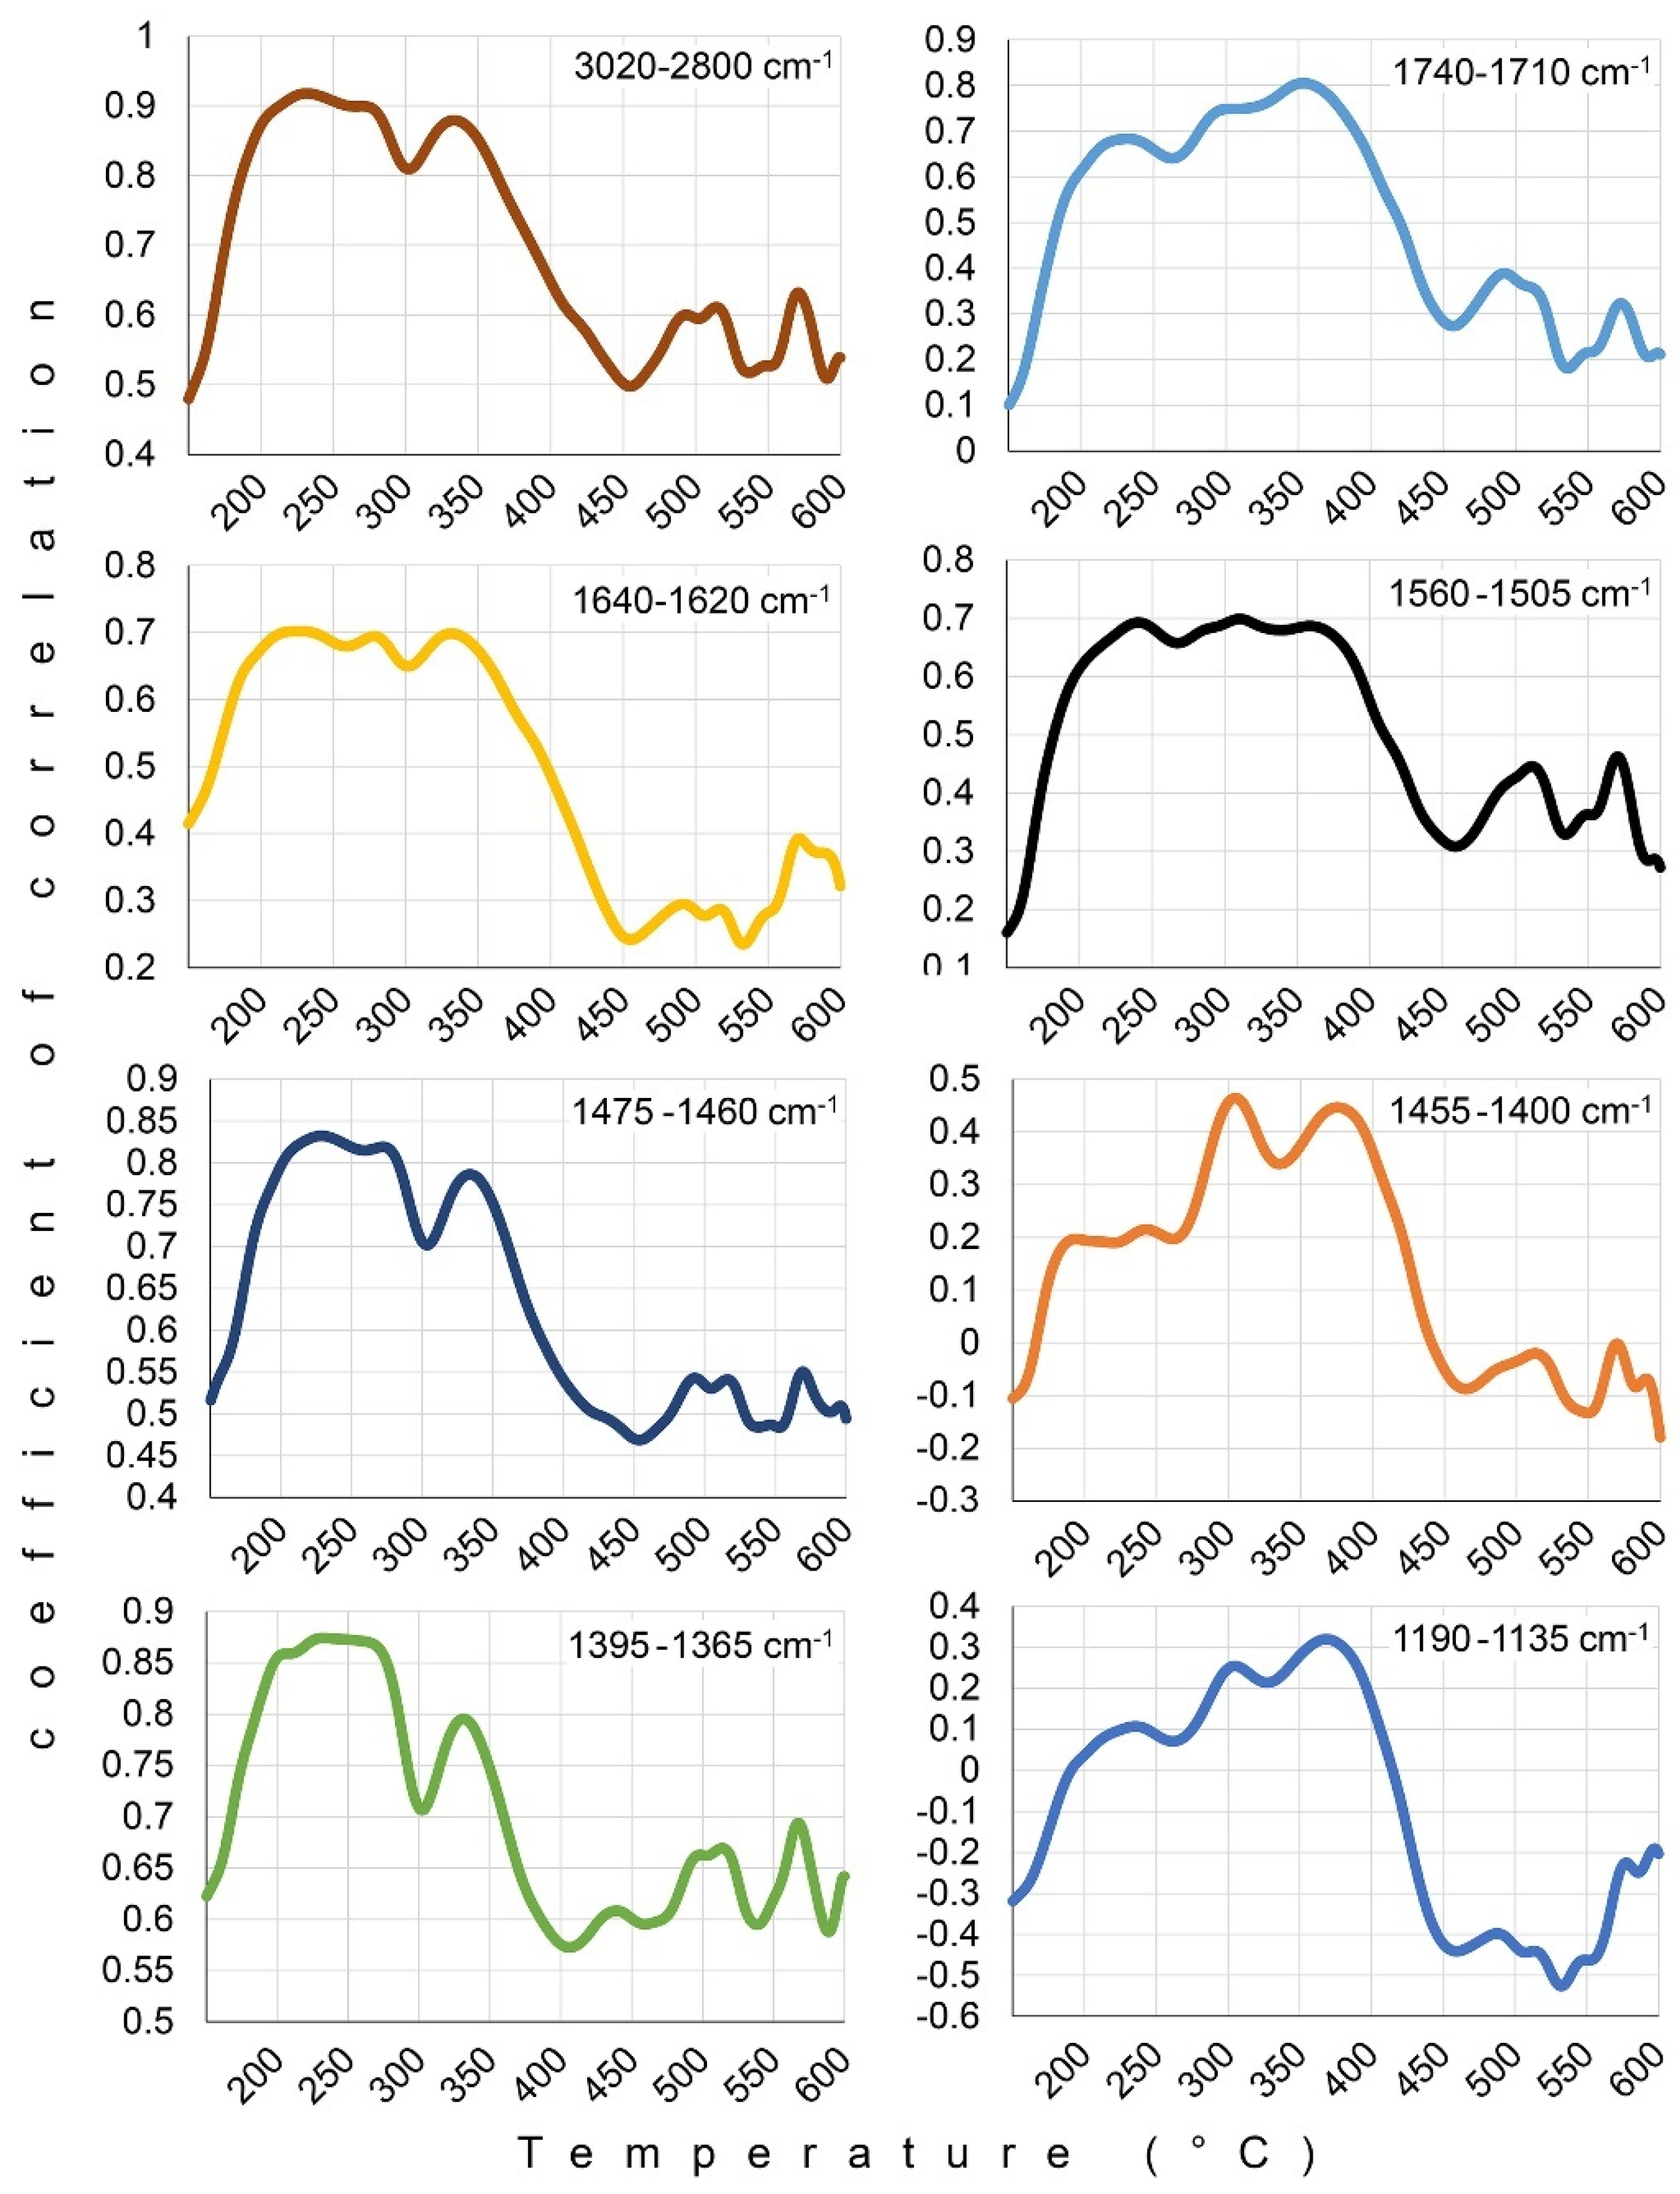
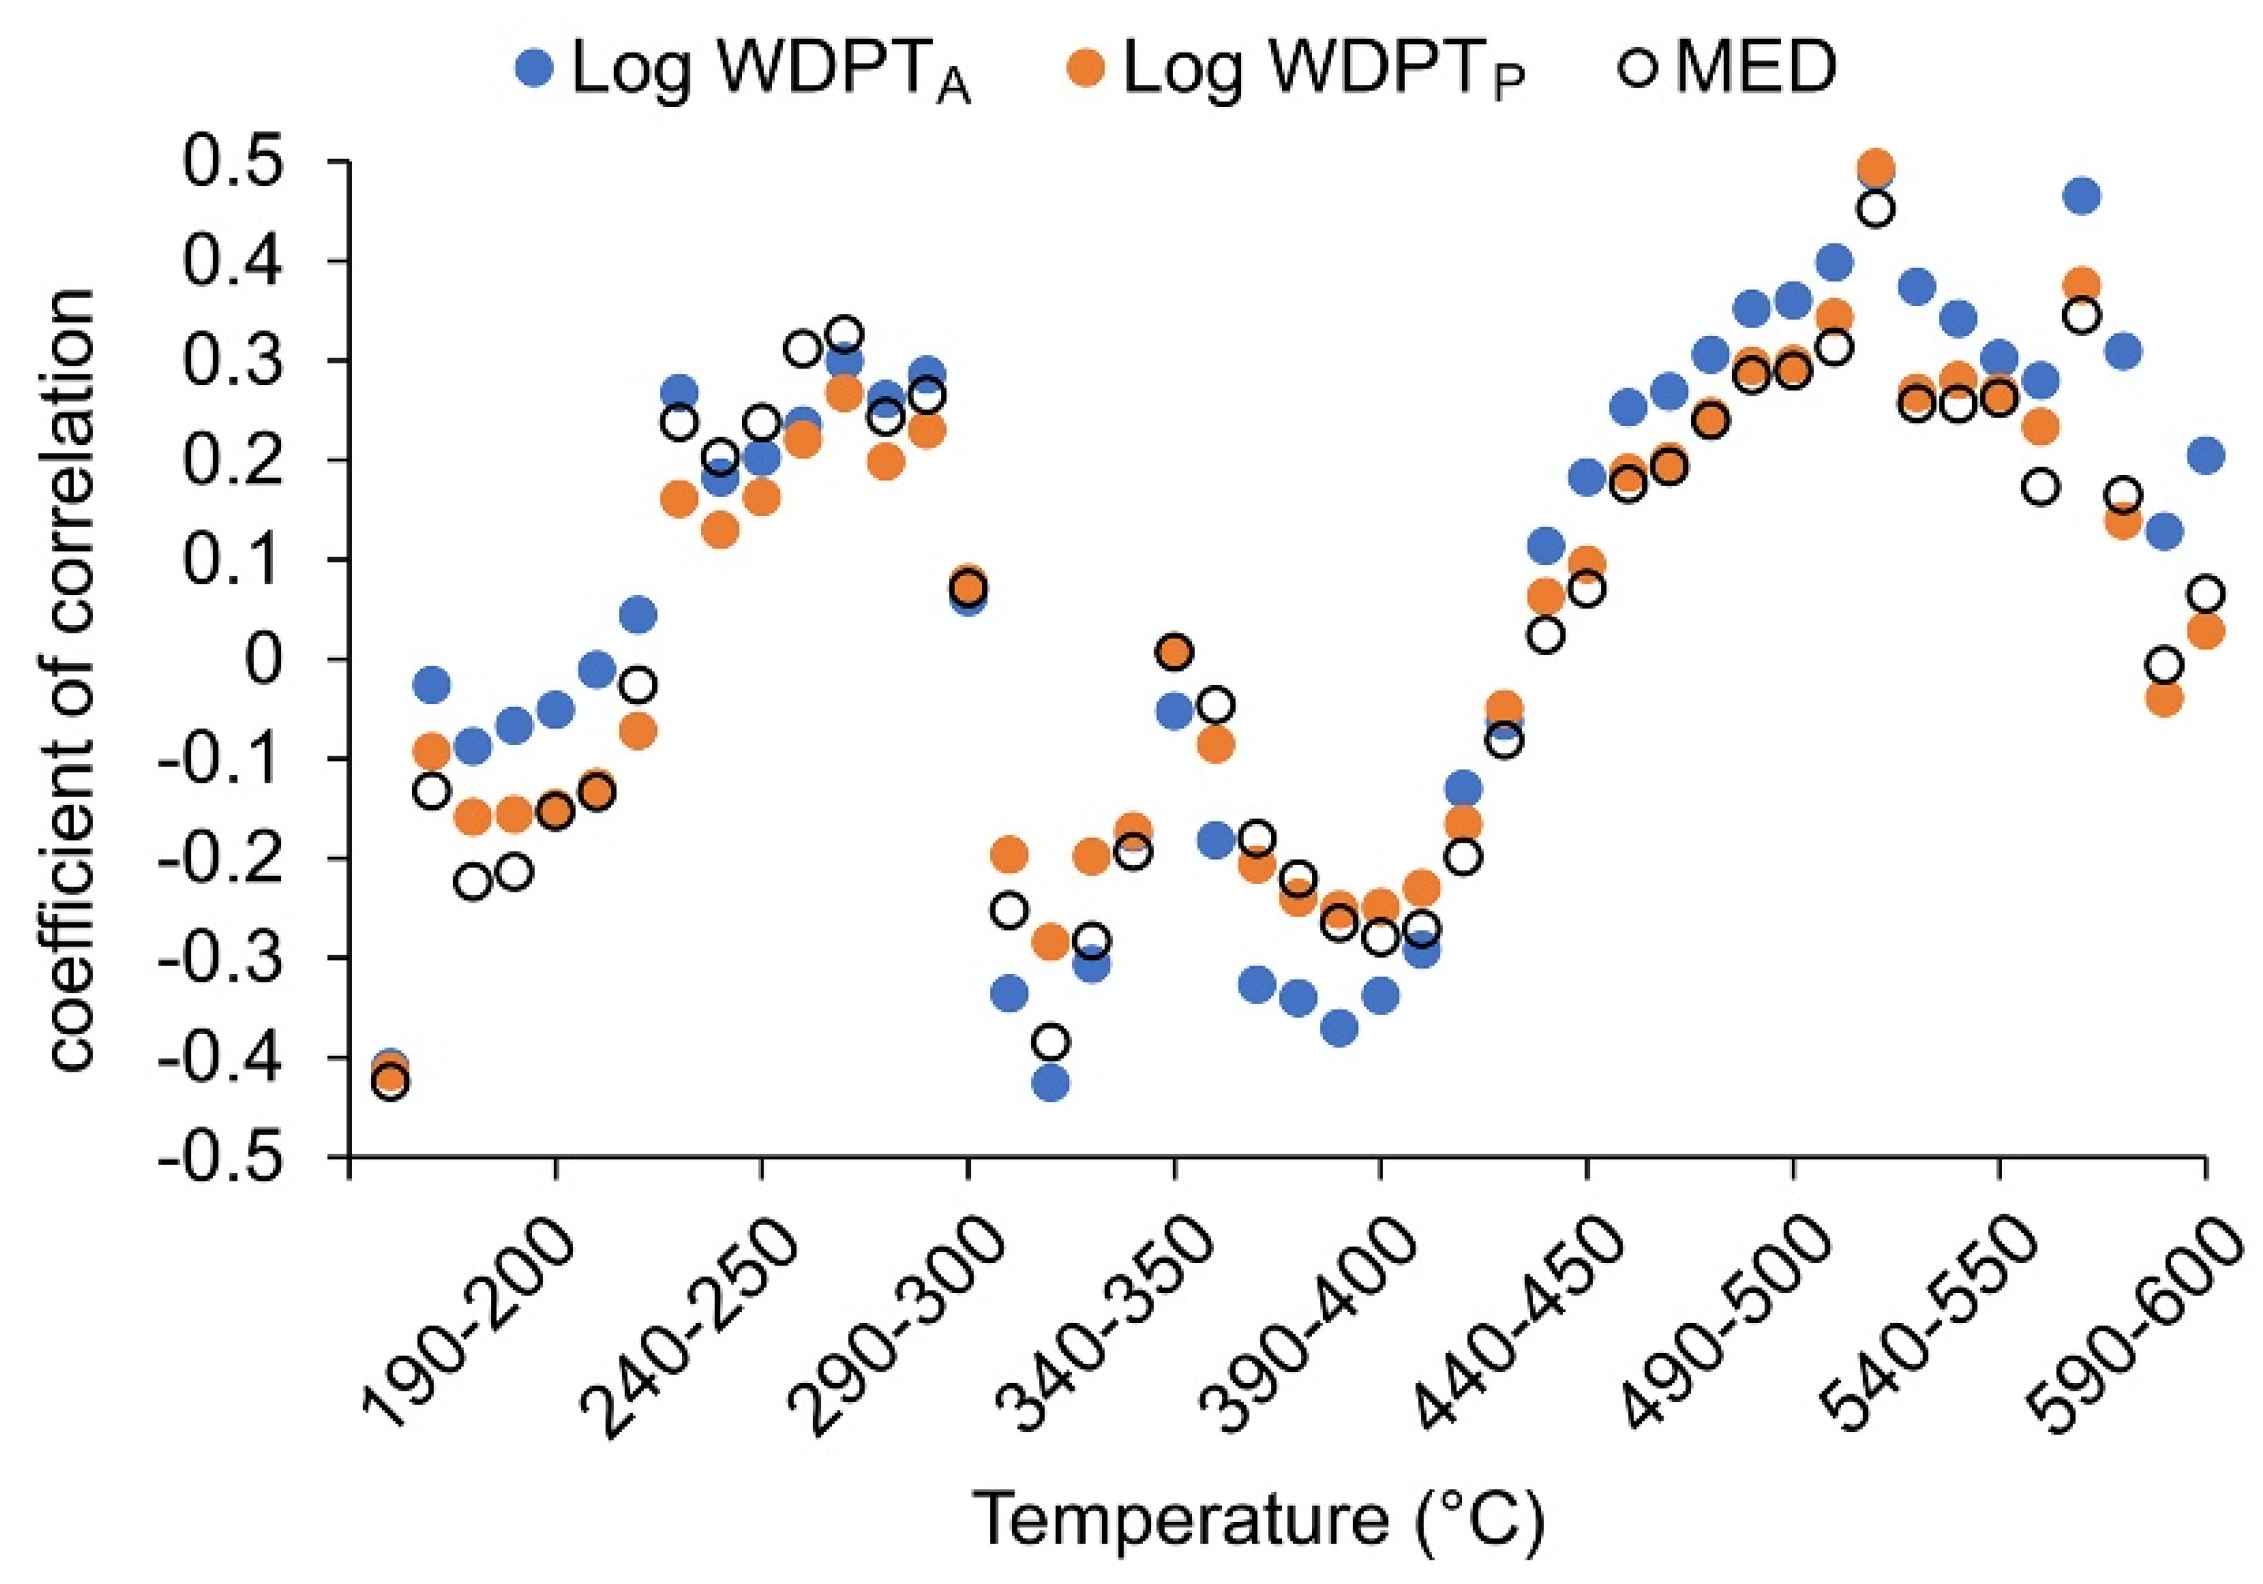
2.5. Thermal Analysis

Homogenized soil samples were subjected to thermogravimetric (TG), differential thermogravimetric (DTG), and differential thermal (DTA) analyses, respectively. These were performed using a TGA-DTA SDT 2960 system (TA Instruments, New Castle, DE, USA) with a 90 cm3 min−1 standard air flow rate from 20 to 1000 °C and a 10 °C min−1 heating rate. In general, the two main processes may by distinguished, considering a temperature interval up to 600 °C. First, residual water is evaporated from the sample followed by thermal degradation of SOM. The temperature threshold at which SOM degradation started varied between 150 and 180 °C. To find out if there is a link between thermal stability of SOM and SWR, we focused primarily on TG-DTG-DTA results recorded within the 150 and 600 °C interval. TG data analysis was performed in Origin 9 software (OriginLab, Northampton, MA, USA).

2.6. Statistical Analysis

The values of all measured variables were tested for normality of distribution using skew and kurtosis criteria. To elucidate the relations between WR data and other soil properties, Pearson’s coefficients of correlation (r) were calculated. Additionally, multiple regression analysis was performed. Basic soil properties, FTIR peak areas, and results of thermal analysis were all tested as possible predictors of WDPT and MED values. The significance of partial regression coefficients was assessed by testing the t value according to Student’s probability distribution (two tailed) at given degrees of freedom. For each obtained equation and associated coefficients of multiple determination (R2), the F value was calculated. The F value was subsequently tested according to the Fisher–Snedecor probability distribution at given degrees of freedom and the result expressed as error probability.

3. Results and Discussion

3.1. Basic Soil Properties

Results of basic soil properties are given in Table 2. SWR and field water content varied greatly, not only between individual experimental sites, but also among the spots from which the samples were taken. The variability of both properties is supported by the undulating character of the moraine landscape. After the impact of the windstorm, additional factors came into play. The holes in the ground, uprooted and broken trees, or different management practices applied all led to further diversification of surface conditions.
Topsoil was relatively rich in organic matter content, but its thickness was only few cm. The acidic character of humus horizon originates from the granitic nature of the moraine parent material, relatively wet and cool climatic conditions, and the vegetation community. The significant factor contributing to overall acidity of topsoil in the High Tatras is the annual quantity and chemical composition of precipitation waters. SOM, SOC, and nitrogen contents were highly correlated (r ≥ 0.87, p < 0.001), which proves that the prevailing form of soil N is organic. C/N ratio ranged from 17.7 up to 28.4 with the average being equal to 21.8. From 45 soil samples, 41 were classified as sandy loam and in 4 cases the soils were classified as loamy sand according to the USDA-FAO texture triangle [17]

3.2. Soil Water Repellency

WR testing provided results ranging from easily wettable to extremely water repellent. Detected WDPTA values were classified according to the scale proposed by Bisdom et al. [35] as follows: wettable (<5 s, 23), slightly (5–60 s, 2), strongly (60–600 s, 5), severely (600–3600 s, 2), and extremely water repellent (>3600 s, 13 samples). Coefficients of variation calculated for Log WDPTA, Log WDPTP, and MED values were 1.13, 0.61, and 0.71, respectively. Actual and potential WR data (WDPTA, WDPTP, MED) showed significant correlation (r > 0.9, p < 0.001). In general, drying at room temperature led to a certain increase in WR in the majority of initially wettable soils. On the other hand, a decrease in WDPT refers mainly to samples that exhibited considerable repellency in the field-moist state. For the purpose of statistical analysis, we used a zero value for wettable samples that showed WDTP ≤ 1 s (Log 1 = 0).
Although some samples did not exhibit WR either in the moist state or after drying at room temperature, it was found that all soils have the potential to become water repellent when heated. WDPT of all samples increased significantly after heating the soils at 150 °C for 30 min. The observed increase in repellency may be explained by a change in the spatial arrangement of organic molecules, which resulted in coverage of hydrophilic mineral surfaces by organic moieties [36].

3.3. Effect of Basic Soil Properties on WDPT and MED Values

It was found that topsoil moisture detected in the field is closely related to results of WR testing. Similarly as in the previous studies [9,19], also we observed an inverse relation between WDPTA (r = −0.54; p < 0.001), WDPTP (r = −0.47; p < 0.001), or MED values (r = −0.49; p < 0.001) and soil moisture in the field (wF). A positive effect of SOM or SOC contents on the WR was only partially confirmed. Whereas SOM (r = 0.32; p < 0.05) and SOC (r = 0.35; p < 0.05) contents were significantly correlated with MED results, correlation between either of the two variables and WDPT data was insignificant. SOC content was successfully tested as a partial predictor of WDPT or MED values in multiple regression analysis. Testing of the partial regression coefficient associated with SOM content showed that its effect on WR data is negligible. This suggests that besides overall content of SOC, SOM quality may be more important for the occurrence of SWR. The presence and relative amount of specific functional groups bound within SOM, their degree of dissociation, and thermal stability of SOM components are examples of the parameters that may play an important role in SWR development.
The data presented in this study confirmed a general trend of increasing WR with lowering of soil pH (the r values ranged between −0.32 and −0.43; p < 0.05). The studied soils are developed from granitic parent material in a relatively humid and cold climate, under a coniferous tree canopy. In such conditions, formation of SOM with a raw moor-like character is favored. In the surface horizon, there are high amounts of dissociating organic acids which lower the soil reaction. Some of the detected pH values (<4) suggest that the acidic character of the samples is probably also accentuated by dissociation of mineral acids (sulfuric and/or nitric). They enter the topsoil due to amounts of nitrate and sulfate anions contained in atmospheric precipitation. Bowman et al. [37] reported that a decrease in soil pH in the Western Tatras is driven significantly by the deposition from the atmosphere. Acidification of the soil environment is probably causing stabilization of organic inputs which are entering the topsoil. Slower mineralization rates and hence higher amounts of accumulated carbon in the epipedon, as a partial consequence of accelerated soil acidification, have been reported from various forest ecosystems of Northern and Central Europe [38]. This points out that the balance between the rate of accumulation of organic inputs on one hand, and the rate of stabilization or mineralization on the other, may be important for SWR development. A significant negative correlation between WDPT data and soil pH was observed by Mataix-Solera et al. [39] who studied SWR in calcareous soils. An increase in repellency due to soil acidification in the laboratory was reported by Diehl et al. [40].
The results of regression analysis showed that more than one half of WDPT and MED variances can be explained by varying field water and organic carbon contents together with change in soil pH value. Whereas the content of organic carbon affects WR positively, the effect of field moisture and soil pH on repellency is negative. The regression equations suggest that WR varies nonlinearly with soil moisture and, at the same time, changes linearly with soil pH and organic carbon content. Applying either a logarithmic or quadratic relation between field moisture content and SWR in the regression analysis led to better results in comparison to a linear relation. A nonlinear relation between WR and soil moisture was reported previously by Bayer and Schaumann [7] and Goebel et al. [8]. Although the variables, used as predictors, were proved to affect WDPT and MED values significantly, the predictive power of the model itself is lacking. From 38 to 46 % of WDPT and MED variances remained unexplained using basic soil properties as predictors. It is worth noting that logarithmic or quadratic forms used in the regression equations are the statistical approximations, which fitted the data well, but do not represent a physically based relation between soil moisture and WR. Logarithmic or quadratic functions mimic the soil–water characteristic curve, which describes the soil water potential as nonlinear function of soil water content.

3.4. Functional Composition of SOM

Several findings are worth mentioning with respect to results of FTIR spectroscopy. SOM and SOC contents were significantly correlated with the peak areas integrated between 3020 and 2800 cm−1 (Table 3). The r values were equal to 0.87 and 0.84, respectively, which correspond with a <0.001 significance level. This suggests that a substantial part of SOM in samples is probably built by aliphatic structures. At the same time, the correlation is the partial consequence of minimal overlapping of functional groups in this frequency region. Peak areas reflect the relative amount of methyl, methylene, and methine groups only. A significant correlation (r = 0.8, p < 0.001) was observed between the 1505–1560 cm−1 peak area and content of soil N. This is due to various types of amide vibrations occurring in the mentioned frequency region. Soil reaction showed a significant negative correlation with the 1740–1710 cm−1 peak area (r = −0.71, p < 0.001). Apart from esters, the degree of infrared absorption in the 1740–1710 cm−1 band is caused by C=O stretching of carboxylic groups, which contribute to the acidic character of the studied soils. Absorbance in this frequency region partially reflects the amount of dissociating carboxylic acids. A negative correlation between infrared absorption in the 1740–1710 cm−1 range and soil pH has been reported previously by Gondar et al. [41] and Artz et al. [33].
The results of correlation and regression analysis suggest that some frequency bands and associated peak areas had a greater effect on SWR data than the others. For example, the simple correlations between WDPT or MED results and IR absorption in 1740–1710, 1640–1620, and 1560–1505 cm−1 frequency regions were insignificant. At the same time, none of these three bands was successfully tested as a partial predictor in multiple regression analysis. For these bands, a higher degree of overlapping of individual functional groups is characteristic. Vibrations of aromatic rings overlap with vibrations of C=O, C=N, and C-N groups in the case of the 1640–1620 cm−1 and particularly 1560–1505 cm−1 band. Apart from that, an additional factor should be considered when interpreting the FTIR data. The absorbance within individual bands at 1560–1505 and 1740–1710 cm−1 is proportional to the relative amount of carbonyl, carboxyl, and amide groups. Even though these groups themselves are hydrophilic, they are bound amphiphilic compounds, which may contribute to SWR depending on their spatial arrangement. This occurs when the hydrophobic part of the molecule contacts the water and the hydrophilic group is oriented towards the inorganic species or other organic moieties [7,36].
It was found that dissimilarities in WDPT and MED results are associated with the absorbance variation detected mainly in two frequency regions. The correlation and regression analysis confirmed that the relative amount of CH groups affects the WDPT or MED value positively. On the other hand, the strongest negative correlation was observed between WR and absorbance within the frequency region from 1190 to 1135 cm−1. This band was assigned to stretching vibration of the C-O group within structures of alcohols, phenols, anhydrides, ethers, and polysaccharides. Higher relative abundance of C-O groups bound within SOM structures is expected to support a wettable character of soil. By using peak area values associated with these two bands, along with field moisture of topsoil, as the predictors it was possible to explain up to 67 % of WDPT and MED variances. Additionally, 1455–1400 cm−1 and 1475–1460 cm−1 peak areas were successfully tested as partial predictors of WDPTA and MED values that led to a further increase in the R2 value (0.73, Tables S1 and S2).
FTIR peak areas may be used in regression analysis alternatively in the form of an A/B ratio, which expresses the relative content of hydrophobic over hydrophilic groups bound in SOM. The “A” represents the sum of peak areas calculated in IR bands characteristic of vibrations of hydrophobic groups, while “B” expresses the sum of peak areas associated with vibrations of hydrophilic structural units. In this study, the sum of the peak areas calculated within the band Nos. 1, 5, and 7 (Table 1) is represented by A and the sum of the peak areas associated with the five remaining bands is represented by B. The A/B ratio concept was used by Ellerbrock et al. [25] who applied additional transformations of the A/B value to achieve good fit with WR data. The peak areas calculated in eight IR bands showed a normal distribution in all cases, unlike the A/B ratio which showed a lognormal distribution. SWR data and FTIR A/B ratios showed r values ≥ 0.7 when plotted on a logarithmic scale (Figure 3). This, however, pertained mainly to simple correlations. In multiple regression, using either A/B values or their logarithms resulted in very similar R2 values. Apart from A/B ratio, respective peak areas may also be included in regression equations as individual partial predictors. Nevertheless, using the peak areas either as standalone variables or in the form of an A/B ratio had a similar effect on predicted WDPT or MED values, but the general trend in WR change may be visualized more easily when A/B ratio is employed (Figure 4). Selected regression equations, where FTIR peak areas are used as partial predictors of SWR (along with other soil properties), are presented in the Supplementary Material, together with scatter plots displaying observed versus predicted WR data (Tables S1 and S2 and Figures S1 and S2).

3.5. Thermal Stability of SOM

Below 150 °C, the evaporation of residual water takes place, and the thermal degradation of SOM started between 150 and 180 °C. To assess the possible link between SWR and thermal stability of SOM, we analyzed the data recorded between 150 and 600 °C. The studies that used TG in soil analysis (and applied a 10°C min−1 heating rate) reported that SOM degradation starts at around 200 °C [42,43]. Lower temperatures associated with SOM degradation may indicate lower thermal stability of OM in studied soils. This also follows from DTG values that culminated between 275 and 300 °C. The rate of weight loss recorded during the exotherm usually reaches maximum at higher temperatures when topsoil samples are subjected to TG. For example, Dell’Abate et al. [44], who analyzed composts and used a similar experimental setting, reported a maximal rate of weight loss below 300 °C. Similar DTG profiles were observed by Rovira et al. [45], who assessed changes in litter properties during decomposition using TG. This suggests that the studied soils contain a significant portion of raw (thermally labile) OM. It is worth noting that weight loss recorded between 150 and 200 °C may be due to the evaporation of volatile organic substances and not thermal degradation of SOM.
The results of correlation analysis helped to identify the differences in thermal stability of respective organic functional groups. Pearson’s correlation coefficients were calculated to describe the link between FTIR peak areas and DTG data recorded between 150 and 600 °C. The correlations are plotted in Figure 5. Each of the eight graphs expresses the collinearity between the peak area integrated in a given wavenumber interval and the weight loss rate at a specific temperature. A significant positive correlation indicates that the SOM component containing a functional group is thermally modified or degraded at the given temperature. For example, the peak areas associated with three IR bands of CH vibrations showed similar correlation patterns across the temperature scale. These bands include 3020–2800, 1475–1460, and 1395–1365 cm−1. The correlation reached a maximum around 230 °C, which suggests that aliphatic structures, responsible for SWR, are degraded at relatively low temperatures [46]. On the other hand, the r values associated with 1455–1400 and 1190–1135 cm−1 peak areas differed from the previous group. The correlation of 1455–1400 and 1190–1135 cm−1 peak areas and DTG showed maxima at higher temperatures, specifically at 300 and 370 °C. In the case of the 1455–1400 cm−1 band, the absorption is caused by stretching and bending vibrations of carboxylates and also partially by C-O stretching in the phenolic group [47,48]. In the 1190–1135 cm−1 interval, various groups may be detected, and phenolic C-O stretching is one of them [22,34]. These observations suggest that phenolic structural units are more thermally stable in comparison to other aliphatic groups. It also follows from the correlation of the 1560–1530 cm−1 peak that showed r values around 0.7 even at T > 350 °C. Besides amides, the absorption in this band is also partially caused by aromatic C [48]. The positive correlation between 1740–1710 cm−1 peak areas and DTG was significant across a wider temperature range with the r values culminating around 350 °C. This was due the decarboxylation process that started at the beginning of the exotherm and proceeded up to higher temperatures. Depending on the nature of the sample and experimental setting, the temperature interval for SOM decarboxylation may range from 250 up to 370 or even 420 °C [49].
To find out whether TG data are related to WDPT and MED variability, we used an approach similar to that of Siewert [50]. We calculated the mass loss values of the sample that were recorded per 10 °C temperature increase, starting from 150–600 °C and ending with 590–600 °C. This way, the number of possible predictors used in the regression analysis was reduced from 1350 to 45 (sample’s weight was recorded 30 times per minute during TG analysis, which means that within the 150 and 600 °C interval, 1350 values were recorded). Since in the 150–600 °C interval SOM degradation takes place, 45 mass values may be expressed as the portions of SOM (%) in the sample degraded/volatilized per 10 °C. These mass portions of SOM were tested in multiple regression analysis as partial predictors along with soil moisture and FTIR data. A possible link between the degraded SOM portions and WDPT and MED data is indicated in Figure 6, by plotting the correlation coefficients across the 150–600 °C temperature interval. The figure shows that the significance level (p < 0.05) for positive correlation was exceeded at around 250 °C and at higher temperatures above 480 °C. Plotted correlation coefficients give us a hint about degradation of SOM components responsible for WR. Although the r values at temperatures above 480 °C were even higher, it is probable that most hydrophobic SOM components were degraded during the initial stage of exotherm, as this was reported previously [46] and the positive correlation observed >480 °C refers to degradation of carbonaceous residue of these substances.
The statistically explained portion of WDPT and MED variances ranged from 64 up to 73 % when field moisture of topsoil and FTIR data were used as explanatory variables. Using the amounts of SOM that degraded during 10 °C temperature increments as the predictors (along with FTIR and soil moisture data) led to a further increase in the R2 value (up to 0.89). Weight losses recorded in five temperature intervals were successfully tested as partial predictors of WDPT and/or MED values: 150–160, 200–210, 320–330, 340–350, and 440–450 °C. The regression equations are given in Tables S1 and S2. Since the weight loss rate, recorded between 320 and 350 °C, was highly correlated with SOC content in the sample (r > 0.9), it is not surprising that SOM degraded in this temperature interval is positively related to WR data. The interpretation of other regression terms is, however, less straightforward. It is possible that weight loss that occurred at lower temperatures is caused by volatilization of the most labile organic substances, which are polar and hence hydrophilic. This is in accordance with the negative value of the partial regression coefficient associated with these two regression terms. However, this is only a hypothesis that should be verified by further research. The interpretation of the last regression term, associated with weight loss between 440 and 450 °C, is ambiguous, especially with respect to the negative value of the partial regression coefficient. In simple correlation, the weight loss recorded at higher temperature intervals was positively related to WR data, whereas in multiple regression the effect is negative. However, such differences are not uncommon when comparing outputs from simple correlations with the results of a multiple regression approach. In multiple regression analysis, the effect of partial predictors is somehow synergic, and they may compensate one another.

4. Conclusions

The study confirmed that even forest soils in a relatively humid and cold environment may exhibit considerable WR during summer. Spatial variability of SWR was significantly controlled by soil moisture level, soil pH, and SOM characteristics. The results of FTIR spectroscopy showed that the functional composition of SOM in a forest ecosystem may vary even at the plot scale. The variation in SOM quality is probably related to undulating terrain, differences in soil moisture patterns, and the composition of plant cover. The FTIR results suggest that the susceptibility of soil to WR was affected by selective accumulation of aliphatic structural units with respect to other organic functional groups. This followed from multiple regression analysis, in which the integrated FTIR peak areas were tested as partial predictors of SWR. It is worth noting that although not all samples showed WR in a field-moist state or after air drying, all of them exhibited significant WR after moderate heating. This suggests that all soils contained hydrophobic structural units that may cause WR, depending on their spatial arrangement. The results of thermal analysis suggest that OM in studied topsoil is relatively labile, containing a significant portion of accumulated raw OM. This followed from DTG values, which culminated below 300 °C. Similar thermal degradation profiles were observed in the case of partially decomposed litter or nonstabilized composts. This indicates that there is a link between thermal lability of OM in studied soils and their susceptibility to WR. Strongly acidic pH, higher C/N ratio, and coarse soil texture support the accumulation of certain organic inputs, rather than their transformation and SOC stabilization. We observed positive correlation between the amount of SOM degraded around 250 °C and WDPT or MED values, which confirms low thermal stability of substances responsible for SWR. FTIR data and the results of TG analysis helped to increase the explained portion of variances in WR data in the multiple regression analysis. The R2 values ranged from 0.52 up to 0.89, depending on the used predictors. Whereas lower R2 values were characteristic of the equations that used basic soil properties as explanatory variables, the models that used FTIR peak areas, TG data, and soil moisture showed R2 > 0.7.

Supplementary Materials

The following supporting information can be downloaded at: https://www.mdpi.com/article/10.3390/app13010216/s1, Tables S1 and S2: The equations obtained via multiple regression analysis and the parameters characterizing the regression models (R2: coefficient of multiple determination, F: observed value of the F statistic, p: error probability value of F statistics, d.f.: degrees of freedom). Figures S1 and S2: Scatter plots displaying collinearity between observed and predicted SWR data.

Author Contributions

Conceptualization, I.Š. and P.D.; Formal analysis, I.Š., P.D., and Z.F.; Methodology, I.Š. and P.D.; Visualization, I.Š. and Z.F.; Writing—original draft, review and editing, I.Š., P.D. and Z.F.; Funding acquisition, I.Š. and P.D. All authors have read and agreed to the published version of the manuscript.

Funding

This work was supported by the Slovak Scientific Grant Agency (the Ministry of Education, Science, Research and Sport of the Slovak Republic) for VEGA projects No. 1/0712/20 and 2/0147/21.

Data Availability Statement

The data that support the findings of this study are available from the corresponding author on request.

Conflicts of Interest

The authors declare that they have no competing financial interest or personal relationships that are relevant to the content of this article.

References

  1. Morley, C.P.; Mainwaring, K.A.; Doerr, S.H.; Douglas, P.; Llewellyn, C.T.; Dekker, L.W. Organic compounds at different depths in a sandy soil and their role in water repellency. Aust. J. Soil Res. 2005, 43, 239–249. [Google Scholar] [CrossRef]
  2. Dekker, L.W.; Ritsema, C.J. Uneven moisture patterns in water repellent soils. Geoderma 1996, 70, 87–99. [Google Scholar] [CrossRef]
  3. Roper, M.M.; Davies, S.L.; Blackwell, P.S.; Hall, D.J.M.; Bakker, D.M.; Jongepier, R.; Ward, P.R. Management options for water-repellent soils in Australian dryland agriculture. Soil Res. 2015, 53, 786–806. [Google Scholar] [CrossRef]
  4. Shakesby, R.A.; Doerr, S.H. Wildfire as a hydrological and geomorphological agent. Earth-Sci. Rev. 2006, 74, 269–307. [Google Scholar] [CrossRef]
  5. Certini, G. Effects of fire on properties of forest soils: A review. Oecologia 2005, 143, 1–10. [Google Scholar] [CrossRef]
  6. Hewelke, E.; Szatyłowicz, J.; Gnatowski, T.; Oleszczuk, R. Effects of Soil Water Repellency on Moisture Patterns in a Degraded Sapric Histosol. Land Degrad. Dev. 2016, 27, 955–964. [Google Scholar] [CrossRef]
  7. Bayer, J.; Schaumann, G.E. Development of soil water repellency in course of isothermal drying and upon pH changes in two urban soils. Hydrol. Process. 2007, 21, 2266–2275. [Google Scholar] [CrossRef]
  8. Goebel, M.-O.; Bachmann, J.; Woche, S.K.; Fischer, W.R.; Horton, R. Water potential and aggregate size effects on contact angle and surface energy. Soil Sci. Soc. Am. J. 2004, 68, 383–393. [Google Scholar] [CrossRef]
  9. Täumer, K.; Stoffregen, H.; Wessolek, G. Determination of repellency distribution using soil organic matter and water content. Geoderma 2005, 125, 107–115. [Google Scholar] [CrossRef]
  10. Kořenková, L.; Šimkovic, I.; Dlapa, P.; Juráni, B.; Matúš, P. Identifying the origin of soil water repellency at regional level using multiple soil characteristics: The White Carpathians and Myjavska pahorkatina Upland case study. Soil Water Res. 2015, 10, 78–89. [Google Scholar] [CrossRef]
  11. Zornoza, R.; Guerrero, C.; Mataix-Solera, J.; Scow, K.M.; Arcenegui, V.; Mataix-Beneyto, J. Near infrared spectroscopy for determination of various physical, chemical and biochemical properties in Mediterranean soils. Soil Biol. Biochem. 2008, 40, 1923–1930. [Google Scholar] [CrossRef] [PubMed] [Green Version]
  12. Summers, D.; Lewis, M.; Ostendorf, B.; Chittleborough, D. Visible near-infrared reflectance spectroscopy as a predictive indicator of soil properties. Ecol. Indic. 2011, 11, 123–131. [Google Scholar] [CrossRef]
  13. Hermansen, C.; Knadel, M.; Moldrup, P.; Greve, M.H.; Karup, D.; de Jonge, L.W. Complete Soil Texture is Accurately Predicted by Visible Near-Infrared Spectroscopy. Soil Sci. Soc. Am. J. 2017, 81, 758–769. [Google Scholar] [CrossRef]
  14. Negri, S.; Stanchi, S.; Celi, L.; Bonifacio, E. Simulating wildfires with lab-heating experiments: Drivers and mechanisms of water repellency in alpine soils. Geoderma 2021, 402, 115357. [Google Scholar] [CrossRef]
  15. Šimkovic, I.; Dlapa, P.; Šimonovičová, A.; Ziegler, W. Water Repellency of Mountain Forest Soils in Relation to Impact of the Katabatic Windstorm and Subsequent Management Practices. Pol. J. Environ. Stud. 2009, 18, 443–454. [Google Scholar]
  16. Soil Survey Staff. Keys to Soil Taxonomy, 10th ed.; NRCS: Washington, DC, USA, 2006. [Google Scholar]
  17. FAO. Guidelines for Soil Description, 4th ed.; Food and Agriculture Organization of the United Nations: Rome, Italy, 2006. [Google Scholar]
  18. Doerr, S.H. On standardizing the Water Drop Penetration Time and the Molarity of an Ethanol Droplet technique to classify soil hydrophobicity: A case study using medium textured soils. Earth Surf. Process. Landf. 1998, 23, 663–668. [Google Scholar] [CrossRef]
  19. Dekker, L.W.; Doerr, S.H.; Oostindie, K.; Ziogas, A.K.; Ritsema, C.J. Water repellency and critical soil water content in a dune sand. Soil Sci. Soc. Am. J. 2001, 65, 1667–1674. [Google Scholar] [CrossRef]
  20. Doerr, S.H.; Shakesby, R.A.; Dekker, L.W.; Ritsema, C.J. Occurrence, prediction and hydrological effects of water repellency amongst major soil and land-use types in a humid temperate climate. Eur. J. Soil Sci. 2006, 57, 741–754. [Google Scholar] [CrossRef]
  21. Madejová, J.; Komadel, P. Baseline studies of the Clay Minerals Society source clays: Infrared methods. Clays Clay Min. 2001, 49, 410–432. [Google Scholar] [CrossRef]
  22. Stuard, B. Infrared Spectroscopy: Fundamentals and Applications; John Wiley & Sons: Hoboken, NJ, USA, 2004. [Google Scholar]
  23. Stevenson, F.J. Humus Chemistry. Genesis, Composition, Reactions, 2nd ed.; Wiley: New York, NY, USA, 1994. [Google Scholar]
  24. Capriel, P.; Beck, T.; Borchert, H.; Gronholz, J.; Zachmann, G. Hydrophobicity of organic matter in arable soils. Soil Biol. Biochem. 1995, 28, 1453–1458. [Google Scholar] [CrossRef]
  25. Ellerbrock, R.H.; Gerke, H.H.; Bachmann, J.; Goebel, M.-O. Composition of organic matter fractions for explaining wettability of three forest soils. Soil Sci. Soc. Am. J. 2005, 69, 57–66. [Google Scholar] [CrossRef]
  26. Filip, Z.; Pechner, W.; Berthelin, J. Microbial utilization and transformation of humic acids extracted from different soils. J. Plant Nutr. Soil Sci. 1999, 162, 215–222. [Google Scholar] [CrossRef]
  27. Ribeiro, J.S.; Sonay, S.O.; Garrigues, S.; de la Guardia, M. FTIR tentative characterization of humic acids extracted from organic materials. Spectr. Lett. 2001, 34, 179–190. [Google Scholar] [CrossRef]
  28. Smidt, E.; Eckhardt, K.U.; Lechner, P.; Schulten, H.R.; Leinweber, P. Characterization of different decomposition stages of biowaste using FT-IR spectroscopy and pyrolysis-field ionization mass spectrometry. Biodegradation 2005, 16, 67–79. [Google Scholar] [CrossRef] [PubMed]
  29. Pietikäinen, J.; Hiukka, R.; Fritze, H. Does short-term heating of forest humus change its properties as a substrate for microbes? Soil Biol. Biochem. 2000, 32, 277–288. [Google Scholar] [CrossRef]
  30. Tatzber, M.; Stemmer, M.; Spiegel, H.; Katzlberger, C.; Haberhauer, G.; Mentler, A.; Gerzabek, M.H. FTIR-spectroscopic characterization of humic acids and humin fractions obtained by advanced NaOH, Na4P2O7, and Na2CO3 extraction procedures. J. Plant Nutr. Soil Sci. 2007, 170, 522–529. [Google Scholar] [CrossRef]
  31. Carballo, T.; Gil, M.V.; Gómez, X.; González-Andréz, F.; Morán, A. Characterization of different compost extracts using Fourier-transform infrared spectroscopy (FTIR) and thermal analysis. Biodegradation 2008, 19, 815–830. [Google Scholar] [CrossRef]
  32. Hollas, J.M. Modern Spectroscopy, 4th ed.; John Wiley & Sons: Hoboken, NJ, USA, 2004; p. 452. [Google Scholar]
  33. Artz, R.R.E.; Chapman, S.J.; Robertson, A.H.J.; Potts, J.M.; Laggoun-Défarge, F.; Gogo, S.; Comont, L.; Disnar, J.-R.; Francez, A.-J. FTIR spectroscopy can be used as a screening tool for organic matter quality in regenerating cutover peatlands. Soil Biol. Biochem 2008, 40, 515–527. [Google Scholar] [CrossRef]
  34. Silverstein, R.M.; Webster, F.X.; Kiemle, D.J. Spectrometric Identification of Organic Compounds, 7th ed.; John Wiley & Sons: Hoboken, NJ, USA, 2005; p. 502. [Google Scholar]
  35. Bisdom, E.B.A.; Dekker, L.W.; Schoute, J.F.T. Water repellency of sieve fractions from sandy soils and relationships with organic material and soil structure. Geoderma 1993, 56, 105–118. [Google Scholar] [CrossRef]
  36. Ma’shum, M.; Farmer, V.C. Origin and assessment of water-repellency of a sandy Australian soil. Aust. J. Soil Res. 1985, 23, 623–626. [Google Scholar] [CrossRef]
  37. Bowman, W.D.; Cleveland, C.C.; Halada, Ľ.; Hreško, J.; Baron, J.S. Negative impact of nitrogen deposition on soil buffering capacity. Nat. Geosci. 2008, 1, 767–770. [Google Scholar] [CrossRef]
  38. Prietzel, J.; Stetter, U.; Klemmt, H.-J.; Rehfuess, K.E. Recent carbon and nitrogen accumulation and acidification in two Scots pine ecosystems in Southern Germany. Plant Soil 2006, 289, 153–170. [Google Scholar] [CrossRef]
  39. Mataix-Solera, J.; Arcenegui, V.; Guerrero, C.; Mayoral, A.M.; Morales, J.; González, J.; García-Orenes, F.; Gómez, I. Water repellency under different plant species in a calcareous forest soil in a semiarid Mediterranean environment. Hydrol. Process. 2007, 21, 2300–2309. [Google Scholar] [CrossRef]
  40. Diehl, D.; Bayer, J.V.; Woche, S.K.; Bryant, R.; Doerr, S.H.; Schaumann, G.E. Reaction of soil water repellency on artificially induced changes in soil pH. Geoderma 2010, 158, 375–384. [Google Scholar] [CrossRef]
  41. Gondar, D.; Lopez, R.; Fiol, S.; Antelo, J.M.; Arce, F. Characterization and acid-base properties of fulvic and humic acids isolated from two horizons of an ombrotrophic peat bog. Geoderma 2005, 126, 367–374. [Google Scholar] [CrossRef]
  42. Dell’Abate, M.T.; Canali, S.; Trinchera, A.; Benedetti, A.; Sequi, P. Thermal method of organic matter maturation monitoring during composting process. J. Therm. Anal. Calorim. 2000, 61, 389–396. [Google Scholar] [CrossRef]
  43. Plante, A.F.; Pernes, M.; Chenu, C. Changes in clay-associated organic matter quality in a C depletion sequence as measured by differential thermal analyses. Geoderma 2005, 129, 186–199. [Google Scholar] [CrossRef]
  44. Dell’Abate, M.T.; Canali, S.; Trinchera, A.; Benedetti, A.; Sequi, P. Thermal analysis in the evaluation of compost stability: A comparison with humification parameters. Nutr. Cycl. Agroecosystems 1998, 51, 217–224. [Google Scholar] [CrossRef]
  45. Rovira, P.; Kurz-Besson, C.; Couteaux, M.M.; Vallejo, V.R. Changes in litter properties during decomposition: A study by differential thermogravimetry and scanning calorimetry. Soil Biol. Biochem. 2008, 40, 172–185. [Google Scholar] [CrossRef]
  46. Simkovic, I.; Dlapa, P.; Doerr, S.H.; Mataix-Solera, J.; Sasinkova, V. Thermal destruction of soil water repellency and associated changes to soil organic matter as observed by FTIR spectroscopy. Catena 2008, 74, 205–211. [Google Scholar] [CrossRef]
  47. Gressel, N.; Inbar, Y.; Singer, A.; Chen, Y. Chemical and spectroscopic properties of leaf litter and decomposed organic matter in the Carmel Renge, Israel. Soil Biol. Biochem. 1995, 27, 23–31. [Google Scholar] [CrossRef]
  48. Madari, B.E.; Reeves, J.B.; Machado, P.L.O.A.; Guimaraes, C.M.; Torres, E.; McCarty, G.W. Mid- and near-infrared spectroscopic assessment of soil compositional parameters and structural indices in two Ferralsols. Geoderma 2006, 136, 245–259. [Google Scholar] [CrossRef]
  49. Plante, A.F.; Fernández, J.M.; Leifeld, J. Application of thermal analysis techniques in soil science. Geoderma 2009, 153, 1–10. [Google Scholar] [CrossRef]
  50. Siewert, C. Rapid Screening of Soil Properties using Thermogravimetry. Soil Sci. Soc. Am. J. 2004, 68, 1656–1661. [Google Scholar] [CrossRef]
Figure 1. Location of three experimental sites (T1, T2, and T3) where 45 topsoil samples were taken. Photographs on the right display the conditions at the three sites two years after the windstorm.
Applsci 13 00216 g001
Figure 2. Illustration of peak area integration in 8 infrared bands.
Applsci 13 00216 g002
Figure 3. Scatter plots showing general collinearity between SWR data and FTIR A/B ratio. The term A represents the sum of the peak areas integrated within the band Nos. 1, 5, and 7 (Table 1) and sum of the peak areas associated with 5 remaining bands (Nos. 2–4 and 6–8 in Table 1) are represented by B.
Applsci 13 00216 g003
Figure 4. Two grids showing general trend in MED value change as a result of soil moisture (wF), FTIR A/B ratio, and soil pH variation. In each of the two graphs, a fixed pH value is used for the prediction (3.21 in the upper and 4.08 in the lower panel; these represent the lowest and the highest detected pH values among 45 topsoil samples). Used regression equation: MED = −2.93 Log wF + 0.35 (A/B)–1.46 pH + 10.43 (R2 = 0.71, F = 33.39, p = 2.51 10−21, d.f = 41).
Applsci 13 00216 g004
Figure 5. Correlations (Pearson’s) between FTIR peak areas and the rate of weight loss (DTG) recorded in 150 and 500 °C interval (0.29; 0.38; 0.47 values correspond to p < 0.05; 0.01; and 0.001 significance level).
Applsci 13 00216 g005
Figure 6. Correlation (Pearson’s) between SWR data and mass portions of SOM degraded/volatilized per 10 °C interval (0.29; 0.38; 0.47 values correspond to p < 0.05; 0.01; and 0.001 significance level).
Applsci 13 00216 g006
Table 1. Selected IR bands in which the peak areas were calculated. Based on the polarity of bonds, the effect of functional groups on SWR is indicated in the last row.
Band No.12345678
Wavenumbers3020–2800 cm−11740–1710 cm−11640–1620 cm−11560–1505 cm−11475–1460 cm−11455–1400 cm−11395–1365 cm−11190–1135 cm−1
Assignment2960 cm−1: methyl symmetric C-H stretching; 2930 cm−1: methylene asymmetric C-H stretching; 2870 cm−1: methyl asymmetric C-H stretching; 2850 cm−1: methylene symmetric C-H stretchingC=O stretching of carboxyl and carbonyl group contained in carboxylic acids, aldehydes, ketones, estersprimary amide NH2 bending plus C=O stretch in amides, quinones, and/or H-bonded conjugated ketones, carboxylates, C=N, and aromatic C=C cannot be ruled out, lignocellulose1560–1530 cm−1: secondary amide N-H bending (NH2 or NH bending), C-N stretching, 1590–1517 cm−1: C=O in COO, 1520 cm−1: C=O of amide, 1650–1550 cm−1: aromatic Cmethylene scissoring and methyl asymmetrical CH bending1430 cm−1: C-O-H in-plane bending, 1426 cm−1: symmetric C-O stretch from COO or stretch and OH deformation of carboxylates, 1450 cm−1: aliphatic C-H of CH2symmetric and in-plane bending of CH3 group at around 1380 cm−1, 1388 cm−1: OH deformation and C-O stretch (phenolics)1000–1260 cm−1: C-O stretching vibration in alcohols and phenols; 1150–1085 cm−1: C-O-C stretching in ethers and polysaccharides (1160 cm−1); 1100–1300 cm−1: C-O stretching in anhydrides; 1100–1300 cm−1: aliphatic C-O stretching in esters
Reference[22,23,24,25][26,27,28][22,26,27,29][22,26,27,28,29,30,31][22,23,26][22,28,30,31,32,33] [22,26,32][22,27,28,34]
The effect on soil wettabilityhydrophobichydrophilichydrophilicrather hydrophilichydrophobicrather hydrophilicrather hydrophobichydrophilic
Table 2. Basic soil properties and SWR data for 45 samples (T1 site: samples 1–15, T2 site: samples 16–30, T3 site: samples 31–45).
Sample No.WDPTA sWR ClassificationWDPTP sMED mol L−1wF %SOM g kg−1SOC g kg−1N g kg−1Sand %Silt %Clay %pH
1<1wettable450.8770.97170.381.94.7459.9031.708.403.75
22wettable9332.1136.93140.467.33.1869.2922.478.243.83
3200strongly WR14132.4838.41173.086.93.7071.2121.986.813.69
442,658extremely WR43,6523.2126.76162.778.63.6566.6923.1510.163.70
518,197extremely WR12,0232.4820.6596.148.41.8764.7424.6510.613.58
6<1wettable140.5248.90167.979.94.4762.1225.9711.913.83
728slightly WR15492.1139.16198.7103.55.5765.2624.0010.743.85
8<1wettable1951.2247.36168.682.64.4366.0025.028.983.73
94365extremely WR30201.7544.55120.256.22.7270.8719.219.923.93
10<1wettable721.0457.43181.991.64.8160.3531.318.343.56
11<1wettable1911.4044.05154.174.44.1463.8524.9711.183.73
12<1wettable<1026.1490.140.21.5263.4925.1211.393.88
1343,652extremely WR43,6522.8426.62136.768.43.4061.9826.0711.953.87
14<1wettable30.1748.84118.460.02.8568.5823.727.703.75
15<1wettable<1030.8784.539.31.5069.9720.369.674.08
168511extremely WR13,1832.8457.69276.0160.98.5870.9922.146.873.59
1743,652extremely WR43,6523.2119.76164.967.93.0067.0022.9310.073.72
1820,417extremely WR32,3593.9643.00219.0113.95.1964.1725.0510.783.35
196607extremely WR85113.4048.91244.6120.75.9060.5127.7011.793.25
2043,652extremely WR38,0193.9625.25210.478.13.5965.7723.6510.583.49
2143,652extremely WR26,9153.5834.15230.5123.45.6266.1924.888.933.31
2222,387extremely WR15142.6640.60189.384.34.1270.6219.3810.003.53
2343,652extremely WR33,1133.5831.94219.6108.24.5263.9424.9111.153.26
24437strongly WR18202.8433.99165.183.74.1975.3317.327.353.41
25955severely WR15142.8455.09289.4155.96.7361.6526.2912.063.21
26724severely WR5752.4844.47165.080.74.0078.4114.497.103.77
27126strongly WR15142.1137.36161.177.43.1979.2015.295.513.75
28<1wettable30.1754.11208.9104.05.3478.4516.654.903.77
29257strongly WR9332.4858.03213.4104.64.9081.5311.886.593.53
303890extremely WR27542.8442.12205.698.35.1368.6323.687.693.52
31<1wettable280.5271.85197.4102.05.5568.1821.869.963.77
32<1wettable80.3470.25240.890.54.0958.7029.4811.823.44
33<1wettable60.3459.45147.373.43.4369.0121.359.643.73
34<1wettable140.6950.63144.470.83.3175.6117.976.423.88
35<1wettable2821.40107.4146.775.33.1063.0327.289.693.75
3621slightly WR8322.1116.48207.1106.35.7472.5018.558.953.62
37<1wettable90.3464.76236.4100.44.8961.6828.1110.213.40
38<1wettable261.4044.18205.1105.65.6571.8819.608.523.78
39<1wettable50.3446.88158.169.63.0063.5928.757.663.67
40<1wettable30.3454.92173.380.63.3957.3332.4910.183.56
41<1wettable130.5284.79178.393.95.0066.3626.017.633.44
42<1wettable210.6997.00215.9116.66.3673.3718.328.313.51
4389strongly WR10962.4844.68179.893.64.2366.6425.138.233.47
44<1wettable130.6960.88193.099.84.3069.9521.328.733.58
45<1wettable30.3471.35172.9109.44.9162.6928.368.953.46
WDPTA, actual WR; WDPTP, potential WR; MED, molarity of ethanol droplet; wF, topsoil water content in the field; SOM, soil organic matter; SOC, soil organic carbon.
Table 3. Correlations (r values and corresponding p < 0.05 *, 0.01 **, and 0.001 *** significance levels) between FTIR peak areas integrated in eight frequency intervals (cm−1), SWR data (WDPT, MED), and basic soil properties.
3020–28001740–17101640–16201560–15051475–14601455–14001395–13651190–1135
Log WDPTA0.29 *−0.02−0.040.060.31 *−0.40 **0.37 *−0.51 ***
Log WDPTP0.260.00−0.130.140.21−0.260.35 *−0.51 ***
MED0.34 *0.08−0.080.160.28−0.29 *0.44 **−0.48 ***
wF0.230.36 *0.250.240.070.37 *0.040.49 ***
SOM0.87 ***0.72 ***0.66 ***0.68 ***0.77 ***0.31 *0.81 ***0.12
SOC0.81 ***0.65 ***0.50 ***0.75 ***0.67 ***0.41 **0.68 ***0.18
pH−0.71 ***−0.75 ***−0.51 ***−0.46 **−0.63 ***−0.01−0.55 ***−0.14
Sand−0.14−0.22 *−0.25 *−0.07−0.17−0.03−0.10−0.1
Silt 0.140.21 *0.280.080.150.050.080.17
Clay0.110.150.0700.14−0.030.11−0.12
WDPTA, actual WR; WDPTP, potential WR; MED, molarity of ethanol droplet; wF, topsoil water content in the field; SOM, soil organic matter; SOC, soil organic carbon.
Disclaimer/Publisher’s Note: The statements, opinions and data contained in all publications are solely those of the individual author(s) and contributor(s) and not of MDPI and/or the editor(s). MDPI and/or the editor(s) disclaim responsibility for any injury to people or property resulting from any ideas, methods, instructions or products referred to in the content.

