Communication

HGF Spatial–Spectral Fusion Method for Hyperspectral Images

1
School of Surveying and Geo-Informatics, Shandong Jianzhu University, Jinan 250101, China
2
School of Geography and Ocean Science, Nanjing University, Nanjing 210023, China
*
Author to whom correspondence should be addressed.
Appl. Sci. 2023, 13(1), 34; https://doi.org/10.3390/app13010034
Submission received: 29 November 2022 / Revised: 16 December 2022 / Accepted: 18 December 2022 / Published: 20 December 2022
(This article belongs to the Special Issue Novel Approaches for Remote Sensing Image Processing)

Abstract

:
Quantitative studies on surface elements require satellite hyperspectral images with high spatial resolution. The identification of different surface elements requires different characteristic bands and their corresponding optimal spatial–spectral fusion methods. To address these problems, the harmonic analysis (HA), guided filtering, and Gram–Schmidt (GS) algorithms were integrated to propose a spatial–spectral fusion method called HGF. The fusion experiment and validation of the hyperspectral images of GaoFen-5 (GF-5) and ZY1-02D were conducted separately using the HGF method, and the fusion effect was evaluated in three band intervals according to the spectral response of the ground class. First, HGF was used to fuse the GF-5 and GaoFen-1 (GF-1) images, and the fusion effect was evaluated both qualitatively and quantitatively. Second, the optimal fusion method was selected for the corresponding characteristic bands of the different surface elements. Finally, the hyperspectral image obtained by ZY1-02D and multispectral image of Sentinel-2B were used for validation to improve the accuracy and efficiency of satellite hyperspectral images in quantitative studies. The results show that for further studies on soil, vegetation, and water bodies, the best fusion methods in the 390–730, 730–1400, and 1400–2260 nm intervals are the GS, HGF, and HGF algorithms, respectively. Further analysis showed that the HGF or GS methods can be selected for quantitative studies on vegetation and water bodies and that the HGF method exhibits outstanding advantages for quantitative analysis of each soil element.

1. Introduction

Advances in remote sensing technology are helpful in the timely acquisition of remote sensing data, especially for hyperspectral images, such as Hyperion, HJ-1A, Gaofen-5 (GF-5), and ZY1-02D. However, it is very difficult for satellite-based hyperspectral image to have both high spatial and spectral resolution. This limitation is an impediment in the development of earth observation technology and hinders quantitative monitoring of surface elements. To alleviate the contradiction between the spatial and spectral resolutions of satellite imaging systems, scholars have applied spatial–spectral fusion techniques and related theoretical methods to remote sensing image data. These techniques can generate remote sensing images with high spatial and spectral resolution, thereby achieving more comprehensive and accurate land surface monitoring [1].
Traditional methods for image fusion include component replacement, multiresolution analysis, and Bayesian matrix decomposition. The most used component replacement techniques are hue saturation intensity, principal component analysis (PCA), and the Gram–Schmidt (GS) adaptive algorithm. Common multiresolution analysis methods include intensity modulation based on a smoothing filter and MTF-GLP-HPM. Image fusion algorithms based on matrix decomposition include nonnegative matrix decomposition and coupled nonnegative matrix decomposition, whereas common Bayesian algorithms include Bayesian sparsity. Numerous studies have found that between the two most commonly used methods, component replacement and multiresolution analysis fusion, the latter exhibits better spectral fidelity [2]. Subsequently, scholars performed the fusion of panchromatic and hyperspectral images based on a model with mixed pixel decomposition [3]. With the rapid increase in the spatial resolution of satellite-based images, the ratio in the spatial resolution of images has gradually increased. To effectively integrate the spatial and spectral information of images with large spatial resolution differences, a strategy of stepwise fusion has been proposed with the help of images that exhibit similar spatial resolutions [4]. In recent years, deep learning methods have shown excellent application prospects and are widely used in the fusion of hyperspectral images [5,6,7]. Although these methods require a large number of training samples, they can be trained in an unsupervised manner [8,9]. In 2013, Yang et al. first used the harmonic analysis method to detect small target information in hyperspectral images [10]. From the perspective of the spectral curve of a single image element, better results have been achieved through the fusion of panchromatic and hyperspectral image data from the same satellite as compared to the traditional component replacement method combined with harmonic analysis techniques [11,12]. Based on the research of Yang et al. (2014) [11], Zhang et al. (2015) [12] found that the combination of harmonic analysis and GS transform methods can reduce the pixel gray difference between the harmonic residual terms obtained from the decomposition of high-spatial-resolution images and hyperspectral images.
Further analysis reveals that the above algorithms and models are mainly used for feature interpretation [1,13,14,15] and that their application to the quantification of surface elements needs to be explored further. A quantitative study of surface elements requires hyperspectral satellite images with high spatial resolution and spectral fidelity. The optimal image fusion methods and their applicable wavelength intervals differ in the various studies conducted on surface elements. Therefore, the construction of an efficient hyperspectral satellite image fusion model that can be used on satellite data is crucial, considering the need for quantitative studies on different surface elements.
In this study, an image fusion model (HGF) was constructed by employing harmonic analysis (HA), guided filtering (GF), and Gram–Schmidt (GS) transform, aiming to perform the fusion of panchromatic–hyperspectral images. By analyzing and comparing the evaluation metrics of the processing results from different fusion algorithms at different wavelength intervals, we determined the optimal fusion model for monitoring surface elements such as soil, vegetation, and water. Our exploration contributes to the high-quality application of hyperspectral satellite images for quantitative inversion of surface elements.

2. HGF Model

Figure 1 shows the spatial–spectral fusion model (called HGF) constructed in this study, which mainly involves the following steps: (1) harmonic decomposition of hyperspectral images to obtain the harmonic amplitude, phase, and residual term; (2) GS transformation of the harmonic residual term of hyperspectral images and multispectral bands of high-spatial-resolution images to obtain the fused data of the residual term; (3) reconstruction of the fused residual term, harmonic amplitude, and phase, and the implementation of optimization using a guided filtering to obtain fused images; and (4) evaluation of the accuracy of the fused image in three spectral intervals and four feature elements.

2.1. Data and Preprocessing

The 30 m resolution hyperspectral images used in this study were obtained by the GF-5 and ZY1-02D satellites, with 330 and 166 spectral bands, respectively. The multispectral images were obtained by the Gaofen-1 (GF-1) and Sentinel-2B satellites. The spatial resolution of multispectral bands for the former is 8 m and the latter is 10 m. The basic information of the image is shown in Table 1. Considering that multisensor images may have some differences in sensor attitude, angle, atmospheric conditions, acquisition time, and other aspects, it is necessary to conduct geometric and radiation normalization for multisensor remote sensing images [2]. Images from different sensors were processed with radiometric correction, orthorectification, and geometric correction.

2.2. Fusion Algorithm of Hyperspectral Images

The HA of a spectrum can be approximated as a representation of a spectral curve as a superposition of sine (cosine) curves [11]. In particular, the HA of a spectrum is the decomposition of a spectral curve into several spectra of different frequencies, which are multiples of a basic frequency, that are then superimposed to represent the original spectrum. In other words, HA first decomposes the spectrum and then reconstructs it. Based on the Fourier expansion of a periodic waveform, for the image element spectral curves in hyperspectral remote sensing images, the transform expansion can be expressed as a Fourier series:
x ( n ) = A 0 2 + h = 1 [ A h cos ( 2 h π n / L ) + B h sin ( 2 h π n / L ) ] = A 0 2 + h = 1 C h sin ( 2 h π n / L + φ h )
where Chsin(2hπn/L + φh) is the hth harmonic component, and Ah, Bh, Ch, and φh are calculated as follows:
A h = 2 L n = 1 L x ( n ) cos ( 2 h π n / L ) B h = 2 L n = 1 L x ( n ) sin ( 2 h π n / L ) C h = A h 2 + B h 2 φ h = arctan ( A h / B h )
where x(n) is the discrete spectral curve, n is the band number, L is the total number of bands, A0/2 represents the harmonic residual term, h represents the number of decompositions and its value range is 0–151, Ch represents the amplitude of the hth harmonic component, φh represents the phase of the hth harmonic component, and the spectral curve dimension equals W = 2h + 1 after harmonic transformation.
From the above equation, it can be observed that each element spectrum is a superposition of a series of sine (cosine) component curves, and each sine (cosine) curve is composed of the harmonic residual term A0/2, amplitude Ch, and phase φh. According to the equation (1), A0/2 is a constant that does not affect the waveform of the spectral curve. It is the integrated response of the feature to the reflection of electromagnetic waves and contains the spatial information of the image. Replacing the high-spatial-resolution image with A0/2 for harmonic reconstruction inversion can realize spatial–spectral fusion. However, there is a large difference between the high-spatial-resolution image and the gray value of the φh image element.
Therefore, the fusion of A0/2 and high-spatial-resolution images is performed using the GS transform to improve the spatial resolution of A0/2 while rendering the gray value of image elements of the GS-transform-fused images closer to A0/2. Then, the GS-transform-fused image, Ch, and φh are harmonic-reconstructed and inverted to complete the fusion of hyperspectral and high-spatial-resolution images that are closer to the real feature spectral reflectance.

2.3. Guided Filtering

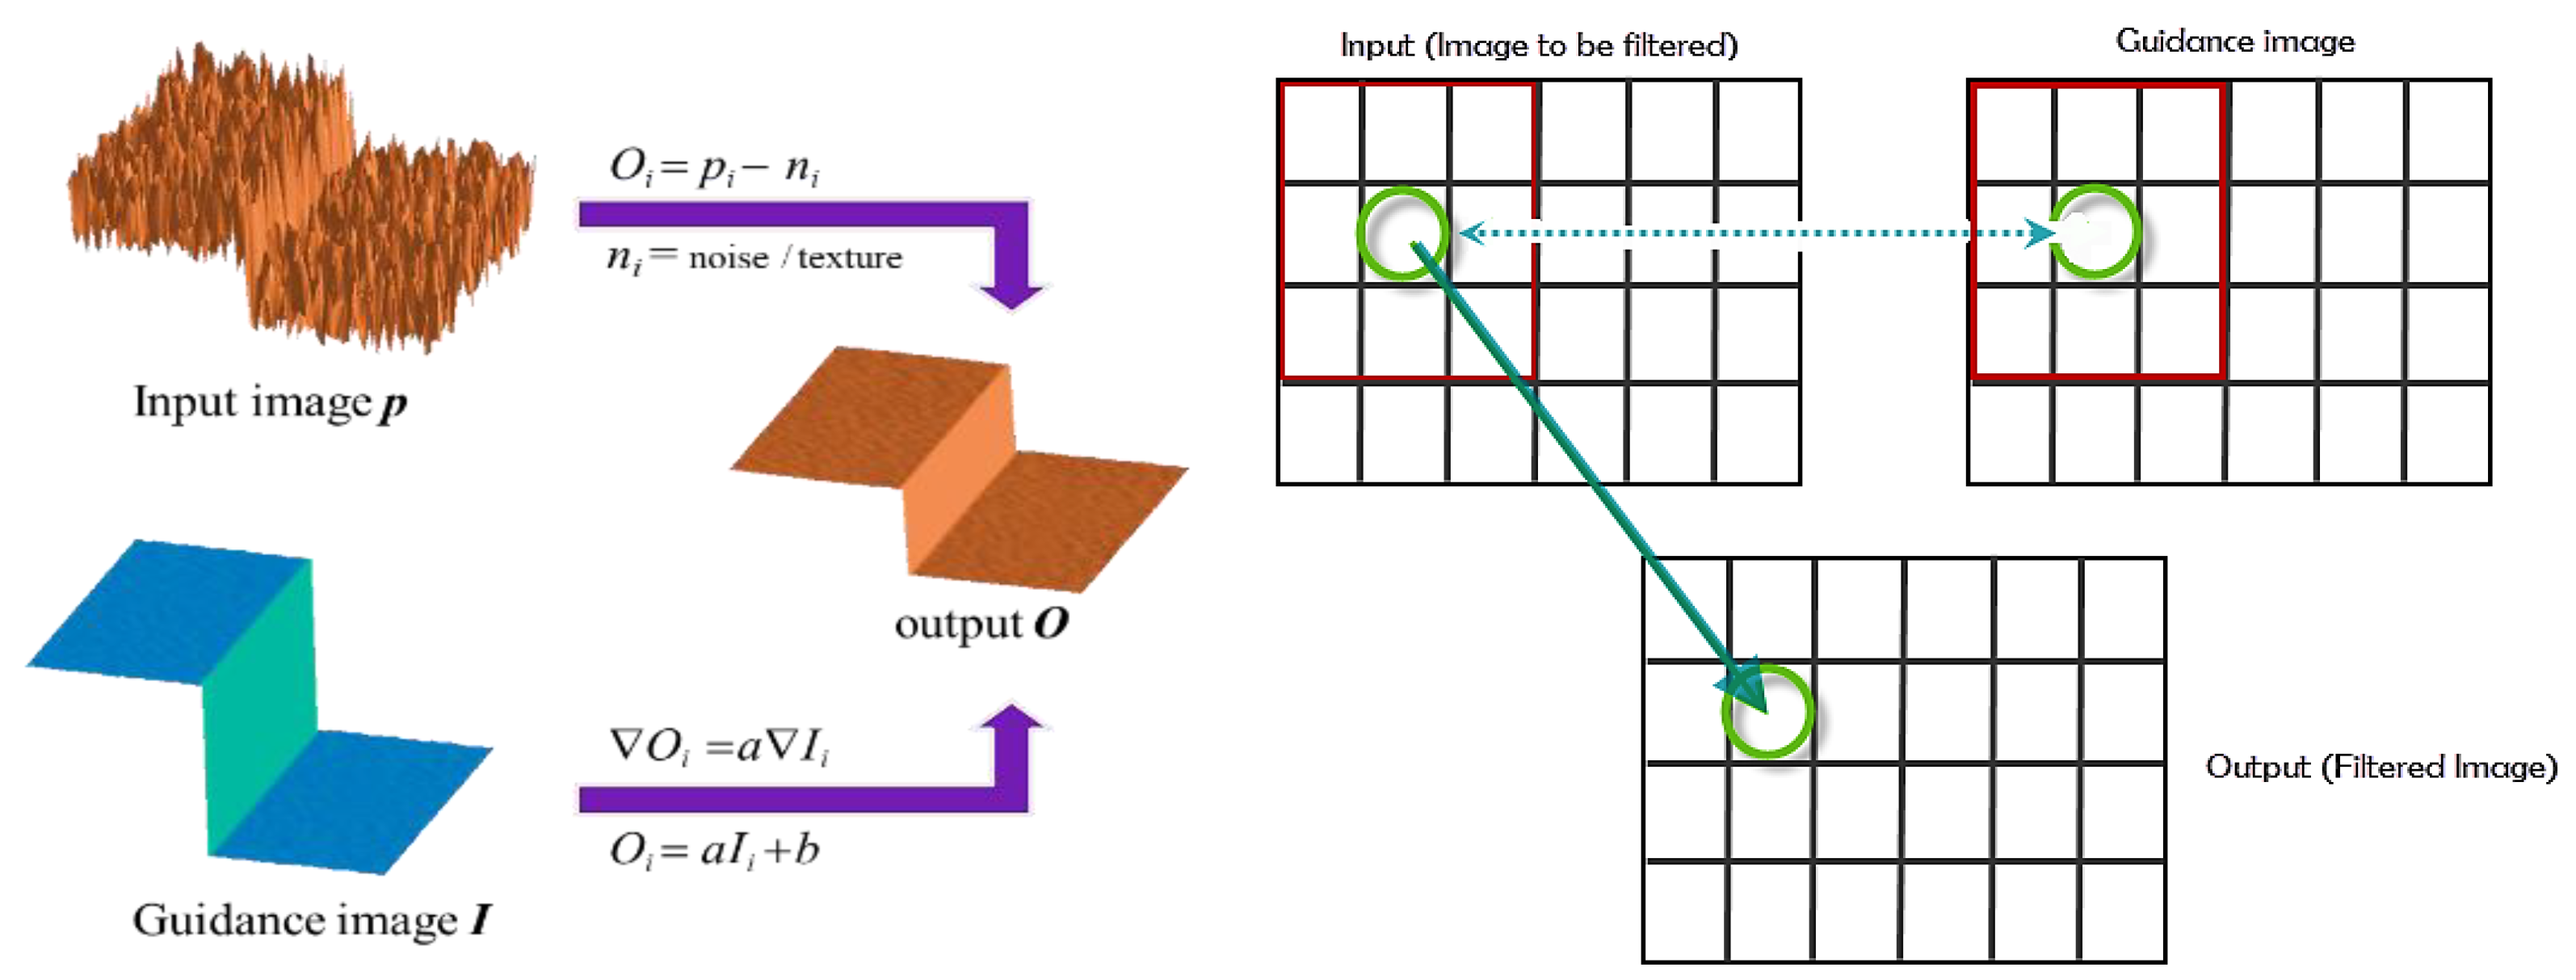
The guided filter not only attenuates the noise but also preserves the edge when the guided image is the original image (Figure 2). Thus, it is an edge-preserving filter. Furthermore, it has applications in image fusion [16,17], image enhancement [18], target detection [19], defogging, and classification [20]. The principle of the guided filter is as follows:
For an input image p, the output image O is obtained after filtering using the guiding image I, which acts as the guided filter. For a pixel point at position i, the filtered output is a weighted average, and the guided filter can be represented using the following equation:
O i = j W i j ( I ) p j
where i and j denote the pixel subscripts, and Wij is the filter kernel associated only with the guided image I. The filter is linear with respect to p.
An important assumption of the guided filter is that there is a local linear relationship between the output image O and the guided image I over a window wk centered at pixel k.
O i = a k I i + b k i w k
where wk is a square window of size (2r + 1) × (2r + 1), i denotes the pixel index, and ak and bk are coefficients that remain constant in the window wk.

2.4. Evaluation Metrics

When evaluating hyperspectral image fusion accuracy, the evaluation metrics are broadly divided into two categories: spatial information incorporation and spectral information fidelity. Spatial information incorporation includes the correlation coefficient (CC), standard deviation (STD), peak signal-to-noise ratio (PSNR), structural similarity, relative global error, etc. Spectral information fidelity includes the spectral angle (SAM), deviation index, etc. To verify the effectiveness of the image fusion algorithm, we evaluated both qualitative and quantitative aspects. Qualitative evaluation was performed using the visual effect, and quantitative evaluation was performed by employing the original hyperspectral image as the standard. Four indexes were used for this evaluation: CC, STD, PSNR, and SAM. The evaluation of the indicators showed that the fused image had richer gray levels and information content, clearer spatial texture information, and better spectral fidelity [2,16]. The four indexes were calculated as follows:
CC is an objective evaluation index reflecting the correlation between the fused image and the ideal reference image.
CC ( I H , I W ) = i = 1 M j = 1 N ( I H ( i , j ) I H ¯ ) ( I W ( i , j ) I W ¯ ) i = 1 M j = 1 N ( I H ( i , j ) I H ¯ ) 2 × i = 1 M j = 1 N ( I W ( i , j ) I W ¯ ) 2
where M and N represent the height and width of the fused image, respectively; IH(i, j) and IW(i, j) are the pixel gray values of the fused image and the ideal reference image located in row i and column j, respectively; and I H ¯ and I w ¯ are the average pixel values of the fused image and the ideal reference image, respectively.
STD is used to represent the gray level distribution and contrast of the fused image, that is, the richness of the information contained. The larger the value, the richer the information contained.
STD = i = 1 M j = 1 N ( F ( i , j ) μ ) 2
where F (i, j) is the value of pixel points in row i and column j of the fused image, and μ is the mean value of the fused image.
PSNR is mainly used to measure the ratio between the effective information and noise of an image, which can show whether the image is distorted. The PSNR reflects the fidelity of the fused image.
MSE ( I H , I W ) = 1 MN i = 1 M j = 1 N ( I H ( i , j ) I W ( i , j ) ) 2 PSNR = 10 lg Z 2 MSE
where the smaller the mean square error (MSE) is, the smaller the difference between the source image and the fused image is, the higher the similarity is, and the better the quality of the fused image is. Z is the difference between the maximum and minimum gray levels of the ideal reference image.
SAM is the included angle between spectra, representing the similarity between two spectral curves. The smaller the value, the closer the shape of the two spectral curves is.
SAM = cos 1 X Y ( X ) 2 · ( Y ) 2
where X is the spectral vector of the ground object on the original hyperspectral image, and Y is the spectral vector of the same ground object on the fused image.
It should be noted that we analyzed the spectral characteristic band distribution of surface element studies, such as water body studies mainly in the visible band, vegetation studies mainly in the visible and near-infrared bands, and soil studies in the visible, near-infrared, and mid-infrared bands. Therefore, for the quantitative evaluation, considering the need for the quantification of surface elements at a later stage, the water vapor absorption bands, and the number of bands of hyperspectral satellite images, the whole spectral range was divided into three band intervals (band 1: 390–730 nm, band 2: 730–1400 nm, and band 3: 1400–2260 nm). Furthermore, the soil, vegetation, and water bodies were evaluated separately using the spectral angle index, facilitating the selection of an optimal algorithm for the quantitative analysis of surface elements at different band intervals.

3. Results and Analysis

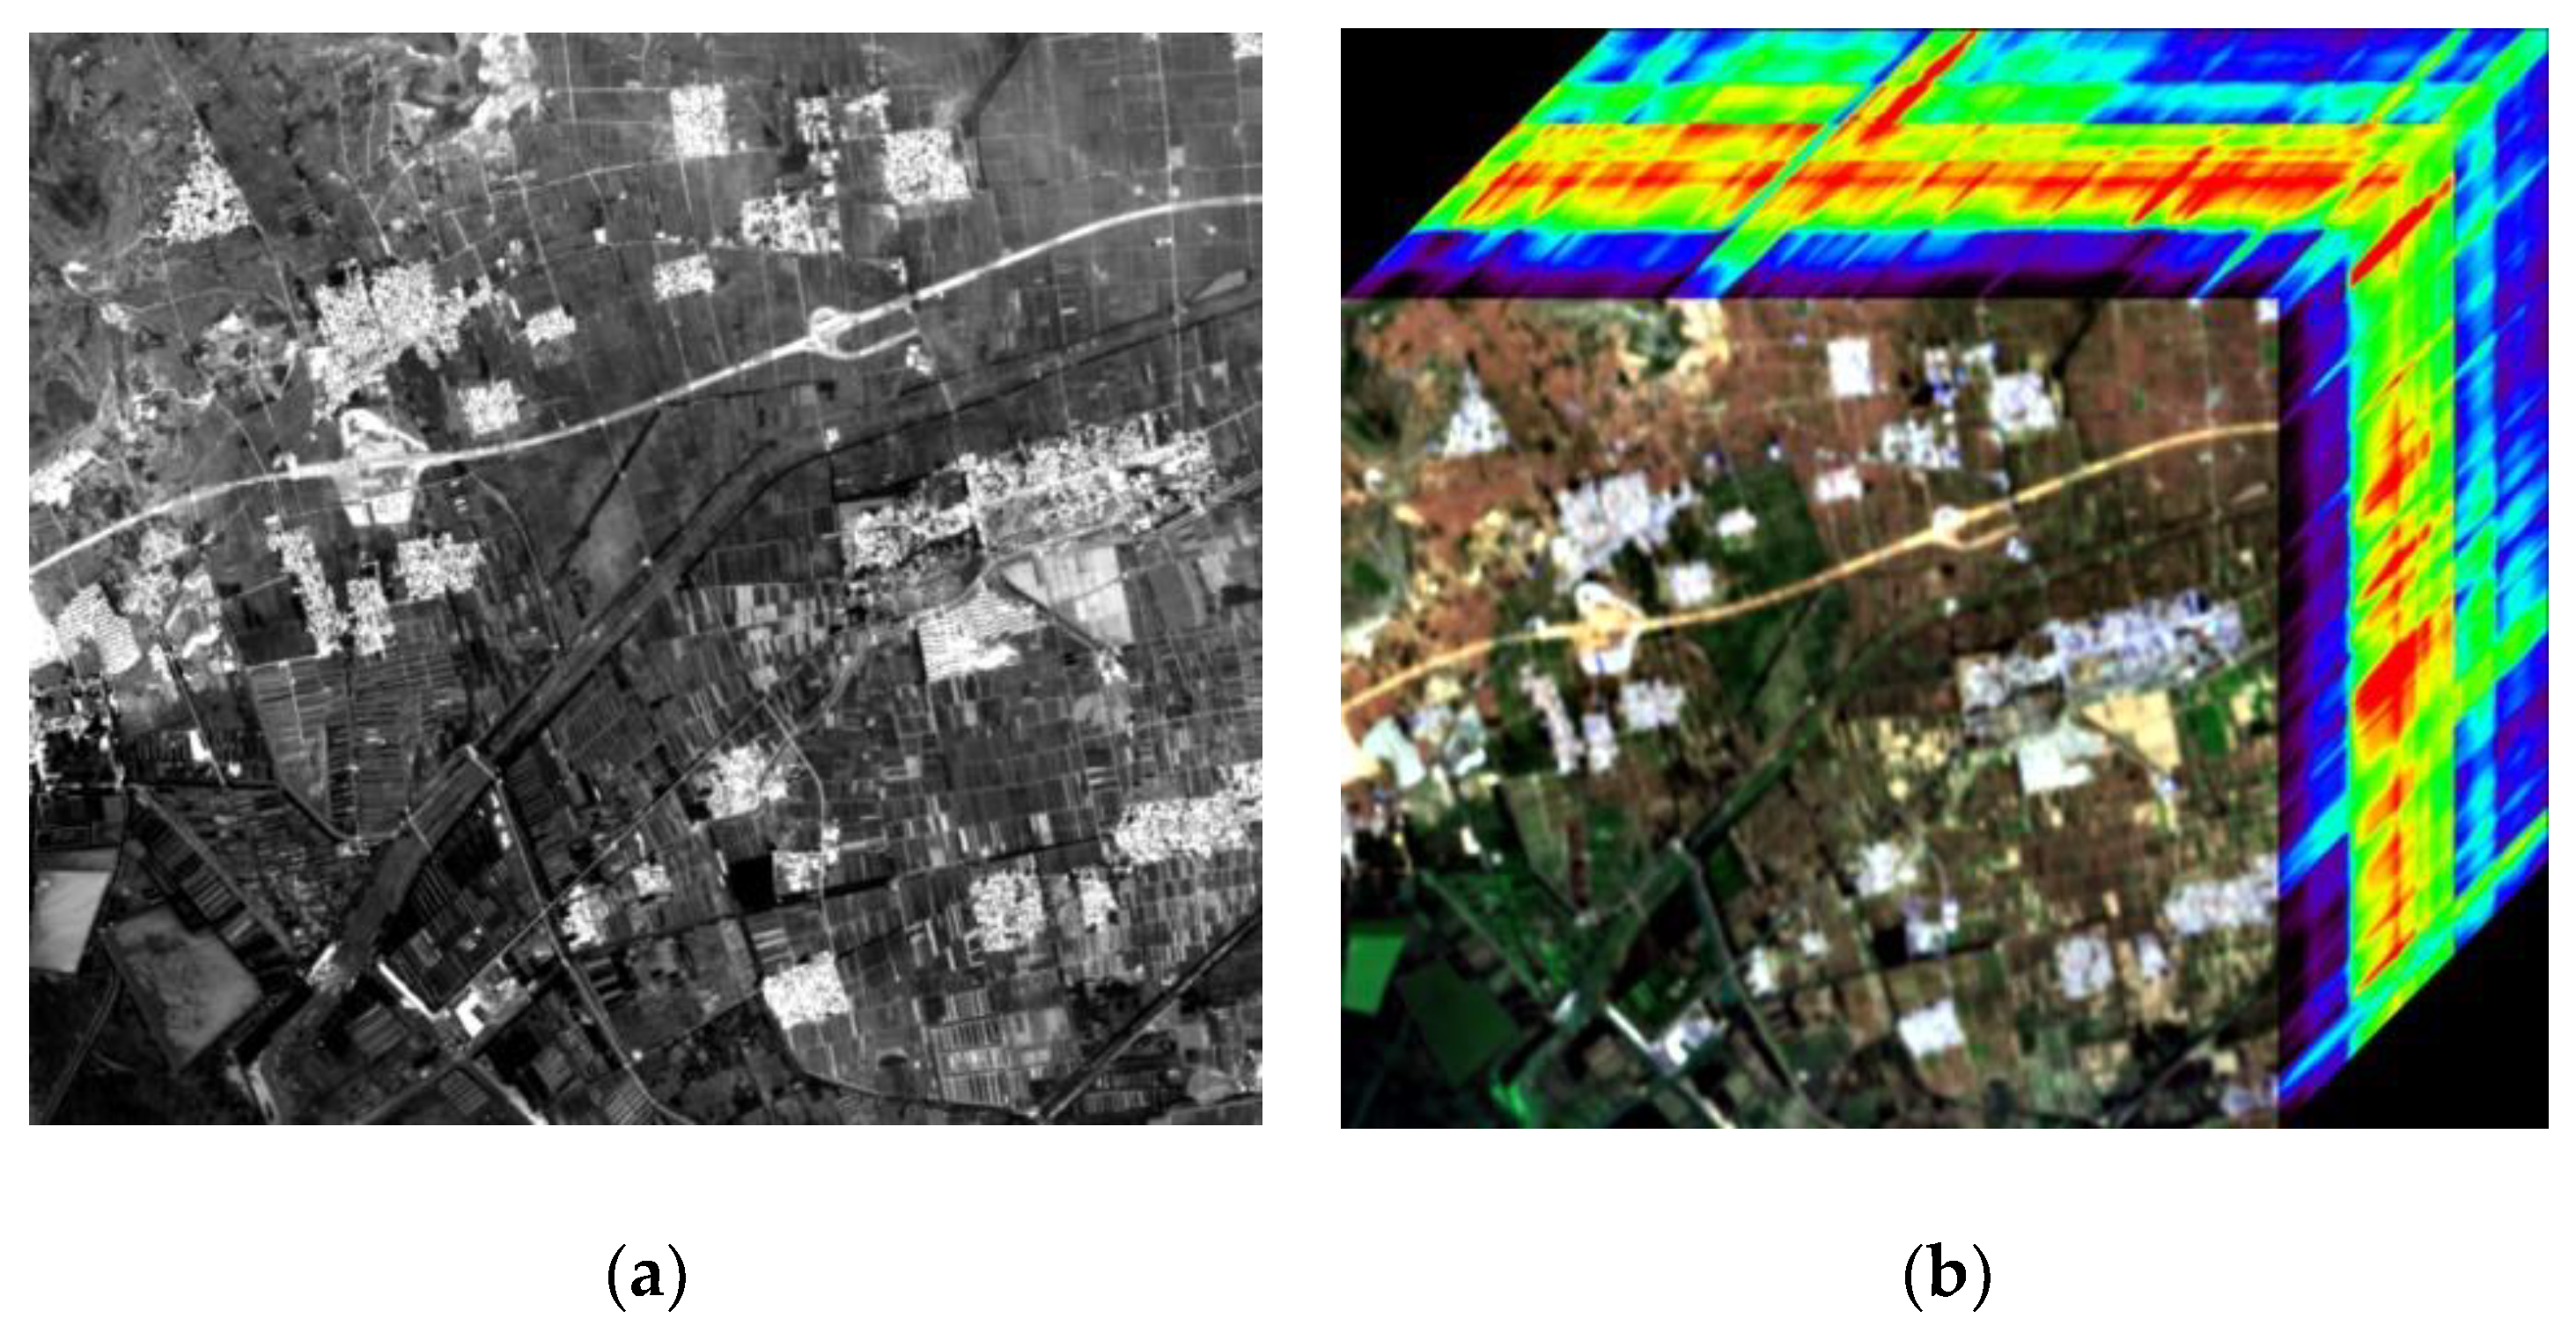
Fusion experiments were performed based on the GF-1 and GF-5 images, which were acquired on 28 May 2019 and 29 May 2019, respectively. The types of land cover are mainly rivers, vegetation, soil, and buildings. Figure 3 shows the image data after preprocessing, and Figure 4 shows the fused images after applying the PCA, GS transform, HA, and HGF methods. It can be seen from the figure that the visual effect of the fused image is better than that of the original image, with clearer textures and improved spatial resolution.
Furthermore, CC, STD, PSNR, and SAM were used as metrics to quantitatively evaluate the spatial information incorporation and spectral information fidelity of the different fusion methods, as shown in Figure 5 and Table 2. Figure 5 shows the spectral curves of the pure image elements at the same position in different fusion images.
By comparing the original and fused image obtained after applying different processing methods, we can observe from the CC index that the optimal methods in the 390–730 nm, 730–1400 nm, and 1400–2260 nm intervals are GS, HA, and HGF, respectively. A larger STD reflects richer spatial information in the image; thus, the optimal method in all three intervals is HGF. PSNR can reflect whether the image is distorted; the higher the value, the better the image fusion quality. Therefore, the best method in the three intervals is HGF. The smaller the SAM, the smaller the angle between the two spectral curves, and the better the fusion effect. In the 390–730 nm, the GS method is best suited for studying soils, buildings, vegetation, and water. The best fusion method for the four features is HGF in the 730–1400 nm interval. In the 1400–2260 nm interval, the best fusion method for soil studies is GS, while HGF is more suitable for buildings, vegetation, and water. To further analyze the applicability and accuracy of the fusion methods for different data sources, we used ZY1-02D and Sentinel-2B images. The fused images obtained using the PCA, GS, HA, and HGF algorithms are shown in Figure 6. Both qualitative and quantitative analyses were performed, and it was confirmed that the HGF method had the best performance (see Figure 7 and Table 3). It provided a filtering effect and improved image quality. Figure 7 shows the spectral curves of the pure image elements at the same position in images obtained using different fusion methods. For studying soil, buildings, vegetation, and water bodies in the 390–730 nm interval, the GS fusion method was observed to have the best performance. It was followed by HGF, while PCA and HA were less effective. In the 730–1400 nm and 1400–2260 nm intervals, HGF was the best, followed by GS, HA, and PCA.

4. Discussion

The spectral response interval related to the quantitative inversion of feature parameters is different. According to the characteristic band requirements of parameter inversion, choosing the optimal hyperspectral image fusion process will help to improve the accuracy of quantitative analysis.
At present, quantitative analysis of soil mainly includes the inversion of organic matter, moisture, and heavy metals, among which the organic-matter-sensitive spectral response is distributed between 800 and 1000 nm [21,22]. The image fusion technique can be selected using HGF. There are many soil heavy metals, including Hg, Cu, Cr, Cd, Zn, Pb, Sn, Ni, As, Se, and other metalloids, and numerous studies have been conducted on metal pollutants such as Cu, Cr, Cd, Zn, Pb, and As [23]. However, the characteristic bands of different heavy metals tend to vary [24]. In general, the sensitive spectra of Cu, Pb, Cr, and Zn are intermittently distributed in the visible–near-infrared range. For this wavelength range, as discussed in the previous section, HGF or GS is suitable. The characteristic band of As is narrower and is distributed in the near-infrared range of 1000–2400 nm; thus, HGF is applicable. The sensitive spectral range of Cd is the narrowest and distributed at 1300–1400 nm and around 1900 nm, where HGF should be applied. The spectral absorption peaks of soil moisture are concentrated around 1400, 1900, and 2200 nm [25], and thus soil moisture inversion can be performed using HGF. Quantitative studies on vegetation and water bodies mainly involve the inversion of chlorophyll concentration, and the sensitive spectral features are relatively stable and distributed in the range of 350–800 nm [26,27], where GS or HGF should be applied.
This method starts from the spectral dimension, deeply analyzes the characteristics of the harmonic components (harmonic residual term A0/2, amplitude Ch, and phase φh) of the spectral curve, and completes the image fusion while keeping the spectral waveform unchanged, so as to better improve the fidelity of the spectral information and spectral waveform of the fused image. At the same time of image fusion, the guided filtering algorithm is introduced to denoise the spectral curve. After quantitative evaluation, the PSNR index of the fused image at 730–2260 nm was improved. The ZY1-02D and Sentinel-2B satellite images were used for experimental verification, and the fusion effect evaluation results were consistent with those of the GF-1 and GF-5 images. When the research area is large, the method requires high computer configuration, and the algorithm needs to be further improved to improve efficiency.

5. Conclusions

To improve the accuracy associated with the quantitative analysis of surface elements using hyperspectral satellite images, we propose an HGF fusion method, which mainly integrates guided filtering and harmonic analysis. The proposed method was validated on two sets of hyperspectral satellite images, including GF-1 and GF-5, ZY1-02D and Sentinel-2B. The following conclusions are drawn: (1) The fused images were evaluated for soil, buildings, vegetation, and water bodies. The GS fusion techniques performed the best in the 390–730 nm interval and HGF performed the best for the 730–1400 nm and 1400–2260 nm intervals. (2) Different objects were targeted for studying surface elements, and the spectral ranges selected for their quantitative analysis were different. The HGF or GS method can be selected for performing a quantitative study on vegetation and water bodies, while the HGF method proves to be advantageous for a quantitative analysis of soil elements.

6. Future Studies

The image after spatial spectrum fusion has the characteristics of both hyperspectral resolution and high spatial resolution, and it has prominent advantages in the assessment of soil, vegetation, and water bodies properties. However, because of the large number of bands, there is also a problem of data redundancy. In future research based on this study, feature bands will be extracted according to the spectral response mechanism of different land cover types and combined with deep learning and machine learning algorithms to improve the classification accuracy. Furthermore, in the quantitative inversion of soil, vegetation, and water elements, the latest technology of feature band optimization will be studied to reduce the cross redundancy of spectral responses of different surface feature elements, so as to enhance the application of hyperspectral remote sensing in the quality assessment of various land use types.

Author Contributions

Conceptualization, P.F. and W.Z.; methodology, W.Z.; software, Y.Z.; validation, P.F., Y.Z. and W.Z.; formal analysis, Y.Z.; investigation, F.M.; resources, Y.Z.; data curation, W.Z.; writing—original draft preparation, P.F.; writing—review and editing, F.M.; visualization, W.Z.; supervision, B.Z.; project administration, F.M.; funding acquisition, P.F., F.M. and B.Z. All authors have read and agreed to the published version of the manuscript.

Funding

This research is jointly supported by the National Natural Science Foundation of China (Grant No. 42101388), the Shandong Provincial Natural Science Foundation, China (Grant No. ZR2022MD070), the Shandong Top Talent Special Foundation, and the Doctoral Foundation of Shandong Jianzhu University (XNBS1708).

Institutional Review Board Statement

Not applicable.

Informed Consent Statement

Not applicable.

Data Availability Statement

The datasets analyzed during the current study are available from the corresponding author on reasonable request.

Conflicts of Interest

The authors declare no conflict of interest.

References

  1. Zhang, L.; Shen, H. Progress and future of remote sensing data fusion. Natl. Remote Sens. Bull. 2016, 20, 1050–1061. [Google Scholar]
  2. Meng, X.; Sun, W.; Ren, K.; Yang, G.; Shao, F.; Fu, R. Spatial-spectral fusion of GF-5/GF-1 remote sensing images based on multiresolution analysis. Natl. Remote Sens. Bull. 2020, 24, 379–387. [Google Scholar]
  3. Loncan, L.; De Almeida, L.B.; Bioucas-Dias, J.M.; Briottet, X.; Chanussot, J.; Dobigeon, N.; Fabre, S.; Liao, W.; Licciardi, G.A.; Simoes, M. Hyperspectral Pansharpening: A Review. IEEE Geosci. Remote Sens. Mag. 2015, 3, 27–46. [Google Scholar] [CrossRef] [Green Version]
  4. Vivone, G.; Alparone, L.; Chanussot, J.; Mura, M.; Garzelli, A.; Licciardi, G.A.; Restaino, R.; Wald, L. A Critical Comparison among Pansharpening Algorithms. IEEE Trans. Geosci. Remote Sens. 2015, 53, 2565–2586. [Google Scholar] [CrossRef]
  5. Huang, W.; Xiao, L.; Wei, Z.; Liu, H.; Tang, S. A New Pan-Sharpening Method with Deep Neural Networks. IEEE Geosci. Remote Sens. Lett. 2017, 12, 1037–1041. [Google Scholar] [CrossRef]
  6. Zhu, X.X.; Tuia, D.; Mou, L.; Xia, G.S.; Zhang, L.; Xu, F.; Fraundorfer, F. Deep Learning in Remote Sensing: A Comprehensive Review and List of Resources. IEEE Geosci. Remote Sens. Mag. 2018, 5, 8–36. [Google Scholar] [CrossRef] [Green Version]
  7. Wang, H.; Xiao, S.; Qu, J.; Dong, W.; Zhang, T. Pansharpening Based on Multi-Branch CNN. Acta Opt. Sin. 2021, 41, 55–63. [Google Scholar]
  8. Li, J.; Zheng, K.; Yao, J.; Gao, L.; Hong, D. Deep Unsupervised Blind Hyperspectral and Multispectral Data Fusion. IEEE Geosci. Remote Sens. Lett. 2022, 19, 1–5. [Google Scholar] [CrossRef]
  9. Shahi, K.R.; Ghamisi, P.; Rasti, B.; Scheunders, P.; Gloaguen, R. Unsupervised Data Fusion with Deeper Perspective: A Novel Multisensor Deep Clustering Algorithm. IEEE J. Sel. Top. Appl. Earth Obs. Remote Sens. 2022, 15, 284–296. [Google Scholar] [CrossRef]
  10. Yang, K.; Xue, Z.; Jia, T.; Zhang, T.; Wang, L. A harmonic analysis model of small target detection of hyperspectral imagery. Acta Geod. Et. Cartogr. Sin. 2013, 42, 34–43. [Google Scholar]
  11. Yang, K.; Zhang, T.; Wang, L.; Qian, X.; Liu, S.; Wang, L. A new algorithm on hyperspectral image fusion based on the harmonic analysis. J. China Univ. Min. Technol. 2014, 43, 547–553. [Google Scholar]
  12. Zhang, T.; Liu, J.; Yang, K.; Luo, W.; Zhang, Y. Fusion algorithm for hyperspectral remote sensing image combined with harmonic analysis and Gram-Schmidt transform. Acta Geod. Et. Cartogr. Sin. 2015, 44, 1042–1047. [Google Scholar]
  13. Chen, Z.; Yang, G.; Yang, S.; Hang, X.; Fan, X. Road intersections and structure extraction method based on trajectory data. Sci. Technol. Ind. 2021, 21, 9. [Google Scholar]
  14. Zhao, W.; Li, S.; Li, A.; Zhang, B.; Chen, J. Deep fusion of hyperspectral images and multi-source remote sensing data for classification with convolutional neural network. Natl. Remote Sens. Bull. 2021, 25, 1489–1502. [Google Scholar]
  15. Zhang, W.; Du, P.J.; Fu, P.J.; Zhang, P.; Tang, P.F.; Zheng, H.R.; Meng, Y.P.; Li, E.Z. Attention-Aware Dynamic Self-Aggregation Network for Satellite Image Time Series Classification. IEEE Trans. Geosci. Remote Sens. 2022, 60. [Google Scholar] [CrossRef]
  16. Han, F.; Yang, Y.; Ma, D.; Yang, Y.; Zhang, Y.; Wu, Z. Fusion and evaluation of “Zhuhai -1” hyperspectral data and GF-2 image. Technol. Innov. Appl. 2022, 12, 30–33. [Google Scholar] [CrossRef]
  17. Wang, Z.; Ma, Y.; Cui, Z. Medical Image Fusion Based on Guided Filtering and Sparse Representation. J. Univ. Electron. Sci. Technol. China 2022, 51, 264–273. [Google Scholar] [CrossRef]
  18. Sun, X.; Qi, Z.; Sun, W.; Li, S. Infrared image enhancement algorithm based on feature fusion. Opt. Tech. 2022, 48, 250–256. [Google Scholar] [CrossRef]
  19. Ding, X.; Meng, X.; Tian, X. Parallel design of object detection method for ground object segmentation based on Hi3559A platform. Electron. Des. Eng. 2022, 30, 159–163. [Google Scholar] [CrossRef]
  20. Zhang, W.; Du, P.; Lin, C.; Fu, P.; Wang, X.; Bai, X.; Zheng, H.; Xia, J.; Samat, A. An Improved Feature Set for Hyperspectral Image Classification: Harmonic Analysis Optimized by Multiscale Guided Filter. IEEE J. Sel. Top. Appl. Earth Obs. Remote Sens. 2020, 13, 3903–3916. [Google Scholar] [CrossRef]
  21. Zhao, R.; Cui, X.; Liu, C. Inversion estimation of soil organic matter content based on GF-5 hyperspectral remote sensing image. China Environ. Sci. 2020, 40, 3539–3545. [Google Scholar]
  22. Gao, Y.; Wang, Y.; Gu, X.; Zhou, X.; Ma, Y.; Xuan, X. Quantitative inversion of soil organic matter and total nitrogen content based on differential transformation. Jiangsu Agric. Sci. 2020, 48, 220–225. [Google Scholar]
  23. Tan, K.; Wang, H.; Chen, L.; Du, Q.; Du, P.; Pan, C. Estimation of the spatial distribution of heavy metal in agricultural soils using airborne hyperspectral imaging and random forest. J. Hazard. Mater. 2020, 382, 120987. [Google Scholar] [CrossRef] [PubMed]
  24. Liu, Y.; Luo, Q.; Cheng, H. Application and development of hyperspectral remote sensing technology to determine the heavy metal content in soil. J. Agro-Environ. Sci. 2020, 39, 2699–2709. [Google Scholar]
  25. Zhang, Z.; Wang, H.; Arnon, K.; Chen, J.; Han, W. Inversion of Soil Moisture Content from Hyperspectra Based on Ridge Regression. Trans. Chin. Soc. Agric. Mach. 2018, 49, 240–248. [Google Scholar]
  26. Ji, T.; Wang, B.; Yang, J.; Li, Q.; Liu, Z.; Guan, W.; He, G.; Pan, D.; Liu, X. Construction of chlorophyll hyperspectral inverse model of alpine grassland community in Eastern Qilian Mountains. Grassl. Turf 2021, 41, 25–33. [Google Scholar]
  27. Fu, P.; Zhang, W.; Yang, K.; Meng, F. A novel spectral analysis method for distinguishing heavy metal stress of maize due to copper and lead: RDA and EMD-PSD. Ecotoxicol. Environ. Saf. 2020, 206, 111211. [Google Scholar] [CrossRef]
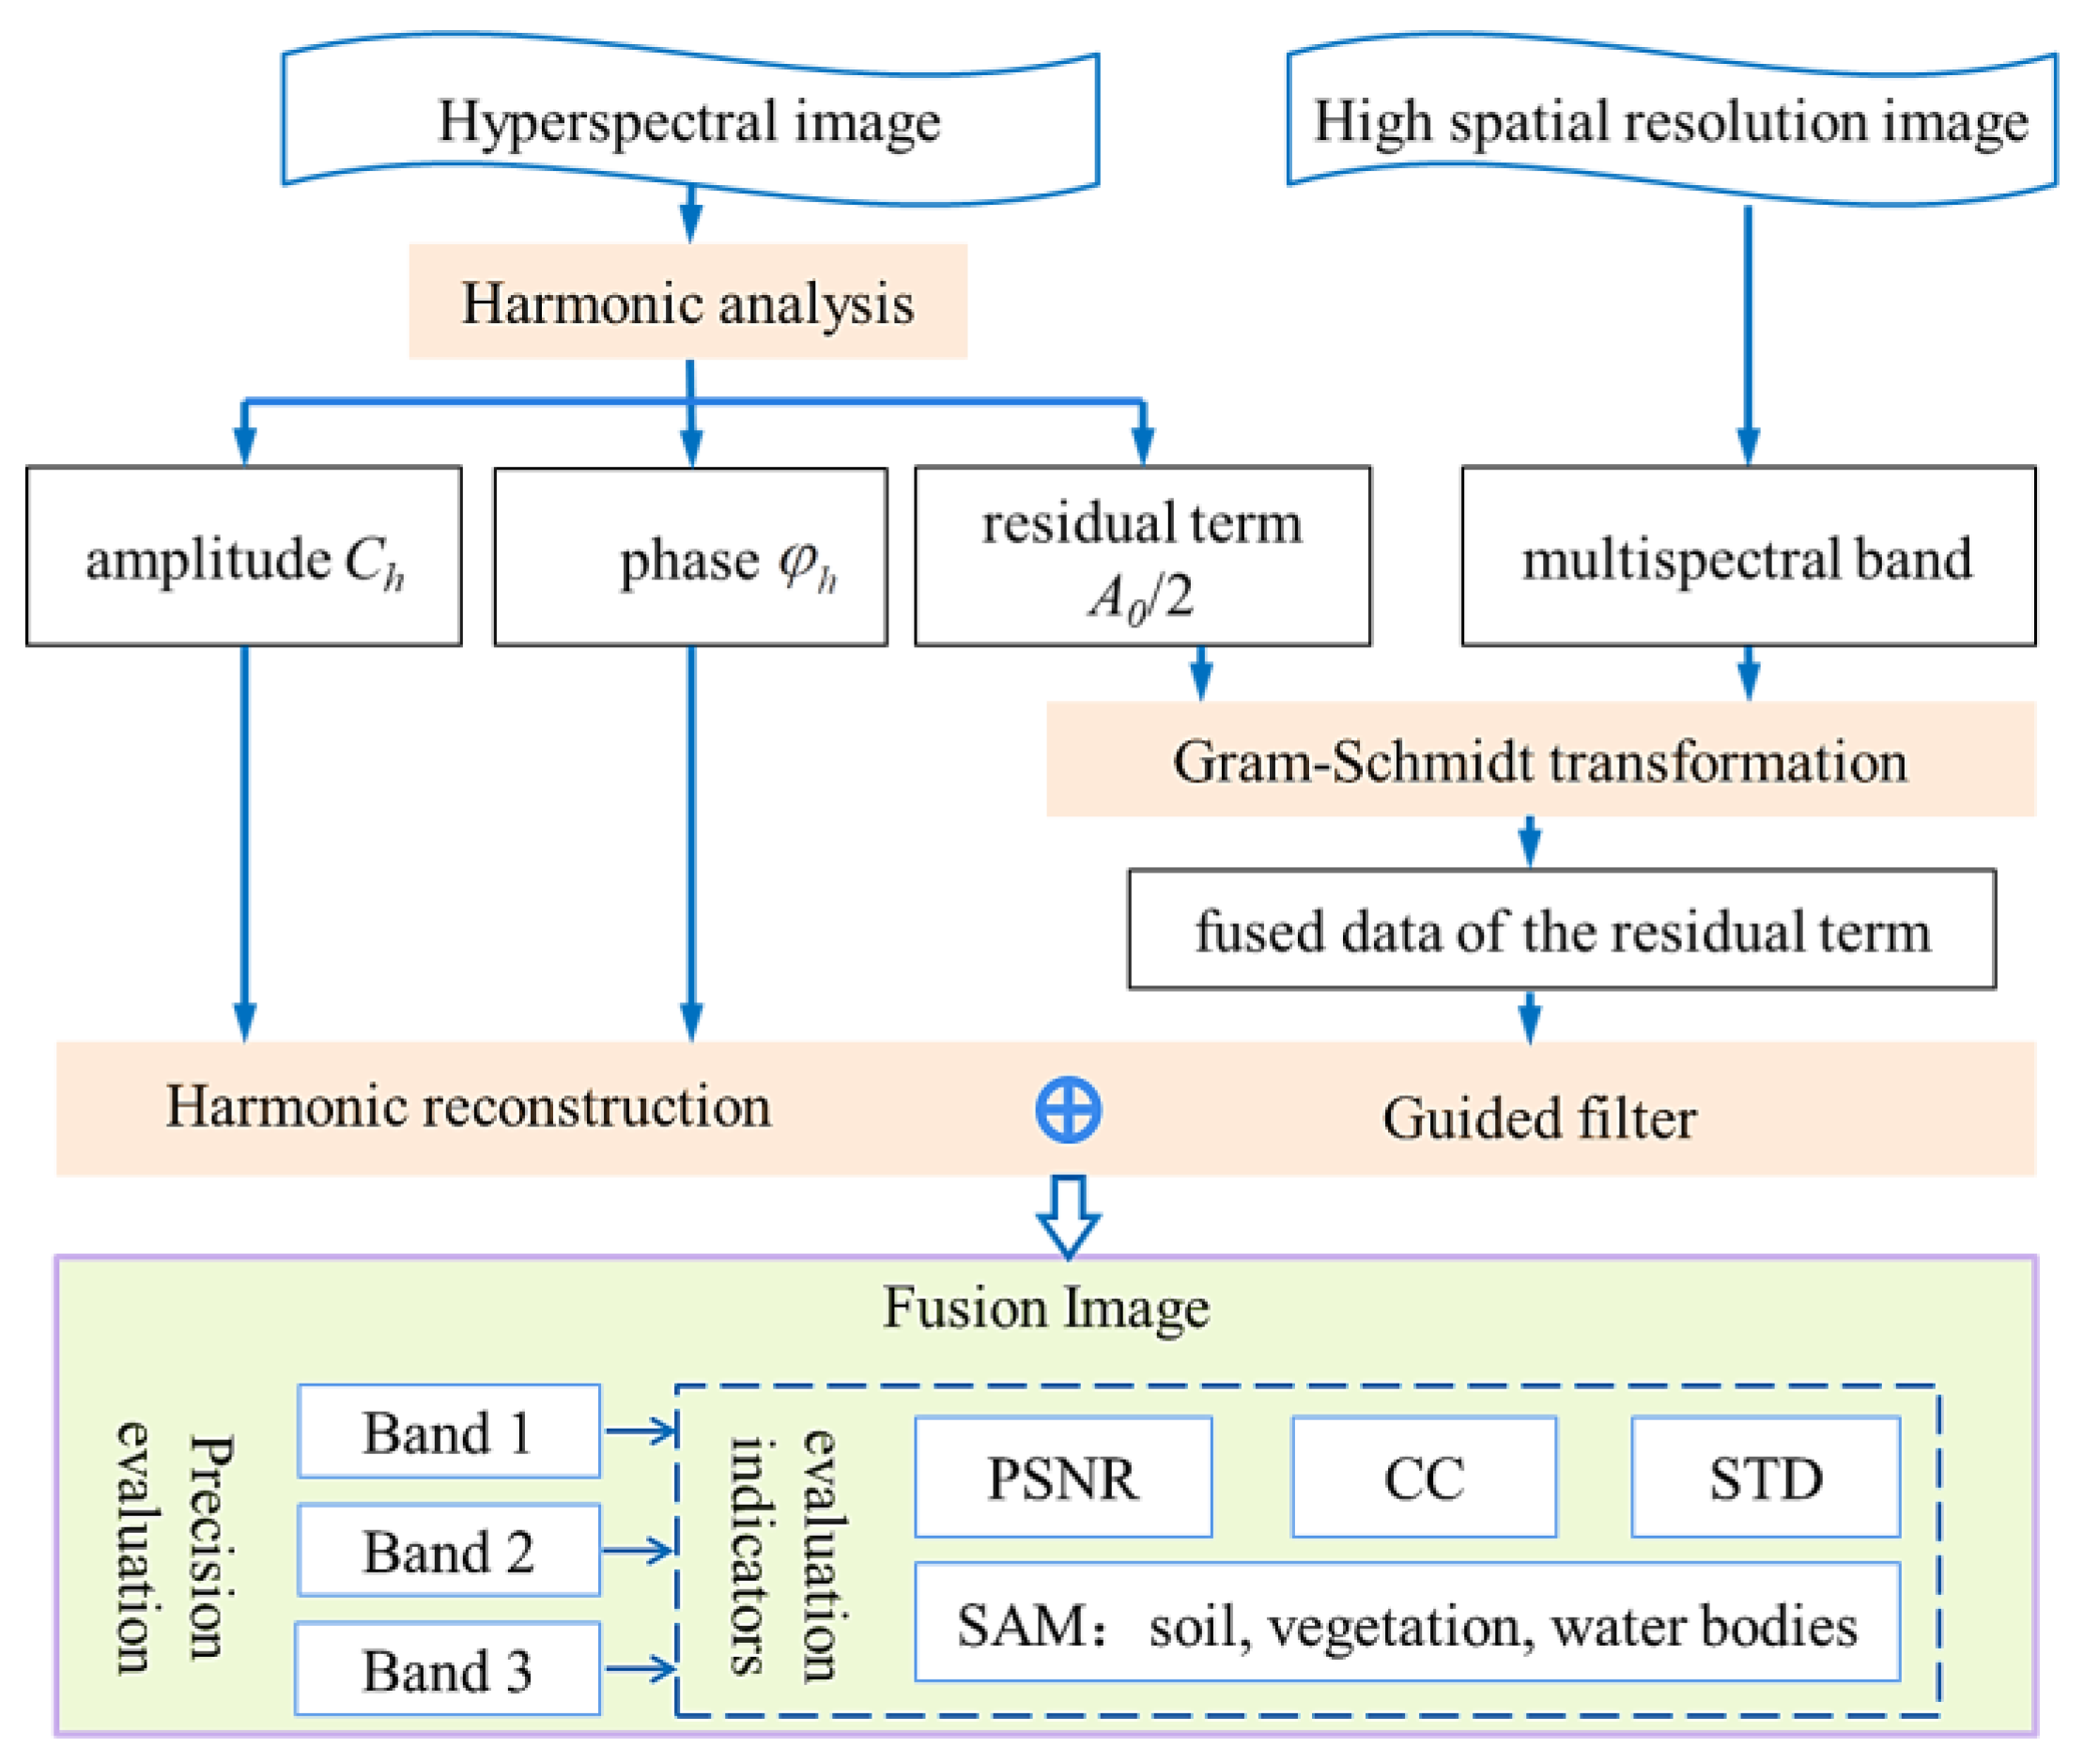
Figure 1. HGF spatial–spectral fusion model.
Applsci 13 00034 g001
Figure 2. Schematic of the guided filter.
Applsci 13 00034 g002
Figure 3. Preprocessed image data: (a) GF-1 Band 4 (b) GF-5 image.
Applsci 13 00034 g003
Figure 4. Fused images obtained using (a) PCA, (b) GS transform, (c) HA, and (d) HGF processing.
Applsci 13 00034 g004
Figure 5. Land cover spectral information using different fusion methods.
Applsci 13 00034 g005
Figure 6. Preprocessed images (a,b) and fused images obtained through (c) GS, (d) PCA, (e) HA, and (f) HGF.
Applsci 13 00034 g006
Figure 7. Spectral information of features obtained using different fusion methods.
Applsci 13 00034 g007
Table 1. The basic information of the images used in this study.
GF-1: Band 4GF-5Sentinel-2B: Band 4ZY1-02D
Acquisition time25 May 201929 May 201920 June 202028 June 2020
Pixel8 m30 m10 m30 m
Spectral resolution_VNIR: 5 nm SWIR: 10 nm_VNIR: 10 nm SWIR: 20 nm
Dims510 × 455 × 1136 × 121 × 303420 × 354 × 1140 × 118 × 151
Table 2. Fusion accuracies.
Wavelength Range390–730 nm730–1400 nm1400–2260 nm
MethodPCAGSHAHGFPCAGSHAHGFPCAGSHAHGF
Evaluation metricsCC−0.140.860.740.790.080.760.930.82−0.620.710.820.85
STD0.903.642.824.221.103.752.923.913.484.292.654.59
PSNR13.9219.8013.6818.028.3515.6313.7516.789.1415.6913.6217.62
SAMSoil0.390.020.200.100.160.010.020.010.170.010.030.02
Building0.260.010.470.040.090.010.040.010.160.010.050.01
Vegetation0.030.030.490.070.010.010.020.010.010.020.110.01
Water bodies0.320.310.310.350.790.840.750.740.950.980.890.87
Table 3. Fusion accuracies.
Wavelength Range390–730 nm730–1400 nm1400–2260 nm
MethodPCAGSHAHGFPCAGSHAHGFPCAGSHAHGF
Evaluation metricsCC−0.530.790.710.710.100.740.760.78−0.570.790.780.79
STD0.892.402.812.730.561.891.851.891.423.793.513.45
PSNR14.4020.7613.6418.8711.0418.0613.6118.1712.3218.8113.4218.89
Disclaimer/Publisher’s Note: The statements, opinions and data contained in all publications are solely those of the individual author(s) and contributor(s) and not of MDPI and/or the editor(s). MDPI and/or the editor(s) disclaim responsibility for any injury to people or property resulting from any ideas, methods, instructions or products referred to in the content.