Article

Correlation of Acoustic Emissions with Electrical Signals in the Vicinity of Fracture in Cement Mortars Subjected to Uniaxial Compressive Loading

by
Andronikos Loukidis
,
Dimitrios Tzagkarakis
,
Antonios Kyriazopoulos
,
Ilias Stavrakas
and
Dimos Triantis
*
Electronic Devices and Materials Lab., Department of Electrical and Electronics Engineering, School of Engineering, University of West Attica, 250 Thivon Avenue, 122 44 Athens, Greece
*
Author to whom correspondence should be addressed.
Appl. Sci. 2023, 13(1), 365; https://doi.org/10.3390/app13010365
Submission received: 8 December 2022 / Revised: 22 December 2022 / Accepted: 23 December 2022 / Published: 27 December 2022

Abstract

:
Acoustic emissions (AEs) and weak electrical signals, also known as pressure stimulated currents (PSCs), were concurrently recorded in order to investigate their behavior and detect precursory indicators when cement mortar specimens were subjected to mechanical compressive loading, emphasizing the behavior of the AEs and the PSC signal in the vicinity of fracture. The axial compressive loading protocol incorporated a constantly increasing stress, from early stress values up to the vicinity of fracture and a sequential stress stabilization until the time the specimen collapses, due to severe growing internal damages. Concurrent recordings of the electrical and acoustic emissions were performed. The AE recordings were analyzed, by incorporating the recently introduced F- and P-functions, and the well-known b-value. The experimental results highlight strong similarities regarding the variations of the PSC signal, the AE hits occurrence rate (F-function), and the AE hits energy release rate (P-function). The above was also confirmed with another similar experiment in an identical specimen. It is noteworthy that, during the stay of the specimens under a constant load regime near their strength levels, a peak appears in the above quantities, which is directly related to an increased rate of axial deformation. The temporal evolution of the b-values is also presented. Results show that the local minima appearing at values close to b ≈ 1.0 correspond to the local maxima of the PSC signal. It is straightforwardly concluded that when both the PSC signal and the AE data are combined, they provide clear pre-failure indicators.

1. Introduction

Fracture in heterogeneous materials such as cementitious materials and composite structures is a complex process. The fracture process includes, amongst other processes, the nucleation, growth, and coalescence of microcracks into macrocracks, which ultimately leads to failure. These processes, until failure occurs, include several stages that interact in a complex way and with many types of feedback. Laboratory recordings of acoustic emissions in such materials aim to investigate the development and interaction of cracks and the subsequent failure under stress. Fracture in materials can be considered a process that has many similarities with earthquake rupture. Therefore, one can assume that these phenomena are governed by similar statistics [1,2]. Given this analogy, acoustic emissions (AEs) can be exploited to identify a precursor critical phase—a state just before the final fracture. The use of the AE technique constitutes a non-invasive, passive non-destructive testing. A large number of researchers and practicing engineers use this method to monitor crack growth in concrete and asphalt mixtures [3,4,5,6]. In a quasi-brittle material, such as concrete, when subjected to mechanical loading until its fracture, the AE monitoring system can record a great number of parameters related to the acoustic signal. It is accepted that the systematic and ever-increasing AE activity, observed as the specimen approaches imminent failure, is strongly correlated with the deterioration of its mechanical properties. Several parameters and statistical quantities of AEs, such as the cumulative energy, the cumulative counts, the frequency of occurrence of acoustic hits, the energy release rate, the distribution of acoustic amplitudes, the b-value analysis, and more, after appropriate analysis, can provide vital information on the internal mechanisms of crack development and the fracture processes that dominate within the materials just before the fracture [7,8,9,10].
Alongside the study of acoustic emissions, there has been an interest in the electrical activity of brittle materials. The energy released during the fracture can be detected as electromagnetic wave emissions [11,12,13,14], with the capability of recording at or near the specimen’s surface. Also, with the newly created crack, the electrical polarization that develops can be detected and recorded as an electric current flowing between two electrodes on the specimen surface [15,16,17,18]. These currents are low and are referred to as pressure stimulated currents (PSC) [19,20,21,22,23,24]. It is worth noting that the term PSC first appeared in works by Varotsos et al. in the context of describing a transient electric signal due to polarization or depolarization phenomena. Such signals can be considered to result when a material that has electric dipoles and various types of defects is subjected to progressively increasing mechanical stress until its fracture [25].
In this work, cement mortar specimens are subjected to uniaxial compressive loading at a constant rate approaching fracture and then stabilized to a constant load level, and are left to collapse, due to increased internal damage accumulation. In a previous work [26], the electrical emission recordings (PSC signals) were studied in similar specimens under a constant load regime near their strength levels. The recorded PSC excitations were directly correlated with the increased strain rate. The current work aims to reproduce such experiments with concurrent recordings of both the PSC signal and the acoustic activity. The correlation of AE statistical quantities with the PSC electrical signal is attempted here, in anticipation of emerging similarities between the acoustic activity and the PSC electrical signal.

2. Theoretical Preliminaries

2.1. PSC Technique

A significant number of laboratory experiments have been conducted to investigate precursor electrical signals before failure in quasi-brittle and heterogeneous materials. Recording such low-level electrical signals has given enough information about the damage processes involved. The creation of microcracks, during continuous loading until fracture, are sources of electric charges that constitute electric dipoles [18] and most of the time, a more complicated charged system [27]. The existence of such electric dipoles results in the creation of an electric potential along the crack. Therefore, an electric current can be detected and recorded. These electric currents, for which the term pressure stimulated currents (PSCs) was established, are quite weak and, to be detected and recorded, require the use of sensitive electrometers. The order of magnitude of the PSCs ranges from a few pA to nA and is related to the type of the material, the degree of heterogeneity and the complexity of the structure. To record PSCs through sensitive electrometers, a pair of gold-plated electrodes are used as sensors, which are usually attached to the side surfaces of the samples and to some complex structures at strategic points of the specimen/structure under test. An initial physical and theoretical interpretation of the generation mechanism responsible for these currents was attributed to the motion of charged dislocations (MCDs) by Slifkin [28]. Further development of this model was carried out by Vallianatos and Tzanis [29,30]. It should be noted that, according to the MCD model, a relationship has been shown between the PSC and the strain rate [31].
The PSC technique, after the initial encouraging results that were shown by studying marble specimens [19,23,32] and then in cement-based specimens [26], is further developed and is being applied even today, either by the original research team who introduced it [23,33] or by other researchers [18,20,21,22,24]. Variations of the PSC technique have been presented by other researchers [17,34,35]. By studying the temporal evolution of the PSC signal, and especially when the specimens approach the fracture area, pre-failure indicators related to those provided by the analysis of AE activity are risen [20,23,33,36,37].

2.2. F-Function

The F-function [38] was introduced in order to study more precisely the acoustic activity related to the production rate of the acoustic hits or events, usually expressed as hits/events per sec. The F-function expresses the average frequency with which the AEs are recorded. A number of n consecutive hits or events are selected, the average value of the interevent times is calculated and the resulting inverse form constitutes the F-function. The immediately following F-function values are obtained through sliding by 1 hit or event. Each value of the F-function temporally corresponds to the average value (τ) of the recording times for the n consecutive hits or events. Therefore, when the kth acoustic hit occurs, the F-function is given by the relation:
F = k n + 1 k δ t i 1 n
where δti is each interevent time in a series of n consecutive interevent times {δtk, δtk−1, … δtk−n+1}. The depiction of the acoustic activity if the F-function is utilized, instead of the of the hits per sec depiction, provides a clearer picture regarding the way the acoustic activity changes, during the last stages prior to fracture. This way of depiction has been adopted by several researchers [39,40,41,42].

2.3. P-Function

In a fashion similar to the procedure followed for the determination of the F-function, Triantis et al. [10] proposed the P-function, which represents the average power of the AE hits emitted during a sliding window of n successive AE hits:
P = k n + 1 k E i δ t k
where Ei is the energy emitted during the occurrence of ith hit, at the time instant ti and δtk is the occurrence time difference between the first and last hit of the group of n successive AE hits. It should be noted that each P-function value is associated with a time value (τ), which is the average value of the times the n consecutive hits or events were recorded. The P-function is measured in Watts (W), however, given that the energy of the acoustic hits is expressed in aJ, the P-function will be attributed to submultiple units of pW (or fW).

2.4. b-Value

Considering that laboratory-scale fracture is a process analogous to the fracture that occurs in earthquakes, the Gutenberg-Richter magnitude-frequency relationship can be “transferred” to AE waves generated during the fracturing process in the laboratory or in engineering structures, taking the form [8]:
log 10 N = a b · A d B
where now A(dB) is the peak-amplitude of the AE hits/events in decibels. The b-value constitutes a well-established evaluation method of the damage accumulation in mechanically loaded materials, based on the variation of the b-value. Many laboratory studies have confirmed that the amplitudes of AEs increase progressively before fracture, which is documented by the drop in the negative log-linear slope (b-value) of the cumulative amplitude-frequency distributions [43,44]. Generally, high b-values occur when the system is dominated by high numbers of small-amplitude AE hits/events that represent new crack formations and slow crack growth. In the case of low b-value results, faster or unstable crack growth dominate the underlying physical response of the specimen and are accompanied by a relatively large AE amplitudes, projected through intense acoustic activity [8,44]. It should be noted that as the stress increases and the material is driven towards the imminent fracture, a sharp decrease in b-values usually occurs. Sequentially and slightly before failure, a stabilization trend with fluctuations in values close to 1.0 is observed [45,46,47,48].

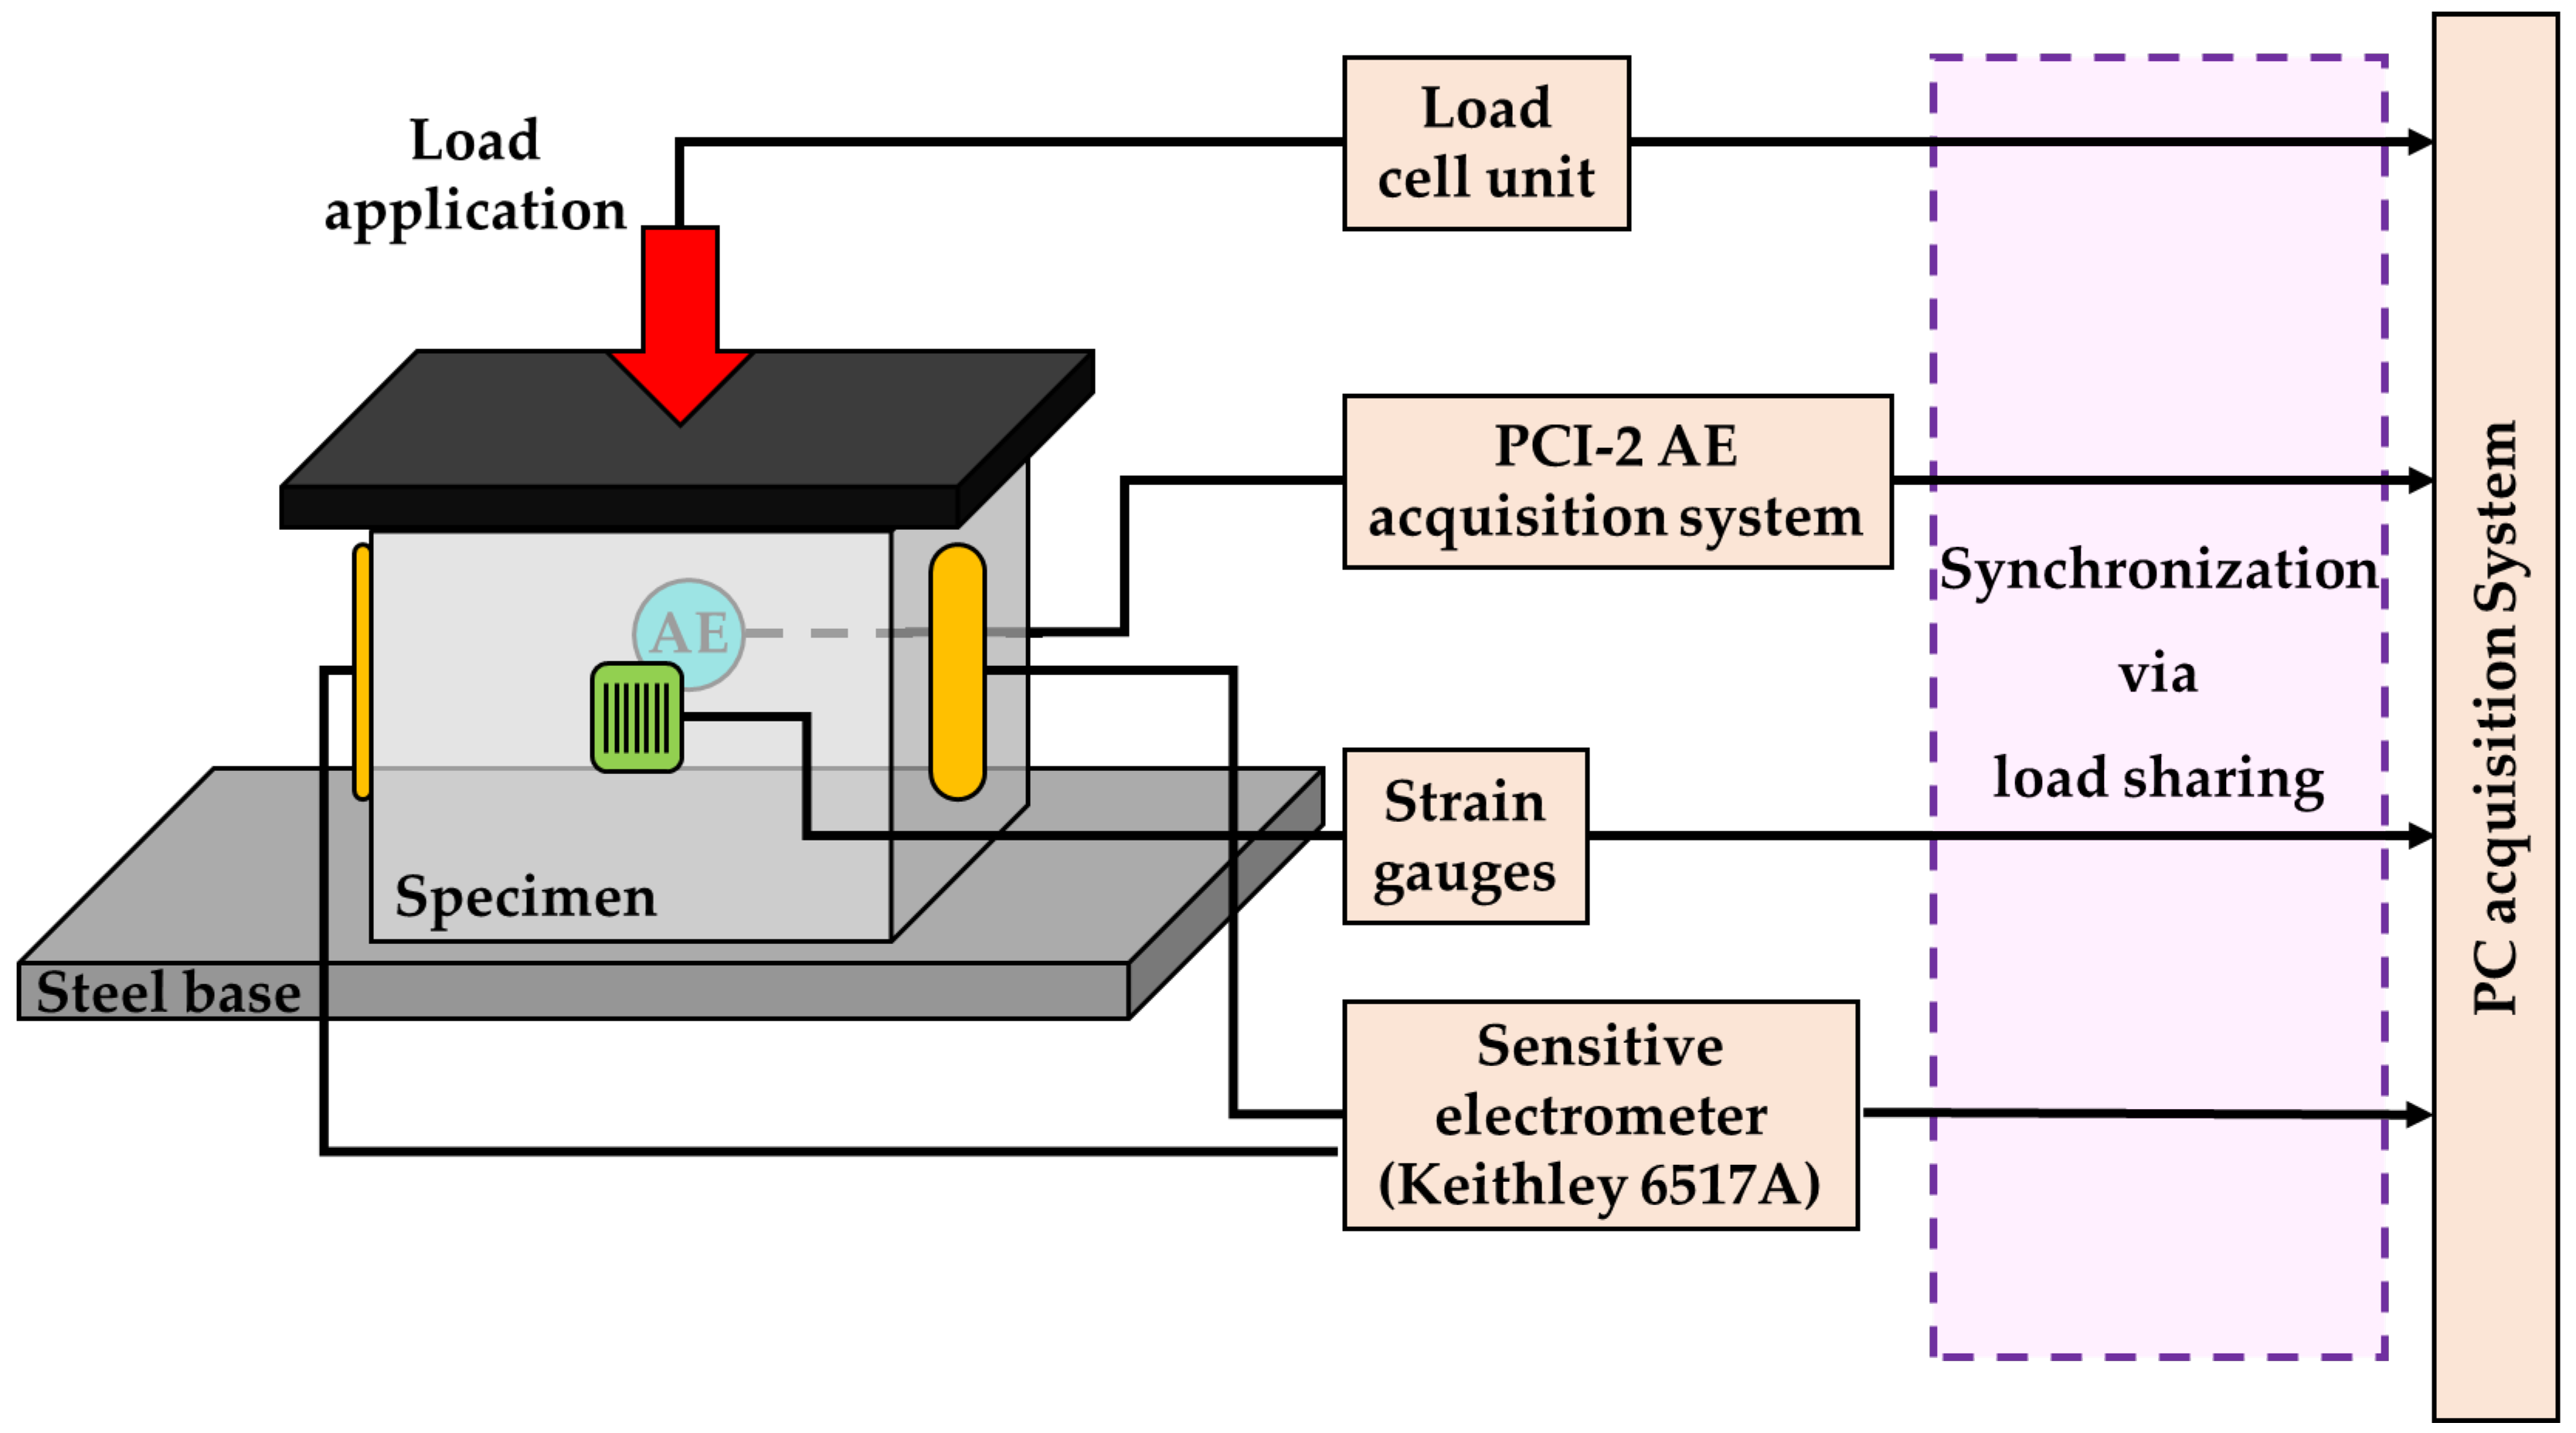
3. Materials and Experimental Apparatus

Cement mortar cubic specimens of 75 mm edge dimensions were prepared. The cement mortar specimens’ preparation process is described in Reference [26]. Preliminary tests were conducted in order to estimate their axial compressive strength. The compressive stress strength was found to be of the order of 53 ± 2 MPa. An Instron 300DX Static Hydraulic Testing Machine loading frame of 300 kN capacity was used for the specimens’ loading. Also, an electric strain gauge was placed at the center of the specimens’ front side in order to measure the axial deformation. After estimating the expected uniaxial stress strength, the following loading protocol was conducted. Axial compressive stress control was applied at a constant rate 0.4 MPa/s up to a stress level in the vicinity of failure. Sequentially, the stress was maintained at a constant, and the specimens were left to collapse due to severe internal damage accumulation and consecutive crack extension caused by the excessive stress. For the first of the two experiments that will be presented next, after the applied stress was increased linearly up to 54.5 MPa approaching the specimen’s total strength, it was then kept constant, awaiting the final fracture. Indeed, the specimen collapsed after the 180 s.
Figure 1 is a sketch of the experimental installation. It shows the locations of all the sensors on the specimen’s surfaces and the way the measurement systems are connected and synchronized. Three subsystems constitute the complete experimental apparatus, namely, the loading, the PSC, and the AE subsystems. Each one is supported by its own acquisition device to collect the corresponding data. In order to be able to synchronize the collected data, the level of applied load is shared with all the acquisition subsystems. The loading subsystem comprises the load frame and the control (i.e., Bluehill® software). The INSTRON 300DX loading frame is equipped with the appropriate extension card, to achieve both load and displacement control and output the level of the applied load to be shared with other acquisition devices. The PSC subsystem is equipped with the Keithley (6517A), a strain measurement resistor bridge (Mikrolink 770), and the Keithley A/D (KUSB 3108) unit that is used to guide the strain level and the shared mechanical load level to the acquisition device (i.e., Agilent Vee® software). The AE subsystem consists of the pre-amplifier 0/2/4 PAC, the PCI-2 AE acquisition system (Physical Acoustics Corp-PAC), and the parametric unit, that is also used to record the shared mechanical load level. The AE system is handled with the aid of the PAC AE Win® software. In order to avoid manual or time-marked data synchronization, the values of the shared mechanical load level were used to synchronize the data of all three subsystems. The PCI-2 AE acquisition system was used for the monitoring and recoding of the AEs, aided by one R15a acoustic sensor (manufactured by PAC, resonant at 75 kHz) that was attached at the center of the specimen’s back-side. Silicone was used as a coupling medium between the specimens’ surface and the sensor. For the detection of the PSC signal, a pair of copper gold-plated electrodes was used. The electrodes were attached at the remaining lateral sides of the specimens perpendicular to the axis of the applied stress (see Figure 1), so as to reduce friction effects with the loading system and minimize the subsequent electric noise. A pair of suitable springs was used in order to ensure good coupling between the electrodes and the specimens. Teflon plates with high electrical resistance were used to electrically isolate the electrodes from the springs. In order to ensure best coupling conditions between the PSC electrodes and specimen, and before the attachment of the electrodes, a thin layer of conductive silver paste was applied on the specimens’ surface at the location the electrodes were to be placed. A highly sensitive programmable electrometer Keithley 6517A (capable of detecting electric signals from 0.1 fA), accompanied by a low noise cable probe to avoid any electromagnetic interference, was used for the recording of the PSC values. The data output from the electrometer was stored in a computer using a GPIB interface.
It is noted that both the AE and the PSC systems were synchronized using the mechanical stress as a common parameter that was continuously recorded not only by the internal system of the loading frame, but also by both the PSC and the AE measuring subsystems. Furthermore, during the loading protocol the mechanical stress, the axial deformation and the PSCs were concurrently recorded at a sampling rate of 1 sample/s.

4. Experimental Results and Discussion

Figure 2 shows the temporal evolution of the PSC electrical signal (blue line) and the imposed stress in juxtaposition with the corresponding axial deformation. In addition, the linear fitting of the axial deformation is depicted with a dark green line to make the transition from the linear to the non-linear elasticity region more visible. This transition phase occurs at t 120   s . For t < 120   s the PSC values are low, showing a small trend to increase. In the time period from t 120   s to t 139   s (the moment the load stabilizes at 54.5 MPa), a strong increase in the PSC values is observed. Such an observation is compatible with previous works [16,26], since, in this phase, the progressively increasing uniaxial stress exceeds the linear elasticity limit. In the time interval 139   s t 195   s , the imposed uniaxial stress remains constant and the PSC shows a well-known decreasing trend which has been repeatedly observed in cementitious materials [16,49], and in geomaterials [21,49,50], while a small increase in axial deformation is observed, due to the increased accumulation of internal damage. Then, during the 195 s < t < 220 s time interval (yellow shaded area), the PSC exhibits a clearly visible temporary increase, which is in agreement with the steeper increasing trend of the axial deformation (see Figure 2). Similar excitations of the PSC were reported in previous related works [16,26], in which, however, no acoustic emissions were recorded, so that there was a comparison between the PSC and the AEs. The concurrent AE recordings in this work and the study of the behavior of some statistical quantities, as seen later, will strengthen the opinion that the appearing peak of the PSC is not random, but is directly related to physical parameters such as deformation and the accumulation of internal damage, and at the same time is an indication that the final fracture is imminent. Indeed, the PSC, after first showing a rather slow weakening, begins its sharp increase 20 s before the final fracture, which is a consequence of the impending final fracture. Also, it is combined with the highest rate of increase in the axial deformation. Finally, it should be noted that the incremental changes in the PSC signal that are synchronized with corresponding increased rates of axial deformation, confirm the hypothesis of the MCD model, according to which there must be a ratio between the PSC and the rate of deformation.
In order to identify qualitative similarities between the PSC signal and the AE technique, the AE data collected during the experiment were also used. A total of N = 3215 AE hits were recorded. Figure 3 presents the temporal variation of the AE hit amplitudes in juxtaposition with the axial deformation.
Subsequently, the temporal evolution of the AE hit occurrence rate expressed through the F-function, and the AE hit energy rate expressed through the P-function during the entire experiment, were calculated and will be presented. It is noted that, for the needs of the present analysis, both the F- and P-functions were calculated using a group of n = 100 consecutive AE hits. Each subsequent value of the F- and P-functions, was calculated by shifting the n AE hits window by 50 hits. Each calculated value of the F- and P-functions is associated with a specific time instance, τ, for presentation reasons. The time instance, τ, corresponds to the average value of the occurrence times of the AE hits of each group. The time evolution of the F- and P-functions, combined with the time evolution of the recorded axial deformation, is presented in Figure 4. It is evident that the temporal variations of the F- and P-functions throughout the experiment show qualitative similarities to those of the PSC signal variations. The increase in F- and P-functions, after exiting the non-linear elasticity region and until the stabilization of the uniaxial stress, is intense. After the stabilization of the applied load, the occurrence rate of hits and the energy release rate show an attenuation as a consequence of no further increase in the applied load, which has been systematically reported in tests of cement-mortar beams under a constant flexural load regime [51]. Similar variations regarding the F-function attenuation have been observed in marble specimens under uniaxial compression [51,52,53]. This behavior is disturbed when, in the time period between 195 s and 220 s, the axial deformation rate shows a transient increase, as compared with the neighboring areas. As a consequence, in this time period, both the F- and P-functions show a peak which is also compatible with the corresponding peak presented by the PSC signal (see Figure 2). After the 300 s, the occurrence rate of hits and the energy release rate increase quite strongly with the axial deformation rate, showing a progressive increase, and this time, the final fracture occurs.
The temporal evolution of the b-values, in combination with the recorded mechanical axial deformation, is shown in Figure 5. Correspondingly to the F- and P-functions, each b-value was calculated using a group of 100 consecutive amplitudes of AE hits with the next value calculated by shifting the hits window by 50 hits. Once again, each b-value is associated with a time instance τ, which corresponds to the mean value of the occurrence times of the AE hits of each group that was used to calculate the b-value. From observing Figure 4, it becomes clear that the b-value shows three sharp drops. During the initial stages of the loading protocol, and while τ < 120   s , the b-value attains values around 2.2, which can be considered as high. Sequentially, the b-values gradually lower and drop rapidly while exiting the linear elasticity region, and internal damages occur in the bulk of the specimens (see Figure 5). During this period of time and until the maximum level of the applied stress was reached, the critical b-value of 1.0, which is indicative severe damage has occurred, is approached for the very first time. Then, and while the axial stress remains constant, the b-value tends to rebound, approaching higher values close to 2.0. Similar behavior in the variation of the b-values has been identified in previous work in marble specimens under uniaxial compression [50]. But, in the time interval from 195   s < τ < 120   s , the observed increase in the axial deformation rate again sinks the b-value close to 1.0. Finally, in the last 20 s when the specimen is in the final fracture stage, the b-value drops to its lowest value of 0.9.
Commenting on the behaviors of PSC, F-, P-function and b-value, the following is noted: in the initial stages of loading, and while the deformation of the specimen is within the linear elasticity region, any pre-existing failures and microcracks remain unexcited; therefore, low acoustic activity and background values in the case of the PSC signal are observed. When reaching the linear elasticity limit, and as the axial stress increases linearly up to the maximum value of 54.5 MPa, the microcracks in the material are generated, grow and propagate within the bulk of the specimen. This is because of both the observed PSC signal and the acoustic activity excitations, but also in the corresponding emitted acoustic power. Essentially, the specimen is severely damaged, with the b-value attaining a value near 1.0 and any insignificant further increase in the axial stress would cause the final fracture. During the period the specimen was subjected to constant stress of 54.5 MPa approximately, the peaks that the PSC, the F- and the P-functions show and the corresponding sharp drops of the b-value, are related to the fact that the damage mechanisms have intensified, thus facilitating the propagation of the network of cracks within the material and the imminent final fracture is expected.
The above-described variations of the PSC signal, the acoustic activity, in terms of the F-function, and the b-value during the last loading stages before fracture, were also confirmed with another experiment, which will be presented, herein. After several tests on similar specimens, failure was achieved when the specimen was kept under a constant stress regime. In this experiment, the specimen was brought to a stress level of about 30 MPa. After a 30 s stay at 30 MPa, the PSC had already stabilized at background levels (about 2 pA), while the AE hits occurrence rate was practically insignificant (less than 0.2 hits per sec). A stepwise stress jump from 30 MPa to 51 MPa was then performed at a rate of 0.5 MPa/s. The stress level was kept constant at 51 MPa and, after 360 s, failure occurred. The production rate of AE hits expressed through the F-function and the energy rate of the AE hits expressed through the P-function, as well as the b-values, were calculated in a fashion similar to the one described in the previous experiment. A brief presentation of the temporal variations of the load, axial deformation, PSC, acoustic activity (F-function) and b-values can be seen in Figure 6.
It is noteworthy that, during the stay of the specimen under a constant load regime at approximately 51 MPa, and before the final fracture occurs, the PSC signal in combination with the F-function shows a transient sharp peak, while the corresponding b-values drop. Focusing on this time phase (see Figure 7) an increased rate of axial deformation can be found, as compared with the neighboring areas. Furthermore, in Figure 7, the P-function is also depicted, which shows a similar behavior to the PSC and the F-function. Finally, 40 s before fracture and while the axial deformation begins to increase more intensely, a new and expected increase in the PSC signal and F-function is observed in combination with the drop of the b-value in the vicinity close to 1.0.

5. Conclusions

The correlation of the PSC signal with statistical quantities derived from acoustic emission data was studied when cement mortar specimens were subjected to uniaxial compressive loading and left to collapse due to increased internal damage accumulation. The PSC signal was recorded throughout the experiment until the final fracture. The acoustic activity was studied through the F-function, which expresses an average value of the production rate of AE hits, and the P-function, which expresses an average value of the energy rate of the hits. Using the cumulative frequency-width distribution of the AE hits, the variability of the b-values was also studied.
The experimental results highlight that:
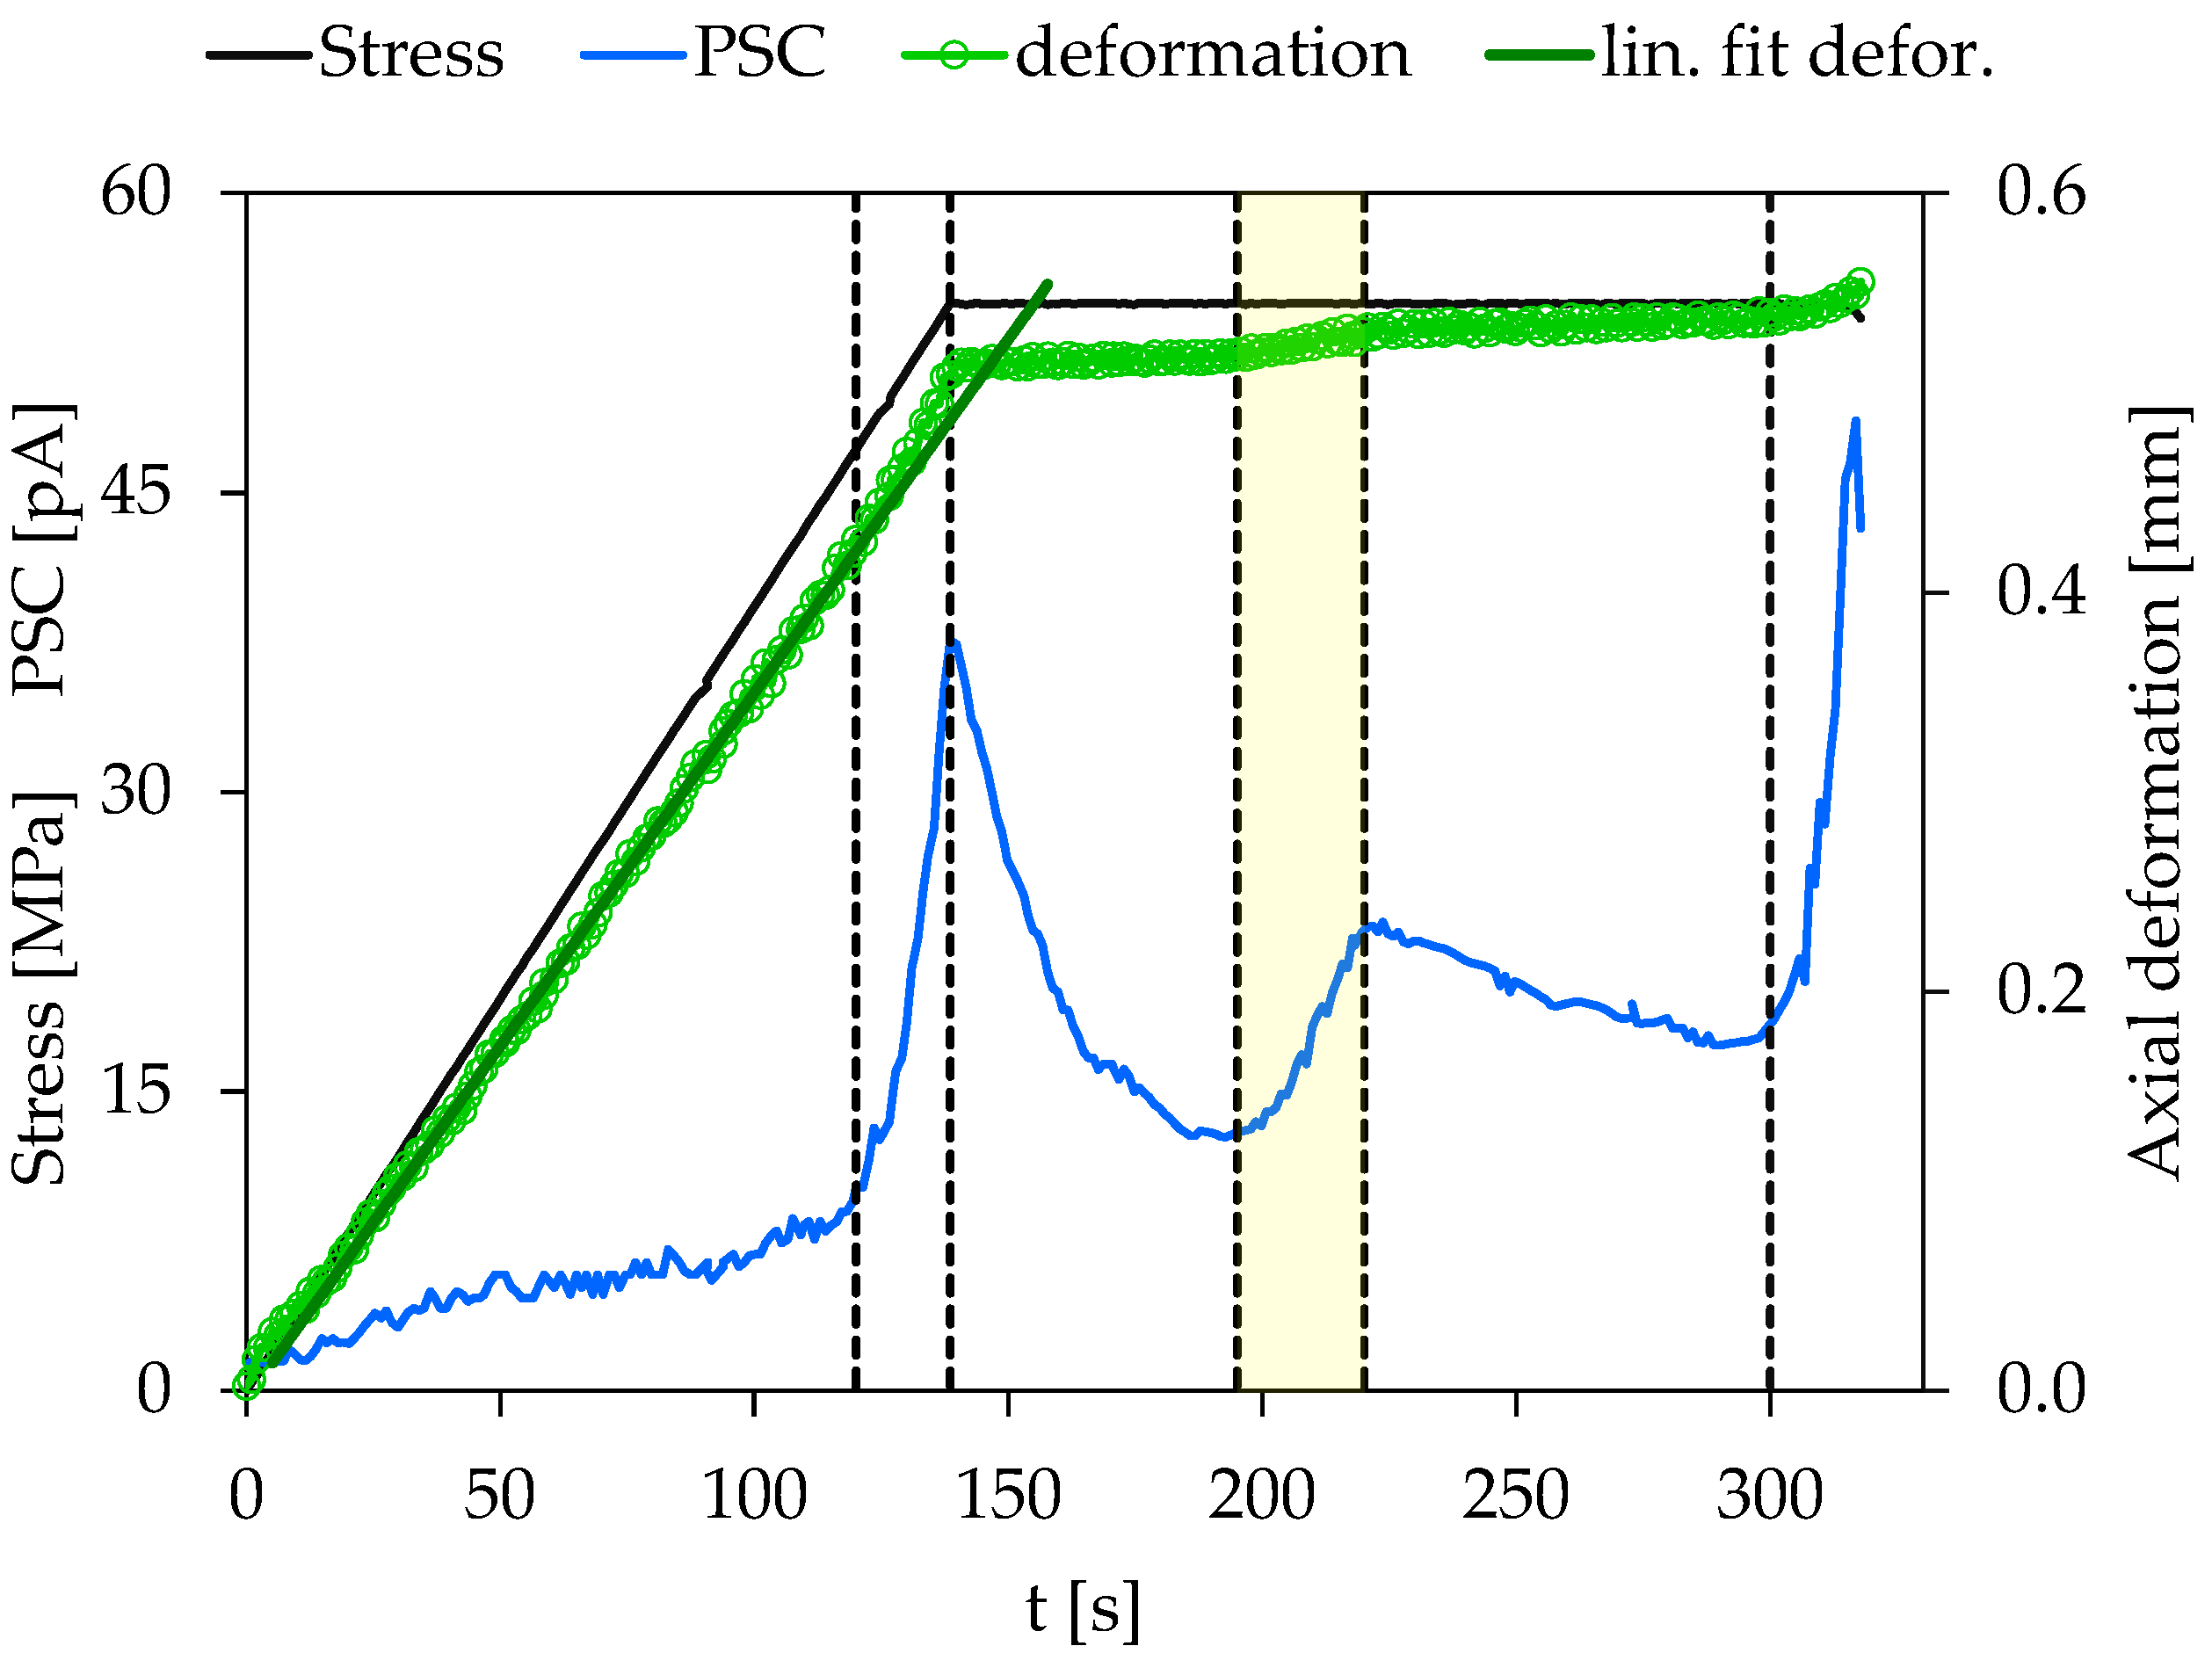
  • Identical qualitative behaviors between the acoustic activity and the PSC signal emerged in all stages of the loading experiment.
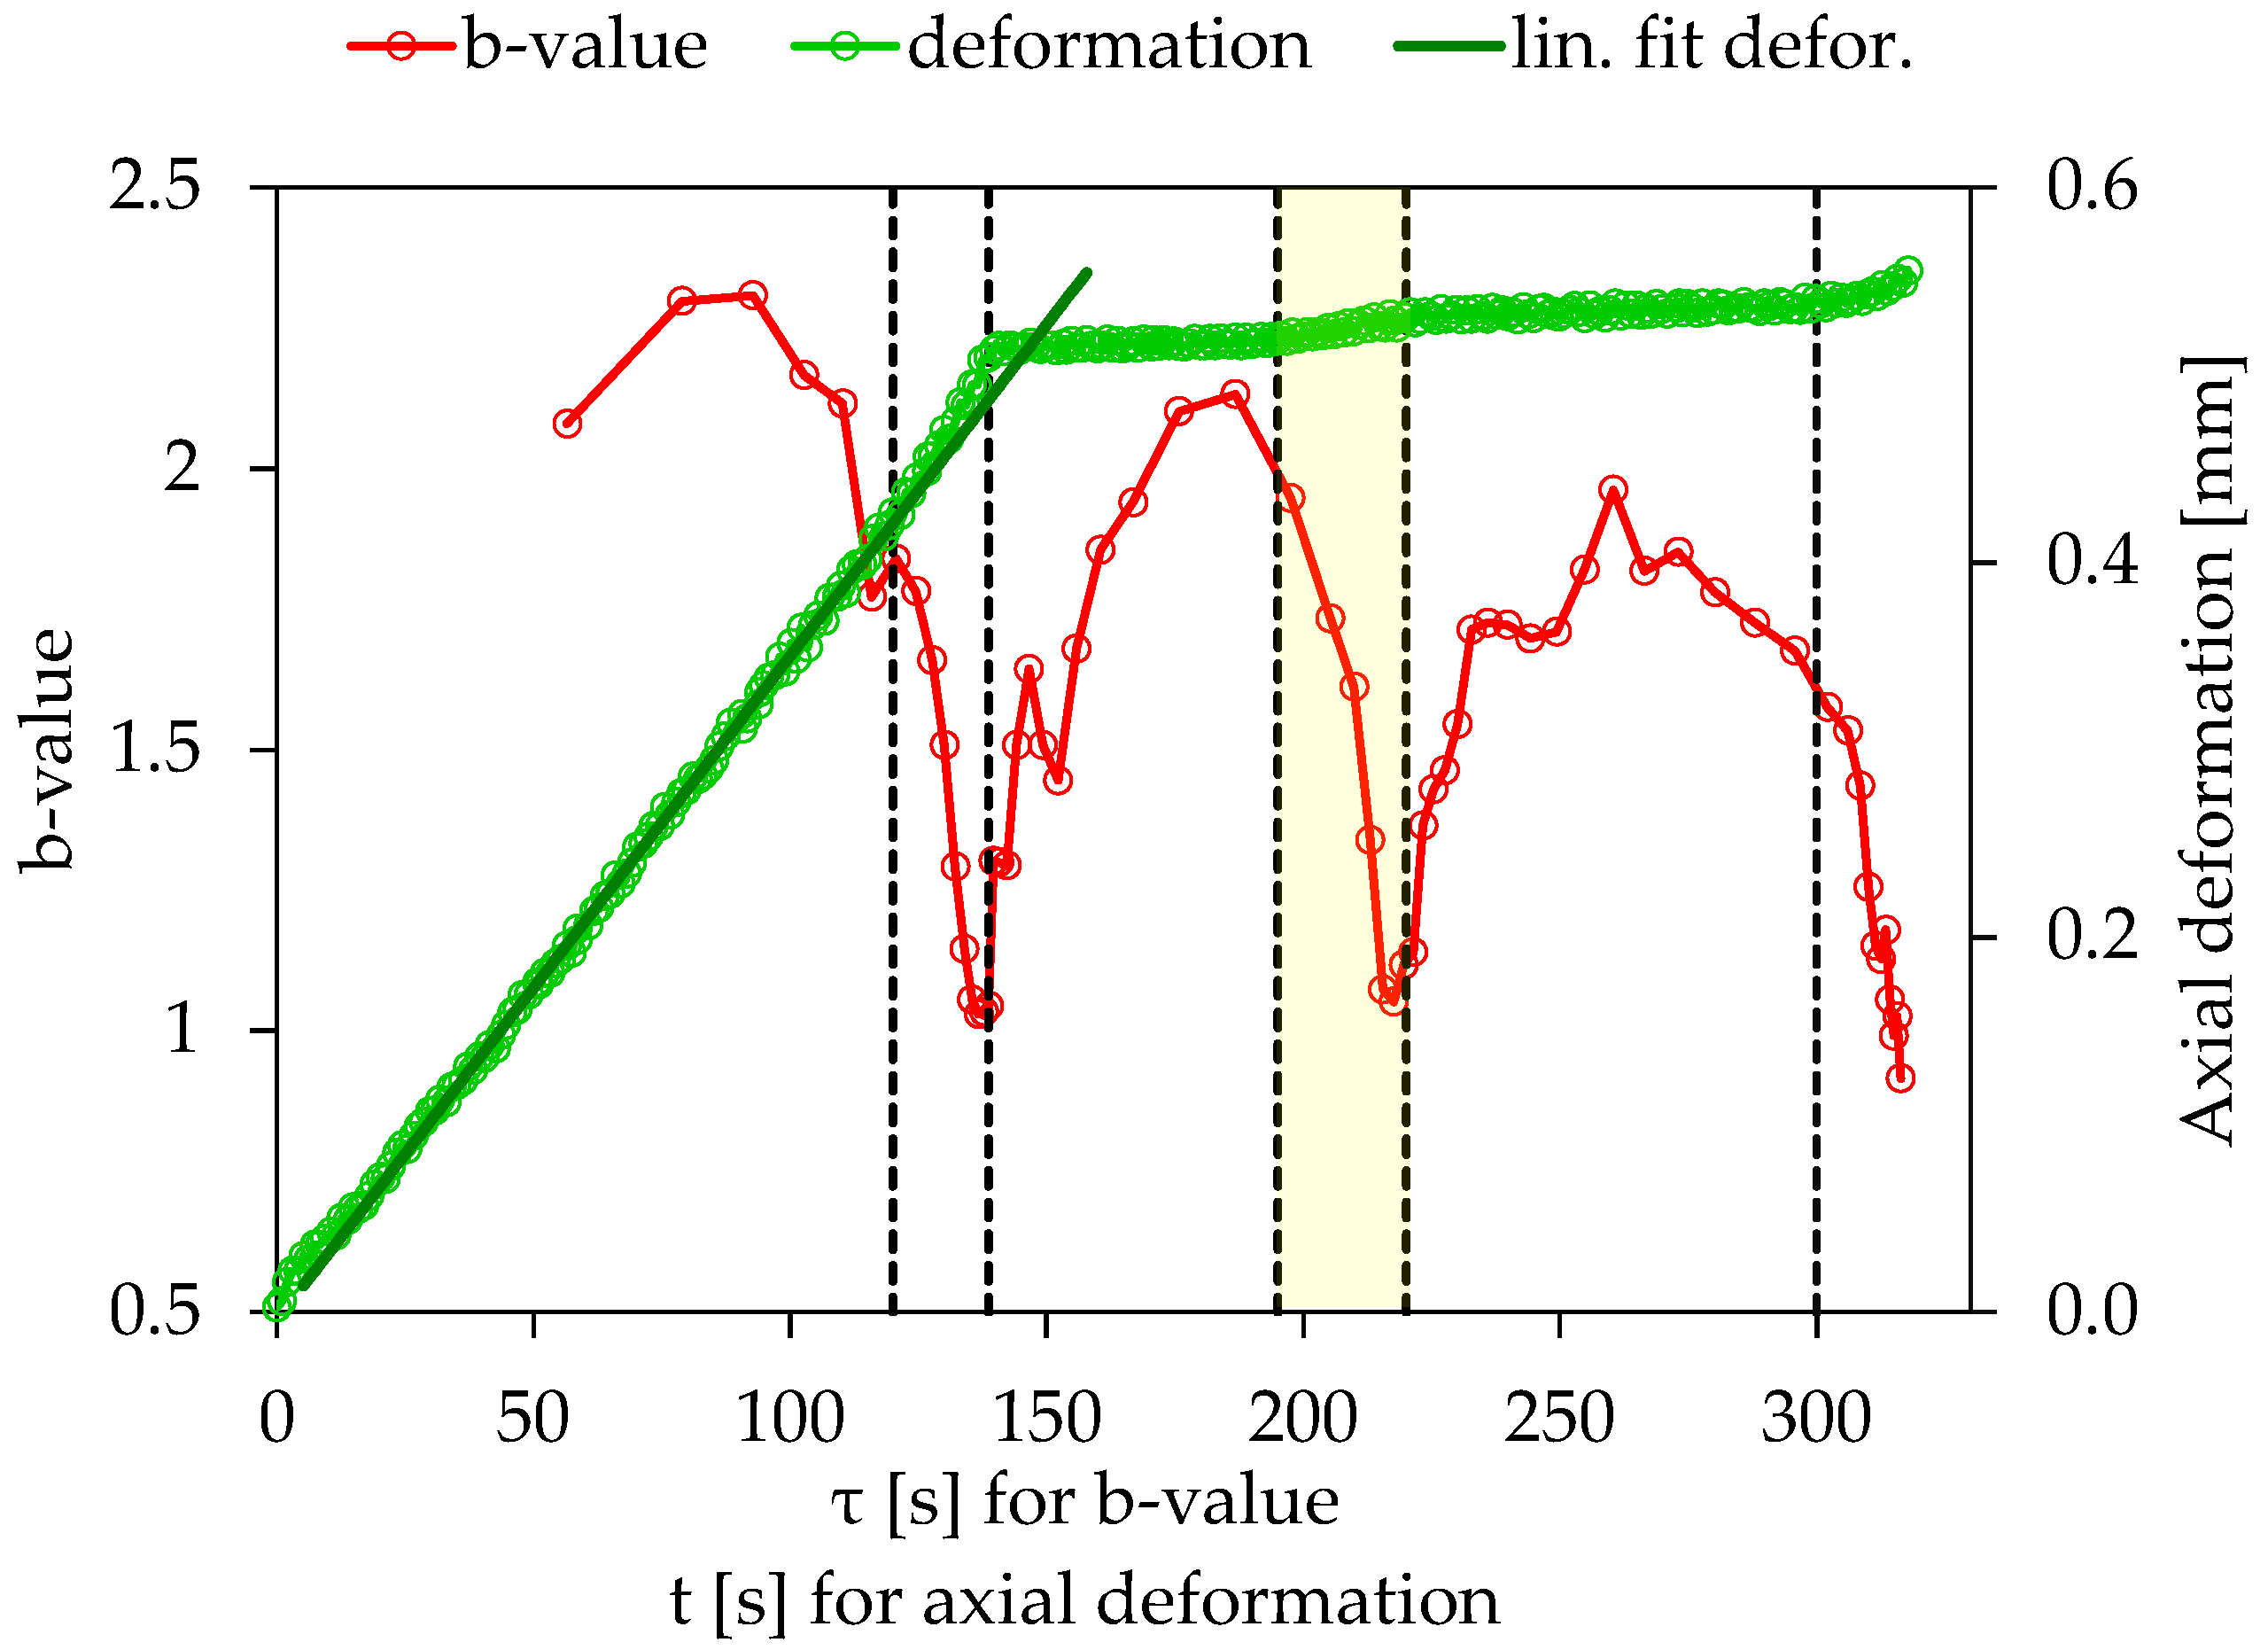
  • The peaks of the produced AE hit rates and energy rates are concurrent with the PSC peaks and with the local minima of the b-values, which converge on the value 1.0.
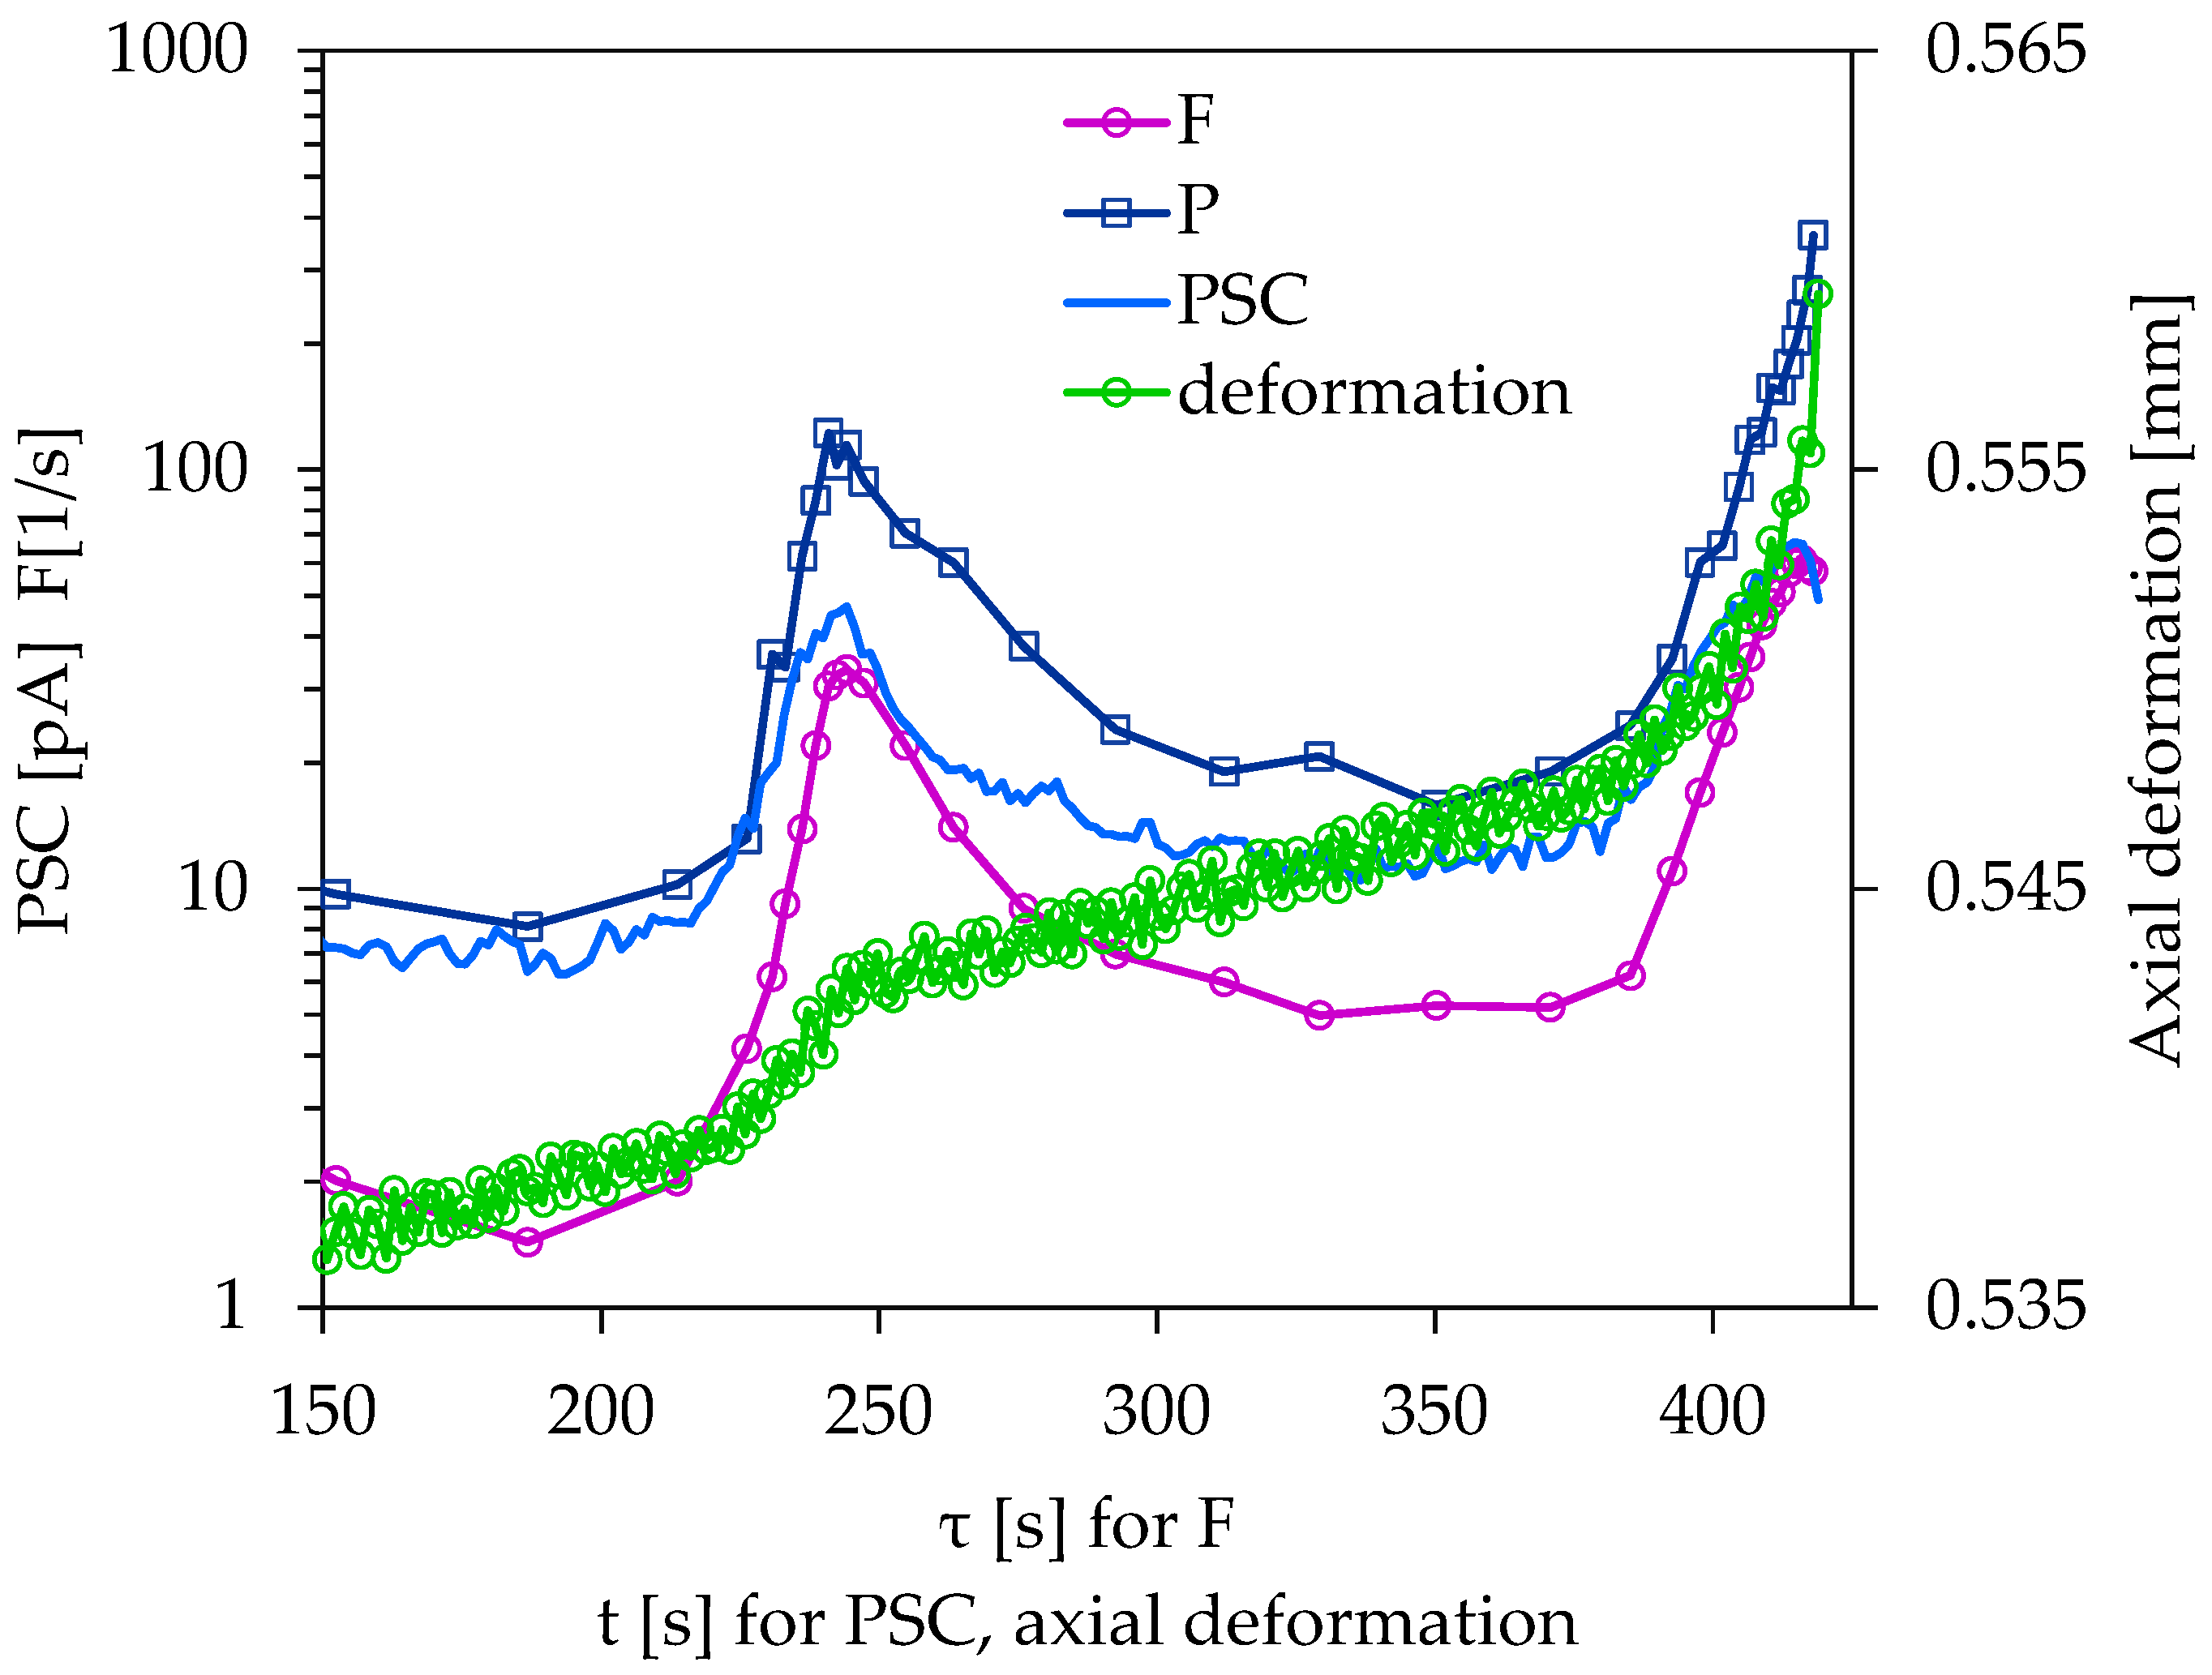
  • Especially the appearance of the PSC signal, F- and P-function peaks during the constant axial compressive stress application at a level near the total strength of the specimen in combination with the b-values that descend close to 1.0, is an indication that the final collapse of the specimen is imminent.
  • The appearance of above-described behaviors is combined with an increased axial deformation rate.
Finally, the appearing peak in the PSC signal is in agreement with the motion of charged dislocations model, since it is combined with an obvious increased rate of axial deformation. In conclusion, both the PSC and the AE activity can detect upcoming significant damage and provide pre-failure indicators.

Author Contributions

Conceptualization, D.T. (Dimos Triantis); methodology, D.T. (Dimos Triantis); software, A.K.; writing—original draft preparation, A.L.; writing—review and editing, I.S.; project administration, D.T. (Dimitrios Tzagkarakis). All authors have read and agreed to the published version of the manuscript.

Funding

This research received no external funding.

Institutional Review Board Statement

Not applicable.

Informed Consent Statement

Not applicable.

Data Availability Statement

Not applicable.

Conflicts of Interest

The authors declare no conflict of interest.

References

  1. Hanks, T.C. Small Earthquakes, Tectonic Forces. Science 1992, 256, 1430–1432. [Google Scholar] [CrossRef] [PubMed]
  2. Zang, A.C.; Wagner, F.; Stanchits, S.; Dresen, G.; Andresen, R.; Haidekker, M.A. Source analysis of acoustic emissions in Aue granite cores under symmetric and asymmetric compressive loads. Geophys. J. Int. 1998, 135, 1113–1130. [Google Scholar] [CrossRef] [Green Version]
  3. Grosse, C.U.; Ohtsu, M.; Aggelis, D.G.; Shiotani, T. History and Fundamentals. In Acoustic Emission Testing, Basics for Research—Applications in Civil Engineering; Grosse, C., Ohtsu, M., Eds.; Springer: Berlin/Heidelberg, Germany, 2008; pp. 11–18. [Google Scholar]
  4. He, W.; Hao, W.; Meng, X.; Zhang, P.; Sun, X.; Shen, Y. Influence of Graphite Powder on the Mechanical and Acoustic Emission Characteristics of Concrete. Buildings 2022, 12, 18. [Google Scholar] [CrossRef]
  5. Deresse, N.E.; Van Steen, C.; Sarem, M.; François, S.; Verstrynge, E. Acoustic Emission Analysis of Fracture and Size Effect in Cementitious Mortars. Appl. Sci. 2022, 12, 3489. [Google Scholar] [CrossRef]
  6. Wei, H.; Zhang, H.; Li, J.; Zheng, J.; Ren, J. Effect of loading rate on failure characteristics of asphalt mixtures using acoustic emission technique. Constr. Build. Mater. 2023, 364, 129835. [Google Scholar] [CrossRef]
  7. Shiotani, T. Evaluation of progressive failure using AE sources and improved b-value on slope model tests. Prog. Acoust. Emiss. JSNDI 1994, 7, 529–534. [Google Scholar]
  8. Colombo, I.S.; Main, I.G.; Forde, M.C. Assessing Damage of Reinforced Concrete Beam Using “b-value” Analysis of Acoustic Emission Signals. J. Mater. Civ. Eng. 2003, 15, 280–286. [Google Scholar] [CrossRef] [Green Version]
  9. Rao, A.K. Acoustic Emission and Signal Analysis. Def. Sci. J. 2013, 40, 55–70. [Google Scholar] [CrossRef] [Green Version]
  10. Triantis, D.; Stavrakas, I.; Loukidis, A.; Pasiou, E.D.; Kourkoulis, S.K. Exploring the acoustic activity in brittle materials in terms of the position of the acoustic sources and the power of the acoustic signals—Part I: Founding the approach. Forces Mech. 2022, 7, 100088. [Google Scholar] [CrossRef]
  11. Yamada, I.; Masuda, K.; Mizutani, H. Electromagnetic and acoustic emission associated with rock fracture. Phys. Earth Planet. Inter. 1989, 57, 157–168. [Google Scholar] [CrossRef]
  12. Frid, V. Rockburst hazard forecast by electromagnetic radiation excited by rock fracture. Rock Mech. Rock Eng. 1997, 30, 229–236. [Google Scholar] [CrossRef]
  13. Sharma, S.K.; Kumar, A.; Chauhan, V.S.; Kiran, R.; Kumar, R. Electromagnetic radiation detection from cubical mortar sample and its theoretical model. Mater. Sci. Eng. B 2020, 260, 114638. [Google Scholar] [CrossRef]
  14. Lou, Q.; Wan, X.; Jia, B.; Song, D.; Qiu, L.; Yin, S. Application Study of Empirical Wavelet Transform in Time-Frequency Analysis of Electromagnetic Radiation Induced by Rock Fracture. Minerals 2022, 12, 1307. [Google Scholar] [CrossRef]
  15. Stavrakas, I.; Anastasiadis, C.; Triantis, D.; Vallianatos, F. Piezo stimulated currents in marble samples: Precursory and concurrent-with-failure signals. Nat. Hazards Earth Syst. Sci. 2003, 3, 243–247. [Google Scholar] [CrossRef] [Green Version]
  16. Kyriazopoulos, A.; Anastasiadis, C.; Triantis, D.; Brown, C.J. Non-destructive evaluation of cement-based materials from pressure-stimulated electrical emission—Preliminary results. Constr. Build. Mater. 2011, 25, 1980–1990. [Google Scholar] [CrossRef] [Green Version]
  17. Archer, J.W.; Dobbs, M.R.; Aydin, A.; Reeves, H.J.; Prance, R.J. Measurement and correlation of acoustic emissions and pressure stimulated voltages in rock using an electric potential sensor. Int. J. Rock Mech. Min. 2016, 89, 26–33. [Google Scholar] [CrossRef] [Green Version]
  18. Cartwright-Taylor, A.; Vallianatos, F.; Sammonds, P. Superstatistical view of stress-induced electric current fluctuations in rocks. Phys. A Stat. Mech. Appl. 2014, 414, 368–377. [Google Scholar] [CrossRef]
  19. Stavrakas, I.; Triantis, D.; Agioutantis, Z.; Maurigiannakis, S.; Saltas, V.; Vallianatos, F.; Clarke, M. Pressure stimulated currents in rocks and their correlation with mechanical properties. Nat. Hazards Earth Syst. Sci. 2004, 4, 563–567. [Google Scholar] [CrossRef] [Green Version]
  20. Zhang, X.; Li, Z.; Wang, E.; Li, B.; Song, J.; Niu, Y. Experimental investigation of pressure stimulated currents and acoustic emissions from sandstone and gabbro samples subjected to multi-stage uniaxial loading. Bull. Eng. Geol. Environ. 2021, 80, 7683–7700. [Google Scholar] [CrossRef]
  21. Li, D.; Wang, E.; Li, Z.; Ju, Y.; Wang, D.; Wang, X. Experimental investigations of pressure stimulated currents from stressed sandstone used as precursors to rock fracture. Int. J. Rock Mech. Min. 2021, 145, 104841. [Google Scholar] [CrossRef]
  22. Li, D.; Wang, E.; Ju, Y.; Wang, D. Laboratory Investigations of a New Method Using Pressure Stimulated Currents to Monitor Concentrated Stress Variations in Coal. Nat. Resour. Res. 2021, 30, 707–724. [Google Scholar] [CrossRef]
  23. Triantis, D.; Pasiou, E.D.; Stavrakas, I.; Kourkoulis, S.K. Hidden Affinities Between Electric and Acoustic Activities in Brittle Materials at Near-Fracture Load Levels. Rock Mech. Rock Eng. 2022, 55, 1325–1342. [Google Scholar] [CrossRef]
  24. Mao, W.; Wu, L.; Xu, Y.; Yao, R.; Lu, J.; Sun, L.; Qi, Y. Pressure-Stimulated Rock Current as Loading Diorite to Failure: Particular Variation and Holistic Mechanisms. J. Geophys. Res. Solid Earth 2022, 127, e2022JB024931. [Google Scholar] [CrossRef]
  25. Varotsos, P.; Sarlis, N.V.; Lazaridou, M.; Kapiris, P. Transmission of stress induced electric signals in dielectric media. J. Appl. Phys. 1998, 83, 60–70. [Google Scholar] [CrossRef]
  26. Triantis, D.; Stavrakas, I.; Kyriazopoulos, A.; Hloupis, G.; Agioutantis, Z. Pressure stimulated electrical emissions from cement mortar used as failure predictors. Int. J. Fract. 2012, 175, 53–61. [Google Scholar] [CrossRef]
  27. Varotsos, P.; Sarlis, N.V.; Skordas, E.S. Long-range correlations in the electric signals that precede rupture. Phys. Rev. E 2002, 66, 011902. [Google Scholar] [CrossRef] [Green Version]
  28. Slifkin, L. Seismic electric signals from displacement of charged dislocations. Tectonophysics 1993, 224, 149–152. [Google Scholar] [CrossRef]
  29. Vallianatos, F.; Tzanis, A. Electric current generation associated with the deformation rate of a solid: Preseismic and coseismic signals. Phys. Chem. Earth 1998, 23, 933–938. [Google Scholar] [CrossRef]
  30. Vallianatos, F.; Tzanis, A. A model for the generation of precursory electric and magnetic fields associated with the deformation rate of the earthquake focus. In Atmospheric and Ionospheric Electromagnetic Phenomena Associated with Earthquakes; Hayakawa, M., Ed.; TERRAPUB: Tokyo, Japan, 1999; pp. 287–305. [Google Scholar]
  31. Vallianatos, F.; Triantis, D.; Tzanis, A.; Anastasiadis, C.; Stavrakas, I. Electric earthquake precursors: From laboratory results to field observations. Phys. Chem. Earth Parts A/B/C 2004, 29, 339–351. [Google Scholar] [CrossRef]
  32. Anastasiadis, C.; Stavrakas, I.; Triantis, D.; Vallianatos, F. Correlation of Pressure Stimulated Currents in rocks with the damage parameter. Ann. Geophys. 2007, 50, 1–6. [Google Scholar] [CrossRef]
  33. Kourkoulis, S.K.; Pasiou, E.D.; Loukidis, A.; Stavrakas, I.; Triantis, D. Comparative Assessment of Criticality Indices Extracted from Acoustic and Electrical Signals Detected in Marble Specimens. Infrastructures 2022, 7, 15. [Google Scholar] [CrossRef]
  34. Fursa, T.V.; Petrov, M.; Dann, D.D.; Reutov, Y.A. Evaluating damage of reinforced concrete structures subjected to bending using the parameters of electric response to mechanical impact. Compos. B. Eng. 2019, 158, 34–45. [Google Scholar] [CrossRef]
  35. Sun, M.; Liu, Q.; Li, Z.; Wang, E. Electrical emission in mortar under low compressive loading. Cem. Concr. Res. 2002, 32, 47–50. [Google Scholar] [CrossRef]
  36. Kourkoulis, S.K.; Pasiou, E.D.; Dakanali, I.; Stavrakas, I.; Triantis, D. Notched marble plates under tension: Detecting prefailure indicators and predicting entrance to the “critical stage”. Fatigue Fract. Eng. Mater. Struct. 2018, 41, 776–786. [Google Scholar] [CrossRef]
  37. Pasiou, E.D.; Triantis, D. Correlation between the electric and acoustic signals emitted during compression of brittle materials. Frat. Integrità Strutt. 2017, 11, 41–51. [Google Scholar] [CrossRef] [Green Version]
  38. Triantis, D.; Kourkoulis, S.K. An Alternative Approach for Representing the Data Provided by the Acoustic Emission Technique. Rock Mech. Rock Eng. 2018, 51, 2433–2438. [Google Scholar] [CrossRef]
  39. Zhang, J.Z.; Zhou, X.P.; Zhou, L.S.; Berto, F. Progressive failure of brittle rocks with non-isometric flaws: Insights from acousto-optic-mechanical (AOM) data. Fatigue Fract. Eng. Mater. Struct. 2019, 42, 1787–1802. [Google Scholar] [CrossRef]
  40. Wang, X.; Wang, E.; Liu, X. Damage characterization of concrete under multi-step loading by integrated ultrasonic and acoustic emission techniques. Constr. Build. Mater. 2019, 221, 678–690. [Google Scholar] [CrossRef]
  41. Ju, Y.; Wu, X. Acoustic Emission Characteristics and Failure Prediction of the Granite with Orthogonal Cracks under Compressive Loading. Adv. Civ. Eng. 2020, 2020, 8846290. [Google Scholar] [CrossRef]
  42. Ge, Z.; Sun, Q. Acoustic emission characteristics of gabbro after microwave heating. Int. J. Rock Mech. Min. 2021, 138, 104616. [Google Scholar] [CrossRef]
  43. Main, I.G. Damage mechanics with long-range interactions: Correlation between the seismic b-value and the fractal two-point correlation dimension. Geophys. J. Int. 1992, 111, 531–541. [Google Scholar] [CrossRef]
  44. Rao, M.V.M.S.; Lakshmi, K.J.P. Analysis of b-value and improved b-value of acoustic emissions accompanying rock fracture. Curr. Sci. 2005, 89, 1577–1582. [Google Scholar]
  45. Aggelis, D.G.; Soulioti, D.V.; Sapouridis, N.; Barkoula, N.M.; Paipetis, A.S.; Matikas, T.E. Acoustic emission characterization of the fracture process in fibre reinforced concrete. Constr. Build. Mater. 2011, 25, 4126–4131. [Google Scholar] [CrossRef]
  46. Rouchier, S.; Foray, G.; Godin, N.; Woloszyn, M.; Roux, J.J. Damage monitoring in fibre reinforced mortar by combined digital image correlation and acoustic emission. Constr. Build. Mater. 2013, 38, 371–380. [Google Scholar] [CrossRef] [Green Version]
  47. Loukidis, A.; Triantis, D.; Stavrakas, I.; Pasiou, E.D.; Kourkoulis, S.K. Comparative Ib-value and F-function analysis of Acoustic Emissions from elementary and structural tests with marble specimens. Mater. Des. Process. Commun. 2021, 3, e176. [Google Scholar] [CrossRef] [Green Version]
  48. Behnia, A.; Chai, H.K.; Shiotani, T. Advanced structural health monitoring of concrete structures with the aid of acoustic emission. Constr. Build. Mater. 2014, 65, 282–302. [Google Scholar] [CrossRef]
  49. Loukidis, A.; Stavrakas, I.; Triantis, D. The relaxation processes of Pressure Stimulated Currents under the concept of Non-extensive statistical physics. Procedia Struct. Integr. 2020, 26, 277–284. [Google Scholar] [CrossRef]
  50. Triantis, D.; Vallianatos, F.; Stavrakas, I.; Hloupis, G. Relaxation phenomena of electrical signal emissions from rock following application of abrupt mechanical stress. Ann. Geophys. 2012, 55, 207–212. [Google Scholar] [CrossRef]
  51. Triantis, D.; Loukidis, A.; Stavrakas, I.; Pasiou, E.D.; Kourkoulis, S.K. Attenuation of the Acoustic Activity in Cement Beams under Constant Bending Load Closely Approaching the Fracture Load. Foundations 2022, 2, 590–606. [Google Scholar] [CrossRef]
  52. Triantis, D.; Kourkoulis, S. Fracture precursor phenomena in marble specimens under uniaxial compression by means of Acoustic Emission data. Frat. Integrità Strutt. 2019, 13, 537–547. [Google Scholar] [CrossRef] [Green Version]
  53. Triantis, D.; Stavrakas, I.; Pasiou, E.D.; Kourkoulis, S.K. Assessing the acoustic activity in marble specimens under stepwise compressive loading. Mater. Des. Process. Commun. 2020, 2, e100. [Google Scholar] [CrossRef]
Figure 1. The experimental set-up for the concurrent recordings of the axial deformation, the PSC and the AE.
Applsci 13 00365 g001
Figure 2. The PSC, the stress and the axial deformation variations, depicted with respect to time.
Applsci 13 00365 g002
Figure 3. The temporal variation of the AE hit amplitudes and the axial deformation variation, depicted with respect to time.
Applsci 13 00365 g003
Figure 4. Temporal evolution of the F- and P-functions in juxtaposition with the axial mechanical deformation.
Applsci 13 00365 g004
Figure 5. Temporal evolution of the b-value in juxtaposition with the axial mechanical deformation.
Applsci 13 00365 g005
Figure 6. Temporal variations of the applied mechanical load, the PSC, F-function in juxtaposition with the axial mechanical deformation and the b-value.
Applsci 13 00365 g006
Figure 7. Temporal evolution of the F- function and the PSC in juxtaposition with the axial mechanical deformation, during the stay of the specimen under a constant load regime until fracture.
Applsci 13 00365 g007
Disclaimer/Publisher’s Note: The statements, opinions and data contained in all publications are solely those of the individual author(s) and contributor(s) and not of MDPI and/or the editor(s). MDPI and/or the editor(s) disclaim responsibility for any injury to people or property resulting from any ideas, methods, instructions or products referred to in the content.

