Abstract
Magnetic resonance sounding (MRS) is a non-invasive, direct, and quantitative geophysical method for detecting groundwater, and has been widely used in groundwater survey, water resource assessment, and disaster water source forecasting. However, the MRS signal is weak (nV level) and highly susceptible to environmental noise, such as random noise and power-line harmonics, resulting in reduced quality of received data. Achieving reliable extraction of MRS signals under strong noise is difficult. To solve this problem, we propose a matching pursuit algorithm based on sparse decomposition theory for data noise suppression and MRS signal extraction. In accordance with the characteristics of the signal and noise, an oscillating atomic library is constructed as a sparse dictionary to realize signal sparse decomposition. A two-step denoising strategy is proposed to reconstruct the power-line harmonics and then extract the MRS signal. We simulated synthetic data with different signal-to-noise ratios (SNRs), relaxation times, and Larmor frequencies. Our results show that the proposed algorithm can effectively remove power-line harmonics and reduce random noise. SNR is significantly improved by up to 35.6 dB after denoising. The effectiveness and superiority of the proposed algorithm are further verified by the measured data and through comparison with the singular spectrum analysis algorithm and harmonic modeling cancellation algorithm.
1. Introduction
Compared to geophysical methods of indirect water detection, such as ground penetrating radar, electromagnetic method, and resistivity sounding, magnetic resonance sounding (MRS) is currently the only approach in the world that directly detects groundwater. The MRS method provides a quantitative interpretation of information on the location, thickness, water content, and pore size distribution of an aquifer [1]. Therefore, the method is widely used in water resource exploration and evaluation [2], dam leakage, and mine/tunnel inrush [3].
In field applications, random noise and power-line harmonics in the environment and spikes caused by natural or artificial discharge are serious obstacles to the effective application of MRS. Spike noise generally has a short duration and a much higher amplitude than the MRS signal. Statistical analysis and methods [4], such as nonlinear energy operators [5,6] and spike modeling [7], are often used for the identification and removal of spikes. Random noise and power-line harmonics seriously damage the quality of MRS signals. Therefore, this study mainly investigates the reliable extraction of MRS signals under the interference of strong power-line harmonics and random noise. Many studies have been conducted on noise suppression methods for MRS signals in recent years. Tian et al. [8,9] used an adaptive noise cancellation (ANC) algorithm for power-line harmonic noise suppression. However, their algorithm can obtain good results only when the noise correlation between the detection and reference channels is large. Dalgaard et al. [5] compared the filtering performance of the Wiener filter and ANC algorithm, and the results showed that the filtering effect of the two is equivalent. Regarding the removal of power-line harmonics, Larsen et al. [10] proposed a method based on the combination of power-line harmonic modeling and multichannel Wiener filtering. Tian et al. [11] proposed a combination of harmonic modeling and autocorrelation to suppress power-line harmonics and random noise. Wang et al. [12] and Liu et al. [13] proposed a removal algorithm for co-frequency harmonics (when a harmonic frequency is the same or similar to the Larmor frequency). Li et al. [14] introduced a frame-based denoising method based on multichannel Wiener filtering in the frequency domain. The results show that the frame-based method improves denoising when the harmonic noise has asynchronous variations and multiple sources.
With regard to the suppression of random noise, Wang et al. [15] used the sparse representation method to extract nuclear magnetic resonance signals. Lin et al. [16] used time-frequency peak filtering to suppress random noise. Yao et al. [17] proposed an approach for intensive sampling sparse reconstruction (ISSR) and kernel regression estimation (KRE) to suppress random noise. Li et al. [18] used maximum likelihood estimation (MLE) to estimate nuclear magnetic resonance (NMR) parameters and suppress random noise in MRS. In addition, an algorithm for noise suppression of MRS signals from a statistical perspective has been proposed. The empirical mode decomposition algorithm based on statistical optimization has been used to extract the attenuation trend of effective MRS signals, although it exerts a good effect only when the SNR is high [19]. The independent component analysis method has been adopted for the extraction of effective MRS signals under multisource mixed noise [20]. The singular spectrum analysis (SSA) method has been utilized for filtering and parameter estimation of MRS data, and has achieved good results [21].
The above analysis shows that various methods achieve certain effects on improving the SNR of MRS signals. However, due to the complexity of environmental noise and multisource characteristics, the noise suppression problem of MRS signals remains challenging. Matching pursuit (MP) was proposed by Mallat [22]. The idea behind MP is to spread the signal on a redundant atomic library and achieve an adaptive representation of the signal by selecting the atoms that match the signal via successive iterative matching. The method has been widely applied in various fields [23,24].
This study is based on the MP algorithm, and aims to solve the problem of extracting reliable MRS signals under strong power-line harmonics and random noise. First, an oscillating atomic library is constructed based on the characteristics of the MRS signal and power-line harmonics. Second, a two-step denoising method for suppressing harmonics and extracting the MRS signal is implemented to suppress random noise. Finally, the validity of the proposed method is verified through simulation experiments, evaluation of measured data, and comparative analysis with other algorithms.
2. Algorithm Principle
2.1. Sparse Decomposition of Signals
A dictionary matrix D represents the atomic library of N dimensional Hilbert space, as follows:
where is an atom in an over-complete atomic library and is normalized as = 1 and K is the number of atoms in dictionary D. Let be a signal to be decomposed, and let N be the signal length. The signal can be adaptively represented as a linear combination of certain atoms, as follows:
where and are expansion coefficients. If the signal can be linearly represented by a few atoms with coefficients that are not zero, then approximation of the signal is achieved.
2.2. Dictionary Construction Based on an Oscillatory Atomic Library
Building an appropriate sparse dictionary is a prerequisite for a signal to be sparsely represented. The selected dictionary should be as close as possible to the structure of the signal. If a correlation algorithm is used to find a few atoms with the best linear combination from the dictionary to represent the signal to be approximated, then the dictionary (atomic library) can be called the best dictionary. The processed object in this study is the MRS signal, and its expression is as follows:
where is the initial amplitude, which is related to the water content; indicates the transverse relaxation time and is related to the pore size distribution; indicates Larmor frequency, which is related to the Earth’s magnetic field and whose global variation range is 1.3–3.7 kHz; and is the initial phase related to the conductivity of the subsurface medium and other factors. Equation (3) shows that the MRS signal is a cosine signal with an exponential decay characteristic.
Power-line harmonic noise is a set of sine waves generated by power lines. Its expression is
where and are the amplitude and phase of the n-th harmonic, respectively; N is the number of harmonics; and is the fundamental frequency of the power-line harmonic. Theoretically, = 50 Hz; however, a certain degree of fluctuation exists. The use of an oscillating atomic library for the construction of sparse dictionaries is proposed in this study by combining Equations (3) and (4).
where f is the oscillation frequency; is the oscillation phase, and its range is (rad); and is the oscillation attenuation coefficient, where 0. When , it is an attenuated oscillation and corresponds to the MRS signal. When , it is a cosine signal that corresponds to the power-line harmonics. Here, is normalized to obtain the coefficient . In the construction of the atomic library, each parameter in the parameter group should be discretized, where . Each parameter in this work was discretized as follows:
The correspondence between the atomic and discretized parameters is
By simplifying the relationship between Equations (6) and (7), the discrete parameter p and and signal frequency f were obtained.
The relationship between the discrete parameters r and is
2.3. MP Denoising Algorithm
For the power-line harmonics and random noise in the MRS signal, we propose an MP denoising algorithm based on an oscillating atomic library. The specific implementation steps include the following:
(1) Construction of an over-complete atomic library
An oscillatory atomic library was constructed according to Equation (5). To satisfy the over-completeness of the atomic library, an atom in the atomic library was required to be redundant, that is, the number of atoms K was much larger than the signal length N.
(2) Removal of power-line harmonics
Let = 0; then, the p value corresponding to each power-line harmonic point was calculated according to Equation (8), and the search range and search step length corresponding to the p value of each power-line harmonics point were set. Then, the atom with the highest degree of similarity to the signal to be decomposed was searched for in the over-complete atomic library, such that
where is the inner product of the signal to be decomposed s, the atom , represents the projection of s in the direction , and is the remaining part of the signal to be decomposed, and is called the residual error. Evidently, and are orthogonal, that is,
If the energy of residual signal is to be minimized, then should be selected in the atomic library to maximize the value of and achieve the best search.
Next, a repeated iteration was performed to realize sparse decomposition of noisy data, and the best atom found was linearly combined to complete the reconstruction of the current power-line harmonic. The reconstruction method was
where M represents the number of atoms selected. Finally, the reconstructed power-line harmonic was subtracted from the MRS signal, and the search range for the value of p was updated. Step (2) was looped until all power-line harmonics were removed.
(3) Extraction of MRS signals
Let 0; then, the discretization parameters p and r corresponding to the Larmor frequency can be calculated according to Equation (8), and their search ranges and search step sizes can be determined. After this, the atom that best matched the MRS signal was determined according to Equation (10). Finally, the MRS signal was directly reconstructed according to the best atom found using Equation (12).
3. Simulation Experiment
To demonstrate that the MP algorithm based on the oscillating atomic library can effectively remove the noise of the MRS signal, the feasibility and performance of the algorithm were analyzed in detail through simulation experiments under different parameters.
3.1. Algorithmic Implementation
The simulation parameters were set to a sample rate = 25 kHz and sample duration t = 1 s. In accordance with Equation (3), the parameters of the MRS signal were set as follows: = 200 nV, = 200 ms, = rad, = 2325 Hz. Seven power-line harmonics and random noise generated randomly in phase rad were added to the data in the range of Hz. Two sets of noisy MRS data with different SNRs were constructed by changing the magnitude of the processed power-line harmonics and random noise. The first set of data harmonic amplitudes was randomly generated within nV. the random noise amplitude was 25 nV, and the SNR was −6 dB. The second set of data harmonic amplitudes was randomly generated within nV; the random noise amplitude was 250 nV, and the SNR was −20 dB. was obtained according to Equation (8). Thus, the search range in which the discrete parameter p value was set was ±10 of each frequency point; this was the range of the search value, and the search step length was 0.5. All values of the discretization parameter r between and ms were calculated according to Equation (9) and searched. The harmonic modeling cancellation (HMC) method is a method for modeling based on the expression of power frequency harmonic signals; after using the least square method to obtain parameters, power frequency harmonic elimination can be achieved by subtracting them from the original noisy signals [10]. This method is often used for algorithm comparison in the MRS field. Therefore, the proposed MP algorithm based on the oscillating atomic library and the HMC method were used to process two sets of simulated noisy data, with the results shown in Figure 1 and Figure 2.
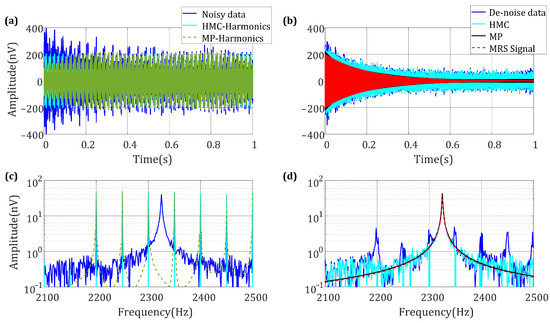
Figure 1.
Denoising results of the MP algorithm when SNR = −5.98 dB: (a) noisy data and reconstructed power-line harmonics by MP and HMC; (c) is the corresponding spectrum. (b) After removing the harmonics, the MRS signal is extracted by MP and HMC; (d) is the corresponding spectrum.
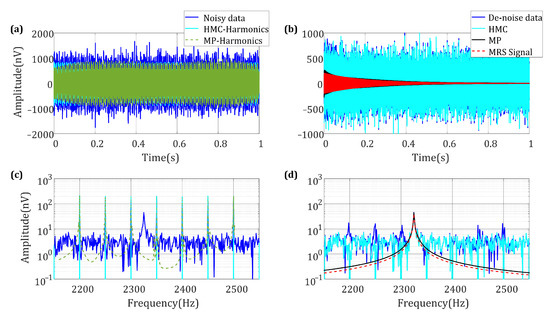
Figure 2.
Denoising results of the MP algorithm when SNR = −20.05 dB: (a) noisy data and reconstructed power-line harmonics by MP and HMC; (c) is the corresponding spectrum. (b) After removing the harmonics, the MRS signal is extracted by MP and HMC; (d) is the corresponding spectrum.
Figure 1 and Figure 2 show that distinguishing the MRS signal in the noise is difficult. The power-line harmonics can be reconstructed accurately by limiting = 0 through the MP algorithm based on the oscillating atomic library. The residual signal was obtained after the reconstruction was successively subtracted; the blue line in (b) and (d) is the residual signal after removing the power-line harmonics. After the first step of harmonic removal, the MRS signal shape could mostly be recovered, leaving only random noise and a small amount of harmonic residue. Through the second step of the algorithm, 0 was defined and the MRS signal was reconstructed directly. The extraction results are shown in Figure 1b,d and Figure 2b,d. The noisy MRS data under different SNR values could be effectively filtered for noise after two-step denoising by the MP algorithm based on the oscillating atomic library. The characteristic parameters of the two sets of denoised data were extracted by nonlinear fitting. The errors were as follows: = −1.48%, = 0.64% for the first set; = 1.18%, = −2.19% for the second set. The improvement values of SNR after denoising were = 29.37 dB and = 34.74 dB, respectively, which demonstrates the accuracy of the MP denoising algorithm based on the oscillating atomic library. The harmonic modeling cancellation algorithm was used to process the above two sets of data, with the following error obtained for the fitting data: = 1.0762%, = −1.2532% for the first set; = −20.2722%, = 190.4786% for the second set. The improvement in the signal-to-noise ratio before and after noise removal is = 11.145 dB and = 5.0815 dB, respectively. It can be seen that for the first set of data, the processing effect of the HMC method and MP algorithm is roughly the same, as only 25 nV random noise is added to this set of data. For the second set of data, the data fitting error is particularly large, because this set of data adds 250 nV random noise, and the HMC algorithm has no ability to deal with random noise. In conclusion, the proposed MP algorithm based on the oscillating atomic library has better performance.
3.2. Analysis of Denoising Effects under Different
is one of the most important parameters of the MRS signal. The following denoising simulation experiments were performed under different values. On the basis of the simulation data in Section 3.1, the random amplitude was 150 nV, the power frequency amplitude was in range of nV, and the variation range of was ms. For each group, the algorithm was executed 20 times under the same . The noise reduction results are shown in Table 1.

Table 1.
Denoising results under different .
Table 1 shows that when the noisy MRS data under different values were denoised by the MP algorithm, the SNR was improved by up to 35.55 dB. The uncertainty of gradually decreased as increased, and the relative uncertainty of decreased with the increase in .
3.3. Analysis of Denoising Effects under Different
Power-line harmonics pose a serious problem in MRS signal denoising when is close to or even completely coincident with a power-line harmonic frequency. At present, most denoising algorithms cannot easily achieve effective separation of signals and noise. One of the most important aspects in investigating the universality of an algorithm is that the algorithm should be able to solve the harmonic removal of frequency deviation within the range of a few hertz. On the basis of the simulation data in Section 3.1, two adjacent power-line harmonics, 2300 Hz and 2350 Hz, both near , were added, and the amplitude was randomly generated within nV. The value of the MRS signal was set at 2306 Hz to 2301 Hz, the difference between the nearest harmonic was within Hz, and random noise with amplitude 150 nV was added to form the noisy MRS signal. For each group, the algorithm was executed 20 times under condition . The denoising results for different values are shown in Table 2.
Table 2.
Denoising results under different Larmor frequencies .
Table 2 shows that when the frequency difference was within 3 Hz, the range of uncertainty of the fitted and was large. However, as the frequency difference increased, the uncertainty of the fitting result decreased, and the reconstruction accuracy was improved. Figure 3 shows the time-domain and frequency-domain diagrams before and after noise cancellation when was 2305 Hz, 2303 Hz, and 2301 Hz. Figure 3b,d,f shows that the noise was effectively filtered out. Even the power-line harmonic of 2300 Hz, which was the nearest to , could be accurately reconstructed and removed. After denoising by this algorithm, SNR was improved remarkably and the lifting range was 24.46 dB∼33.79 dB, illustrating the universality of the MP algorithm.
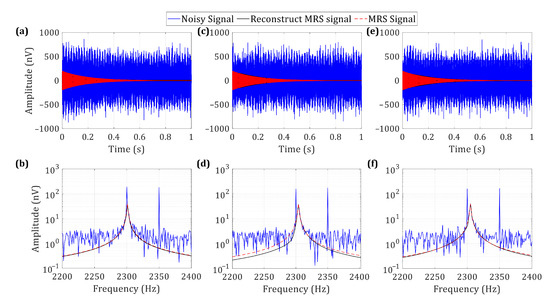
Figure 3.
Comparison of denoising results under different : (a) = 1 Hz, (b) is the corresponding spectrum; (c) = 3 Hz, (d) is the corresponding spectrum; (e) = 5 Hz, (f) is the corresponding spectrum.
4. Measured Signal Processing
4.1. Generator Data Processing
To verify the application effect of the algorithm, different amplitudes of MRS signals were transmitted through a signal generator in the laboratory. The JLMRS instrument was used to acquire noisy MRS data, which were then processed by the MP algorithm based on the oscillating atomic library. The transmitting frequency of the signal generator was 2355 Hz, = 200 ms. Nine sets of MRS signals with different transmitting amplitudes were generated; the initial amplitude of the obtained signals was in the range of 5 V ∼ 45 V. The corresponding SNR range was −10 dB to −28 dB. The error maps of and after denoising with the MP algorithm are shown in Figure 4.
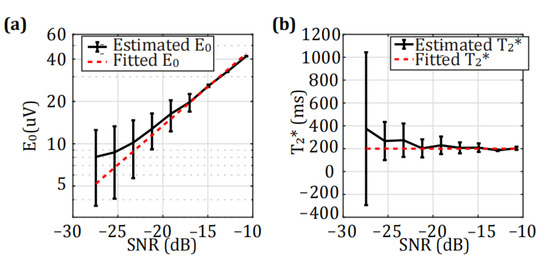
Figure 4.
Fitting error maps of and after denoising by the MP algorithm under different SNR. (a) , (b) .
As shown in Figure 4, the uncertainty of and increased as SNR decreased. When SNR was −28 dB, the uncertainty of and deviated greatly from the result of the fitting, meaning that the MP algorithm failed.
As indicated in Figure 5, the amplitude of the signal generator was adjusted to make the SNR = −10.7 dB, −12.8 dB, and −14.9 dB. As SNR decreased, the error when extracting the MRS signal using the SSA algorithm increased gradually. When SNR was −14.9 dB, the SSA algorithm failed. However, the MP algorithm was able to remove noise effectively and extract reliable MRS signals.
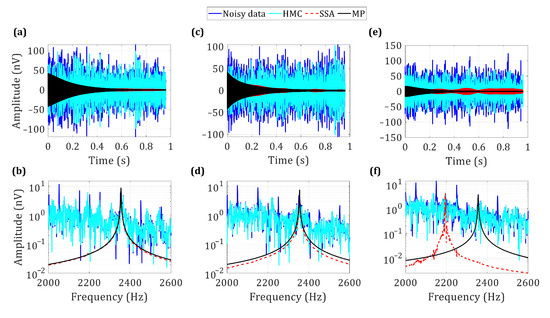
Figure 5.
Comparison of the denoising results of the MP, SSA, and HMC algorithms under different SNRs: (a) SNR = −10.7 dB, (b) is the corresponding spectrum; (c) SNR = −12.8 dB, (d) is the corresponding spectrum; (e) SNR = −14.9 dB, (f) is the corresponding spectrum.
Figure 6 shows that when the amplitude of the transmission were fixed and the frequency difference was set to 1, 3, and 5 Hz by changing , the denoising effects of the MP and SSA algorithms were able to eliminate the noise. In addition, Figure 6 shows that when the frequency difference was 1 and 3 Hz, the denoising effect of the MP algorithm was better than that of the SSA algorithm. As the frequency difference was further reduced, the MP algorithm’s denoising effect deteriorated gradually; however, it remained better than that of the SSA algorithm.
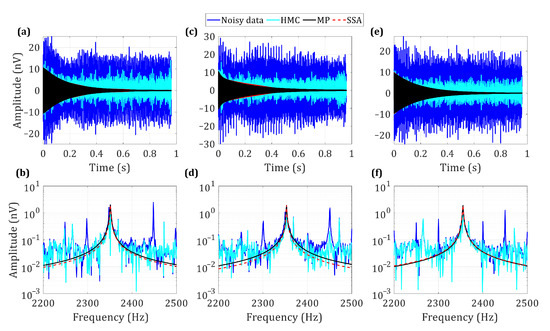
Figure 6.
Comparison of denoising reuslts of the MP, SSA, and HMC algorithms with a frequency difference of 1, 3, and 5 Hz: (a) = 1 Hz, (b) is the corresponding spectrum; (c) = 3 Hz, (d) is the corresponding spectrum; (e) = 5 Hz, (f) is the corresponding spectrum.
As shown in Figure 7, when was 200, 300, and 400 ms, the MP and SSA algorithms could eliminate noise effectively, and the denoising effects were close. As continued to decrease, the denoising effects of both algorithms gradually deteriorated.
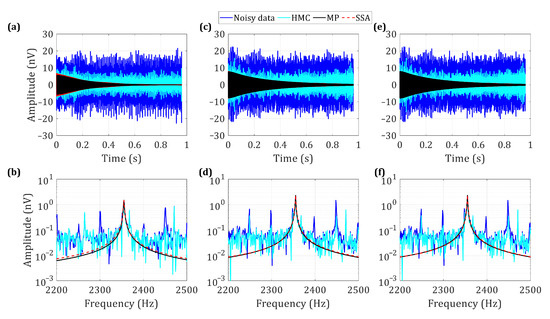
Figure 7.
Comparison of denoising results of the MP, SSA, and HMC algorithms with of 200, 300, and 400 ms: (a) = 200 ms, (b) is the corresponding spectrum; (c) = 300 ms, (d) is the corresponding spectrum; (e) = 400 ms, (f) is the corresponding spectrum.
In Figure 5, Figure 6 and Figure 7, the HMC algorithm only realizes the removal of power frequency harmonic interference. Due to the complexity of the measured electromagnetic noise, there is a lot of random noise and other frequency interference in the environment, and the HMC algorithm has no ability to deal with this interference. To sum up, it can be seen that MP algorithm achieves better performance under different signal-to-noise ratios, different Larmor frequencies, and different relaxation times.
4.2. Field Data Processing
In order to better verify the performance of the algorithm in real groundwater detection signal processing, field measurement data processing examples were further developed. The experimental site we used is next to Taipingchi Reservoir in Shaoguo Town, Changchun City. The reservoir has water all year round, ensuring that there is a magnetic resonance groundwater signal for the instrument to detect. The JLMRS-Array magnetic resonance detector independently developed by Jilin University was used as the detection instrument. The experiment was carried out in the poplar forest near the reservoir. Because the surrounding area is farmland without too many electrical facilities, the noise interference was relatively small. During the experiment, 16 sets of pulse moments were set up and transmitted successively using a square coil with a side length of 100 m. The local Larmor frequency was 2337 Hz and the sampling rate was 52,734 Hz. We selected two sets of data under the fifth and seventh pulse moments to analyze the actual application effect of the algorithm. The results are shown in Figure 8. It can be seen from the processing results of the two sets of data in Figure 8 that the MP, SSA, and HMC algorithms all achieve noise suppression and MRS signal extraction, and the Larmor frequency of MRS signal extracted after algorithm processing is stable at 2337 Hz. The HMC algorithm cannot process other types of frequency interference other than random and harmonic noise, making its processing effect slightly poor, and as a result the signal-to-noise ratio only increases by 10.88 dB. The MP and SSA algorithms achieve relatively good performance, and the signal-to-noise ratio is improved by 19.92 dB and 19.16 dB, respectively. Therefore, from the shape of time domain and frequency spectrum curves as well as the numerical value of the improvement in signal to noise ratio, the MP algorithm is superior to the SSA and HMC algorithms, and obtains a good processing effect on real field-measured groundwater detection data.
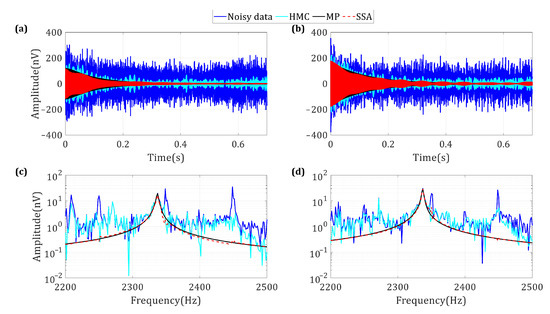
Figure 8.
Processing results of field-measured data: (a) the results processing with the MP, HMC, and SSA algorithms under the fifth pulse moment and the time domain waveform of SNR = −8.42 dB data, with (c) the corresponding spectrum, and (b) under the seventh pulse moment and the time domain waveform of SNR = −4.71 dB data, with (d) the corresponding spectrum.
5. Conclusions
To address the problem that MRS signals are difficult to reliably extract in the application process, noise suppression and MRS signal extraction methods based on matching pursuit with an oscillating atomic library were studied in reference to the sparse decomposition principle. In accordance with the oscillation characteristics shared by the MRS signal and power-line harmonics, an oscillating atomic library dictionary was constructed, and the parameters and were used to distinguish the power-line harmonics and MRS signals. In the process of MP algorithm implementation, a two-step denoising approach involving extracting the harmonics from the original signal and then extracting the MRS signal to suppress random noise was adopted to realize the effective removal of noise in the MRS data. The following conclusions were obtained by comparing the simulation test results of noisy MRS data under different SNRs, , and . The proposed algorithm achieved good results in SNR enhancement, time-domain and frequency-domain signals before and after denoising, and parameter estimation of extracted signals. Moreover, SNR could be improved by up to 36 dB, and the uncertainty of the initial amplitude and average relaxation time was small. The processing results of the measured data further verified the effectiveness and practicability of the algorithm. Compared with the SSA and HMC algorithms, the proposed MP algorithm can remove power-line harmonics and random noise effectively, and it has advantages over SSA and HMC in terms of SNR improvement and parameter estimation.
Author Contributions
Conceptualization, B.T. and H.L.; methodology, X.L.; software, X.L.; validation, H.D. and L.W.; formal analysis, L.W. and H.Z.; investigation, X.L.; resources, L.W. and H.Z.; data curation, H.D. and L.W.; writing—original draft preparation, X.L., L.W. and B.T.; writing—review and editing, X.L., H.D. and B.T.; visualization, X.L. and H.D.; supervision, H.L.; project administration, B.T.; funding acquisition, B.T. All authors have read and agreed to the published version of the manuscript.
Funding
This study was supported by the National Key Research and Development Program: Research on Observation Technology of Airborne Magnetic Vector Gradients of Low Temperature Superconductors (2021YFB3900201).
Institutional Review Board Statement
This study does not involve humans or animals.
Informed Consent Statement
This study does not involve humans.
Data Availability Statement
The data used in this study involves the privacy of the project. If necessary, contact the corresponding author to obtain.
Acknowledgments
This work was supported in part by the National Science Foundation of China (Grants No. 41604083 and 41704103), the Natural Science Foundation of Jilin Province (Grants No. 20190201111JC and 20160101281JC), and the Fundamental Research Funds for the Central Universities.
Conflicts of Interest
The authors declare no conflict of interest.
References
- Behroozmand, A.A.; Keating, K.; Auken, E. A Review of the Principles and Applications of the NMR Technique for Near-Surface Characterization. Surv. Geophys. 2015, 36, 27–85. [Google Scholar] [CrossRef]
- Lin, T.T.; Jiang, C.D.; Xin, Q.I.; Shi, W.L.; Duan, Q.M.; Lin, J. Theories and key technologies of distributed surface magnetic resonance sounding. Chin. J. Geophys. 2013, 56, 3651–3662. [Google Scholar]
- Qin, S.; Ma, Z.; Lin, J.; Xue, Y.; Li, Z. New Method for Detecting Risk of Tunnel Water-Induced Disasters Using Magnetic Resonance Sounding. IEEE Geosci. Remote. Sens. Lett. 2018, 15, 843–847. [Google Scholar] [CrossRef]
- Jiang, C.; Lin, J.; Duan, Q.; Sun, S.; Tian, B. Statistical stacking and adaptive notch filter to remove high-level electromagnetic noise from MRS measurements. Surf. Geophys. 2011, 9, 459–468. [Google Scholar] [CrossRef]
- Dalgaard, E.; Auken, E.; Larsen, J.J. Adaptive noise cancelling of multichannel magnetic resonance sounding signals. Geophys. J. Int. 2012, 191, 88–100. [Google Scholar] [CrossRef]
- Wan, L.; Zhang, Y.; Lin, J.; Jiang, C.D.; Lin, T.T. Spikes removal of magnetic resonance sounding data based on energy calculation. Chin. J. Geophys. 2016, 59, 2290–2301. [Google Scholar]
- Larsen, J.J. Model-based subtraction of spikes from surface nuclear magnetic resonance data. Geophysics 2016, 81, WB1–WB8. [Google Scholar] [CrossRef]
- Tian, B.F.; Lin, J.; Duan, Q.M. Variable step adaptive noise cancellation algorithm for magnetic resonance sounding signal with a reference coil. Chin. J. Geophys. 2012, 55, 2462–2472. [Google Scholar]
- Tian, B.; Zhou, Y.; Zhu, H.; Jiang, C.; Yi, X. Noise cancellation of a multi-reference full-wave magnetic resonance sounding signal based on a modified sigmoid variable step size least mean square algorithm. J. Cent. South Univ. 2017, 24, 900–911. [Google Scholar] [CrossRef]
- Larsen, J.J.; Dalgaard, E.; Auken, E. Noise cancelling of MRS signals combining model-based removal of powerline harmonics and multichannel Wiener filtering. Geophys. J. Int. 2013, 196, 828–836. [Google Scholar] [CrossRef]
- Tian, B.; Zhu, H.; Yi, X.; Du, G.; Jiang, C. Denoising and extraction method of magnetic resonance sounding signal based on adaptive harmonic modeling and autocorrelation. Chin. J. Geophys. 2018, 61, 767–780. [Google Scholar]
- Wang, Q.; Jiang, C.; Mullerpetke, M. An alternative approach to handling co-frequency harmonics in surface nuclear magnetic resonance data. Geophys. J. Int. 2018, 215, 1962–1973. [Google Scholar] [CrossRef]
- Liu, L.; Grombacher, D.; Auken, E.; Larsen, J.J. Removal of Co-Frequency Powerline Harmonics From Multichannel Surface NMR Data. IEEE Geosci. Remote Sens. Lett. 2018, 15, 53–57. [Google Scholar] [CrossRef]
- Li, F.; Li, K.-t.; Lu, K.; Li, Z.-Y. Cancellation of varying harmonic noise in magnetic resonance sounding signals. J. Appl. Geophys. 2020, 177, 104047. [Google Scholar] [CrossRef]
- Wang, Q.; Tian, B.; Zhang, J.; Jiang, C. Surface nuclear magnetic resonance signal extraction based on the sparse represantation. Chin. J. Geophys. 2018, 61, 3446–3456. [Google Scholar]
- Lin, T.; Zhang, Y.; Yang, Y.; Yang, Y.; Teng, F.; Wan, L. Segmented time-frequency peak filtering for random noise reduction of MRS oscillating signal. Chin. J. Geophys. 2018, 61, 3812–3824. [Google Scholar]
- Yao, X.; Zhang, J.; Yu, Z.; Zhao, F.; Sun, Y. Random Noise Suppression of Magnetic Resonance Sounding Data with Intensive Sampling Sparse Reconstruction and Kernel Regression Estimation. Remote Sens. 2019, 11, 1829. [Google Scholar] [CrossRef]
- Li, F.; Li, K.; Lu, K.; Li, Z. Random noise suppression and parameter estimation for Magnetic Resonance Sounding signal based on maximum likelihood estimation. J. Appl. Geophys. 2020, 176, 104007. [Google Scholar] [CrossRef]
- Ghanati, R.; Fallah-Safari, M.; Hafizi, M.K. Joint application of a statistical optimization process and Empirical Mode Decomposition to Magnetic Resonance Sounding Noise Cancelation. J. Appl. Geophys. 2014, 111, 110–120. [Google Scholar] [CrossRef]
- Tian, B.; Zhou, Y.; Wang, Y.; Li, Z.; Xiaofeng, Y. Noise cancellation method for full-wave magnetic resonance sounding signal based on independent component analysis. Chin. J. Geophys. 2015, 64, 442–453. [Google Scholar]
- Ghanati, R.; Hafizi, M.K.; Mahmoudvand, R.; Fallahsafari, M. Filtering and parameter estimation of surface-NMR data using singular spectrum analysis. J. Appl. Geophys. 2016, 130, 118–130. [Google Scholar] [CrossRef]
- Mallat, S.; Zhang, Z. Matching pursuits with time-frequency dictionaries. IEEE Trans. Signal Process. 1993, 41, 3397–3415. [Google Scholar] [CrossRef]
- Marsousi, M.; Abhari, K.; Alirezaie, J.; Babyn, P. MULTI-STAGE OMP sparse coding using local matching pursuit atoms selection. In Proceedings of the IEEE International Conference on Acoustics, Vancouver, BC, USA, 26–31 May 2013. [Google Scholar]
- Ali, H.; Ahmed, S.; Al-Naffouri, T.Y.; Alouini, S. Reduction of snapshots for MIMO radar detection by block/group orthogonal matching pursuit. In Proceedings of the Radar Conference, Rome, Italy, 10–15 May 2015. [Google Scholar]


Disclaimer/Publisher’s Note: The statements, opinions and data contained in all publications are solely those of the individual author(s) and contributor(s) and not of MDPI and/or the editor(s). MDPI and/or the editor(s) disclaim responsibility for any injury to people or property resulting from any ideas, methods, instructions or products referred to in the content. |
© 2022 by the authors. Licensee MDPI, Basel, Switzerland. This article is an open access article distributed under the terms and conditions of the Creative Commons Attribution (CC BY) license (https://creativecommons.org/licenses/by/4.0/).