Review

Review: Renewable Energy in an Increasingly Uncertain Future

1
Department of Design, Monash University-Caulfield Campus, P.O. Box 197, Caulfield East, VIC 3145, Australia
2
Department of Mechanical and Aerospace Engineering, Monash University-Clayton Campus, P.O. Box 31, Clayton, VIC 3800, Australia
*
Author to whom correspondence should be addressed.
Appl. Sci. 2023, 13(1), 388; https://doi.org/10.3390/app13010388
Submission received: 14 December 2022 / Revised: 24 December 2022 / Accepted: 26 December 2022 / Published: 28 December 2022
(This article belongs to the Special Issue New Developments and Prospects in Clean and Renewable Energies)

Abstract

:
A number of technical solutions have been proposed for tackling global climate change. However, global climate change is not the only serious global environmental challenge we face demanding an urgent response, even though atmospheric CO2 ppm have risen from 354 in 1990 to 416 in 2020. The rise of multiple global environmental challenges makes the search for solutions more difficult, because all technological solutions give rise to some unwanted environmental effects. Further, not only must these various problems be solved in the same short time frame, but they will need to be tackled in a time of rising international tensions, and steady global population increase. This review looks particularly at how all these environmental problems impact the future prospects for renewable energy (RE), given that RE growth must not exacerbate the other equally urgent problems, and must make a major difference in a decade or so. The key finding is that, while the world must shift to RE in the longer run, in the short term what is more important is to improve Earth’s ecological sustainability by the most effective means possible. It is shown that reducing both the global transport task and agricultural production (while still providing an adequate diet for all) can be far more effective than converting the energy used in these sectors to RE.

1. Introduction: Earth Faces Not One but Several Urgent Environmental Challenges

A large variety of technical solutions have been proposed for tackling global climate change (CC). The list includes the various forms of renewable energy (RE), nuclear energy, energy efficiency gains, carbon dioxide removal (CDR) approaches (both biological and mechanical) and an array of solar geoengineering (SG) approaches. (The most-discussed SG approach is to inject sulphate aerosols into the lower stratosphere to reduce insolation.) RE sources have been extensively researched as a solution because of their potential for replacing fossil fuels (FFs) with low-carbon alternatives. One example would be geothermal energy as discussed by Gizzi [1].
However, global climate change is not the only serious global environmental challenge we face, and all demand an urgent response. Others include general deterioration of the oceanic environment [2], as illustrated by the rising number of hypoxic regions, already over 400 by 2008, with the largest covering 70,000 km2 [3]. Ocean acidification is intensifying: ocean pH has fallen from 8.20 to 8.04 over the past seven decades. More than half of marine organisms have shells containing the mineral aragonite, but if pH falls to 7.95, they will be unable to form such shells, and this disastrous 7.95 pH level could occur as early as 2040 [4]. Another ocean problem is the loss of phytoplankton. Total ocean biomass continues its long-term decline, and is now falling at around one percent annually [4,5]. Plastic and chemical pollution of the oceans—and lands—is rising [6]. In brief, the oceans are dying.
Globally, Earth’s ecosystems are experiencing a loss of functional biodiversity. Indeed, Naeem et al. [7] regard global biodiversity loss as more urgent than CC. This loss is more important than the number of species lost, as for many species, their population numbers are so low locally that they can have little impact on the ecosystem they inhabit. Earth’s ecosystems are now dominated by a single species—homo sapiens. According to Dirzo et al. [8], the animals that we raise for food, for work, or as animal companions, account for 76% of all terrestrial vertebrate mass, and we humans, another 23%. Animals living in the wild now account for just 1% of the total.
For these reasons, Dirzo and colleagues believe we are already in a sixth Mass Extinction event. Bradshaw et al. [9] have given a list of 14 global environmental variables such as terrestrial vegetation, wetland areas and live coral cover that are suffering major declines. Further, terrestrial biomass—mostly trees and forests—has declined by 50% over the past two millennia [10]. Some researchers, such as Gowdy [11], accordingly argue that the future will be return to a very simple existence (for Gowdy, a hunter-gatherer future). Paul and Anne Ehrlich [12] concluded similarly, writing that: ‘A much smaller population size should be a long-range goal for Homo sapiens, but reaching it humanely will take numerous generations […]’.
Dellasala et al. [13] have stressed ‘the inextricable link between biodiversity and climate change,’ and that both must be solved together. Earth’s biosphere contains enormous carbon stocks that have the potential to fundamentally alter the trajectory of climate change. Biodiversity is crucial for stabilizing these carbon stocks and keeping them out of the atmosphere. Biodiversity loss is also implicated in the rise of zoonotic diseases such as COVID-19. McCallum [14] put in bluntly in his eponymous article ‘Lose biodiversity, gain disease’.
As Dryden [5] has noted, these other challenges to global sustainability have been largely ignored until recently. Bradshaw et al. [9] have also pointed out that even scientists do not fully appreciate the gravity of the sustainability challenges we face. The same applies to global population growth [15]. CC has dominated sustainability research, as demonstrated by Figure 1. The paper count includes all papers with the chosen terms in either the title, abstract, or keywords. The database used, Scopus, includes all papers up to 12 October 2022. For CC, the terms chosen were ‘climate change’ OR ‘global warming’, and for biodiversity, just the term ‘biodiversity loss’. For ocean sustainability, several terms were included: ‘ocean acidification’; OR ‘ocean’ AND ‘hypoxia’; OR ‘ocean’ AND ‘plastic pollution’; OR ‘ocean’ AND ‘chemical pollution’. The counts of the three topics were then normalized by papers with the very general term ‘environment’ in either the title, abstract, or keywords. Although CC presently dominates, the future could see a rapid growth in global biodiversity and ocean sustainability papers.
This is not to downplay the importance of immediate action on CC mitigation [16], which is by far the main environmental problem discussed in energy research. Energy and industrial emissions in 2021 accounted for 36.3 Gt CO2-eq, out of a global total of 40.8 Gt CO2-eq [17]. Witze [18] has discussed the recent spate of extreme weather events around the world, including record-breaking heat waves, wild fires, floods, and droughts. She sought the opinions of several climate scientists who are worried that the climate models we presently use do not capture these recent extreme events. Paradoxically, a common solution for coping with heat waves, air conditioning, leads to increased CO2 emissions in an FF dominant energy system. This adaptation conflicts with CC mitigation. Steel et al. [19] have even argued that further anthropogenic CC could lead to ‘civilizational collapse’.
Profound inequality exists both between nations, and even more so at the individual household level. Although average GDP per capita differences between nations has lessened since 1980, the income gap within countries has grown since then [20]. Energy use per capita also varies widely from country to country, and this inequality is particularly stark for per capita electricity consumption, where the variation is as much as three orders of magnitude for both commercial [21] and all global energy [22]. This energy inequality is reflected in the ownership of private vehicles and household appliances. For CO2 emissions, data are now even available at the household level. Kartha et al. [23] estimated that the world’s top 10% of households accounted for 49% of emissions in 2015, compared with only 7% for the bottom 50%.
What is novel in this review paper is that it envisages only a minor role for RE in the short/medium-term for achieving global environmental sustainability, even if a RE-dominated energy system is essential in the long-term. This conclusion in turn is based on several other inter-connected findings. First, CC is only one of several serious challenges to sustainability, requiring a prompt response, as documented above. Second, related to the first point, is the recognition that for some energy-using sectors, carbon emissions are only a minor part of their full environmental costs. Third, that approaches that involve social and political changes will bring us closer to sustainability than either technical energy efficiency improvements, or growth in RE energy share.
The rest of this review is accordingly organized as follows. Section 2 discusses the methods used to select the papers for discussion in this review. Section 3 raises the important questions which must be asked when considering the future of energy generally. How much energy will be used, and of what type? Section 4 poses the question: what will this energy be used for? Not only in which broad energy sector, but its use in a given sector, especially transport and agriculture. It is shown that if the global challenges are to be overcome, this detailed use is critical for success, but is usually ignored in the literature. Section 5 examines the huge difficulties in moving to a globally sustainable future, while addressing the great inequalities that exist today. Section 6 concludes, and offers some pointers to how the global energy future could unfold.

2. Methods

This review article is a synthesis of the recent literature on a variety of subjects, ranging from topics such as energy and climate change, biodiversity loss, ocean environmental deterioration, and pandemics, all with a grounding in science, to more speculative research on the future of Earth and humankind. Preference was given to the following types of papers:
  • The most recent research papers on these topics, particularly those published on or after 2020, which took account of the impact of the COVID-19 pandemic. Of the 99 papers reviewed here, 77 were published on or after 2020.
  • Papers which took a global viewpoint, since the sustainability problems discussed are global in scope.
  • Papers which implicitly adopted an Earth systems science approach to global environmental problems. For example, just looking at CC mitigation, it is important to consider not only other GHGs, but also albedo changes. The approach also includes the interactions between the biophysical and social sciences.
For energy statistics, this review relied mainly on the annual global energy statistics available from BP [21] and the IEA [22]. Forecast global energy use in year 2050 relied on the energy scenarios of various energy organisations that regularly publish forecasts: BP [24], DNV [25], the US Energy Information Agency (EIA) [26], ExxonMobil [27], the International Energy Agency (IEA) [28], the Organization of the Petroleum Exporting Countries (OPEC) [29], Shell [30], and the World Energy Council (WEC) [31].
For the latest climate science, the latest IPCC reports [32,33] were used, along with other papers published after the IPCC reports were released.
Overall, 99 papers were selected for this review. Details for each topic covered are given in Table 1.

3. The Important Questions Regarding Global Energy Futures

When discussing the global future for energy, two important questions arise. First, how much primary energy will the world produce annually in coming decades? Second, what will be the shares of FFs, nuclear energy, and the various types of RE? Additionally, how much net energy will be available from these sources? The following subsections discuss each of these questions in turn.

3.1. How Much Primary Energy Will Be Used?

In 2021, according to BP [21], commercial energy use totalled 595.2 EJ, an increase over the 2019 figure, after a drop in 2020 [21], with an estimated further 24 EJ [22] of traditional fuel, mainly burnt at low thermal efficiency in lower-income countries. This global commercial energy total consisted of 489.7 EJ of fossil fuels, 80.2 EJ of RE, and 25.3 EJ of nuclear power. Since the early 2000s, the various sources of RE have slowly gained share at the expense of FF and nuclear power, with solar and wind power showing the fastest growth rates [21]. Even so, all RE had only a 13.5% share of global commercial primary energy in 2021. For electrical energy only, RE produced 27.9% of total generation output in 2021: 15% hydro, and non-hydro 12.8%, up from 8.4% in 2017, with hydro roughly constant 2017–2021 [21].
The latent energy demand in low-energy countries might suggest that demand will be much higher in future, and most energy scenarios for 2050 envisage most growth coming from nations outside the Organization for Economic Cooperation and Development (OECD), e.g., [21,29]. At present, primary use is broadly related to the country’s GDP, suggesting that if future global GDP could be predicted, then so could global energy use, but the unanticipated economic downturn caused by the COVID-19 pandemic showed the difficulties of even short-term economic forecasting.
What do researchers interested in future energy use envisage for 2050 global energy consumption? For the eight energy-forecasting organisations listed in Section 2, the year 2050 global energy use extracted from their various scenarios covered the range 543–1140 EJ [34]. (Non-commercial fuel use was assumed to be negligible by 2050—nearly all energy used was seen as commercial.) The scenarios on which this range is based include some with optimistic controls on energy-related CO2 emissions, together with others which are closer to ‘business-as-usual’ (b-a-u) conditions. However, Laherrère et al. [35], after a careful analysis of global oil reserves and production, concluded that reserve figures given by both BP and the EIA were too high, and thus argued that the ‘Stated Policies Scenario’ (essentially, a b-a-u scenario) of the IEA [28] was not a feasible option.
As an example of a very different forecasting approach, Modis [36], using the logistic curve, estimated 2050 global primary to lie within the narrow range 639–758 EJ, with a central estimate of 704 EJ, which fits within the 543–1140 EJ range for energy organisation forecasts. Of course, the real figure could well lie outside this range, and the authors of this review argue that a 2050 primary energy value less than 543 EJ—perhaps much less—is needed for global sustainability. If most primary energy is from RE, then the exact figure depends on which energy accounting system is used [37]. None of the energy forecasts discussed above reflect the gravity of our predicament, focussed as they are solely on CC (or even only on CO2 emissions).

3.2. What Types of Energy Will Be Used?

The mix of energies used in decades to come will depend on several factors, including the success of new technologies —the various CDR technologies and SG—that enable FF use to be continued, at least for some time. Both are untried at the scale needed to be important for CC mitigation, and have their own, possibly serious, environmental problems [38,39]. Even if successful, they cannot be a long-term solution, as they do not produce energy. Nor do they address non-CC sustainability problems.
Despite CC concerns, new FF power stations are still being built; in 2021, 176 GW of coal-fired power plant capacity was under construction, with more than half in China [40]. Together with petroleum-fuelled vehicles, the committed CO2 emissions from the energy infrastructure existing even in 2020 will most likely exceed those needed to keep temperature rises below 1.5 °C [41,42]. Conversely, if strong action is taken to limit temperature rises to 1.5 °C, most FF reserves could become ‘stranded assets’, because the CO2 that would be released to the atmosphere upon combustion will preclude its use. (Incidentally, this financial risk is an important reason for FF industry resistance to serious action on CC mitigation [43]).
Globally, nuclear energy is losing share, and is not forecast by energy forecasting organisations already mentioned (or even the International Atomic Energy Authority) to be more than a marginal future energy source The average age of the global reactor fleet is also rising, so much new construction will merely be for replacement [44].The case for the ‘peaceful uses of nuclear energy’ is not helped by reports of the shelling of Ukrainian nuclear installations that occurred in 2022. Additionally, nuclear fuels, such as FFs, will steadily deplete, and the energy return on investment (EROI) of nuclear power will fall. Finally, both nuclear and FF power stations are thermal, and require cooling by air or water, with water cooling being more efficient. In times of drought, much thermal electricity production may need to be curtailed [45].
For RE, the energy forecasting organisations discussed above predict higher shares by 2050 primary energy, with values ranging from 17.0% to 68.9%, compared with 13.5% in 2021. The highest RE share (68.9%) occurs in a BP scenario that has net zero emissions by that year. In all cases, scenarios with greater emissions reduction have lower primary energy levels. Given both the eventual FF depletion of economically recoverable reserves, and the minor contribution expected from nuclear energy, nearly all global energy will thus need to come from renewable sources in the long run.
When discussing the future prospects for any energy source, it is important to know the technical potential for each fuel source. This in turn requires knowledge of the EROI—the ratio of output to input energy [46]. The EROI for any energy project must clearly be greater than one for net energy to be produced, but some researchers have argued that the overall EROI must be much greater for a growth economy to function [47,48]. If this minimum EROI value is known, it would then be possible to construct an EROI versus cumulative energy production for each energy type, and calculate its technical potential [38].
For all RE sources except bioenergy, nearly all energy inputs must be made before any energy is generated. This places limits on the rate at which RE can grow; too rapid an expansion will result in reduced net energy, the only energy available to run the economy [49,50]. This will only be a problem if the EROI is low, particularly if about five or less. Previously, the authors have defined EROIg, or the ‘green’ EROI, defined as the EROI that includes many externalities generated by RE, often not included as input costs in EROI analyses. These ‘eco-system maintenance energy’ (ESME) costs include items such as the energy costs to restore mining areas, or construct safe tailings dams, or the energy costs of converting and storing surplus intermittent RE [38,51]. If these are ignored, greater EROI values for RE will be used than is really the case—or will be in the future when these accumulating environmental damages must be addressed [38]. Even considering only CC, the integrated assessment models (IAMs) used in the energy scenarios assume strongly declining costs for RE, which is unlikely to hold on a global scale [48].
However, ceteris paribus, environmental damages, if not countered, depend on gross primary energy. Hence, falling EROIg for any given energy source means increasing input ESME costs for a given useful energy output, and less net energy. Falling resource quality will also lead to input energy increases, and as ESME for RE is a strong function of input energy (rather than operational as for FF) then net green energy falls?
The EROI for hydropower is usually given as greater than that for all other energy sources: FF, RE, or nuclear [52,53]. Unlike other RE, future dams are assumed to have a very long operational life, which they need to recover their high input energy costs. This assumption may no longer hold true. The droughts in 2022 have highlighted the risks of too great a reliance on hydro, especially if they become more extreme under climate change; in China, hydro output has been curtailed in 2022 [54]. A further problem arises in tropical regions if deforestation is occurring in the catchment area; hydro output will start falling beyond a critical level of deforestation, because evapotranspiration will be reduced, in turn reducing rainfall downwind [55].

4. What Will the Energy Be Used For?

It is important to know not only how much energy will be used in each broad sector, but also the specifics of its use, such as the energy used by each mode of transport. The main uses of energy globally are presently industry, transport, buildings, agriculture and non-fuel uses such as lubrication [22]. All these energy sectors will still need energy in future, but their relative sector shares, and the specific uses within each sector, could change dramatically. The purposes for which this energy is used is also very important for sustainability. This can be readily seen if we think about bulldozers destroying tropical rain forests. Most of the environmental damage would remain even if the diesel-powered bulldozers were replaced by solar-powered ones—the only benefit would be the removal of diesel CO2 emissions. Due to their large impact on sustainability, two energy-consuming sectors are reviewed here: transport and agriculture. Industry is not reviewed directly, but the changes discussed in the two sectors will indirectly have a major impact on industrial production.

4.1. Transport

Globally, transport, both passenger and freight, is only second to industry for energy use, and in 2020 accounted for 37% of final total energy demand [22], and 15% of total global GHG emissions, as noted above. Since 1900, there has been an extraordinary rise in both transport energy and activity, far exceeding the rise in global GDP [56], suggesting that significant energy reductions in transport could be achieved by reducing both. There is another important reason for cutting both transport energy and the transport task. At present, global transport is still heavily reliant on oil, with its share only falling from 94.3% in 1973 to 91.7% in 2018 [22]. Electric vehicle (EV) advocates argue that with a switch to EVs as a replacement for petroleum-fuelled transport, the CC damages from transport can be negated, and vehicular air pollution greatly cut.
However, vehicular transport produces a variety of other serious environmental externalities which will still occur even if all road-based transport was replaced by EVs powered by RE [57,58]. These externalities include: traffic collision fatalities, which now number about 1.3 million deaths annually; light pollution; road penetration into wilderness areas, including formerly pristine forest areas; air pollution from tires and brake linings; the urban heat island (UHI) effect, partly caused by reduced evapotranspiration as sealed roads and car parking areas replace vegetation; and community disruption in heavily trafficked urban areas. Although vehicle exhaust emissions are zero for EVs, the pollution from EV battery disposal and recycling is already serious [59], and far greater for EVs than for conventional vehicles, because of their much greater battery capacity. In summary, reducing vehicular travel will have multiple benefits for the environment, compared with, say, lowering the thermostat for domestic gas heating.
How could transport energy and activity be greatly reduced, particularly in the high-mobility OECD countries? Many energy researchers (see, e.g., [60,61]) have seen large improvements in energy efficiency of transport vehicles (as well as in other sectors such as buildings, and industry) as having a key role in both reducing energy use and mitigating climate change. Although there has been some improvement in the energy efficiency of the various transport modes, it has not translated into transport energy (or CO2) reductions. Various factors, such as the shift to more energy-intensive modes and models (cars replacing public transport, sports utility vehicles replacing ordinary sedans), energy rebound, and greatly increased car ownership in non-OECD countries, have led to final energy use in transport—both passenger and freight—rising from 45.2 EJ in 1973 to 105.1 EJ in 2020 [22,28].
A different approach is to change the priority we presently accord to the three surface passenger transport modes—private car, public transport, and non-motorised travel. At present, public transport modes account for an estimated 30% of all surface vehicular travel [58], although its share in cities is usually higher. Priority could be reversed by reducing the travel convenience of the car, through measures including speed limit reductions, reduced parking availability, and traffic-free zones in the inner areas of cities [57]. At the same time, the convenience of competing modes, especially non-motorised modes, could be improved. The changes could be readily justified by the need to cut traffic casualties and other environmental damages already discussed.
One promising development in motorised transport is the growth in use of e-bikes, especially in China, which dominates global sales [62], and where e-bikes significantly outnumber EVs [63]. E-bikes, which typically operate at much lower speeds than other motorised modes, not only have significantly lower energy use per km than other motorised modes, but also have significantly lower life cycle GHG emissions [62]. There is evidence [64] of mode substitution by e-bike use, although at the cost to public transport (33%) and traditional cycling (27%). Automotive trip substitution was found to be 24%, with Europe and North America reporting the highest values. While promising, failure to provide for the recycling of batteries may limit their environmental benefits [63].
Greatly cutting global car travel would have large effects on other energy sectors. The car industry would see a large contraction, and with it, steel, glass, rubber and plastic production. Road construction and maintenance could also be curtailed in both urban and non-urban areas. With less need for sealed roads and car parks, more vegetation could be planted in cities, allowing more evapotranspiration and reducing the urban heat island (UHI) effect.
Global air travel is expected to rise rapidly, with Airbus [65] forecasting growth from around 9 trillion revenue passenger-km (RPK) in 2019 to nearly 20 trillion RPK by 2040, at an average annual growth rate of 3.6%. As with car ownership, there is an enormous unmet demand for air travel, particularly in non-OECD countries. Even zero-carbon fuels would not eliminate its negative effects, because of noise around airports, and the CC effects from aircraft contrails [57]. Given its high potential to be a source of environmental damages, some researchers think that air travel, like car travel, will need to be drastically curtailed for sustainability.

4.2. Agriculture

In their 2022 paper Ehrlich and Ehrlich [12] provocatively titled one section: ‘Agriculture: Humanity’s greatest mistake?’ The footprint of the global agricultural system is indeed vast. Ellis et al. [66] reported that: ‘[…] ecosystems across most of the terrestrial biosphere, from 75 to 95% of its area, have now been reshaped to some degree by human societies’. Of these human-modified areas, the authors reported that 51% were in ‘intensive anthromes’, 30% in ‘cultured’, and just 19% were ‘wildlands’. They also argued that such a transformation is not recent; humans have been extensively transforming biomes for the past 12 millennia. Given its vast reach, global agriculture has a crucial impact on ecological sustainability.
Agriculture provides not only most of the food we eat, but also materials such as wool, cotton and jute. Nor is all food grown consumed by humans: large quantities of grain, especially corn, sugar cane and edible oil seeds are used to make transport fuels. Such biofuel production is anticipated to increase out to 2031, due to a rise in sugar cane -based ethanol [67]. Some researchers (e.g., Lark et al. [68]) doubt that these food-based biofuels used to replace petroleum-based transport fuels do actually produce any CO2 savings when a full accounting of all environmental effects is made. Much grain is also fed to livestock animals, along with other foodstuffs; again, use for this purpose is expected to continue its rise [67].
Just as it was argued above that shifting to more energy-efficient transport modes could be an important means of reducing emissions, so many researchers are now arguing for a shift to more energy-efficient means of satisfying our nutritional needs, with the key change a wholesale move away from animal products to more a vegetarian-style diet, see, e.g., [69,70,71,72,73]. As the authors [74] have earlier written, summarising Godfray et al. [72]: ‘Meat production (like agricultural production in general), produces not only CO2 emissions, but also emissions of the other major GHGs, methane (CH4) and nitrous oxide (N2O). Production of meat, especially from ruminant livestock, incurs more GHG emissions per kilojoule of food energy than plant-based food, such as grains, because of energy conversion losses at each trophic level’. Schiermeier [72] reported that if the world consumed no animal-based food at all, 8 GtCO2-eq of emissions, or nearly 20% of 2021 global emissions of 40.8 GtCO2-eq [28], could be avoided annually. With some meat and dairy use, the savings would be lower, but still significant. Theul et al. [70] also argued that such dietary changes are more important from a CC mitigation viewpoint than intensification of agricultural production.
As was shown for transport, merely replacing the energy used in agriculture, such as diesel fuel, by RE sources will only make a minor difference to the vast ecological damage caused by global agriculture [8]. These include soil erosion, desertification, water pollution and eutrophication of rivers and coastal waters, groundwater depletion, and loss of soil carbon.
Cutting down on food waste can be another important means of reducing the environmental harm caused by agriculture, since it reduces the amount of food that needs to be produced. As a recent report from the United Nations Environment Programme (UNEP) [75] stressed: ‘Food waste also burdens waste management systems, exacerbates food insecurity, making it a major contributor to the three planetary crises of climate change, nature and biodiversity loss, and pollution and waste.’ Dou and Toth [76] found that ‘roughly 1/3 of food produced for human consumption, amounting to 1.3 billion tonnes annually, is lost or wasted […]’.
In lower income countries, this loss is relatively higher at the harvesting level, but in wealthier countries, the waste is relatively higher at the consumer level. In Europe and North America, although most waste occurs at the production to retail level, around 100 kg of food per capita is annually discarded, especially in households. Much food waste finishes up in landfills, where it produces GHGs in the form of CO2 and CH4 emissions as it decomposes. Globally, the carbon footprint of food waste approaches the carbon footprint of the US. Zaraska [77] has offered many suggestions for how food waste could be cut, including smaller serving sizes, learning to cook with leftovers, and most importantly, stop buying food items that we do not need.
In summary, the most useful approach to cutting the environmental damages from agriculture is to cut production. This can be achieved even while providing an adequate diet for all. First, eliminate the use of food for transport biofuels. Second, move to a more vegetarian diet; this shift will also reduce the use of feedstuffs for animals. Third, eliminate food waste at all points in the production chain. Substituting RE for fossil fuels used for agricultural equipment, and even fertiliser production, will only remove a small part of the environmental damages from agriculture. As with transport, where travel reductions were advocated, the solution mainly lies in not producing the food in the first place. Further, in both cases, social changes will be much more effective than technical changes such as improved energy efficiency.

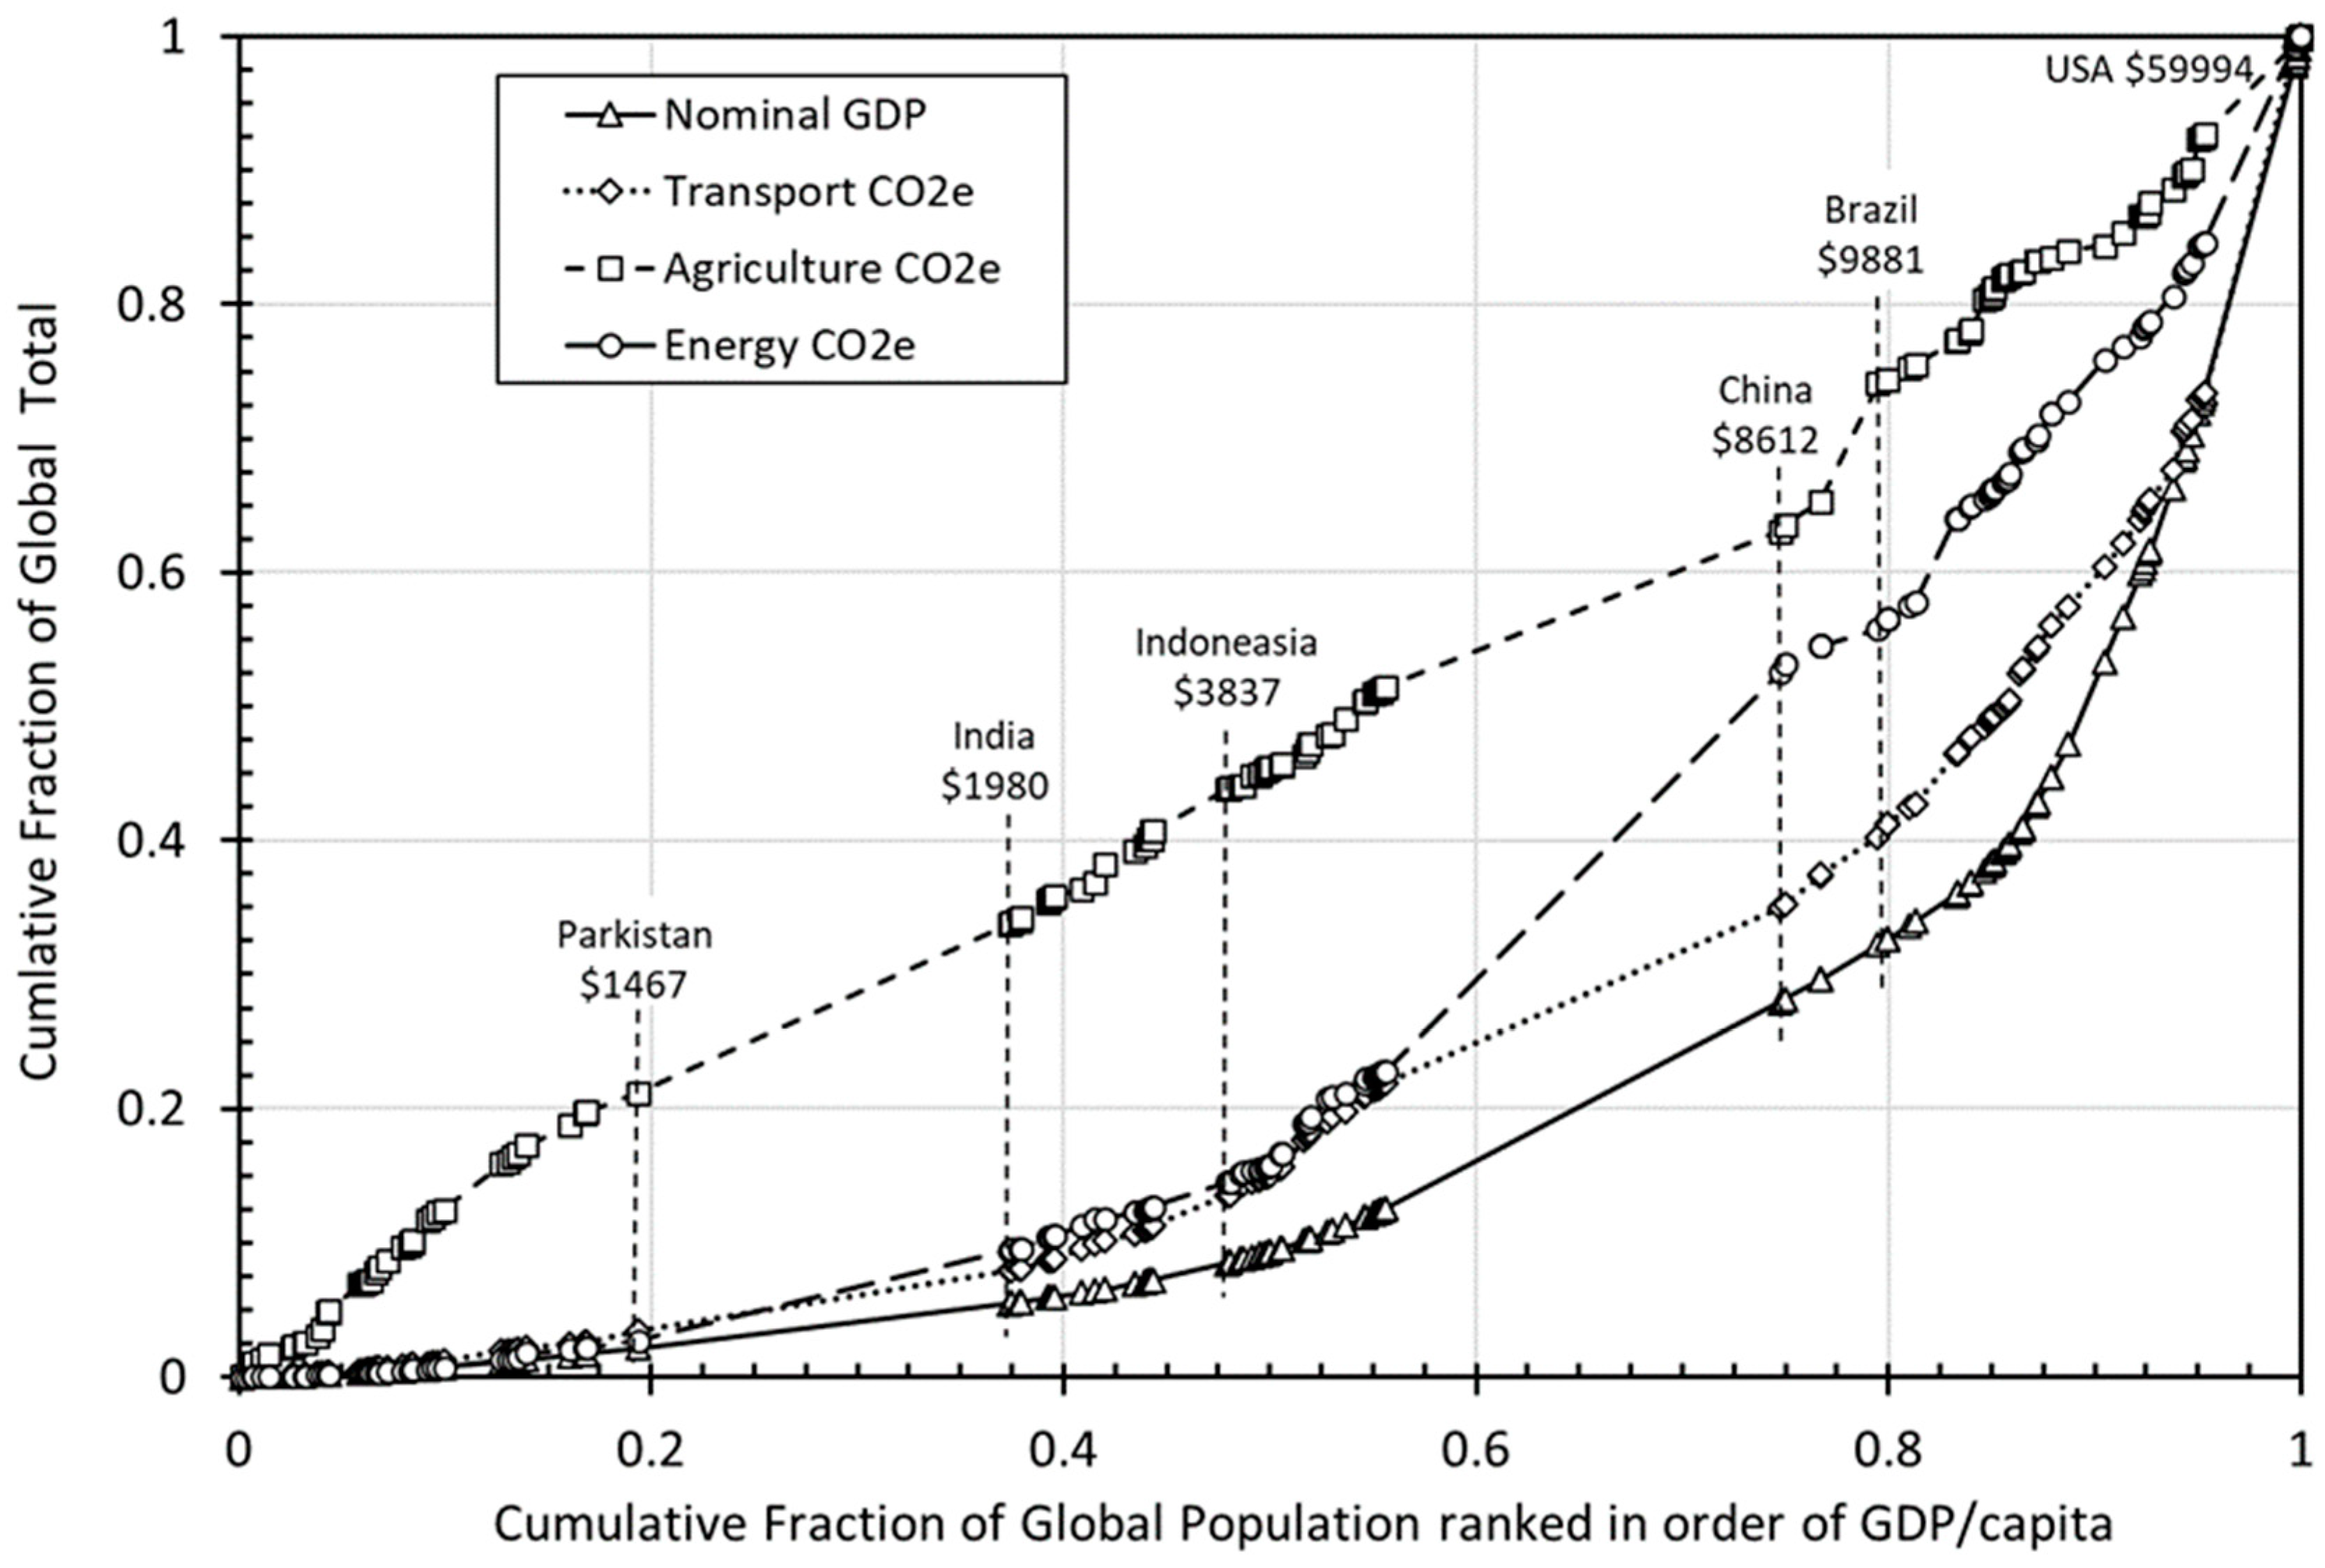
5. Discussion: The Difficult Transition to an Equitable and Sustainable Future

Table 2 shows the values of various energy-relevant parameters for three dates: 1950, which is seen as the start of the ‘great acceleration’ [12,78]; 1990, the year the first IPCC report was released, urging the world’s nations to cut GHG emissions; and 2020, the most recent year for which values of all parameters are available. The 1990 IPCC report, and subsequent increasingly urgent reports, have had little effect on FF use, GHG emissions, or global atmospheric CO2 ppm. We are steadily moving even further away from ecological sustainability, not toward it. Elhacham et al. [79] have pointed out that the mass of all living biomass (including ourselves) was exceeded in 2020 by human-made mass, or ‘anthropogenic mass’, which they define as ‘the mass embedded in inanimate solid objects made by humans (that have not been demolished or taken out of service, which we define as ‘anthropogenic mass waste).’ The table gives only the global values for the various parameters listed; it does not show how they are distributed between countries on a per capita basis. As discussed earlier for energy, this distribution is most uneven for most energy and consumption parameters.
Table 2 shows that there has been an order of magnitude rise since 1950 for a number of the parameters listed. The rapid rise of plastics explains why it is now a major factor in pollution, both oceanic and terrestrial. The 20-fold growth in the global car fleet (and accompanying growth in, for example, vehicle fatalities and road building) explain why its environmental damages are far greater than its CO2 emissions. Overall, the table shows the lack of progress toward planetary sustainability since 1990.
A vital first step for equity is to ensure than the basic human needs of all the world’s people are met. The UN’s Sustainable Development Goals (SDGs) are a first step in this direction, but as Hickel [80] has pointed out, the goals are sometimes mutually contradictory, and assume continued global economic growth. Meeting this double objective will likely prove extraordinarily difficult, given that we already use the equivalent of 1.75 Earths [81], even though much of the world—the low-consumption poorer countries—will need some increase in their material standards of living.
Due to the dominance of fossil fuels, the income inequality noted in Section 1 extends to sector GHG emissions. When ranked from lowest to highest GDP/capita, energy (77.4% of total 2019 CO2-eq [82]) and transport (15.3% of total 2019 CO2-eq) show similar trends to GDP, as shown in Figure 2. The poorest 50% of the global population generates 9% of global nominal GDP and is responsible for 15% of transport and 16% of energy global GHG emissions. Greater equality in GHG emissions from agriculture (12.4% total 2019 CO2-eq [82]) is however evident with the poorest 50% of the global population being responsible for 45% of total sector GHG emissions, but only responsible for 21% of total 2019 global GHG emissions (excluding Land Use Change and Forestry).
Hence, reductions in environmental impact will largely have to come from the high energy and material consumption countries, mainly the OECD nations. Additionally, as Hickel [83], among others, have argued, this will most likely entail large GDP reductions. He has documented how the global GDP and Material Footprint (MF), equal to global raw material extraction [84] have been strongly correlated, at least since 1990. Further, global GDP has strongly correlated with global vehicular passenger travel over the past century [58]. At present, military and political power depend on both total GDP and GDP per capita. Existing low-energy use countries are really the only countries presently making a large contribution to climate change mitigation; if their per capita GHG emissions matched those of OECD nations, atmospheric CO2 ppm would be far higher than it is today. Although low-emission tropical countries are likely to suffer most under further climate change [38], as discussed above, extreme weather events are increasingly now experienced by middle- and high-income countries.
As recognized 50 years ago by the authors of ‘Limits to Growth’ [85], an end of GDP growth is probably inevitable if we are serious about an equitable and ecologically sustainable planet. The concept of ‘degrowth’—the planned reduction in national economic output—is increasingly popular; the database Scopus shows 181 papers published in 2021 with the term degrowth in the title, abstract or keywords, up from 11 in 2010.
Table 2. Global values for various parameters, 1950, 1990, and 2020.
ParameterUnits195019902020
Atmospheric CO2 ppm310354416
Energy-related CO2Gt/year6.021.332.1 1
Fossil fuel use EJ/year72.5278.5463.7 1
Global car fleet Million514521186
Ecol. footprint (EF)No. of Earths0.73 21.291.75
Anthropogenic mass Gt1034921154
GDP 109 2017 USD10.051.2126.3 1
Population Million156353277795
Cement production Mt/year14011004370
Plastics productionMt/year2.0120367
1 2019 values are larger, because of COVID-19 economic downturn; 2 1961 EF value, the earliest available. Sources: [32,78,86,87,88,89,90,91,92].
Rich country GDP reductions do not necessarily mean a loss of quality of life. When an alternative measure which more closely human welfare is used, the Genuine Progress Indicator (GPI) (which takes account of inequality), it is found that while GDP per capita has risen in OECD countries, the GPI, and especially ‘life satisfaction’ has in many cases fallen. Kubiszewski and colleagues [93] found that globally ‘While global Gross Domestic Product (GDP) has increased more than three-fold since 1950, economic welfare, as estimated by the Genuine Progress Indicator (GPI), has actually decreased since 1978’. This is perhaps not so surprising when we learn from Zenithmedia [94] the money that advertisers found it necessary to spend: ‘Global adspend is forecast to increase by USD 58.0 billion in 2022, rising to USD 781 billion from USD 723 billion in 2021’. The outlay is increasingly used to get consumers to buy things they do not really need.
Figure 2. Distribution of nominal GDP (USD 2017), and 2019 CO2-eq emissions from transport, agriculture and energy. Note: Distribution presented as cumulative fractions of the global total (190 countries) for each sector, all ranked in order of increasing nominal GDP/capita. GDP/capita for the six most populated countries shown. The data are drawn from [82,92].
Applsci 13 00388 g002
Although OECD countries presently produce most of the global solar, wind and geothermal energy, any serious and rapid reductions in GHGs will inevitably require deep cuts in FF use in the OECD and other high-energy use countries. Such deep cuts will produce surplus FF capacity in electricity generation, dampening incentives for new RE construction. In presently low-energy countries, any energy capacity expansion will need to be RE, and given the many ecological damages from tropical hydro construction, should mainly be from wind, solar and geothermal.

6. Conclusions

The longer-term energy future belongs to RE because in a few decades FF reserves and/or its EROI levels [95] will be too low to enable economies based largely on FF to function if business-as-usual policies continue. CDR and SG—if they ever do make a significant contribution to reducing climate forcing—are energy consumers, not producers. Nuclear energy is not seen, even by promoters, as having more than a marginal role in the future [44]. Nevertheless, in the short/medium term, RE will struggle to improve rapidly its share of energy production, for two reasons. First, as shown in Section 3, if EROIg is low, or the level of EROIg needed for economies to function is too high, the rate of growth of RE installations must be restricted to ensure sufficient net energy is available to power the economy. Second, as discussed in Section 4, our analysis suggests the urgent need for deep cuts in FF in OECD countries. This would produce surplus capacity in the power sector, discouraging rapid growth in RE power capacity.
This review has shown the importance of considering all sustainability challenges Earth faces, not just CC, when evaluating how energy should be used in the future. This review showed, using the transport and agricultural sectors as examples, that non-CC challenges were often more serious. Emphasis also needs to shift from improving technical measures such as energy efficiency of transport (as measured by pass km or tonne km per primary MJ) or agricultural output (as measured by tonnes per primary GJ), to approaches requiring deep social and political changes. The UNEP Emissions Gap Report [96] similarly summarized its message as ‘a call for the rapid transformation of societies’, noting the ‘inadequate action’ taken so far to resolve the climate crisis. Continuing to prioritise economic growth has so far not helped us achieve ecological sustainability and is unlikely to help in the future.
The limitations of this study lie in unavoidable future uncertainty in total primary energy production, and RE’s contribution, as well as global environmental and political/economic conditions in one or two decades of time. Moreover, RE is only one possible CC mitigation approach. As already mentioned, others include nuclear energy, SG, and various CDR techniques. It is at least possible that any one of these could be subject to a technological breakthrough. As a possible example of a RE breakthrough, Clery [97] has recently reported on renewed enthusiasm for satellite solar power. Although first proposed many decades ago, supporters can point to the dramatic advances in both PV cells and space technology, although it is doubtful whether it could be deployed in the short/medium term to rapidly boost RE output. On the other hand, if a key breakthrough occurs in one of the other approaches, RE output growth in the short/medium term will be even slower. Despite further research, these uncertainties will remain.
Rising et al. [98] have pointed to a further problem which will likely impact global energy use: the economic costs of CC may have been seriously underestimated, because of missing risks excluded because of their uncertainty, and gave as examples ‘the potential for climate change impacts to drive social discontent, dislocation and relocation, and instability and conflict, are all deeply uncertain, but potentially crippling’. Given the irreducible uncertainties we face, the likely best approach is to adopt the ‘precautionary principle’ [99].

Author Contributions

Conceptualization, P.M. and D.H.; data curation D.H.; methodology, P.M. and D.H.; writing—original draft preparation, P.M.; writing—review and editing, D.H. All authors have read and agreed to the published version of the manuscript.

Funding

This research received no external funding.

Data Availability Statement

All data used are from publicly available documents.

Conflicts of Interest

The authors declare no conflict of interest.

Nomenclature

b-a-ubusiness-as-usual
CC climate change
CCS carbon capture and storage
CDR carbon dioxide removal
CO2 carbon dioxide
CO2-eq carbon dioxide equivalent
EIA Energy Information Administration
EJ exajoule (1018 joule)
EROI energy return on investment
EW enhanced weathering
FAO Food and Agriculture Organisation
FF fossil fuels
GHG greenhouse gas
GPI Genuine Progress Indicator
GJ gigajoule (109 joule)
Gt gigatonne = 109 tonne
GW gigawatt (109 watt)
H2 hydrogen
IAMs integrated assessment models
IEA International Energy Agency
IMF International Monetary Fund
IPCC Intergovernmental Panel on Climate Change
IRENA International Renewable Energy Agency
MJ megajoule (106 joule)
Mt megatonne (106 tonne)
Mtoe million tonne of oil equivalent
MWe megawatt electric (106 watt)
NETs negative emissions technologies
NPS New Policies Scenario
OECD Organization for Economic Cooperation and Development
OPEC Organization of the Petroleum Exporting Countries
ppm parts per million (atmospheric)
PV photovoltaic
RE renewable energy
RPK revenue passenger-km
SDG Sustainable Development Goal
TWh terawatt-hour (1012 watt-hr)
UHI urban heat island
USD US dollars
WEC World Energy Council

References

  1. Gizzi, M. Closed-loop systems for geothermal energy exploitation from hydrocarbon wells: An Italian case study. Appl. Sci. 2021, 11, 10551. [Google Scholar] [CrossRef]
  2. Georgian, S.; Hameed, S.; Morgan, L.; Amon, D.J.; Sumaila, R.; Johns, D.; Ripple, W.J. Scientists’ warning of an imperiled ocean. Biol. Conserv. 2022, 272, 10959. [Google Scholar] [CrossRef]
  3. Dryden, H.; Duncan, D. How the Oceans Will Impact on Climate Change over the Next 25 Years? 2021. Available online: https://papers.ssrn.com/sol3/papers.cfm?abstract_id=3848390 (accessed on 13 May 2022).
  4. Gregg, W.W.; Rousseaux, C.S. Global ocean primary production trends in the modern ocean color satellite record (1998–2015). Environ. Res. Lett. 2019, 14, 124011. [Google Scholar] [CrossRef] [Green Version]
  5. Boyce, D.G.; Lewis, M.R.; Worm, B. Global phytoplankton decline over the past century. Nature 2010, 466, 7306. [Google Scholar] [CrossRef] [PubMed]
  6. Gross, M. Pollution passes boundaries. Current Biol. 2022, 32, R141–R157. [Google Scholar] [CrossRef]
  7. Naeem, S.; Lu, Y.; Jackson, J. Curtailing the collapse of the living world. Sci. Adv. 2022, 8, eadf9317. [Google Scholar] [CrossRef]
  8. Dirzo, R.; Ceballos, G.; Ehrlich, P.R. Circling the drain: The extinction crisis and the future of humanity. Phil. Trans. R. Soc. B 2022, 377, 20210378. [Google Scholar] [CrossRef]
  9. Bradshaw, C.J.A.; Ehrlich, P.R.; Beattie, A.; Ceballos, G.; Crist, E.; Diamond, J.; Dirzo, R.; Ehrlich, A.H.; Harte, J.; Harte, M.E.; et al. Underestimating the challenges of avoiding a ghastly future. Front. Conserv. Sci. 2021, 1, 615419. [Google Scholar] [CrossRef]
  10. Schramski, J.R.; Gattie, D.K.; Brown, J.H. Human domination of the biosphere: Rapid discharge of the earth-space battery foretells the future of humankind. Proc. Natl. Acad. Sci. USA 2015, 112, 9511–9517. [Google Scholar] [CrossRef] [Green Version]
  11. Gowdy, J. Our hunter-gatherer future: Climate change, agriculture and uncivilization. Futures 2020, 115, 102488. [Google Scholar] [CrossRef]
  12. Ehrlich, P.R.; Ehrlich, A.H. Returning to “normal”? Evolutionary roots of the human prospect. Bioscience 2022, 72, 778–788. [Google Scholar] [CrossRef] [PubMed]
  13. Dellasala, D.A.; Kormos, C.F.; Keith, H.; Mackey, B.; Young, V.; Rogers, B.; Mittermeier, R.A. Primary forests are undervalued in the climate emergency. Bioscience 2020, 70, 445. [Google Scholar] [CrossRef]
  14. McCallum, H.I. Lose biodiversity, gain disease. Proc. Natl. Acad. Sci. USA 2015, 112, 8523–8524. [Google Scholar] [CrossRef] [PubMed] [Green Version]
  15. Crist, E.; Ripple, W.J.; Ehrlich, P.R.; Rees, W.E.; Wolf, C. Scientists’ warning on population. Sci. Total Environ. 2022, 845, 157166. [Google Scholar] [CrossRef]
  16. Ripple, W.J.; Wolf, C.; Newsome, T.M.; Gregg, J.W.; Lenton, T.M.; Palomo, I.; Eikelboom, J.A.J.; Law, B.E.; Huq, S.; Duffy, P.B.; et al. World scientists’ warning of a climate emergency. Bioscience 2021, 71, 894–898. [Google Scholar] [CrossRef]
  17. International Energy Agency (IEA). Global Energy Review: CO2 Emissions in 2021; IEA: Paris, France, 2022; Available online: https://www.iea.org/reports/global-energy-review-co2-emissions-in-2021-2 (accessed on 26 July 2022).
  18. Witze, A. Extreme heatwaves: Surprising lessons from the record warmth. Nature 2022, 608, 464–465. [Google Scholar] [CrossRef] [PubMed]
  19. Steel, D.; DesRoches, C.T.; Mintz-Woo, K. Climate change and the threat to civilization. Proc. Natl. Acad. Sci. USA 2022, 119, e2210525119. [Google Scholar] [CrossRef]
  20. Chancel, L.; Piketty, T. The persistence of global inequality: Persistence and mutation of extreme inequality. J. Eur. Econ. Assoc. 2021, 19, 3025–3062. [Google Scholar] [CrossRef]
  21. BP. BP Statistical Review of World Energy 2022; BP: London, UK, 2022; Available online: https://www.bp.com/content/dam/bp/business-sites/en/global/corporate/pdfs/energy-economics/statistical-review/bp-stats-review-2022-full-report.pdf (accessed on 26 July 2022).
  22. International Energy Agency (IEA). Key World Energy Statistics 2021; IEA/OECD: Paris, France, 2021. [Google Scholar]
  23. Kartha, S.; Kemp-Benedict, E.; Ghosh, E.; Nazareth, A.; Gore, T. The Carbon Inequality Era. Joint Research Report; Stockholm Environment Institute: Stockholm, Sweden, 2020. [Google Scholar] [CrossRef]
  24. BP. Energy Outlook, 2022 Edition; BP: London, UK, 2022; Available online: https://www.bp.com/content/dam/bp/business-sites/en/global/corporate/pdfs/energy-economics/energy-outlook/bp-energy-outlook-2022.pdf (accessed on 27 July 2022).
  25. DNV. Energy Transition Outlook 2021: Executive Summary; DNV: Bærum, Norway, 2021. [Google Scholar]
  26. Energy Information Agency (EIA). International Energy Outlook 2021 (IEO2021) 2021. Available online: https://www.eia.gov/outlooks/ieo/ (accessed on 14 May 2022).
  27. ExxonMobil. Outlook for Energy: Data Pages. 2021. Available online: https://corporate.exxonmobil.com/Energy-andinnovation/Outlook-for-Energy (accessed on 14 May 2022).
  28. International Energy Agency (IEA). World Energy Outlook 2021; IEA/OECD: Paris, France, 2021; Available online: https://www.iea.org/topics/world-energy-outlook (accessed on 27 July 2022).
  29. Organization of the Petroleum Exporting Countries (OPEC). 2021 OPEC World Oil Outlook; OPEC: Vienna, Austria, 2021; Available online: http://www.opec.org (accessed on 27 July 2022).
  30. Shell. The Energy Transformation Scenarios. 2020. Available online: https://www.shell.com/promos/energy-andinnovation/download-full-report/_jcr_content.stream/1627553067906/fba2959d9759c5ae806a03acfb187f1c33409a91/energytransformation-scenarios.pdf (accessed on 14 May 2022).
  31. World Energy Council (WEC). World Energy Scenarios 2019; WEC: London, UK, 2019; Available online: https://www.worldenergy.org/publications/entry/world-energy-scenarios-2019-exploring-innovation-pathways-to-2040 (accessed on 27 July 2022).
  32. Intergovernmental Panel on Climate Change (IPCC). Climate Change 2021: The Physical Science Basis; AR6, WG1; CUP: Cambridge, UK, 2021. [Google Scholar]
  33. Intergovernmental Panel on Climate Change (IPCC). Climate Change 2022: Mitigation of Climate Change. 2022. Available online: https://www.ipcc.ch/report/ar6/wg3/ (accessed on 12 July 2022).
  34. Moriarty, P. Can bioenergy once again become a major global energy source? Encyclopedia 2022, 2, 1357–1369. [Google Scholar] [CrossRef]
  35. Laherrère, J.; Hall, C.A.S.; Bentley, R. How much oil remains for the world to produce? Curr. Res. Environ. Sustain. 2022, 4, 100174. [Google Scholar] [CrossRef]
  36. Modis, T. Forecasting energy needs with logistics. Technol. Forecast. Soc. Chang. 2019, 139, 135–143. [Google Scholar] [CrossRef]
  37. Moriarty, P.; Honnery, D. Energy accounting for a renewable energy future. Energies 2019, 12, 4280. [Google Scholar] [CrossRef] [Green Version]
  38. Moriarty, P.; Honnery, D. Switching Off: Meeting Our Energy Needs in a Constrained Future; Springer Briefs on Energy; Springer: Berlin, Germany, 2022; 90p, ISSN 2191-5520. [Google Scholar]
  39. Moriarty, P.; Honnery, D. Renewable energy and energy reductions or solar geoengineering for climate change mitigation? Energies 2022, 15, 7315. [Google Scholar] [CrossRef]
  40. Vaughan, A. China is building more than half of the world’s new coal power plants. New Scientist. 26 April 2022. Available online: https://www.newscientist.com/article/2317274-china-is-building-more-than-half-of-the-worlds-new-coal-power-plants/ (accessed on 29 April 2022).
  41. Tong, D.; Zhang, Q.; Zheng, Y.; Caldeira, K.; Shearer, C.; Hong, C.; Qin, Y.; Davis, S.J. Committed emissions from existing energy infrastructure jeopardise 1.5 °C climate target. Nature 2019, 572, 373–377. [Google Scholar] [CrossRef]
  42. Trout, K.; Muttitt, G.; Lafleur, D.; Van de Graaf, T.; Mendelevitch, R.; Mei, L.; Meinshausen, M. Existing fossil fuel extraction would warm the world beyond 1.5 °C. Environ. Res. Lett. 2022, 17, 064010. [Google Scholar] [CrossRef]
  43. Semieniuk, G.; Holden, P.B.; Mercure, J.-F.; Salas, P.; Pollitt, H.; Jobson, K.; Vercoulen, P.; Chewpreecha, U.; Edwards, N.R.; Viñuales, J.E. Stranded fossil-fuel assets translate to major losses for investors in advanced economies. Nat. Clim. Chang. 2022, 12, 532–538. [Google Scholar] [CrossRef]
  44. Moriarty, P. Global nuclear energy: An uncertain future. AIMS Energy 2021, 9, 1027–1042. [Google Scholar] [CrossRef]
  45. Penmetsa, V.; Holbert, K.E. Climate change effects on thermal power generation and projected losses in generation and income in the U.S. for the period 2020–2050. In Proceedings of the 2020 52nd North American Power Symposium (NAPS), Tempe, AZ, USA, 11–13 April 2021. [Google Scholar] [CrossRef]
  46. Moriarty, P.; Honnery, D. Can renewable energy power the future? Energy Pol. 2016, 93, 3–7. [Google Scholar] [CrossRef]
  47. Fizaine, F.; Court, V. Energy expenditure, economic growth, and the minimum EROI of society. Energy Pol. 2016, 95, 172–186. [Google Scholar] [CrossRef]
  48. Moriarty, P.; Honnery, D. Feasibility of a 100% global renewable energy system. Energies 2020, 13, 5543. [Google Scholar] [CrossRef]
  49. Capellán-Pérez, I.; de Castro, C.; González, L.J.M. Dynamic Energy Return on Energy Investment (EROI) and material requirements in scenarios of global transition to renewable energies. Energy Strategy Rev. 2019, 26, 100399. [Google Scholar] [CrossRef]
  50. Sgouridis, S.; Csala, D.; Bardi, U. The sower’s way: Quantifying the narrowing net-energy pathways to a global energy transition. Environ. Res. Lett. 2016, 11, 094009. [Google Scholar] [CrossRef] [Green Version]
  51. Daaboul, J.; Moriarty, P.; Palmer, G.; Honnery, D. Making energy green—A method for quantifying the ecosystem maintenance energy and the green energy return on energy invested. J. Clean. Prod. 2022, 344, 131037. Available online: https://scholar.google.com/scholar?oi=bibs&cluster=1363198228730052216&btnI=1&hl=en (accessed on 10 September 2022). [CrossRef]
  52. Hall, C.A.S.; Lambert, J.G.; Balogh, S.B. EROI of different fuels and the implications for society. Energy Pol. 2014, 64, 141–152. [Google Scholar] [CrossRef] [Green Version]
  53. Murphy, D.J.; Raugei, M.; Carbajales-Dale, M.; Rubio Estrada, B. Energy return on investment of major energy carriers: Review and harmonization. Sustainability 2022, 14, 7098. [Google Scholar] [CrossRef]
  54. Le Page, M. Heatwave in China is the most severe ever recorded in the world. New Scientist. 23 August 2022. Magazine issue 3401. Available online: https://www.newscientist.com/article/2334921-heatwave-in-china-is-the-most-severe-ever-recorded-in-the-world/ (accessed on 17 October 2022).
  55. Leite-Filho, A.T.; Soares-Filho, B.S.; Davis, J.L.; Abrahão, G.M.; Börner, J. Deforestation reduces rainfall and agricultural revenues in the Brazilian Amazon. Nat. Commun. 2021, 12, 2591. [Google Scholar] [CrossRef]
  56. Moriarty, P.; Honnery, D. Prospects for hydrogen as a transport fuel. Int. J. Hydrogen Energy 2019, 44, 16029–16037. [Google Scholar] [CrossRef]
  57. Moriarty, P. Making urban travel sustainable: Travel reductions are needed. Clean. Prod. Lett. 2022. [Google Scholar] [CrossRef]
  58. Moriarty, P. Global passenger transport. Encyclopedia 2021, 1, 189–197. [Google Scholar] [CrossRef]
  59. Morse, I. A dead battery dilemma. Science 2021, 372, 780–783. [Google Scholar] [CrossRef]
  60. Lovins, A.B. How big is the energy efficiency resource? Environ. Res. Lett. 2018, 13, 090401. [Google Scholar] [CrossRef] [Green Version]
  61. Saunders, H.D.; Roy, J.; Azevedo, I.M.L.; Chakravarty, D.; Dasgupta, S.; de la Rue du Can, S.; Druckman, A.; Fouquet, R.; Grubb, M.; Lin, B.; et al. Energy efficiency: What has research delivered in the last 40 years? Ann. Rev. Environ. Resour. 2021, 46, 135–165. [Google Scholar] [CrossRef]
  62. Stilo, L.; Segura-Velandia, D.; Lugo, H.; Conway, P.P.; West, A. Electric bicycles, next generation low carbon transport systems: A survey. Trans. Res. Interdiscip. Perspect. 2021, 10, 100347. [Google Scholar] [CrossRef]
  63. Guo, X.; Zhang, J.; Tian, Q. Modeling the potential impact of future lithium recycling on lithium demand in China: A dynamic SFA approach. Renew. Sustain. Energy Rev. 2021, 137, 110461. [Google Scholar] [CrossRef]
  64. Bigazzi, A.; Wong, K. Electric bicycle mode substitution for driving, public transit, conventional cycling, and walking. Trans. Res. Part D Transport Environ. 2020, 85, 102412. [Google Scholar] [CrossRef]
  65. Airbus. Global Market Forecast. 2022. Available online: https://www.airbus.com/en/products-services/commercial-aircraft/market/global-market-forecast (accessed on 28 August 2022).
  66. Ellis, E.C.; Gauthier, N.; Goldewijkd, K.G.; Bird, R.B.; Boiving, N.; Díaz, S.; Fuller, D.Q.; Gill, J.L.; Kaplan, J.O.; Naomi Kingston, N.; et al. People have shaped most of terrestrial nature for at least 12,000 years. Proc. Natl. Acad. Sci. USA 2021, 118, e2023483118. [Google Scholar] [CrossRef]
  67. OECD/FAO. OECD-FAO Agricultural Outlook 2022–2031; OECD Publishing: Paris, France, 2022. [Google Scholar] [CrossRef]
  68. Lark, T.J.; Hendricks, N.P.; Smith, A.; Gibbs, H.K. Environmental outcomes of the US Renewable Fuel Standard. Proc. Natl. Acad. Sci. USA 2022, 119, e2101084119. [Google Scholar] [CrossRef]
  69. Bodirsky, B.L.; Chen, D.M.-C.; Weindl, I.; Soerge, B.; Beier, F.; Molina Bacca, E.J.; Gaupp, F.; Popp, A.; Lotze-Campen, H. Integrating degrowth and efficiency perspectives enables an emission-neutral food system by 2100. Nat. Food 2022, 3, 341–348. [Google Scholar] [CrossRef]
  70. Theurl, M.C.; Lauk, C.; Kalt, G.; Mayer, A.; Kaltenegger, K.; Morais, T.G.; Teixeira, R.F.M.; Domingos, T.; Winiwarter, W.; Erb, K.H.; et al. Food systems in a zero-deforestation world: Dietary change is more important than intensification for climate targets in 2050. Sci. Total Environ. 2020, 735, 139353. [Google Scholar] [CrossRef]
  71. Sun, Z.; Scherer, L.; Tukker, A.; Spawn-Lee, S.A.; Bruckner, M.; Gibbs, H.K.; Behrens, P. Dietary change in high-income nations alone can lead to substantial double climate dividend. Nat. Food 2022, 3, 29–37. [Google Scholar] [CrossRef]
  72. Godfray, H.C.J.; Aveyard, P.; Garnett, T.; Hall, J.W.; Key, T.J.; Lorimer, J.; Pierrehumbert, R.T.; Scarborough, P.; Springmann, M.; Jebb, S.A. Meat consumption, health, and the environment. Science 2018, 361, 243. [Google Scholar] [CrossRef] [Green Version]
  73. Schiermeier, Q. Eat less meat: UN climate change panel tackles diets. Nature 2019, 572, 291–292. [Google Scholar] [CrossRef] [PubMed] [Green Version]
  74. Moriarty, P.; Honnery, D. New approaches for ecological and social sustainability in a post-pandemic world. World 2020, 1, 191–204. [Google Scholar] [CrossRef]
  75. United Nations Environment Programme (UNEP). UNEP Food Waste Index Report 2021; UNEP: Nairobi, Kenya, 2021; ISBN 978-92-807-3868-1. [Google Scholar]
  76. Dou, Z.; Toth, J.D. Global primary data on consumer food waste: Rate and characteristics—A review. Resour. Conserv. Recycl. 2021, 168, 105332. [Google Scholar] [CrossRef]
  77. Zaraska, M. Fighting food waste. New Scientist, 25 September 2021; pp. 42–45. [Google Scholar] [CrossRef]
  78. Steffen, W.; Broadgate, W.; Deutsch, L.; Gaffney, O.; Ludwig, C. The trajectory of the Anthropocene: The Great Acceleration. Anthrop. Rev. 2015, 1–18. [Google Scholar] [CrossRef]
  79. Elhacham, E.; Ben-Uri, L.; Grozovski, J.; Bar-On, Y.M.; Milo, R. Global human-made mass exceeds all living biomass. Nature 2020, 588, 442–444. [Google Scholar] [CrossRef]
  80. Hickel, J. The contradiction of the sustainable development goals: Growth versus ecology on a finite planet. Sustain. Dev. 2019, 27, 873–884. [Google Scholar] [CrossRef]
  81. Lin, D.; Wambersie, L.; Wackernagel, M. Estimating the Date of Earth Overshoot Day 2022. Available online: https://www.overshootday.org/content/uploads/2022/06/Earth-Overshoot-Day-2022-Nowcast-Report.pdf (accessed on 14 November 2022).
  82. Climate Watch. CO2-E Emissions by Sector and Country. 2022. Available online: https://www.climatewatchdata.org/ (accessed on 12 December 2022).
  83. Hickel, J.; Hallegatte, S. Can we live within environmental limits and still reduce poverty? Degrowth or decoupling? Dev. Pol. Rev. 2021. [Google Scholar] [CrossRef]
  84. Wiedmann, T.; Lenzen, M.; Lorenz, T.; Keyßer, L.T.; Steinberger, J.K. Scientists’ warning on affluence. Nat. Comm. 2020, 11, 3107. [Google Scholar] [CrossRef]
  85. Meadows, D.H.; Meadows, D.L.; Randers, J.; Behrens, W.W. The Limits to Growth: A Report for the Club of Rome’s Project on the Predicament of Mankind; Universe Books: New York, NY, USA, 1972. [Google Scholar]
  86. Garrett, T.J.; Grasselli, M.; Keen, S. Past world economic production constrains current energy demands: Persistent scaling with implications for economic growth and climate change mitigation. PLoS ONE 2020, 15, e0237672. [Google Scholar] [CrossRef] [PubMed]
  87. United Nations (UN). World Population Prospects 2019. UN. 2019. Available online: https://population.un.org/wpp/ (accessed on 24 November 2022).
  88. Statista. Global Cement Production in 1990, 2000 and 2010, With Forecasts for 2020 and 2030. 2022. Available online: https://www.statista.com/statistics/373845/global-cement-production-forecast/ (accessed on 8 September 2022).
  89. Global Monitoring Laboratory. Trends in Atmospheric Carbon Dioxide. Available online: https://www.esrl.noaa.gov/gmd/ccgg/trends/ (accessed on 10 November 2022).
  90. World Economic Forum. Plastic Pollution is a Public Health Crisis. How Do We Reduce Plastic Waste? 2022. Available online: https://www.weforum.org/agenda/2022/07/plastic-pollution-ocean-circular-economy/ (accessed on 3 November 2022).
  91. Ruiz, A. 25 Plastic Waste Statistics That Will Shock You. TheRoundup.org 2022. Available online: https://theroundup.org/plastic-waste-statistics/ (accessed on 3 November 2022).
  92. Worldometer. GDP Data by Country. 2022. Available online: https://www.worldometers.info/gdp/gdp-by-country/ (accessed on 10 December 2022).
  93. Kubiszewski, I.; Costanza, R.; Franco, C.; Lawn, P.; Talberth, J.; Jackson, T.; Aylmer, C. Beyond GDP: Measuring and achieving global genuine progress. Ecol. Econ. 2013, 93, 57–68. [Google Scholar] [CrossRef] [Green Version]
  94. Zenithmedia. Global Ad Market on Track for 8% Growth in 2022. 8 June 2022. Available online: https://www.zenithmedia.com/global-ad-market-on-track-for-8-growth-in-2022/ (accessed on 17 July 2022).
  95. Murphy, D.J.; Hall, C.A.S. Year in review—EROI or energy return on (energy) invested. Ann. N. Y. Acad. Sci. 2010, 1185, 102–118. [Google Scholar] [CrossRef] [PubMed]
  96. United Nations Environment Program (UNEP). Emissions Gap Report 2022: The Closing Window; UNEP: Nairobi, Kenya, 2022; Available online: https://www.unep.org/emissions-gap-report-2022 (accessed on 5 November 2022).
  97. Clery, D. Has a new dawn arrived for space-based solar power? Science 2022, 378, 6617. [Google Scholar] [CrossRef] [PubMed]
  98. Rising, J.; Tedesco, M.; Piontek, F.; Stainforth, D.A. The missing risks of climate change. Nature 2022, 610, 643–651. [Google Scholar] [CrossRef]
  99. Hayden, F.G.; Mahin, T.A. Integrating the concepts of zero greenhouse-gas emissions, the precautionary principle, and environmental impact statements for climate change policy mitigation. J. Econ. Issues 2022, 56, 400–407. [Google Scholar] [CrossRef]
Figure 1. Scopus counts from 1970 to 2022 for articles on climate change (CC), biodiversity loss (Bio) and ocean sustainability (Ocean), normalized by all environment articles. Note left-hand scale for CC papers.
Applsci 13 00388 g001
Table 1. Breakdown of the 99 papers covered in this review.
TopicNumber of Papers
Climate change mitigation27
Global environmental problems25
Statistical data11
Energy forecasts9
Agriculture 8
Transport7
Global equality6
Miscellaneous6
Total99
Disclaimer/Publisher’s Note: The statements, opinions and data contained in all publications are solely those of the individual author(s) and contributor(s) and not of MDPI and/or the editor(s). MDPI and/or the editor(s) disclaim responsibility for any injury to people or property resulting from any ideas, methods, instructions or products referred to in the content.

