Article

The Effect of the Yield Strength Coefficient and Natural Vibration Period on the Damage Potential Ranking of Ground Motions

1
State Key Laboratory of Precision Blasting, Jianghan University, Wuhan 430056, China
2
Hubei Key Laboratory of Blasting Engineering, Jianghan University, Wuhan 430056, China
3
Key Laboratory of Earthquake Engineering and Engineering Vibration, Institute of Engineering Mechanics, China Earthquake Administration, Harbin 150080, China
*
Author to whom correspondence should be addressed.
Appl. Sci. 2023, 13(1), 392; https://doi.org/10.3390/app13010392
Submission received: 29 November 2022 / Revised: 21 December 2022 / Accepted: 23 December 2022 / Published: 28 December 2022

Abstract

:
To analyze the effect of structural parameters on the damage potential ranking of ground motions, the effect of the yield strength coefficient (Cy) and natural vibration period (T) on the damage potential ranking of ground motions is analyzed based on the bilinear model and the modified Clough model, which are the most commonly used hysteretic models in structural dynamic analysis. The displacement response (Sd) spectrum under nonlinear conditions is taken as the damage potential intensity measure (IM) of ground motions, and the effect of the Cy and T on the Sd mean spectrum is also analyzed for comparative analysis. The results show that: (1) in the short-period range, Cy has a great effect on the displacement response ranking. On the other hand, in the medium- and long-period ranges, Cy has little effect on the Sd ranking; (2) with the change of T in medium- and long-period ranges, the variation of Sd values is obvious when the change of T is small, but the variation of Sd ranking is very small. This conclusion can provide a theoretical basis for evaluating the damage potential of ground motions and selecting input ground motions.

1. Introduction

The structural damage and the resulting casualties and property losses under the action of strong earthquakes are very painful. Therefore, the accurate evaluation of the damage of ground motions to structures (that is, the damage potential of ground motions) is very important to select the input ground motions for seismic design. In recent years, a number of studies [1,2,3,4,5,6,7] on the evaluation of the damage of ground motions to structures have been published. Researchers first believe that ground motion load is the root cause of damage to engineering structures. It was found that there are many intensity measures (IMs) that can represent the damage potential of ground motion, and the IMs in the early studies are mainly obtained from the ground motion record itself. Krame et al. [8] discussed and analyzed the commonly used damage potential parameters such as peak acceleration (PGA), peak velocity (PGV), peak displacement (PGD), Arias strength (AI), and so on. Hu et al. [9] found that the PGV of ground motion can characterize well the destructive strength of ground motion to medium- and long-period reinforced concrete frame structures. Cabanas et al. [10] studied the efficiency of cumulative velocity (CAV), AI, and structural response and obtained a small dispersion between them. However, the study found that a damage potential IM containing seismic and structural characteristic information may better describe the structural damage caused by ground motions [11,12]. Some experts study the IMs obtained from the elastic or inelastic response of the structure as the damage potential Ims of ground motions, such as acceleration response (Sa) spectrum, velocity response (Sv) spectrum, displacement response (Sd) spectrum, displacement ductility (u) and hysteretic energy (EH), and so on [13,14,15].
When the damage potential Ims of ground motions include both seismic and structural information, the changes in seismic or structural parameters will change the damage potential parameter values. Some researchers have studied the effect of seismic factors on the constant-strength response spectrum and the constant-ductility response spectrum [16,17]. Miranda [18] explained the effect of seismic information factors such as magnitude and epicenter distance on the constant-ductility response spectrum in detail. Some experts have also studied the variation law of the response spectrum subjected to different types of ground motions, such as ground motions with different duration [19], main shock-aftershock sequence ground motions, pulse-like ground motions [13,14,15], and extracting high-frequency and low-frequency ground motions, respectively [20], etc. Considering structural parameters, Xie and Zhai [11] use u and Ep as damage potential IMs when selecting the most unfavorable design ground motions. At the same time, the effect of structural parameters such as damping ratio and post-yield stiffness on the hysteretic energy spectrum are analyzed. It is important to note that the hysteretic energy is the one associated with the work performed by rate-independent hysteretic forces [21]. It is concluded that the variation of the hysteretic energy spectrum has little variation under different damping ratios and post-yield stiffness. Palanci and Senel [22] studied the effect of lateral strength ratio, stiffness degradation, and pinching effect on the relative displacement response spectrum. It is concluded that strength degradation has little effect on the nonlinear response spectrum, stiffness degradation has a certain influence on the nonlinear response spectrum, and the pinching effect cannot be ignored in the study of the nonlinear response spectrum. Other experts have also carried out related studies [15,23,24].
When the IMs obtained from the nonlinear response of the structure are used as the damage potential IMs of ground motions, many experts analyze the effect of different structural factors on the damage potential parameter of ground motion and get the variation law of the damage potential with each structural parameter. The attenuation relation is also obtained [13,14,19]. These studies mainly discuss the effect of different factors on the damage potential parameters. However, few people have studied the relative variation of the damage potential of different ground motions when these factors change [25,26]. This paper makes related research on this issue. The displacement response (Sd) spectrum of the nonlinear response of systems with a single degree of freedom (SDOF) is used as the damage potential IM of ground motions in this paper, and ranking the ground motions based on the values of damage potential parameters and 367 ground motion records. The effect of structural yield strength coefficient (Cy) and natural vibration period (T) on damage potential value and damage potential ranking are studied based on bilinear and modified Clough rate-independent hysteretic models.

2. Selection of Ground Motion Records

To explain the effect of different Cy and T on the damage potential ranking of ground motion, a total of 367 ground motions are obtained from the NGA-west2 database. The selected ground motions are classified based on the USGS site classification method and the classification result is shown in Table 1. The magnitude-epicenter distance distribution results of the selected ground motion records are shown in Figure 1. It can be concluded from the results that the magnitude ranges from 3.9 to 7.8. The magnitude of most ground motion records is above five, indicating that the selected ground motion records almost come from strong earthquakes. The epicenter distance is mainly larger than 30 km. It shows that most of the selected ground motion records belong to far-field ground motions.

3. Selected Damage Potential IM and Statistical Parameters

3.1. Damage Potential IM

At present, the commonly used seismic design code [27,28,29] stipulates that the collapse of reinforced concrete frame structures under earthquakes is mainly controlled by the maximum inter-story displacement ratio. Therefore, this paper is mainly based on the constant-strength displacement spectrum (Sd) as the damage potential parameters to be analyzed. It is calculated as shown in Equation (1) [30]
S d = ω | 0 t X ¨ ( τ ) e λ ω ( t τ ) [ ( 1 λ 2 1 λ 2 ) s i n ω ( t τ ) + 2 λ 1 λ 2 c o s ω ( t τ ) ] d τ | m a x
where X ¨ ( τ ) is the acceleration time history of ground motion, w′ is the frequency, and λ is the damping ratio.
To eliminate the difference in results that may be caused by different hysteretic models, both the bilinear model and modified Clough model are selected for analysis, and the skeleton line of the two hysteretic models is shown in Figure 2. fy is the yield strength, K0 is the initial stiffness, k2 is the post-yield stiffness ratio, uy is the yield displacement, and umax is the maximum displacement.

3.2. Statistical Parameters

(1)
Spearman correlation coefficient
To calculate the correlation of the damage potential ranking under different Cy and T conditions, the Spearman correlation coefficient (ρ) is selected as the criterion of correlation analysis. The Spearman correlation coefficient is suitable for measuring the correlation of the ranking of two variables. The calculation method is shown in Equation (2) [31]
ρ = 1 6 i = 1 n ( U i V i ) 2 n n 2 1
where U and V are the damage potential rankings under different T and Cy conditions, respectively. The ρ is not directly calculated by the damage potential value, but by its ranking result.
(2)
Standard deviation and coefficient of variation [31]
The standard deviation or coefficient of variation is generally used as the criterion to analyze the discreteness of the two variables such as in Equation (3). However, the size of the standard deviation is related to the average value of the sample, so this paper chooses the coefficient of variation as the discriminant coefficient, as shown in Equation (4):
δ = i = 1 n ( U i V i ) 2 n
C . V = δ X ¯
where Xi is the average of the rankings, and n is the number of samples.

4. Effects of Cy and T on Sd Spectrum

Cy is the ratio of the yield strength to the strength of the complete elastic response. It can reflect the elastic-plastic deformation degree of the structure. The effect of Cy and T on the Sd is mainly analyzed from the mean displacement response spectrum and dispersion. When the structure has a nonlinear response, the structure will yield. The Cy values range from 0 to 1. The smaller the Cy is, the greater the nonlinear degree of the structure is, and the more flexible the structure is. To explain the effect of Cy on structural nonlinear response in detail, nine values of Cy = 0.1, 0.2, 0.3, 0.4, 0.5, 0.6, 0.7, 0.8, and 0.9 are selected for detailed analysis.

4.1. Analysis of the Sd mean spectrum

The Sd mean spectrum under different Cy conditions is calculated based on two different hysteretic models. The damping ratio is 0.05. The post-yielding stiffness is 0. The calculated results are shown in Figure 3. The following conclusions can be drawn from the results.
(1)
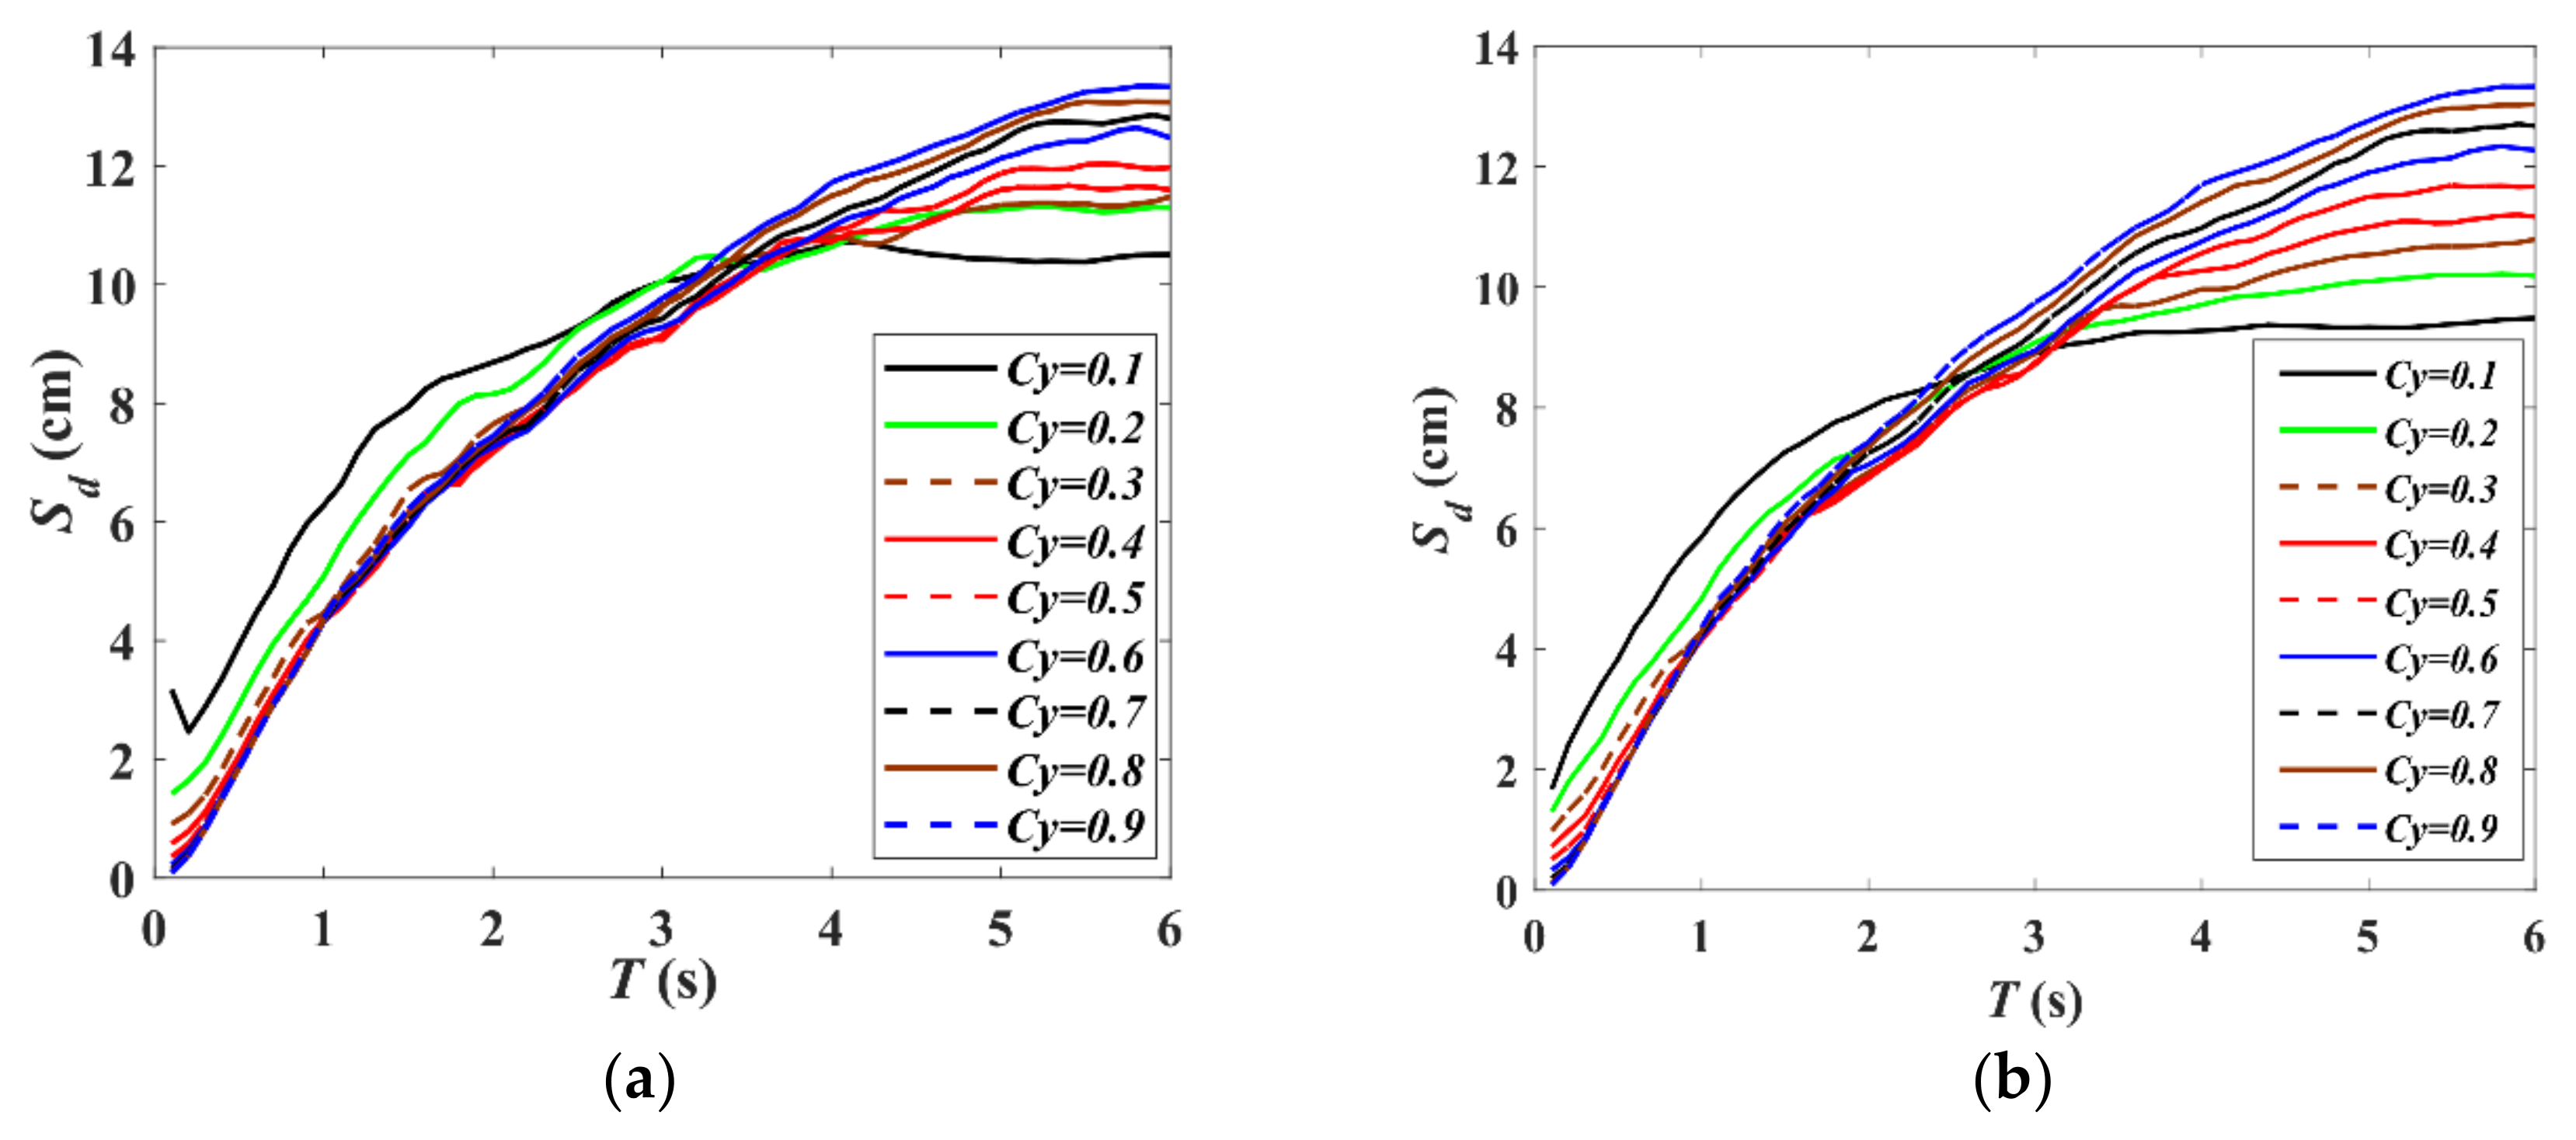
The variation law of the Sd mean spectrum under different Cy conditions is the same with the same T based on the two hysteretic models. The larger the T is, the larger the displacement response mean spectrum is.
(2)
Although the variation law of the Sd mean spectrum increases with the increase in T, the change speed of the Sd mean spectrum is obviously different under different Cy conditions. The smaller the Cy is, the greater the nonlinear degree of the structure is, and the larger the Sd mean spectrum is in the short- and medium-period ranges, but the smaller the Sd mean spectrum is in the long-period range.
(3)
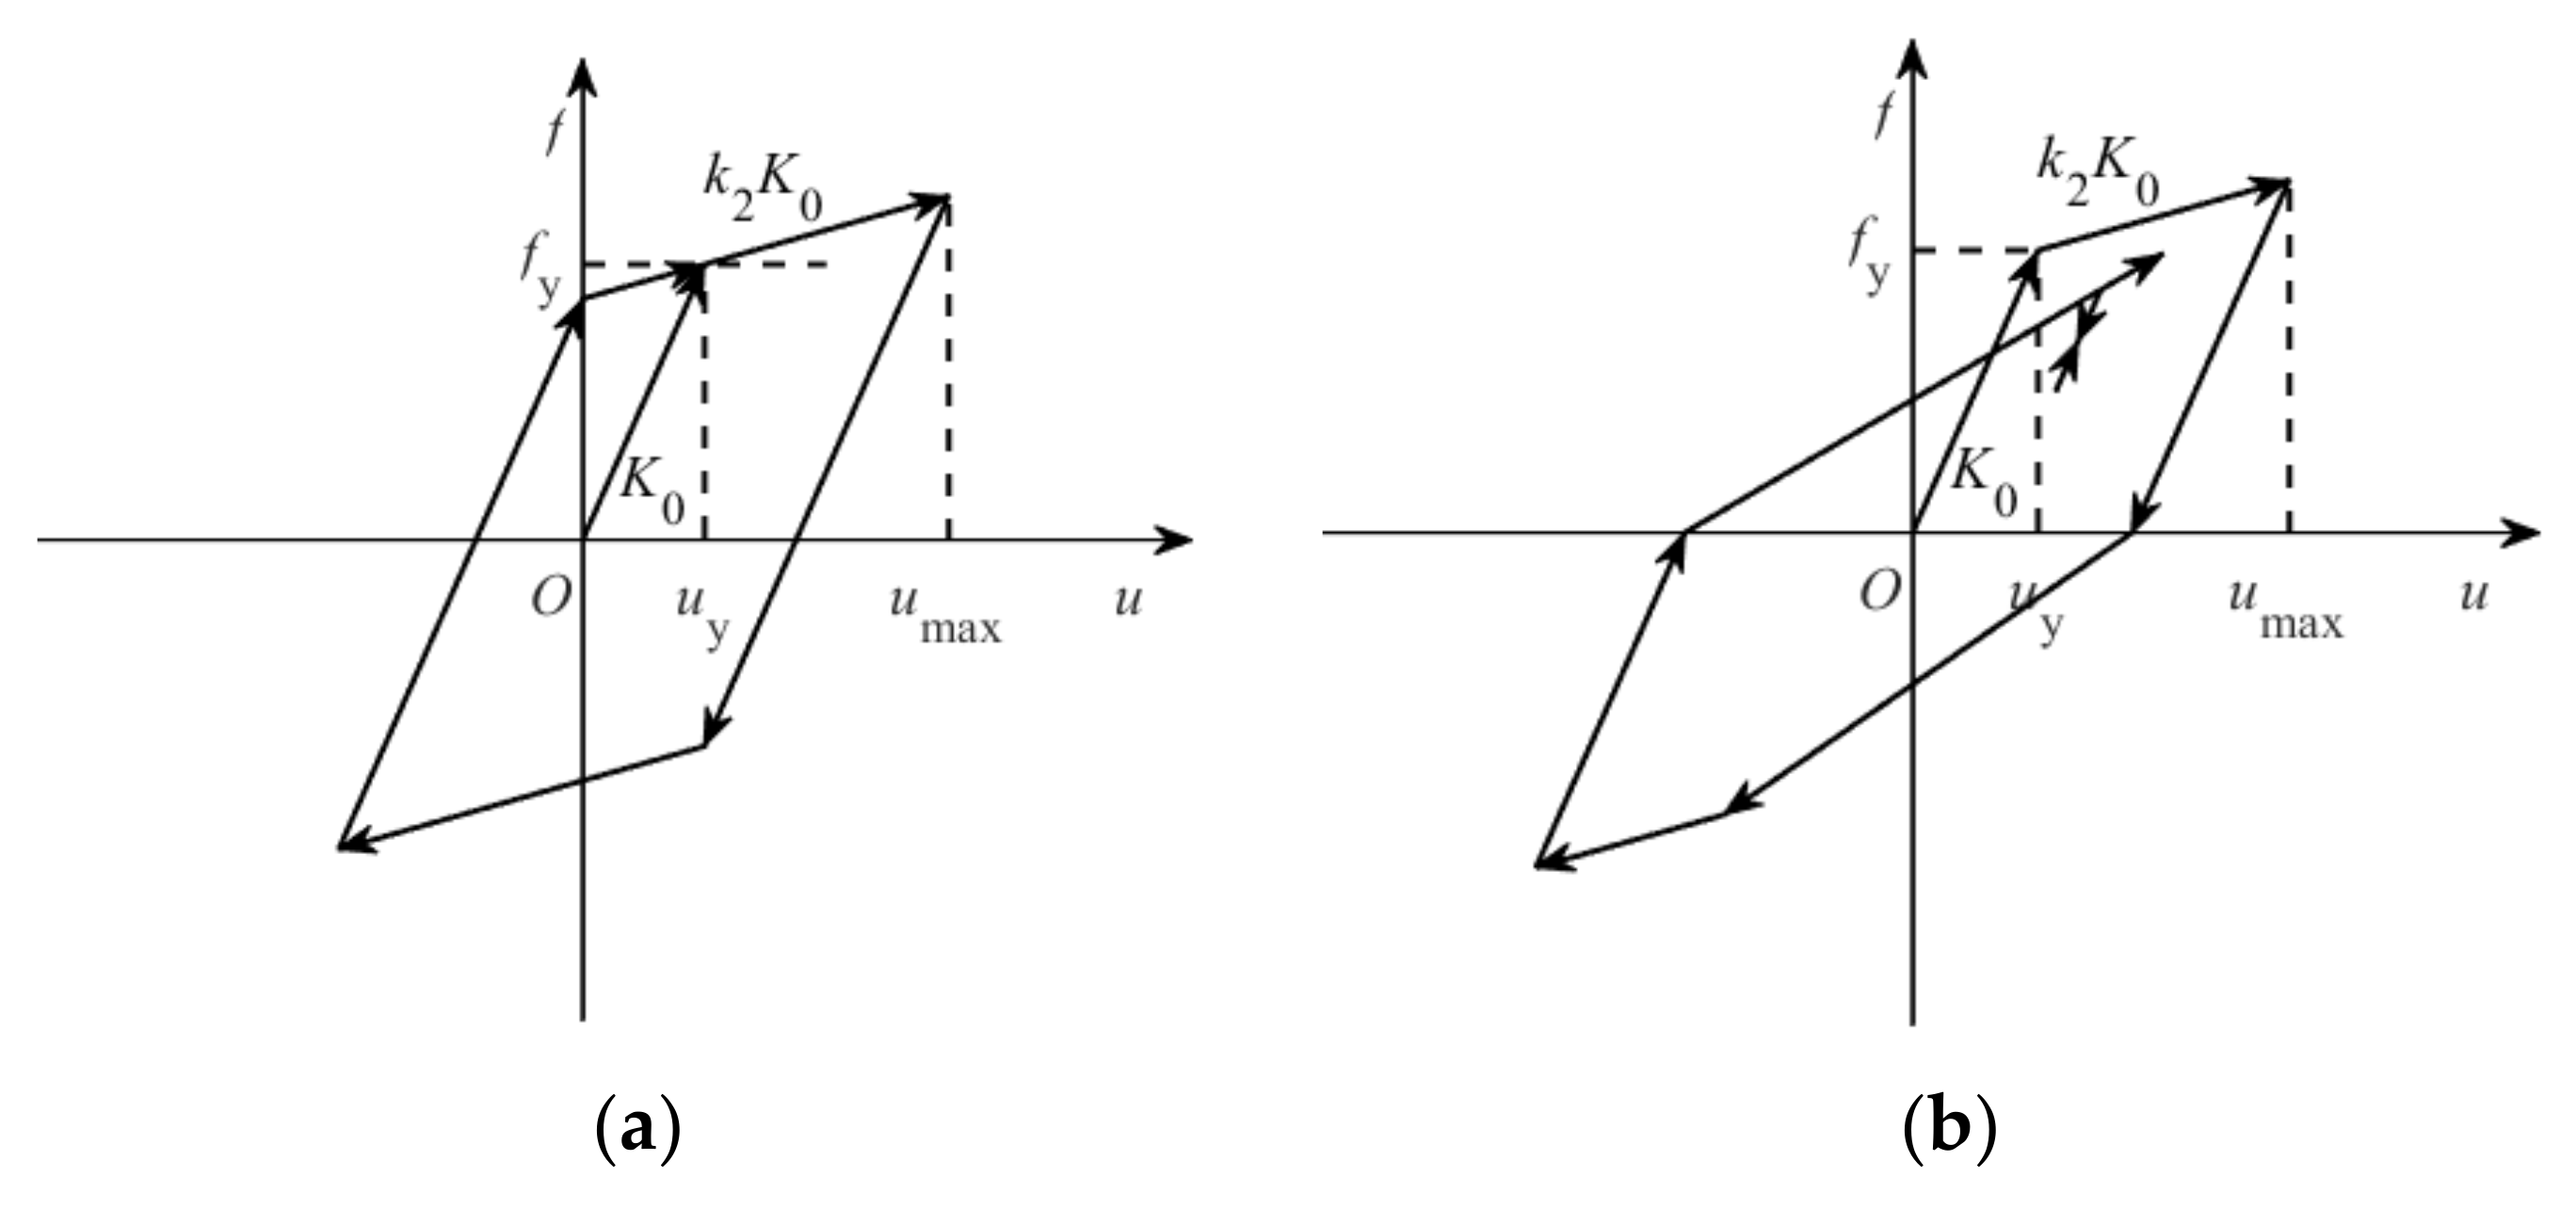
When Cy is equal to 0.1, the change law of the Sd mean spectrum is quite different from that under other Cy conditions. The main reason is that when Cy is equal to 0.1, the yield strength of the structure is only 10% of that of full elasticity, and the character of the SDOF system is too flexible. In addition, it should be analyzed separately.

4.2. Discreteness Analysis of Sd Spectrum

The discreteness of the Sd mean spectrum is analyzed under different Cy conditions, and the calculated results are shown in Figure 4. It can be found from the results that the coefficient of variation at different periods ranges from 0.9 to 2. It shows that when we calculate the Sd mean spectrum based on the unscaled ground motions, the discreteness of the structural displacement response is very large. Therefore, it is not sufficient to study the variation law of the Sd mean spectrum, and it should also be studied by the variation law of the Sd ranking next step.

5. Correlation Analysis of Cy and T on the Sd Ranking

It is concluded that the discreteness of Sd calculated by different ground motions is very large based on the bilinear model and modified Clough model. Therefore, this section mainly analyzes the correlation of the Sd rankings calculated at different Cy and different periods. The Cy is taken as the nonlinear response parameter to characterize the degree of nonlinear response. The T is closely related to the dynamic response of the structure.
Hu et al. [25] first proposed the concept of damage potential ranking. The damage potential ranking of ground motions refers to ground motions that are ranked according to the intensity measures (IMs) that can characterize the structural damage subjected to ground motions. When the damage potential IM of ground motions is determinate (Sd is selected in this paper), and the damage potential values (Sd1, Sd2, Sd3, …, Sdn) of different ground motion records (a1, a2, a3, …, an) are calculated, the damage potential ranking of ground motions can be obtained by ranking these damage potential values. The damage potential value will change when the structural parameters are changed. It is important to analyze how the damage potential ranking change with structural parameters. To ensure the correctness and simplify the calculation of the conclusion, four different values of Cy = 0.2, 0.4, 0.6, and 0.8 are selected for analysis in this section.

5.1. Analysis of Sd Ranking under Different T and Same Cy Condition

When the Cy is constant, the correlation analysis of the Sd ranking under different T conditions is analyzed, and the calculated results are shown in Figure 5. The ordinate is the correlation coefficient, and the following conclusions can be obtained from the results in the diagram:
(1)
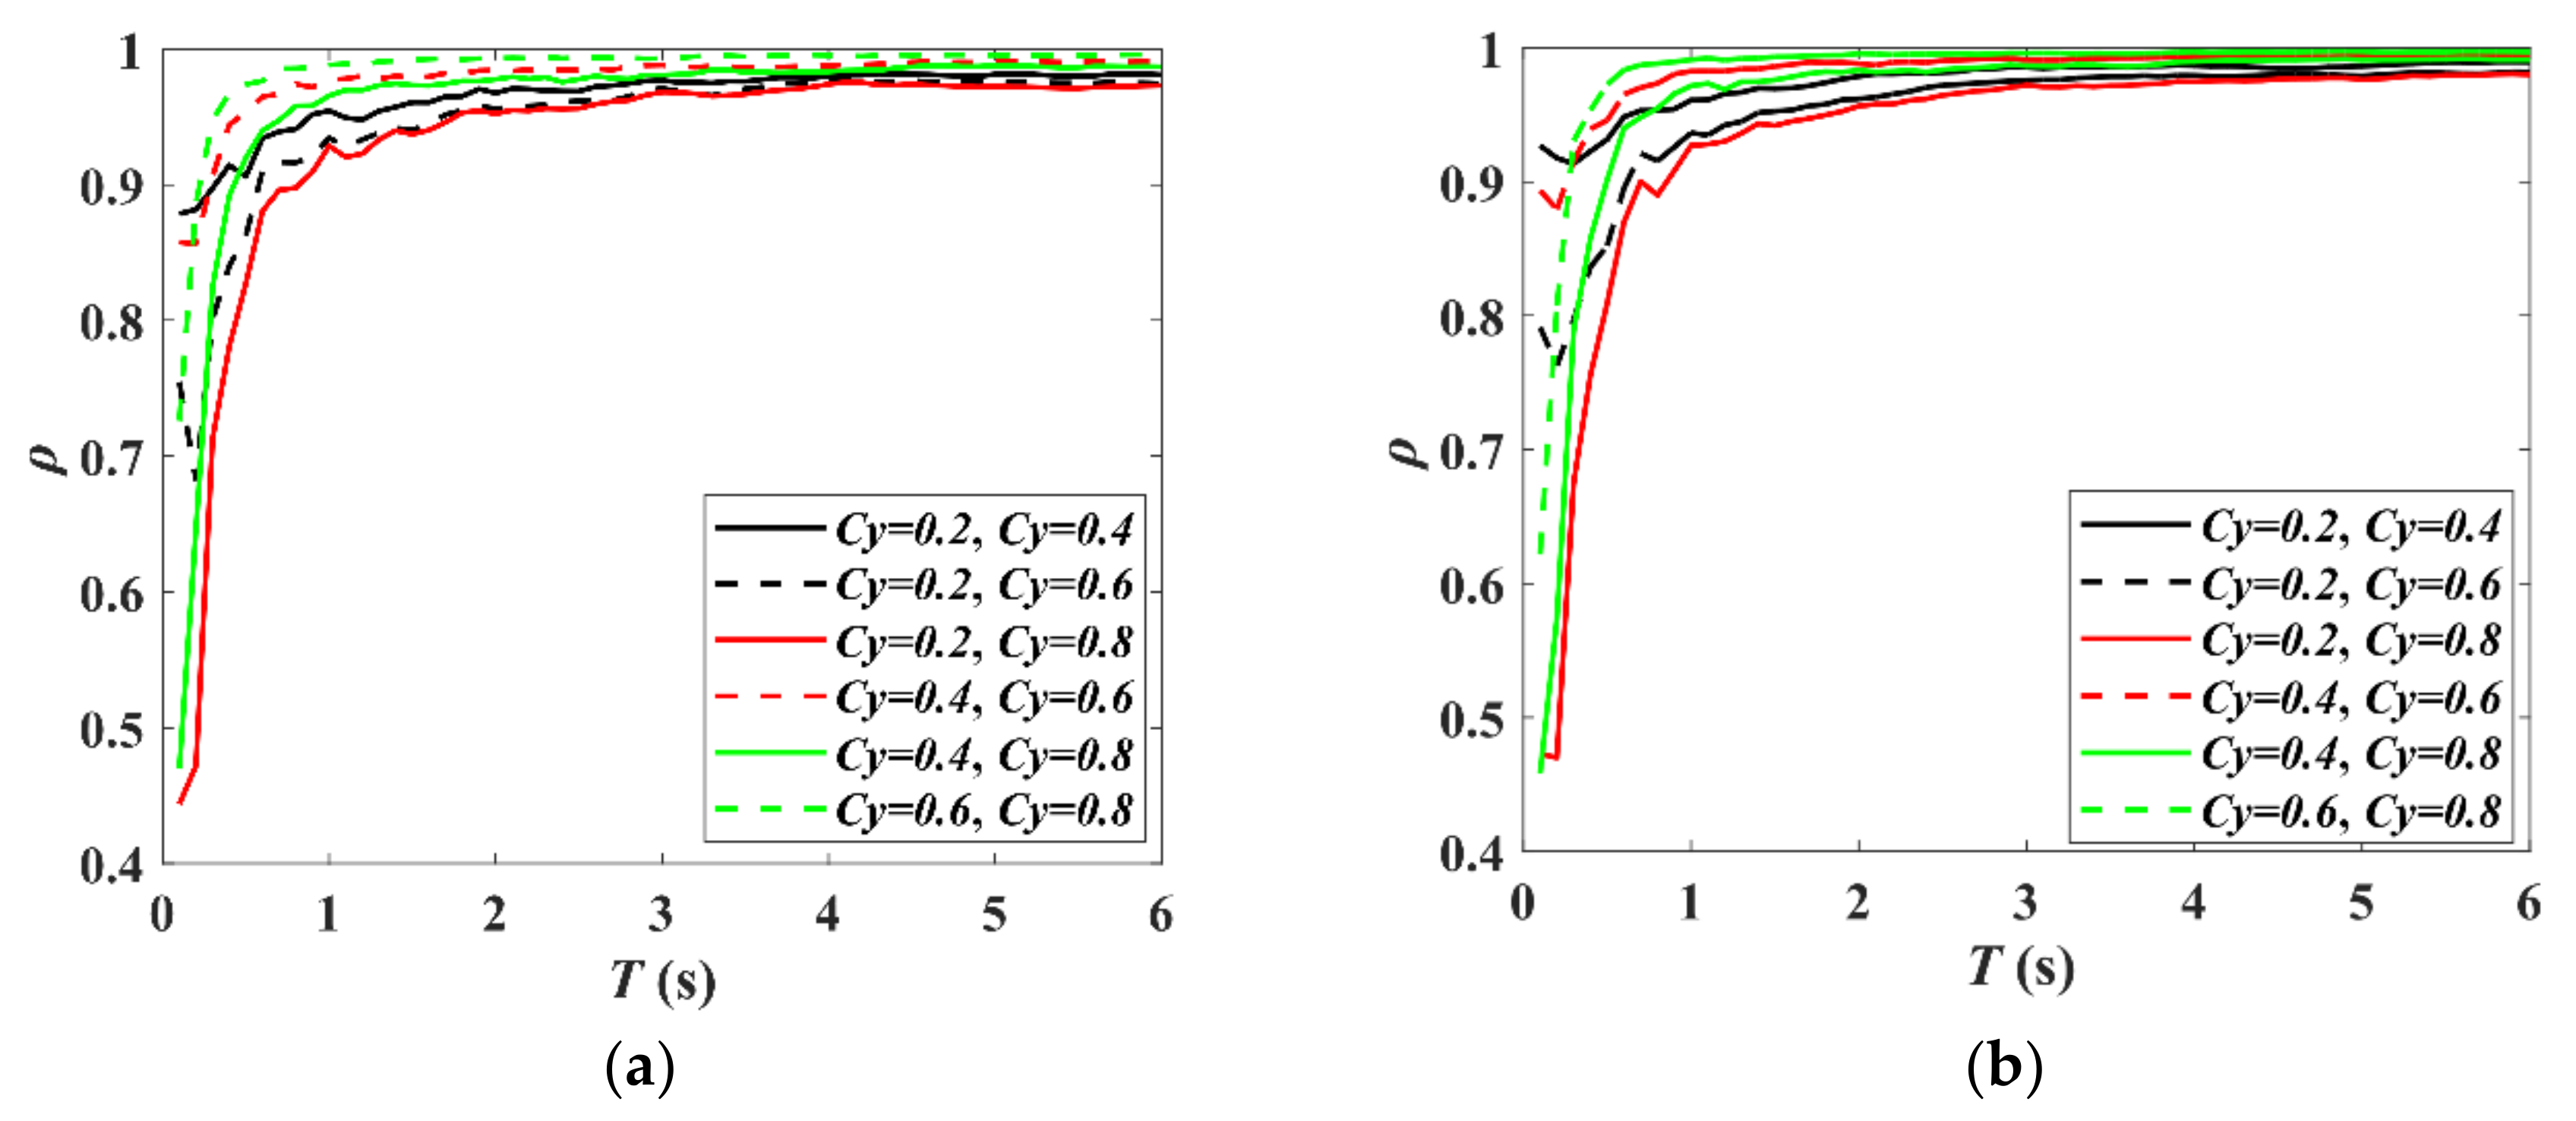
In the short-period range (T < 0.5 s), the correlation coefficients of Sd rankings under different Cy condition is less than 0.8. Especially when the change of Cy is large, the correlation is poor. In the medium- and long-period ranges (T ≥ 0.5 s), the correlation coefficient of the Sd ranking under different Cy conditions is higher, and the correlation is very good. When the Cy changes, the Sd values will change, but the variation of the Sd rankings is small. It can be concluded that the damage potential rankings in the short-period range are more sensitive to the change of Cy than that in the medium- and long-period.
(2)
When the change of Cy is smaller, the larger the correlation coefficient of the corresponding Sd rankings is, the smaller the variation of Sd ranking is. On the contrary, when the difference between the Sd rankings under different Cy conditions is larger, the smaller the correlation coefficient of the corresponding Sd rankings is.

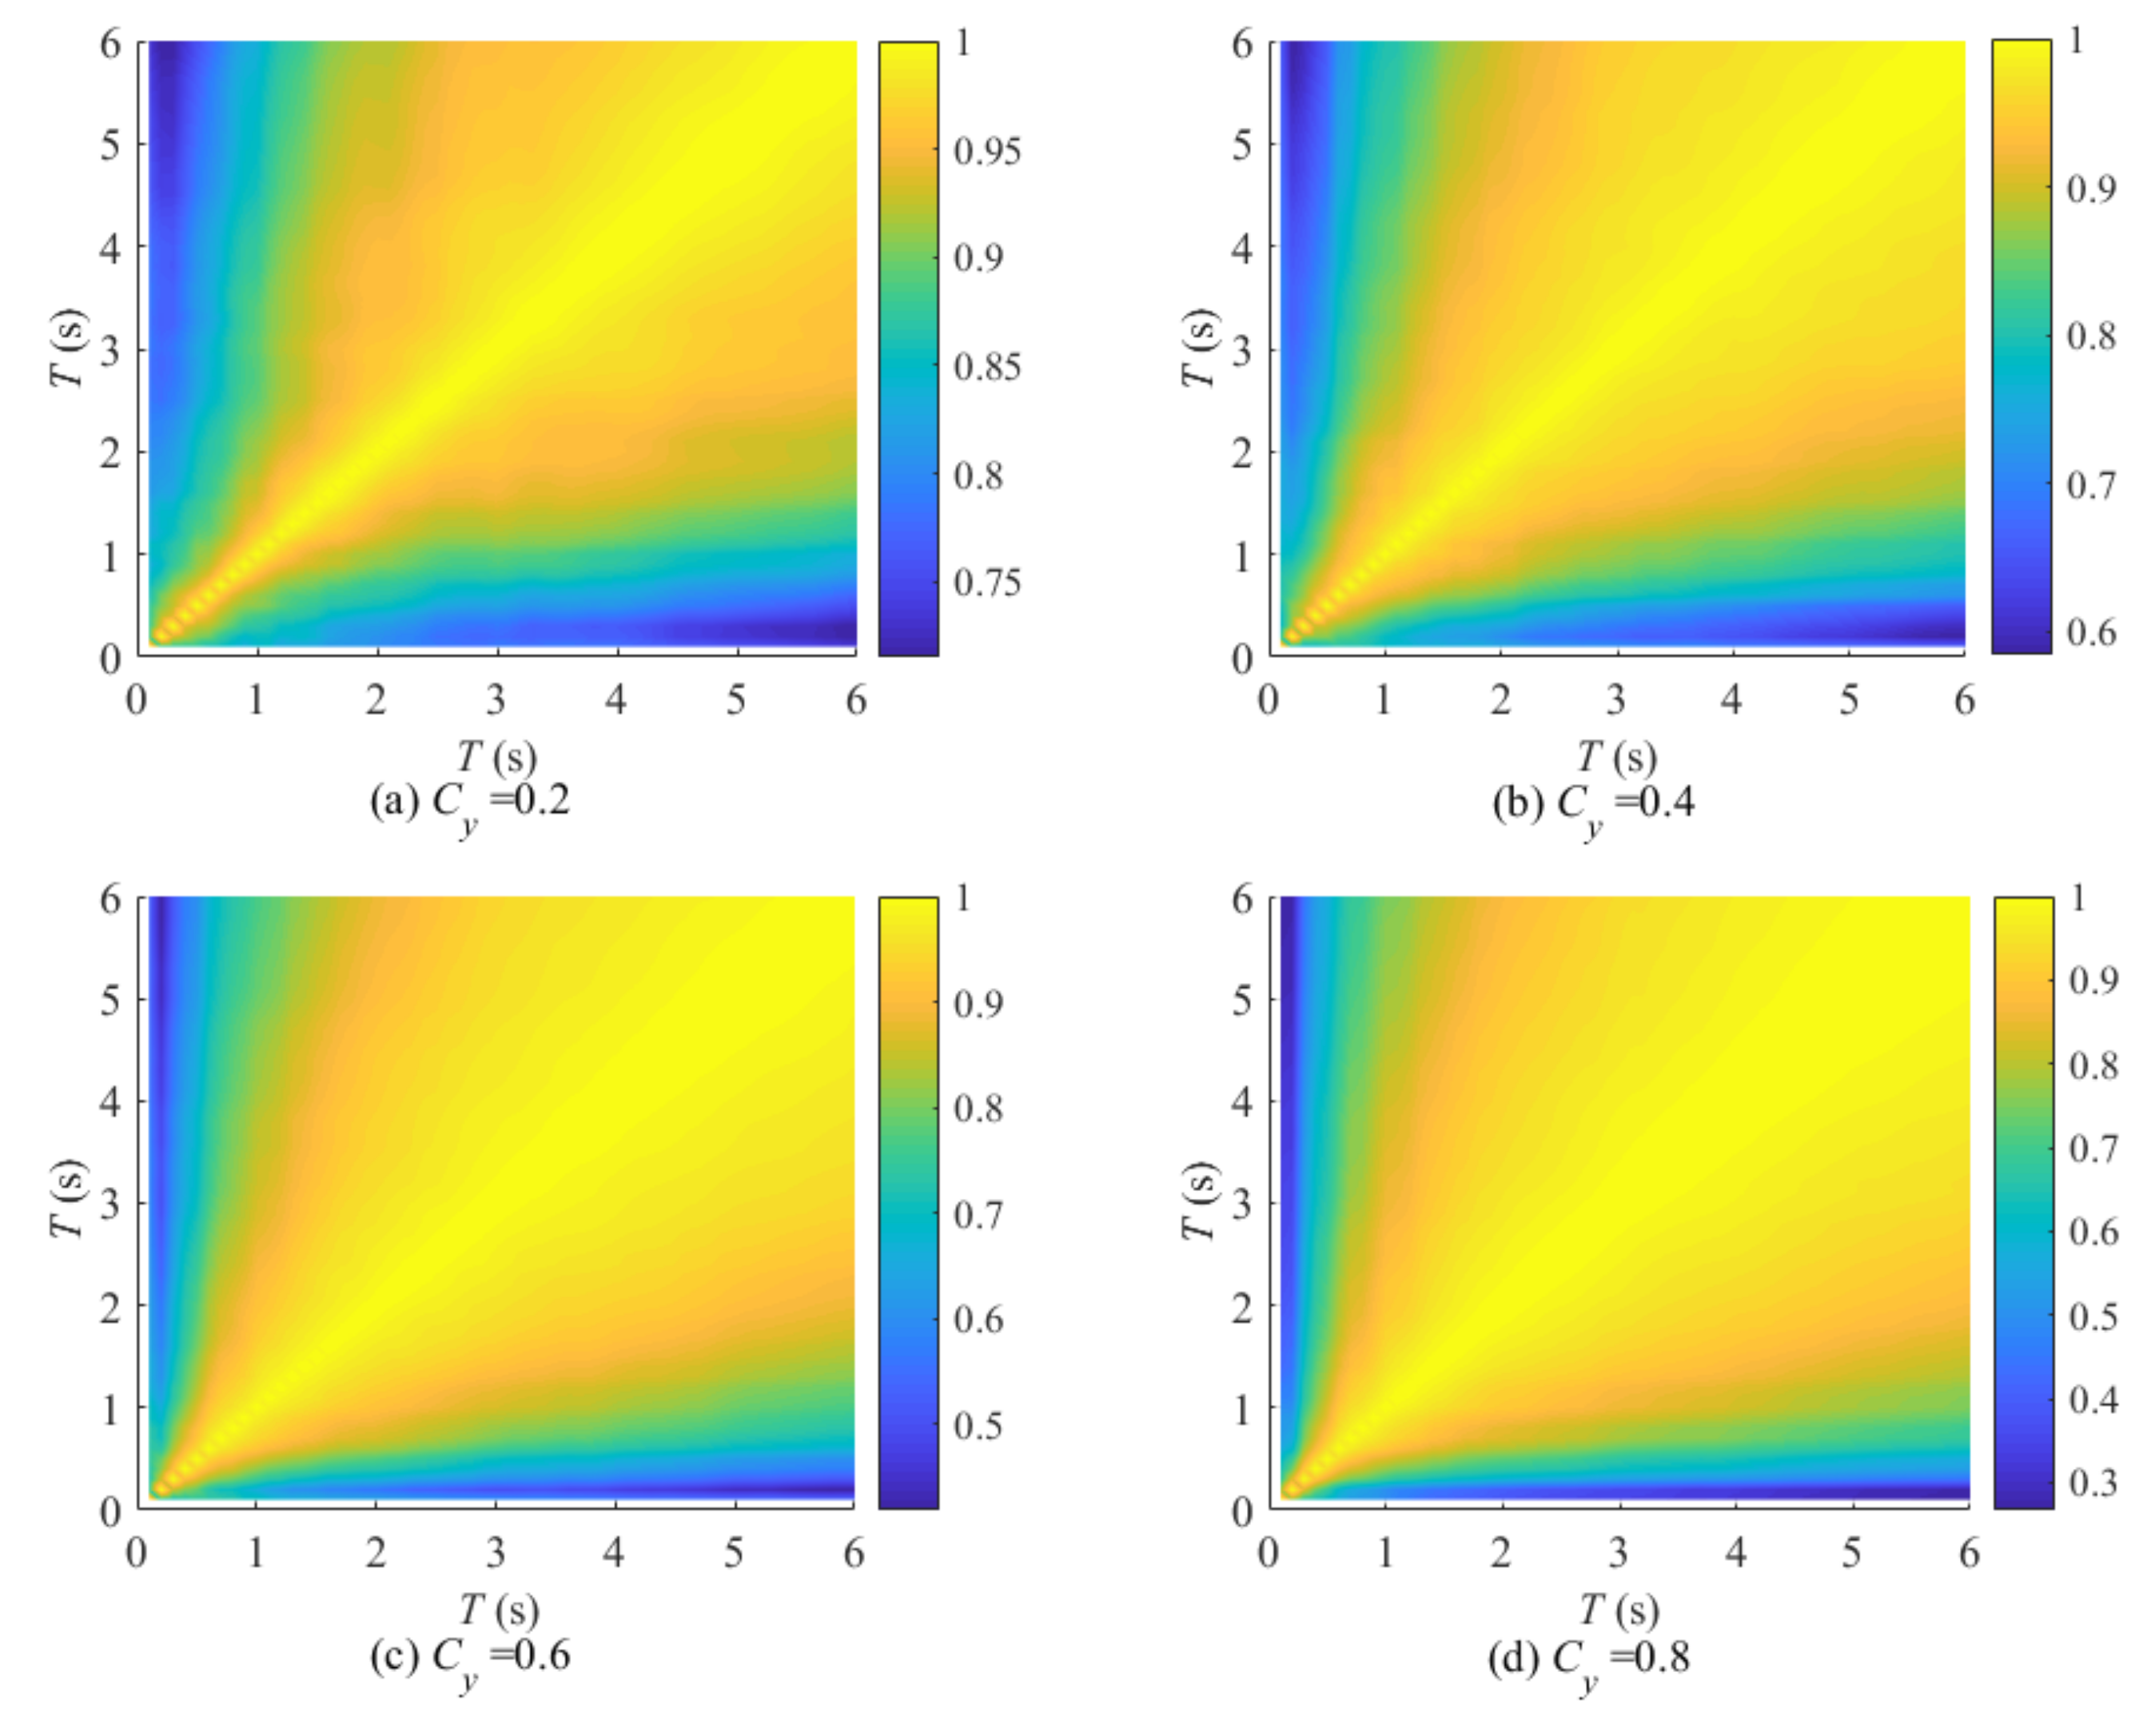
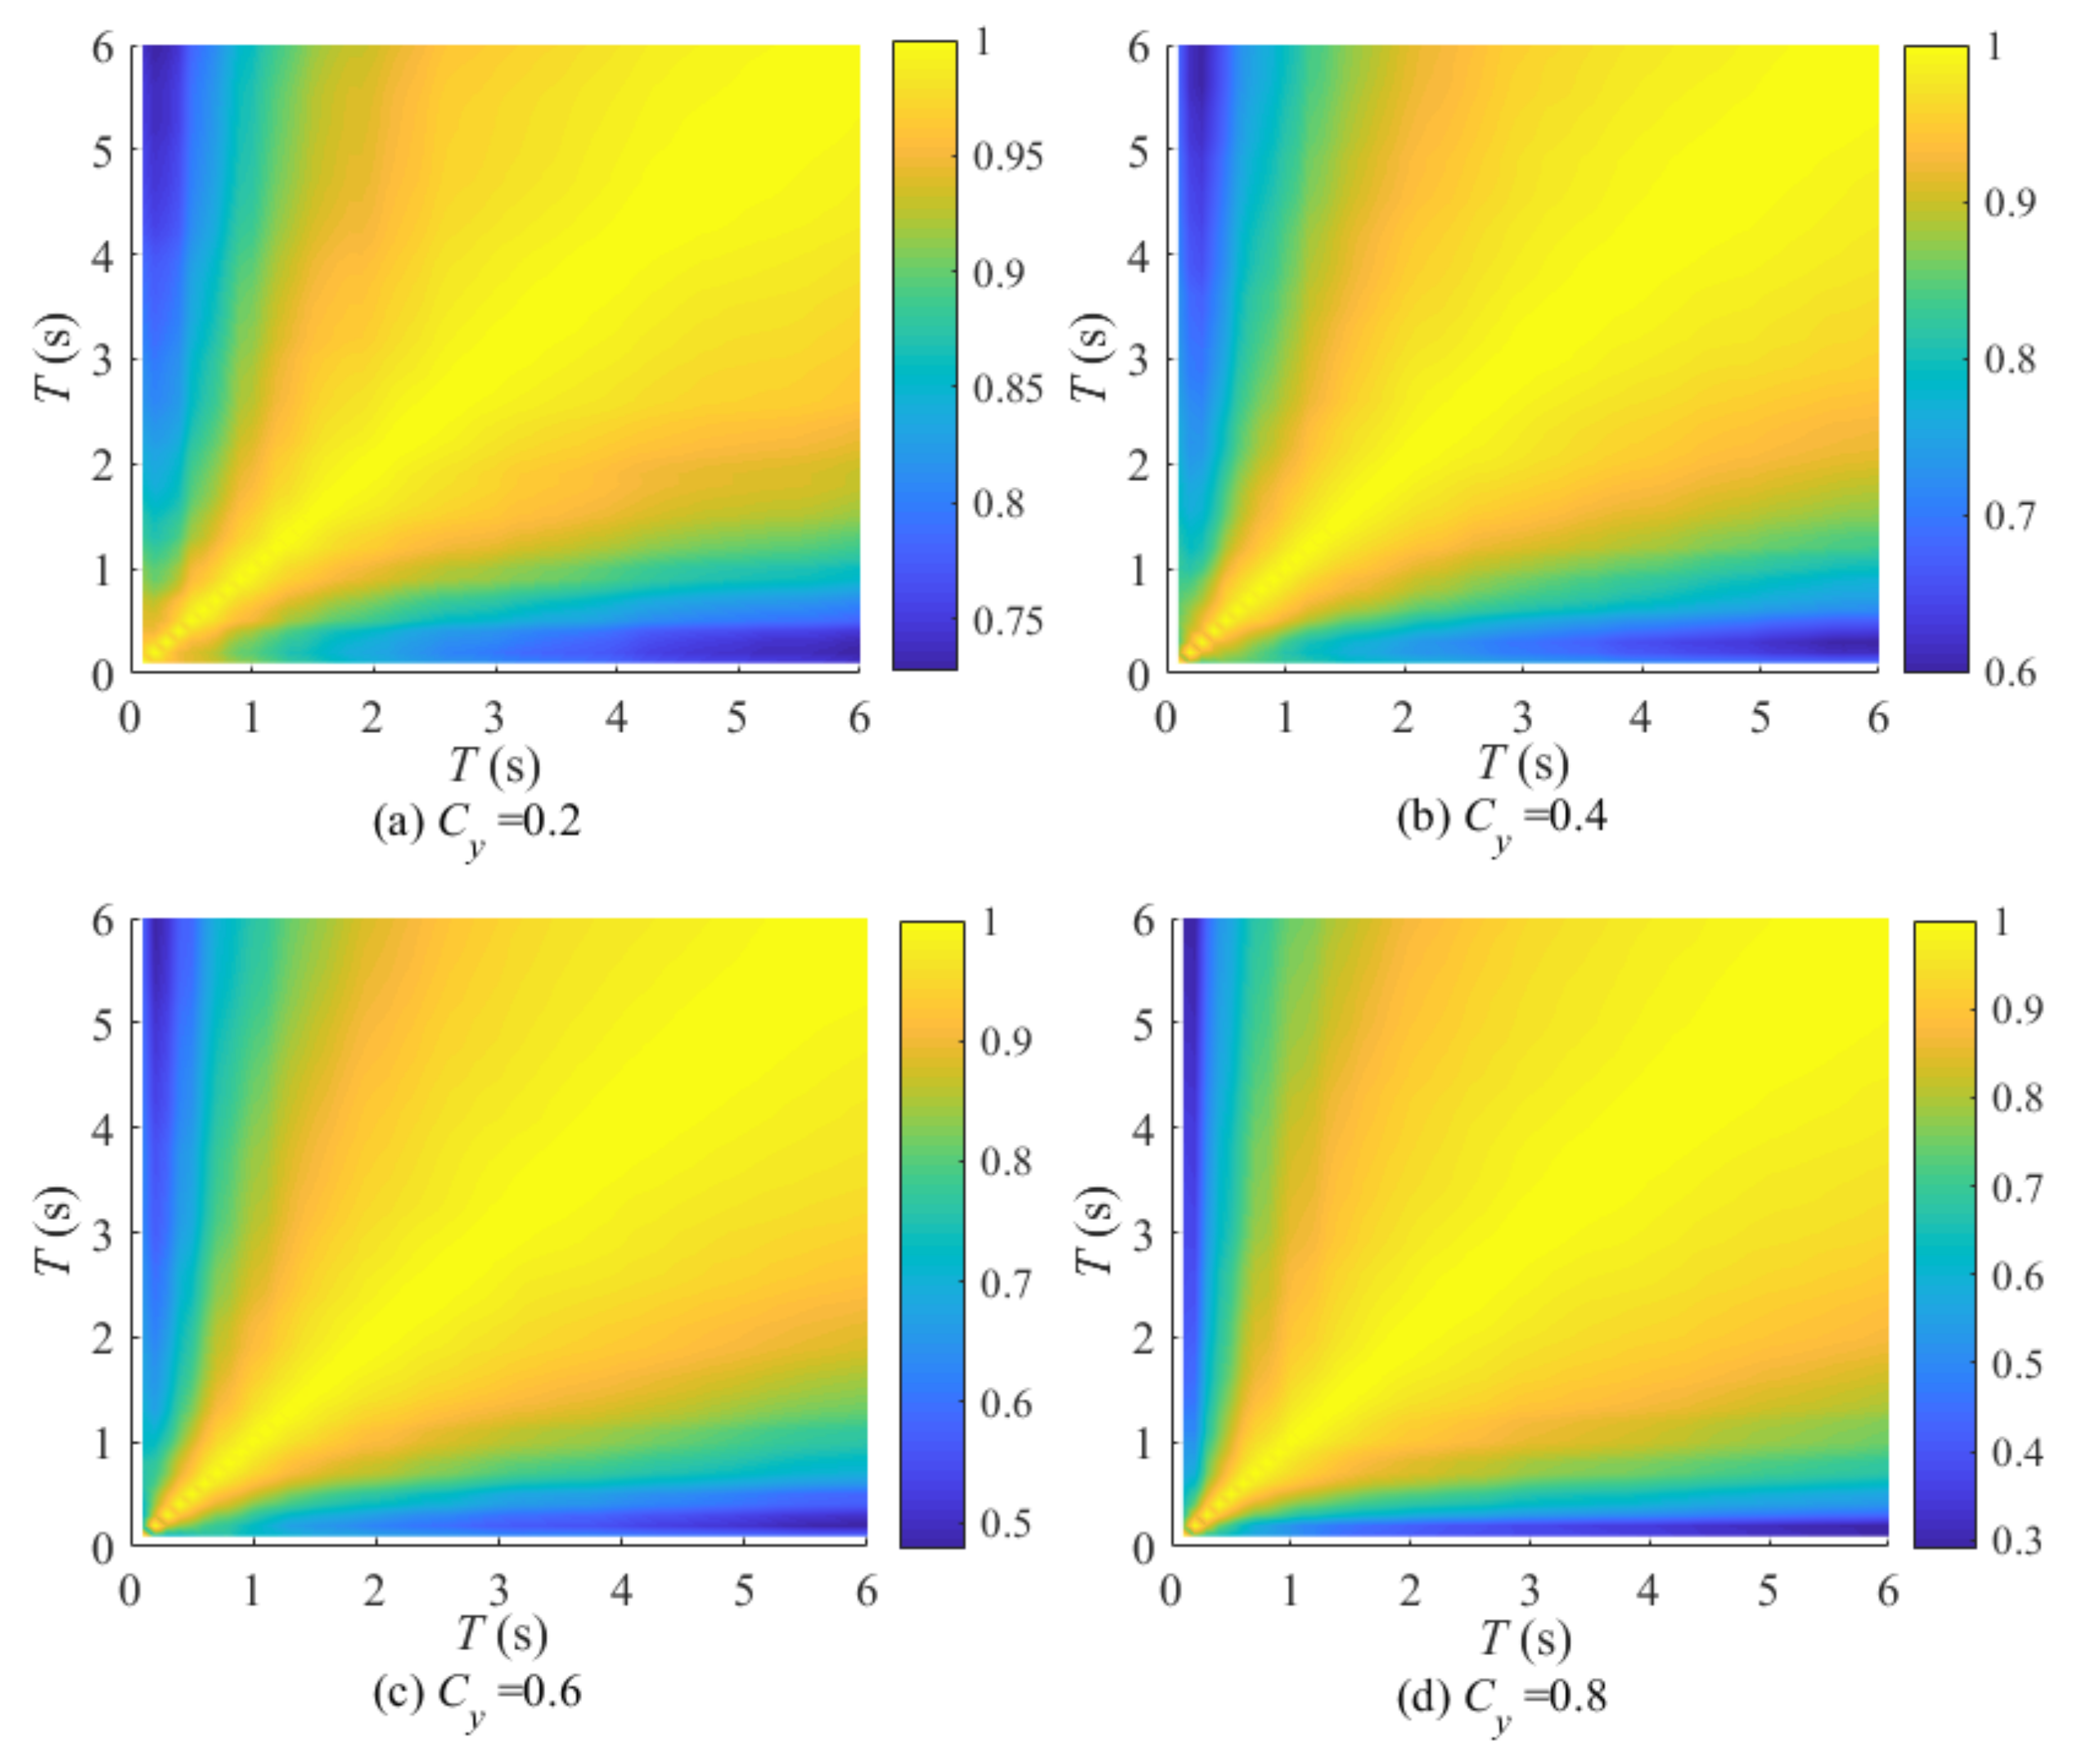
5.2. Correlation Analysis of the Sd Ranking under Different T and Same Cy Condition

When the Cy is constant, the correlation analysis of Sd ranking under different T conditions is analyzed, and the calculated results are shown in Figure 6 and Figure 7, in which abscissa and ordinates are both T, and different colors represent the value of the ρ. The following conclusions can be drawn from the results:
(1)
The variation law of the Sd ranking at different T is the same. When the ΔT of the two periods is small, the ρ of the corresponding Sd rankings is larger, and the variation of the damage potential ranking is small. On the contrary, when the ΔT of the two periods is larger, the ρ of the corresponding Sd ranking is smaller.
(2)
The Sd rankings are more sensitive to the change of T in the short-period compared with the medium- and long-period. More periods need to be selected for research in short-period.

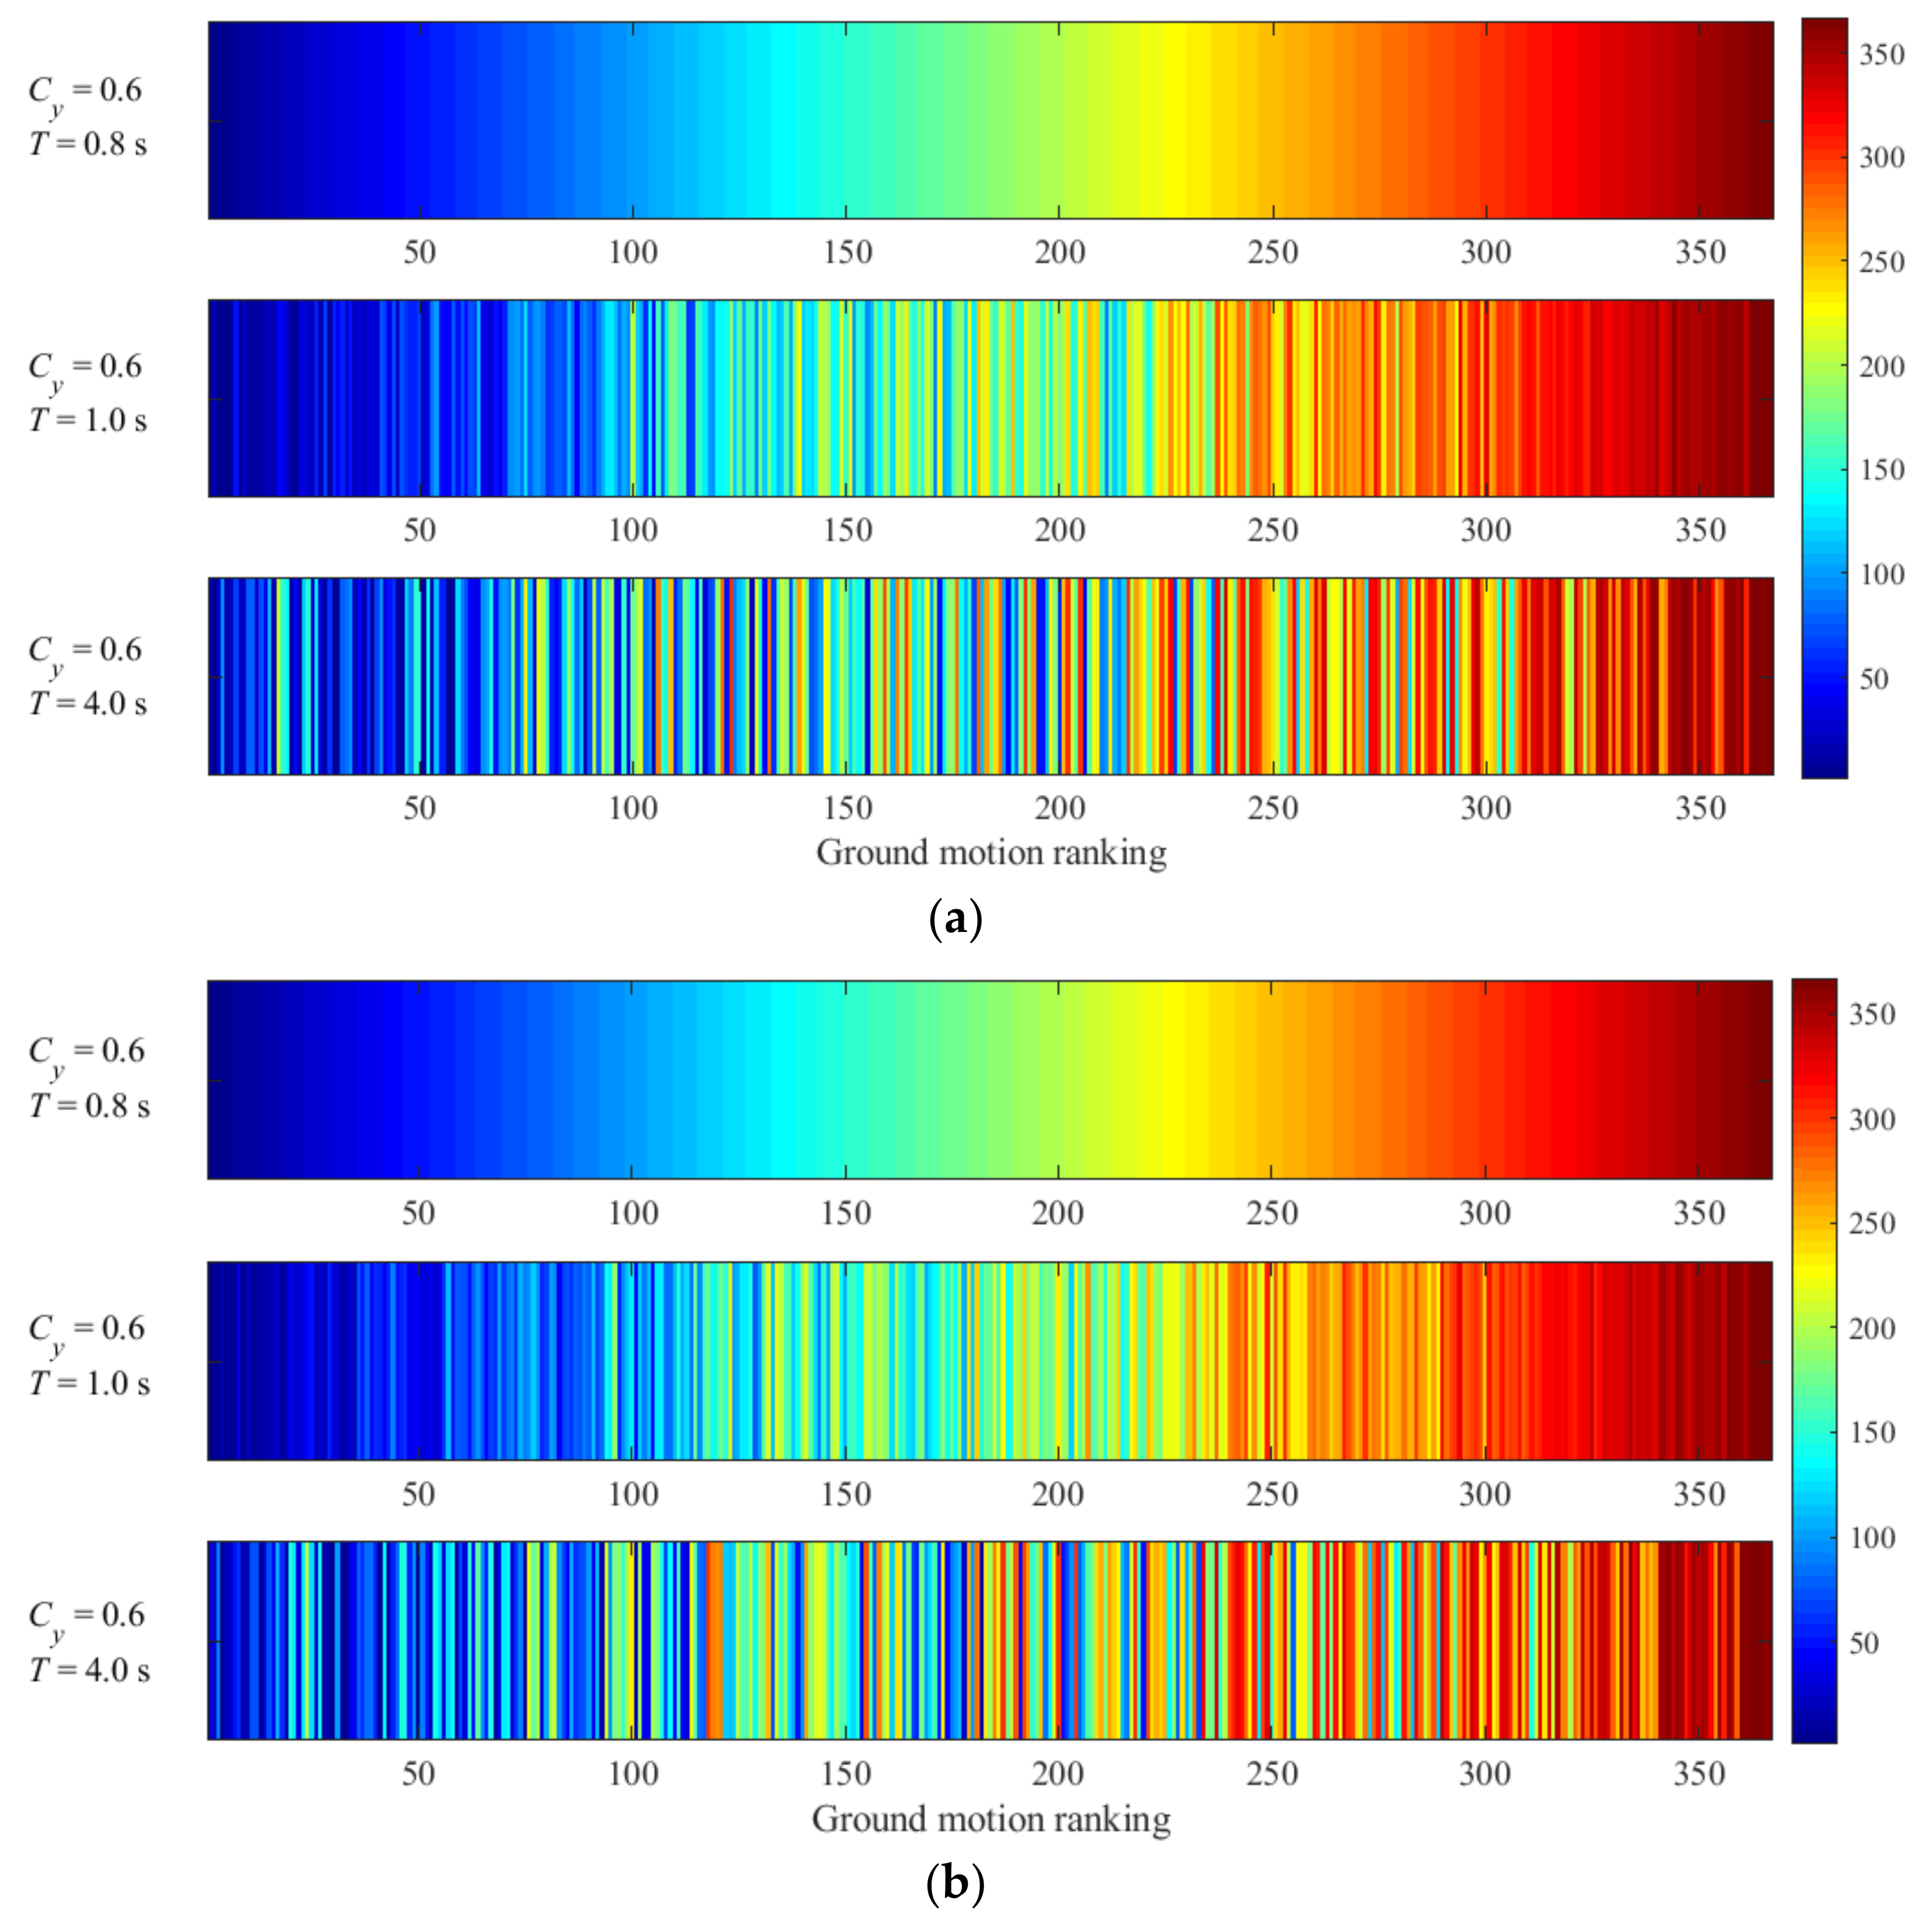
5.3. Comparative Analysis of the Damage Potential Ranking under Specific Cy and T Condition

The effect of different Cy and T on the damage potential ranking is analyzed in detail in this paper, and the degree of influence is mainly reflected by the correlation coefficient of Sd rankings. Based on the two hysteretic models, this section selects the specific Sd ranking results under 12 conditions of different Cy and T for comparative analysis, and the size of the Sd ranking of ground motions is expressed in different colors to verify the rationality of the previous conclusions. The results are shown in Table 2, Figure 8 and Figure 9.
(1)
According to the results of Figure 8 and Table 2, when the T is equal to 0.8 s and 1.0 s, respectively, with a constant Cy value of 0.6, the corresponding ∆T is smaller, and the corresponding damage potential rankings of ground motions have a strong correlation and a smaller discreteness. Whereas the corresponding damage potential rankings results are also quite different when the T is equal to 4.0 s. The coefficient of variation ( δ X ¯ ) is increased by 70% and 150%, respectively, based on the bilinear model and modified Clough model compared with the former condition. The corresponding correlation becomes weaker and the discreteness increases.
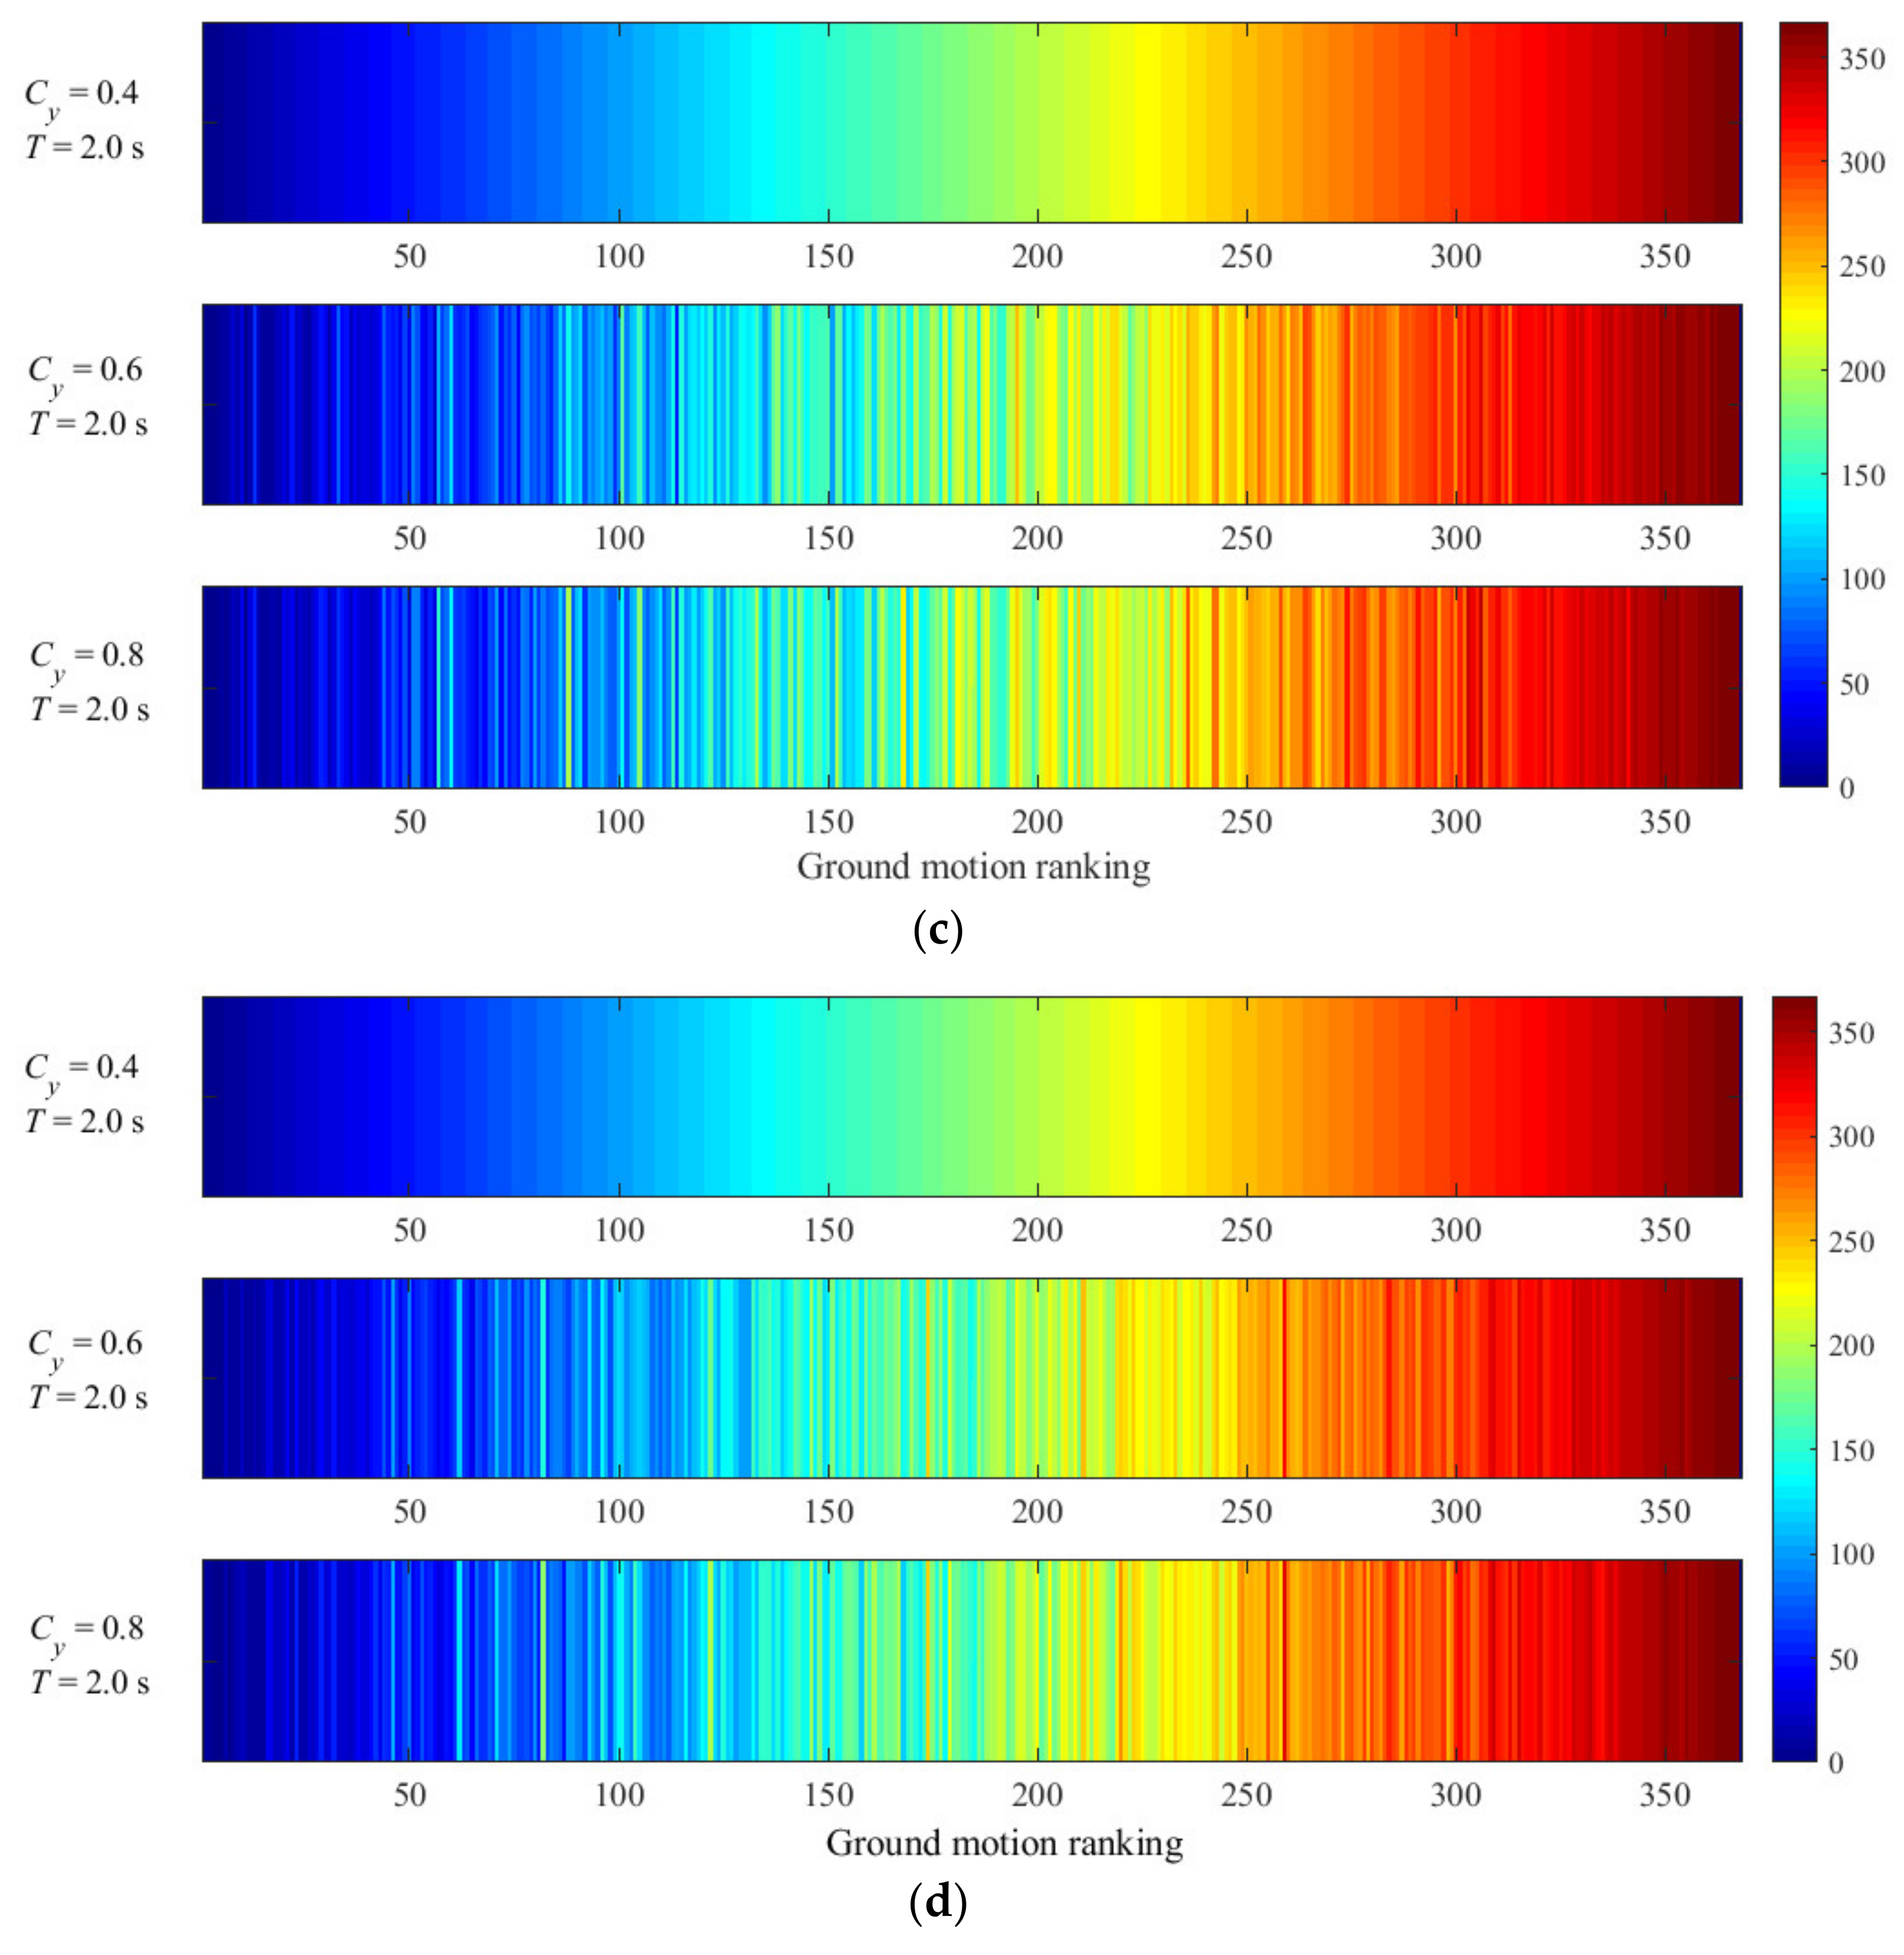
(2)
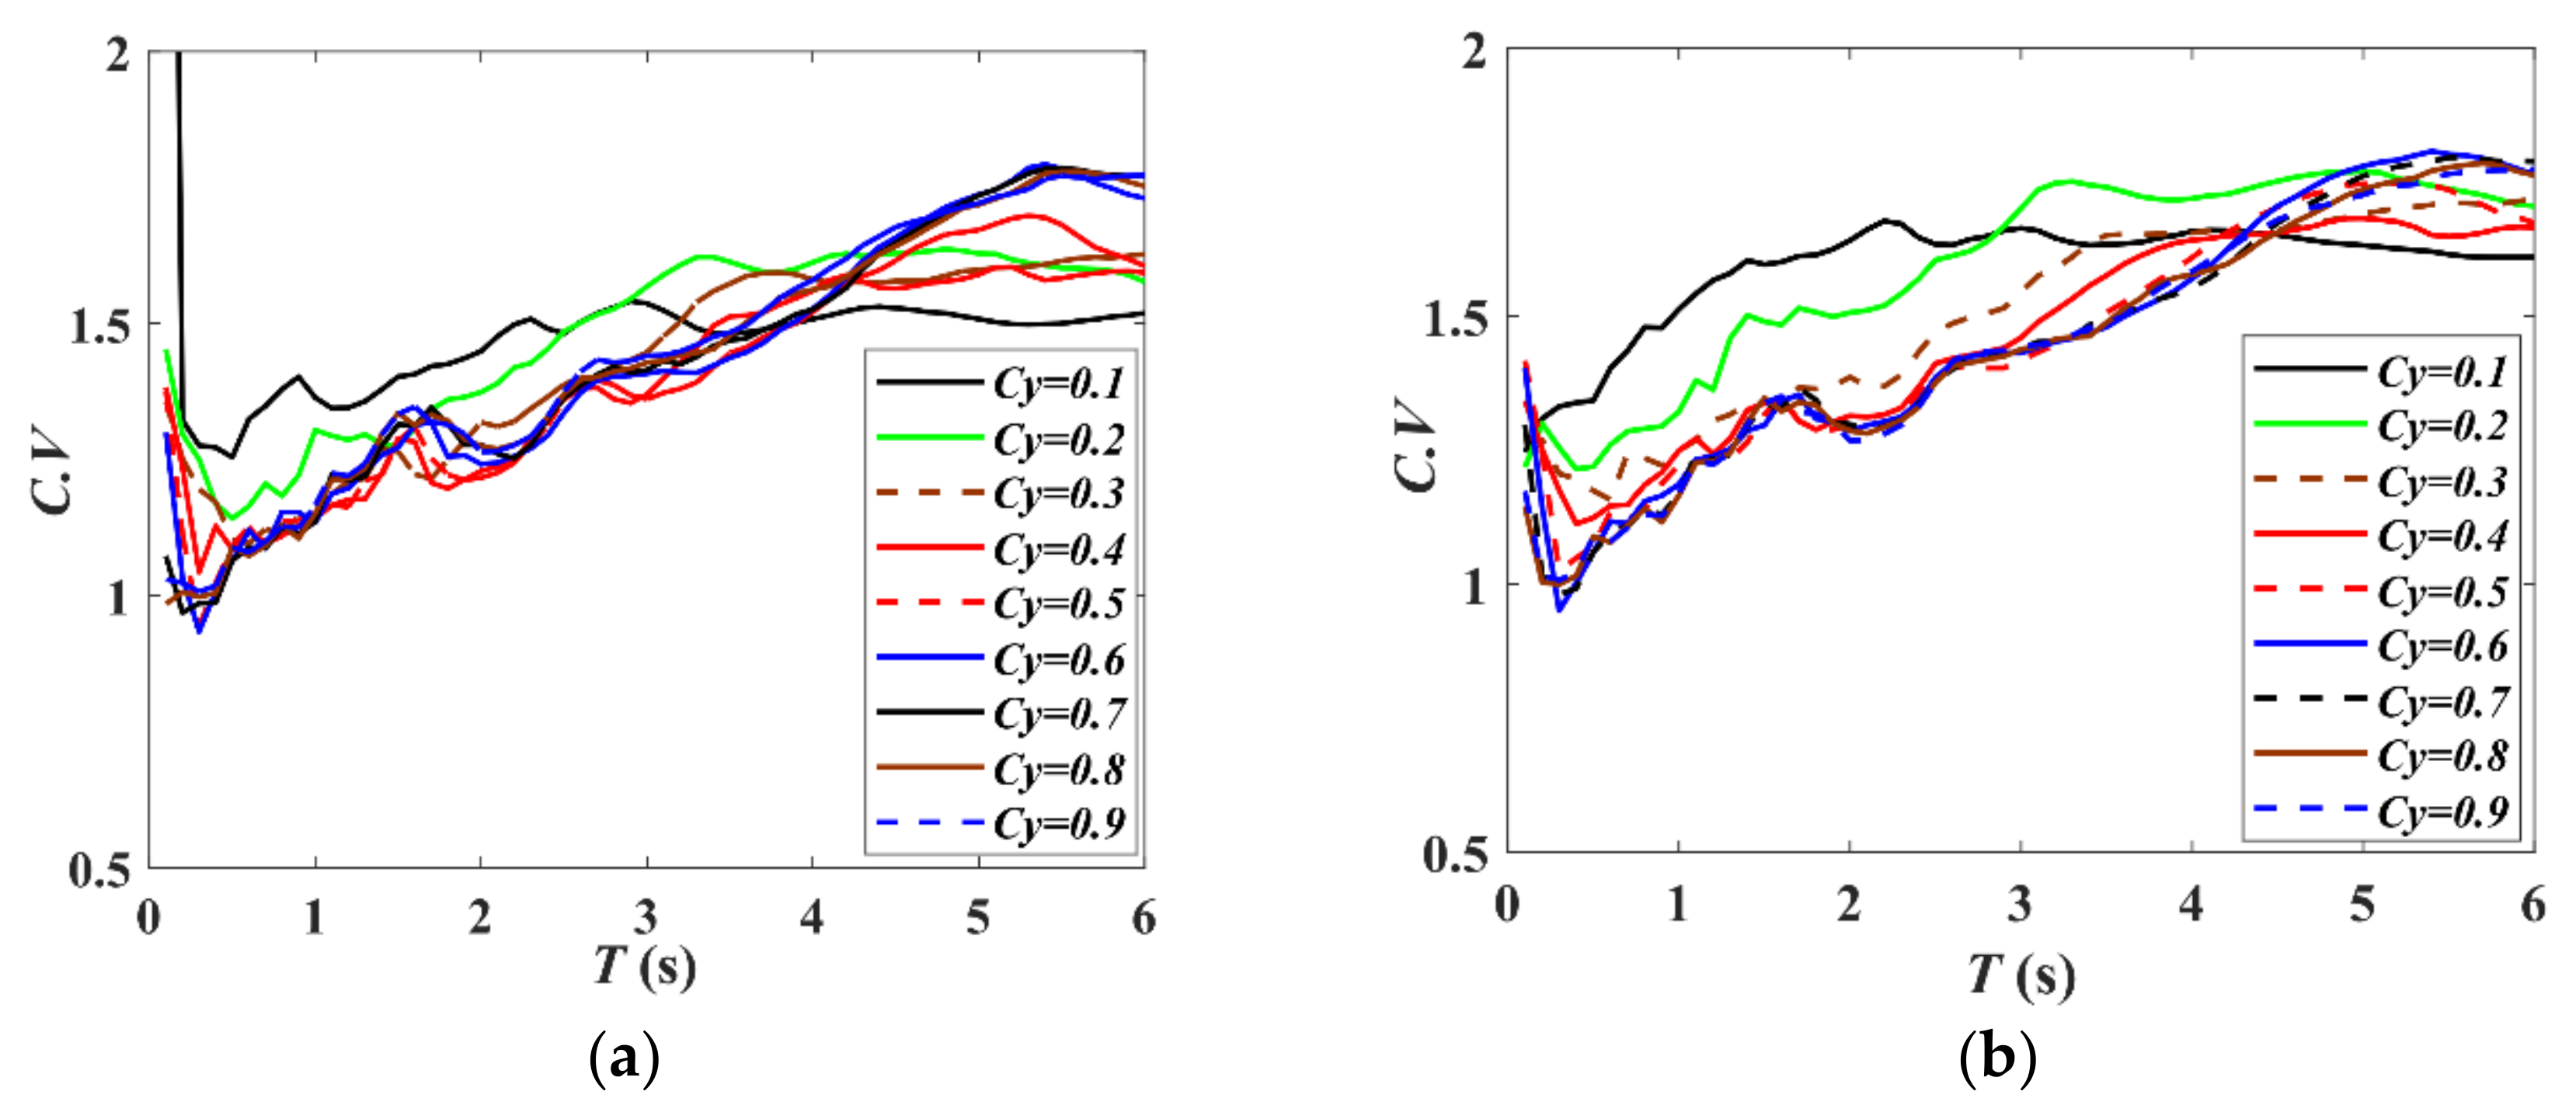
From the results of Figure 9a,b and Table 2, it can be seen that when T is determined (T = 0.2 s, short-period range), there is much difference in Sd ranking under different Cy conditions, and the corresponding coefficient of variation ( δ X ¯ ) of the damage potential of ground motions is very large and the correlation coefficient is small. However, it can be seen from Figure 9c,d that when T is determined (T is equal to 2.0 s, medium- and long-period range), the corresponding Sd rankings under different Cy conditions change little. It can be also concluded that the damage potential ranking in the short-period range is more sensitive to the change of Cy than that in the medium- and long-period range.

6. Conclusions

The damage potential of ground motions is represented by the Sd, and the Sd under different T and Cy conditions is analyzed based on a bilinear and modified Clough hysteretic model. Not only the variation of the Sd values and discreteness under different T and Cy conditions are analyzed, but more importantly, the variation of Sd ranking is also analyzed. The conclusions are as follows.
(1)
When Cy is constant, the average value of Sd increases with the increase in T. When T is constant, the smaller the Cy in the short- and medium-period ranges, the larger the average value of Sd. On the contrary, the smaller the Cy, the smaller the average value of Sd in the long-period range.
(2)
The correlation coefficient of the Sd ranking under different Cy conditions is less than 0.8 in the short-period range. Especially when the difference of Cy is large, the correlation of the corresponding Sd rankings is poor, which indicates that Cy has a great effect on the Sd rankings. In the medium- and long-period range, the correlation coefficient of Sd values corresponding to different Cy is higher, and the correlation is very good, indicating that Cy has almost no effect on the Sd ranking.
(3)
In the medium- and long-period range, with the change of T, and when the change of T is small, the Sd value changes obviously, but the change of Sd ranking is very small. When T changes greatly, the Sd value and Sd ranking change greatly.
It is worth noting that only the SDOF system is used to analyze the damage potential ranking in this paper, and the multi-degree-of-freedom structures need to be used in the next study.

Author Contributions

Conceptualization, Q.L. and J.H.; methodology, L.X.; software, Q.L.; validation, Q.L., J.H. and L.X.; formal analysis, Q.L.; investigation, Q.L.; resources, Q.L.; data curation, Q.L.; writing—original draft preparation, Q.L.; writing—review and editing, J.H.; visualization, J.H.; supervision, L.X.; project administration, Q.L.; funding acquisition, L.X. All authors have read and agreed to the published version of the manuscript.

Funding

The work is supported by the Transportation Science and Technology Project of Sichuan Province (Grant No. 2018-ZL-01), Institute local cooperation project of Chinese Academy of Engineering (Grant No. HB2022B18) and the National Natural Science Foundation of China (Grant No. U2139207; U1939210).

Institutional Review Board Statement

Not applicable.

Informed Consent Statement

Not applicable.

Data Availability Statement

Not applicable.

Acknowledgments

The work is supported by the National Natural Science Foundation of China (Grant No. U2139207; U1939210). The support is gratefully acknowledged. The authors would also like to thank the NGA-West2 database for providing strong ground motion data.

Conflicts of Interest

The authors declare no conflict of interest.

References

  1. Infantino, M.; Smerzini, C.; Lin, J. Spatial correlation of broadband ground motions from physics-based numerical simulations. Earthq. Eng. Struct. Dyn. 2021, 50, 2575–2594. [Google Scholar] [CrossRef]
  2. Wang, W.; Li, D.Q.; Liu, Y.; Du, W. Influence of ground motion duration on the seismic performance of earth slopes based on numerical analysis. Soil Dyn. Earthq. Eng. 2021, 143, 106595. [Google Scholar] [CrossRef]
  3. Aljawhari, K.; Gentile, R.; Freddi, F.; Galasso, C. Effects of ground-motion sequences on fragility and vulnerability of case-study reinforced concrete frames. Bull. Earthq. Eng. 2021, 19, 6329–6359. [Google Scholar] [CrossRef]
  4. Bhagat, S.; Wijeyewickrema, A.C.; Subedi, N. Influence of near-fault ground motions with fling-step and forward-directivity characteristics on seismic response of base-isolated buildings. J. Earthq. Eng. 2021, 25, 455–474. [Google Scholar] [CrossRef]
  5. Cheng, Y.; Fu, L.Y. Nonlinear seismic inversion by physics-informed Caianiello convolutional neural networks for overpressure prediction of source rocks in the offshore Xihu depression, East China. J. Pet. Sci. Eng. 2022, 215, 110654. [Google Scholar] [CrossRef]
  6. Alam, Z.; Sun, L.; Zhang, C.; Samali, B. Influence of seismic orientation on the statistical distribution of nonlinear seismic response of the stiffness-eccentric structure. Structures 2022, 39, 387–404. [Google Scholar] [CrossRef]
  7. Huang, S.; Lyu, Y.; Sha, H.; Xiu, L. Seismic performance assessment of unsaturated soil slope in different groundwater levels. Landslides 2021, 18, 2813–2833. [Google Scholar] [CrossRef]
  8. Kramer, S.L. Geotechnical Earthquake Engineering; Prentice Hall: Englewood Cliffs, NJ, USA, 1996. [Google Scholar]
  9. Hu, J.J.; Lai, Q.H.; Liu, B.L.; Xie, L.L. Ranking of ground motions destructive capacity for low- and middle-rise RC frame structures based on a comprehensive intensity measure. Adv. Struct. Eng. 2022, 25, 1745–1758. [Google Scholar] [CrossRef]
  10. Cabanas, L.; Benito, B.; Herraiz, M. An approach to the measurement of the potential structural damage of earthquake ground motions. Earthq. Eng. Struct. Dyn. 1997, 26, 79–92. [Google Scholar] [CrossRef]
  11. Zhai, C.H.; Xie, L.L. A new approach of selecting real input ground motions for seismic design: The most unfavorable real seismic design ground motions. Earthq. Eng. Struct. Dyn. 2007, 36, 1009–1027. [Google Scholar] [CrossRef]
  12. Kostinakis, K.; Fontara, I.K.; Athanatopoulou, A.M. Scalar Structure-Specific Ground Motion Intensity Measures for Assessing the Seismic Performance of Structures: A Review. J. Earthq. Eng. 2018, 22, 630–665. [Google Scholar] [CrossRef]
  13. Zhai, C.H.; Wen, W.P.; Li, S. The damage investigation of inelastic SDOF structure under the mainshock–aftershock sequence-type ground motions. Soil Dyn. Earthq. Eng. 2014, 59, 30–41. [Google Scholar] [CrossRef]
  14. Zhai, C.H.; Ji, D.F.; Wen, W.P. Constant ductility energy factors for the near-fault pulse-like ground motions. J. Earthq. Eng. 2017, 21, 343–358. [Google Scholar] [CrossRef]
  15. Li, C.H.; Kunnath, S.; Zhai, C.H. Influence of Early-Arriving Pulse-Like Ground Motions on Ductility Demands of Single-Degree-of-Freedom Systems. J. Earthq. Eng. 2020, 24, 1337–1360. [Google Scholar] [CrossRef]
  16. Zhai, C.H.; Ji, D.F.; Wen, W.P.; Weidong, L.; Xie, L.; Gong, M. The inelastic input energy spectra for main shock–aftershock sequences. Earthq. Spectra 2016, 32, 2149–2166. [Google Scholar] [CrossRef]
  17. Rupakhety, R.; Sigbjörnsson, R. Ground-Motion Prediction Equations (GMPEs) for inelastic displacement and ductility demands of constant-strength SDOF systems. Bull. Earthq. Eng. 2009, 7, 661–679. [Google Scholar] [CrossRef]
  18. Miranda, E. Inelastic Displacement ratios for structures on firm sites. J. Struct. Eng. 2000, 126, 1150–1159. [Google Scholar] [CrossRef]
  19. Yaghmaei, S.S.; Makaremi, S. Development of duration- dependent damage-based inelastic response spectra. Earthq. Eng. Struct. Dyn. 2017, 46, 771–789. [Google Scholar] [CrossRef]
  20. Longjun, X.; Yabin, C. Easy detection for the high-pass filter cut-off frequency of digital ground motion record based on STA/LTA method: A case study in the 2008 Wenchuan mainshock. J. Seismol. 2021, 25, 1281–1300. [Google Scholar] [CrossRef]
  21. Vaiana, N.; Rosati, L. Classification and unified phenomenological modeling of complex uniaxial rate-independent hysteretic responses. Mech. Syst. Signal Process. 2023, 182, 109539. [Google Scholar] [CrossRef]
  22. Palanci, M.; Senel, S.M. Correlation of earthquake intensity measures and spectral displacement demands in building type structures. Soil Dyn. Earthq. Eng. 2019, 121, 306–326. [Google Scholar] [CrossRef]
  23. Chen, Y.; Xu, L.; Zhu, X.; Liu, H. A multi-objective ground motion selection approach matching the acceleration and displacement response spectra. Sustainability 2018, 10, 4659. [Google Scholar] [CrossRef] [Green Version]
  24. Zhai, C.H.; Wen, W.P.; Chen, Z.Q.; Li, S.; Xie, L.-L. Damage spectra for the mainshock–aftershock sequence-type ground motions. Soil Dyn. Earthq. Eng. 2013, 45, 1–12. [Google Scholar] [CrossRef]
  25. Hu, J.J.; Lai, Q.H.; Li, S.; Xie, L.L. Procedure for ranking ground motion records based on the destructive capacity parameter. KSCE J. Civ. Eng. 2020, 25, 197–207. [Google Scholar] [CrossRef]
  26. Hu, J.J.; Lai, Q.H.; Liu, X.; Xie, L.L. Effects of structural and seismic factors on the constant-strength ductility spectra based on NGA-West2 database. Shock Vib. 2020, 2020, 8820582. [Google Scholar] [CrossRef]
  27. Eurocode 8: Design of Structures for Earthquake Resistance-Part 1: General Rules, Seismic Actions and Rules for Buildings; Technical Committee CEN/TC: Brussels, Belgium, 2005.
  28. GB 50011−2010; Code for Seismic Design of Buildings. Architecture and Building Press: Beijing, China, 2010. (In Chinese)
  29. American Society of Civil Engineers. Minimum Design Loads for Buildings and Other Structures; Amer Society of Civil Engineers: Reston, VA, USA, 2010. [Google Scholar]
  30. Lai, Q.H.; Hu, J.J.; Xu, L.; Xie, L.; Lin, S. Method for Ranking Pulse-like Ground Motions According to Damage Potential for Reinforced Concrete Frame Structures. Buildings 2022, 12, 754. [Google Scholar] [CrossRef]
  31. Wang, D.H. Multivariate Statistical Analysis and SPSS Application; East China University of Science and Technology Press: Sanghai, China, 2010. (In Chinese) [Google Scholar]
Figure 1. Magnitude-epicentral distance distribution of the selected ground motions.
Applsci 13 00392 g001
Figure 2. Force-displacement hysteresis loops simulated by the (a) bilinear and (b) modified Clough models.
Applsci 13 00392 g002
Figure 3. The Sd mean spectrum under different Cy conditions. (a) Bilinear model, (b) modified Clough model.
Applsci 13 00392 g003
Figure 4. Analysis of the effect of different yield strength coefficients on the discreteness of the Sd spectrum. (a) Bilinear model, (b) odified Clough model.
Applsci 13 00392 g004
Figure 5. Correlation analysis of Sd rankings under different Cy conditions. (a) Bilinear model, (b) modified Clough model.
Applsci 13 00392 g005
Figure 6. Correlation analysis of Sd rankings at different periodic points (Bilinear model).
Applsci 13 00392 g006
Figure 7. Correlation analysis of Sd rankings at different periodic points (modified Clough model).
Applsci 13 00392 g007
Figure 8. Comparison of displacement response rankings at different periodic points when the yield strength coefficient is constant. (a) Bilinear model (Cy = 0.6), (b) modified Clough model (Cy = 0.6).
Applsci 13 00392 g008
Figure 9. Comparison of displacement response rankings under different Cy with a constant T. (a) Bilinear model (T = 0.2 s), (b) modified Clough model (T = 0.2 s), (c) bilinear model (T = 2.0 s), (d) modified Clough model (T = 2.0 s).
Applsci 13 00392 g009aApplsci 13 00392 g009b
Table 1. Classification site results of selected ground motions.
Type of SitesVs30 (m/s)Number
AB>75058
C360–760113
D180–360115
E<18081
Table 2. Correlation and discreteness of earthquake potential damage potential ranking under different Cy and T.
Ground Motion RankingBilinear ModelModified Clough Model
Ranking 1Ranking 2 ρ δ X ¯ ρ δ X ¯
Cy = 0.6, T = 0.8 sCy = 0.6, T = 1.0 s0.9580.1680.9650.152
Cy = 0.6, T = 4.0 s0.7910.2900.7820.381
Cy = 0.4, T = 0.2 sCy = 0.6, T = 0.2 s0.8560.3100.8790.284
Cy = 0.8, T = 0.2 s0.6470.4850.5720.533
Cy = 0.4, T = 2.0 sCy = 0.6, T = 2.0 s0.9840.1020.9880.089
Cy = 0.8, T = 2.0 s0.9780.1220.9830.105
Disclaimer/Publisher’s Note: The statements, opinions and data contained in all publications are solely those of the individual author(s) and contributor(s) and not of MDPI and/or the editor(s). MDPI and/or the editor(s) disclaim responsibility for any injury to people or property resulting from any ideas, methods, instructions or products referred to in the content.

