Article

Lithium Metal: The Key to Green Transportation

by
Philemon Lindagato
1,
Yongjun Li
1,2,*,
Jan Macháček
3,*,
Gaoxue Yang
1,2,
Irénée Mungwarakarama
4,5,
Anastase Ndahimana
6 and
Henri Patrick Kanimba Ntwali
7
1
School of Earth Science and Resources, Chang’an University, Xi’an 710054, China
2
Key Laboratory for the Study of Focused Magmatism and Giant Ore Deposits, MLR, Xi’an 710054, China
3
Department of Social Geography and Regional Development, Faculty of Science, University of Ostrava, Chittussiho, 71000 Ostrava, Czech Republic
4
School of Computer Science and Engineering, Xi’an University of Technology, Xi’an 710054, China
5
School of Computing & Information Sciences, University of Lay Adventists of Kigali, Kigali 6392, Rwanda
6
School of Mechanical Engineering, Xi’an Jiaotong University, Xi’an 710049, China
7
School of Information Engineering, Chang’an University, Xi’an 710064, China
*
Authors to whom correspondence should be addressed.
Appl. Sci. 2023, 13(1), 405; https://doi.org/10.3390/app13010405
Submission received: 14 November 2022 / Revised: 14 December 2022 / Accepted: 22 December 2022 / Published: 28 December 2022
(This article belongs to the Special Issue Environmental Contamination and Human Health)

Abstract

:
Lithium is a chemical element on the cutting edge due to its lithium-ion batteries used in both electronics and electric vehicles. The emerging use of lithium-ion batteries in electric vehicles comes as a promising solution to sustain green transportation. The implications of green transportation could be understood by exploring lithium production and its application concepts. This article expands on those concepts by discussing the lithium supply and how vital lithium is to green technology. Statistical analysis has been applied to determine: (1) The degree of balance and interdependence between lithium raw materials and electric vehicle production, (2) the influence of electric vehicle demand on lithium production, and (3) the contribution of electric vehicles to reducing carbon emissions from road transport. This study provides necessary information on the availability and demand for lithium, which could be the basis for drawing up policies for electric vehicle expansion and lithium supply efficiency.

1. Introduction

As the global population grows, so does travel and transportation demand, resulting in increased fuel consumption. Thus, carbon dioxide (CO2) emissions and other gases such as carbon monoxide (CO) and nitrogen oxide derivatives (NOx) gradually accumulate in the atmosphere. The long-time dependence on fossil fuels has negatively affected the daily lives of human beings. It causes climate change, geopolitical compromise, and unrest [1]. In particular, climate change has become a global matter to deal with. To tackle climate change, governments and non-governmental organizations (NGOs) have signed different treaties. The most known treaties are the Kyoto Protocol, the Paris Agreement, and the UN Sustainable Development Goals [2,3]. All the member states that signed the treaties agreed to reduce carbon emissions by enhancing green and renewable energy technologies. This initiative directly touches on different sectors such as transportation systems, electric power systems, and manufacturing. Transportation systems need to shift from fossil fuel to electric vehicles, and electric power systems need to focus mostly on power storage. In addition to electronics, both the above sectors need lithium batteries, thus skyrocketing the global lithium demand.
The increasing demand for rechargeable equipment and portable electronic devices (mostly laptops and cell phones that showed remarkable human dependence during the COVID-19 pandemic [4]) requires the development of technology that enables energy storage devices to have a high energy and power density [5]. Among them includes batteries [6,7,8] and super-capacitors [9,10,11,12]. Since Alessandro Volta invented the first battery in 1801, the quest for high-performance batteries has continued, and some battery technologies, such as Ni-MH [13,14], Ni-Cd [15], and Li-ion batteries [16,17,18,19], are now in use. Among the most well-known batteries, lithium-ion batteries (LIB) have shown to have the highest energy capacity, ranging from 120 to 200 Wh/kg [20], and they are welcome for various application purposes [21], particularly in electronics and electric vehicles [16,22,23,24,25], which are considered the next generation to reduce CO2 emissions.
Numerous factors are pushing the use of LIB, such as climate change, non-steady prices of fossil fuels, and the increasing geopolitical conflicts linked to fossil fuels. The current emergency of reducing CO2 emissions has made a rush to change from fossil energy-transportation dependence to green transportation, requiring large manufacturing of LIB. Lithium demand has significantly risen in recent years due to its industrial importance in manufacturing LIBs. Their applications were initially focused on electronic devices; however, in the last decade, their focus has shifted to electric vehicles [26]. Up to the present, global transport commonly relies on the fossil resource “petroleum”, whereby more than half of global oil consumption goes to the transport sector [18]. The increasing price of fuel cannot be seen only as a problem for gasoline vehicles, it can also be seen as an advantage for the electric vehicle market. As the fuel price swings, people prefer to shift to electric vehicles.

1.1. Impact of Fossil Fuels on the Climate

According to Gates [27], the mass consumption of fossil fuels is not environmentally friendly and is contributing greatly to the rise in global average temperatures. Gil-Alana and Monge [28] said that CO2 from fossil fuel combustion alone accounts for 70% of total greenhouse gas emissions. It includes oil combustion, coal, peat, and other natural gases that release carbon dioxide into the atmosphere. The increasing number of fuel-consuming vehicles contributes significantly to carbon emissions and air pollution [29]. By taking into account the transport sector, it contributes about 23% of global greenhouse emissions, of which approximately 73% are emitted from road transport [30,31]. If the emissions from all the transport means (i.e., air, water, and road transport) are considered, passenger vehicles (public and private) contribute more than half (Figure 1). According to Gates [27], there is a high risk of continuous global temperature growth if nothing is done to contain CO2 emissions. He also predicted the temperature changes based on the possible circumstances of future carbon emissions. His predictions show that (1) temperature may continue to rise if the CO2 emissions continue to rise; (2) temperature may fall if CO2 emissions slow; and (3) temperature will drop if more CO2 is removed than emitted. These emissions cause a threat to global health, the economy, and social sustainability.
Due to the recent devastating consequences of climate change [32] and the non-steady price of oil, mostly created by geopolitical conflict [17,33], it seems irresponsible to not think about alternatives to fossil fuels. Among the promising alternatives include the use of biofuels, natural gas [33] and LIBs. As it becomes a global goal to reduce carbon emissions [34], almost all countries have developed new policies to reduce greenhouse gas emissions up to zero [30] starting from the transportation sector. However, transitioning to zero emissions requires cracking down on all modes of transportation and reducing their emissions to zero, which will not be an easy task. Even though it has become an emergency to replace fuel vehicles, we cannot ignore the fact that nearly the entire supply chain emits carbon dioxide into the atmosphere. It includes the emissions that occur during the mining activities, oil production process, upgrading and transport to the refinery, manufacturing, etc.
Finding a solution becomes a global responsibility for exploring promising opportunities to shape fossil-fuel-free transportation systems. The technology of this system could shape the future transport systems [16] that should be in agreement with the reduction of CO2 emissions [37]. In the battle to reduce carbon emissions from transport, lithium plays a pillar role to manufacture LIB that are used in the current green transportation technology. The public and governments adopted LIB electric vehicles as the technology with clear performance advantages and high energy storage compared to the other battery types [38].
As electric vehicle demand goes up, so does lithium raw materials (LRM) demand. The rise in lithium demand may require additional knowledge of lithium to be attached. The knowledge of the currently available lithium production, resources, reserves, growth rate of demand, and future supply is eminent. For this reason, the article focuses on the properties of lithium mineral production and examines how important lithium is in terms of green transportation technology. It is done by looking at the connection between LRM (lithium production), the demand for electric vehicles, and other factors that are important for green transportation. The authors assume that the increase in EVs, leading to an increase in lithium production, contributes to the reduction of CO2 emissions from road transportation. This article is an associated output of the project “SMART technologies to improve the quality of life in cities and regions”, which aims to improve urban life by means of modern technologies and the use of SMART methods.

1.2. Lithium Properties and General Applications

Lithium is the lightest metal and the least dense solid element. It is a soft silver-white metal classified in the alkali group of the periodic table of elements. It is as highly reactive and flammable as other alkali elements. Those properties make lithium only exist in nature as compounds (ionic form), mostly in the form of carbonates. Because of such physical and chemical properties, industries usually use lithium carbonate in various industrial, technical, medical, and other applications [28]. It is traded in two main compounds, which are Li2CO3 and LiOH [39,40], and both compounds make up the largest part of lithium available on the market. According to Jaskula [41], lithium global end-use markets are divided into seven applications, including batteries, with a large share of 74%, followed by ceramics and glass with 14%, and others (Figure 2). Its applications in manufacturing lithium-ion batteries have undergone a tremendous increase from 23% in 2010 [42] to 74% of total traded lithium in 2021 [41]. Price gradually increased following the adoption of electric vehicles; for example, the average price of lithium carbonate increased from around USD 5000 in 2010 [43] to USD 17,000 per ton in 2021 [41].

1.3. Properties of Lithium towards Lithium-Ion Battery

Lithium, like other metals, oxidizes in the air to form Li2O, Li3N, Li2CO3, and LiOH. Among them, Li2CO3 is the favorable product of weathering lithium metal. However, the oxidation rate remains relatively low, resulting in the inefficiency of the process [44]. Not only does the air influence the oxidation of lithium, but also other parameters such as humidity, the atmosphere composition, duration of exposition to the air, temperature, and thickness of lithium-sheets are involved [45]. The study by Kahl et al. [44] revealed that it requires two days to complete the oxidation of 1 mm of lithium-sheet thickness at constant ambient temperature. The oxidation speed and efficiency can be accelerated by higher temperatures [19]. Those properties of resisting oxidation in ambient conditions make lithium a selective element to be used as an anode for batteries. However, once the reaction is accelerated by a high temperature, lithium creates a high affinity with oxygen and nitrogen. Even efficient or fast oxidation is successful at higher temperatures [44,45], resulting in the non-recycling of lithium-anode production residues. Table 1 lists the types of LIB based on the applications.

1.4. Lithium in Electric Vehicles

Lithium was first used in batteries in the 1970s [47], and it has since been used in a wide variety of applications. Those batteries are categorized as: (1) Primary batteries that are single-discharge. They have high charge density, light, and long life. However, their high cost per unit is still a burden to the consumers; (2) secondary batteries that are rechargeable. These rechargeable batteries are those used in electric vehicles, which are in high demand, necessitating a large amount of lithium production.
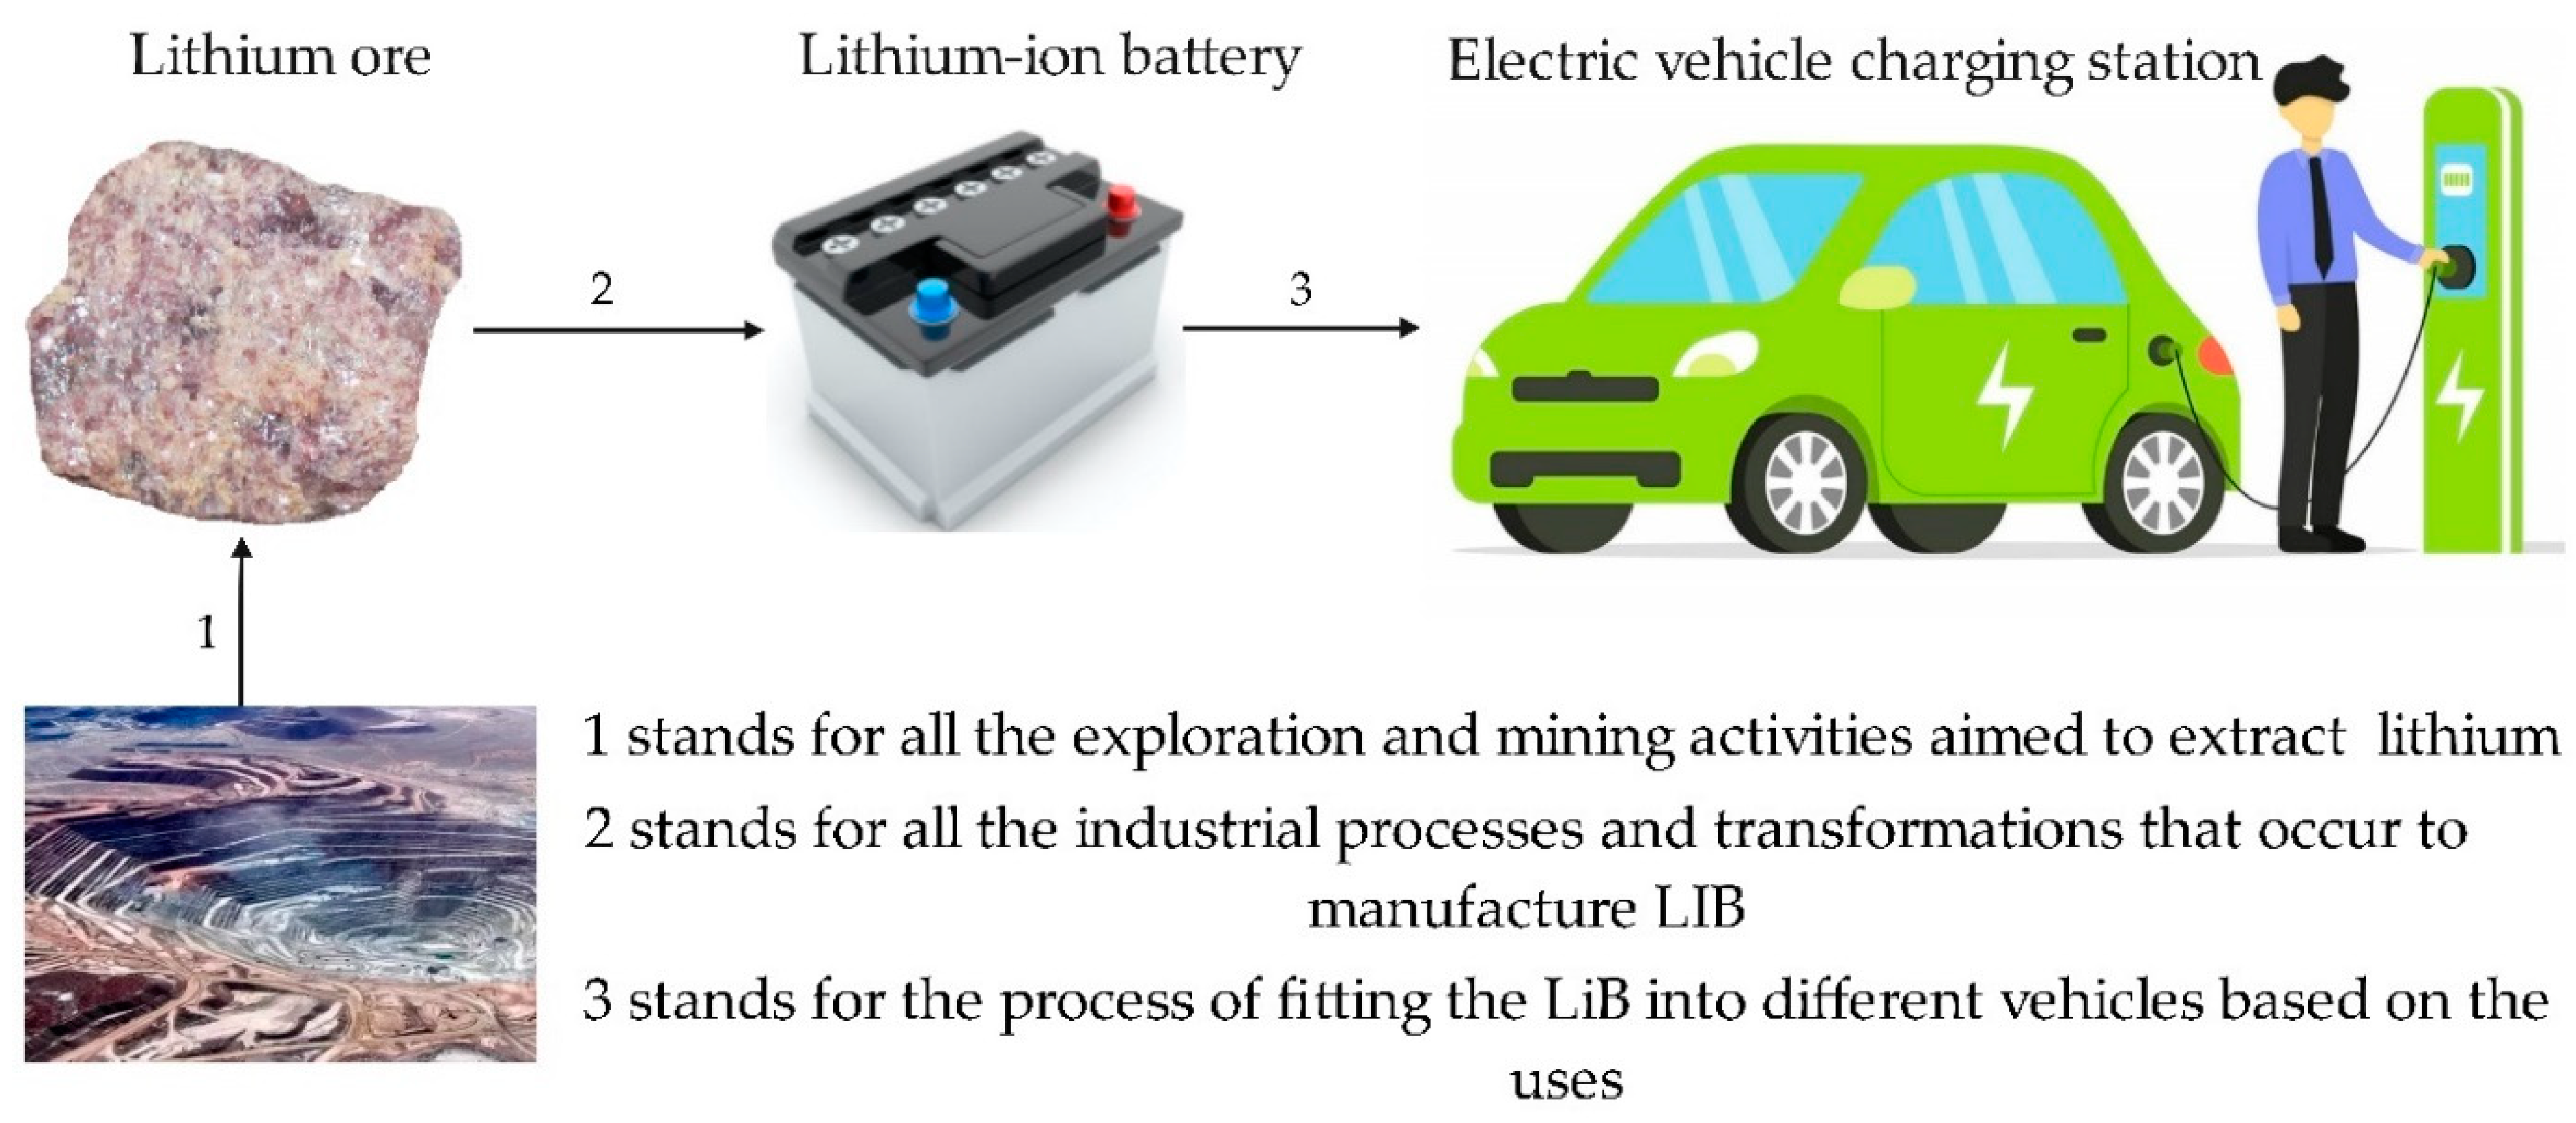
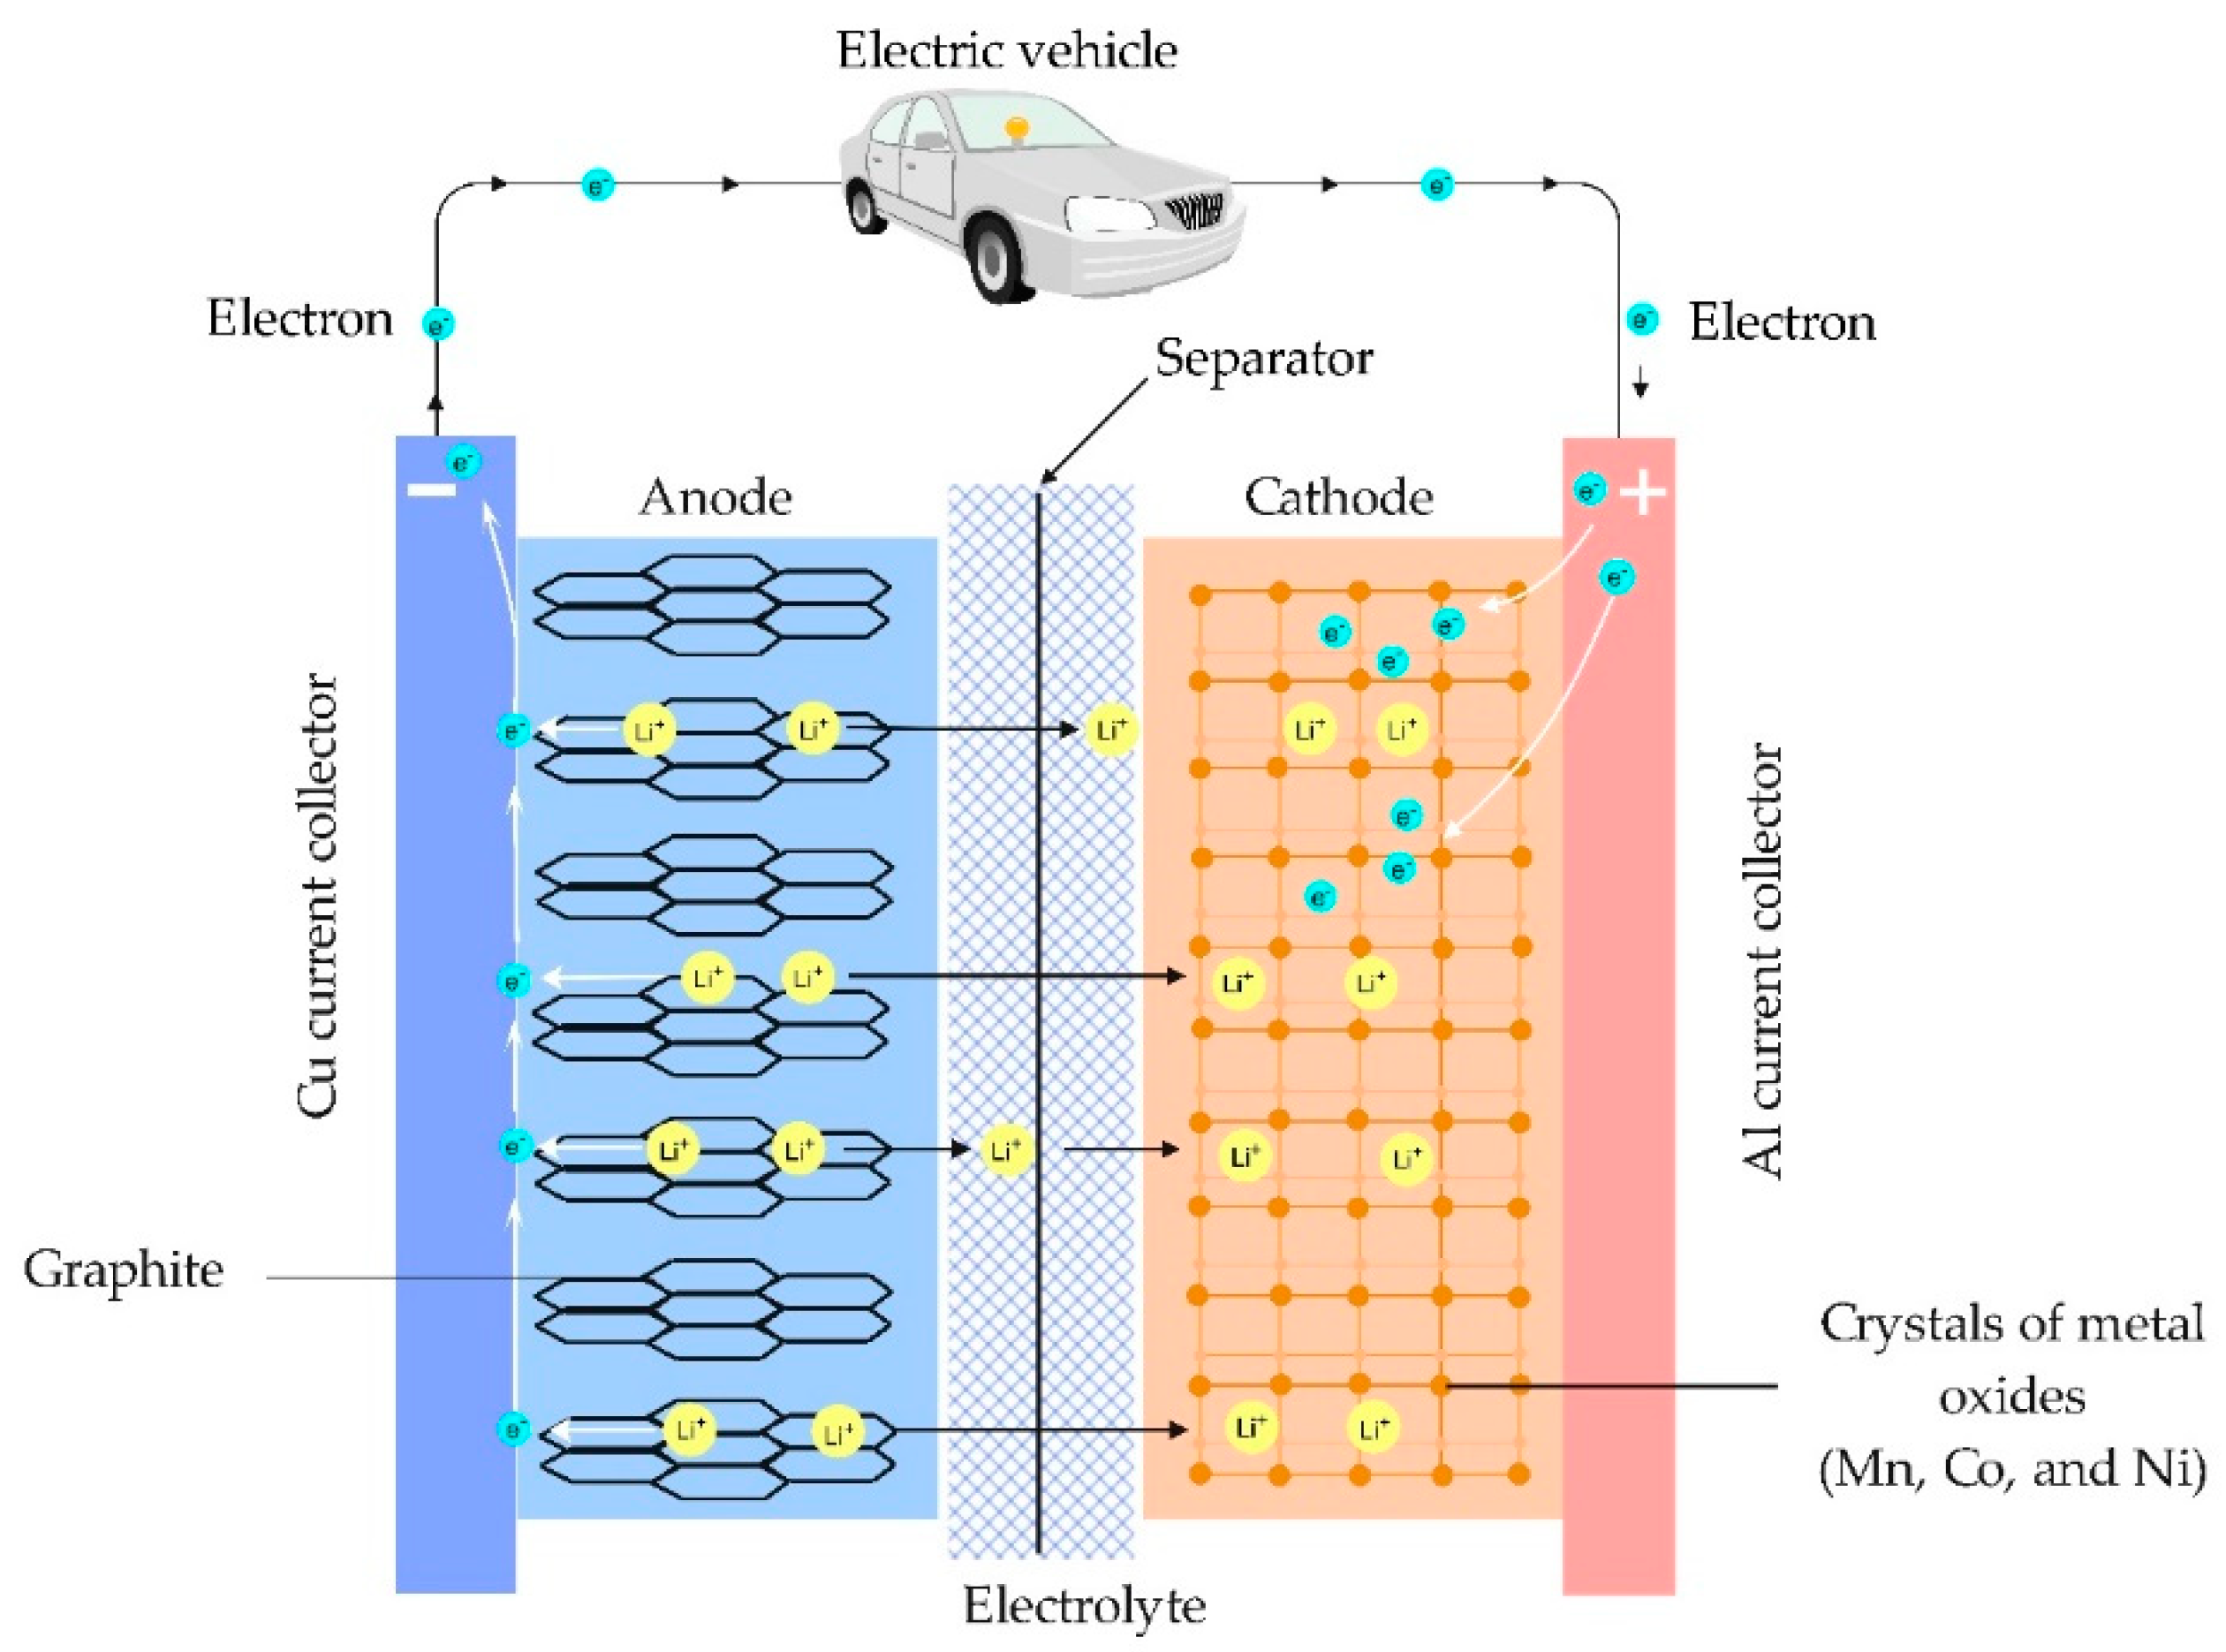
Electric vehicles are defined as vehicles powered by an onboard battery that can be charged from an external source of electricity. It includes plug-in hybrid electric vehicles (PHEVs) and battery electric vehicles (BEVs) [48]. Electric vehicles are often referred to as “plug-in electric vehicles” (PEVs). Since climate change has become a global concern, carbon emissions has been identified as one of the biggest contributors to global warming. The electric vehicles have become a major project introduced to reduce carbon emitted from road transportation. In this process, lithium plays a significant role in making batteries capable of saving electric power (Figure 3).
Currently, there are three types of electric vehicles (Table 2) that use lithium-ion batteries, and they are classified based on their technology and the type of connection to the power grid.

1.5. Lithium Sources

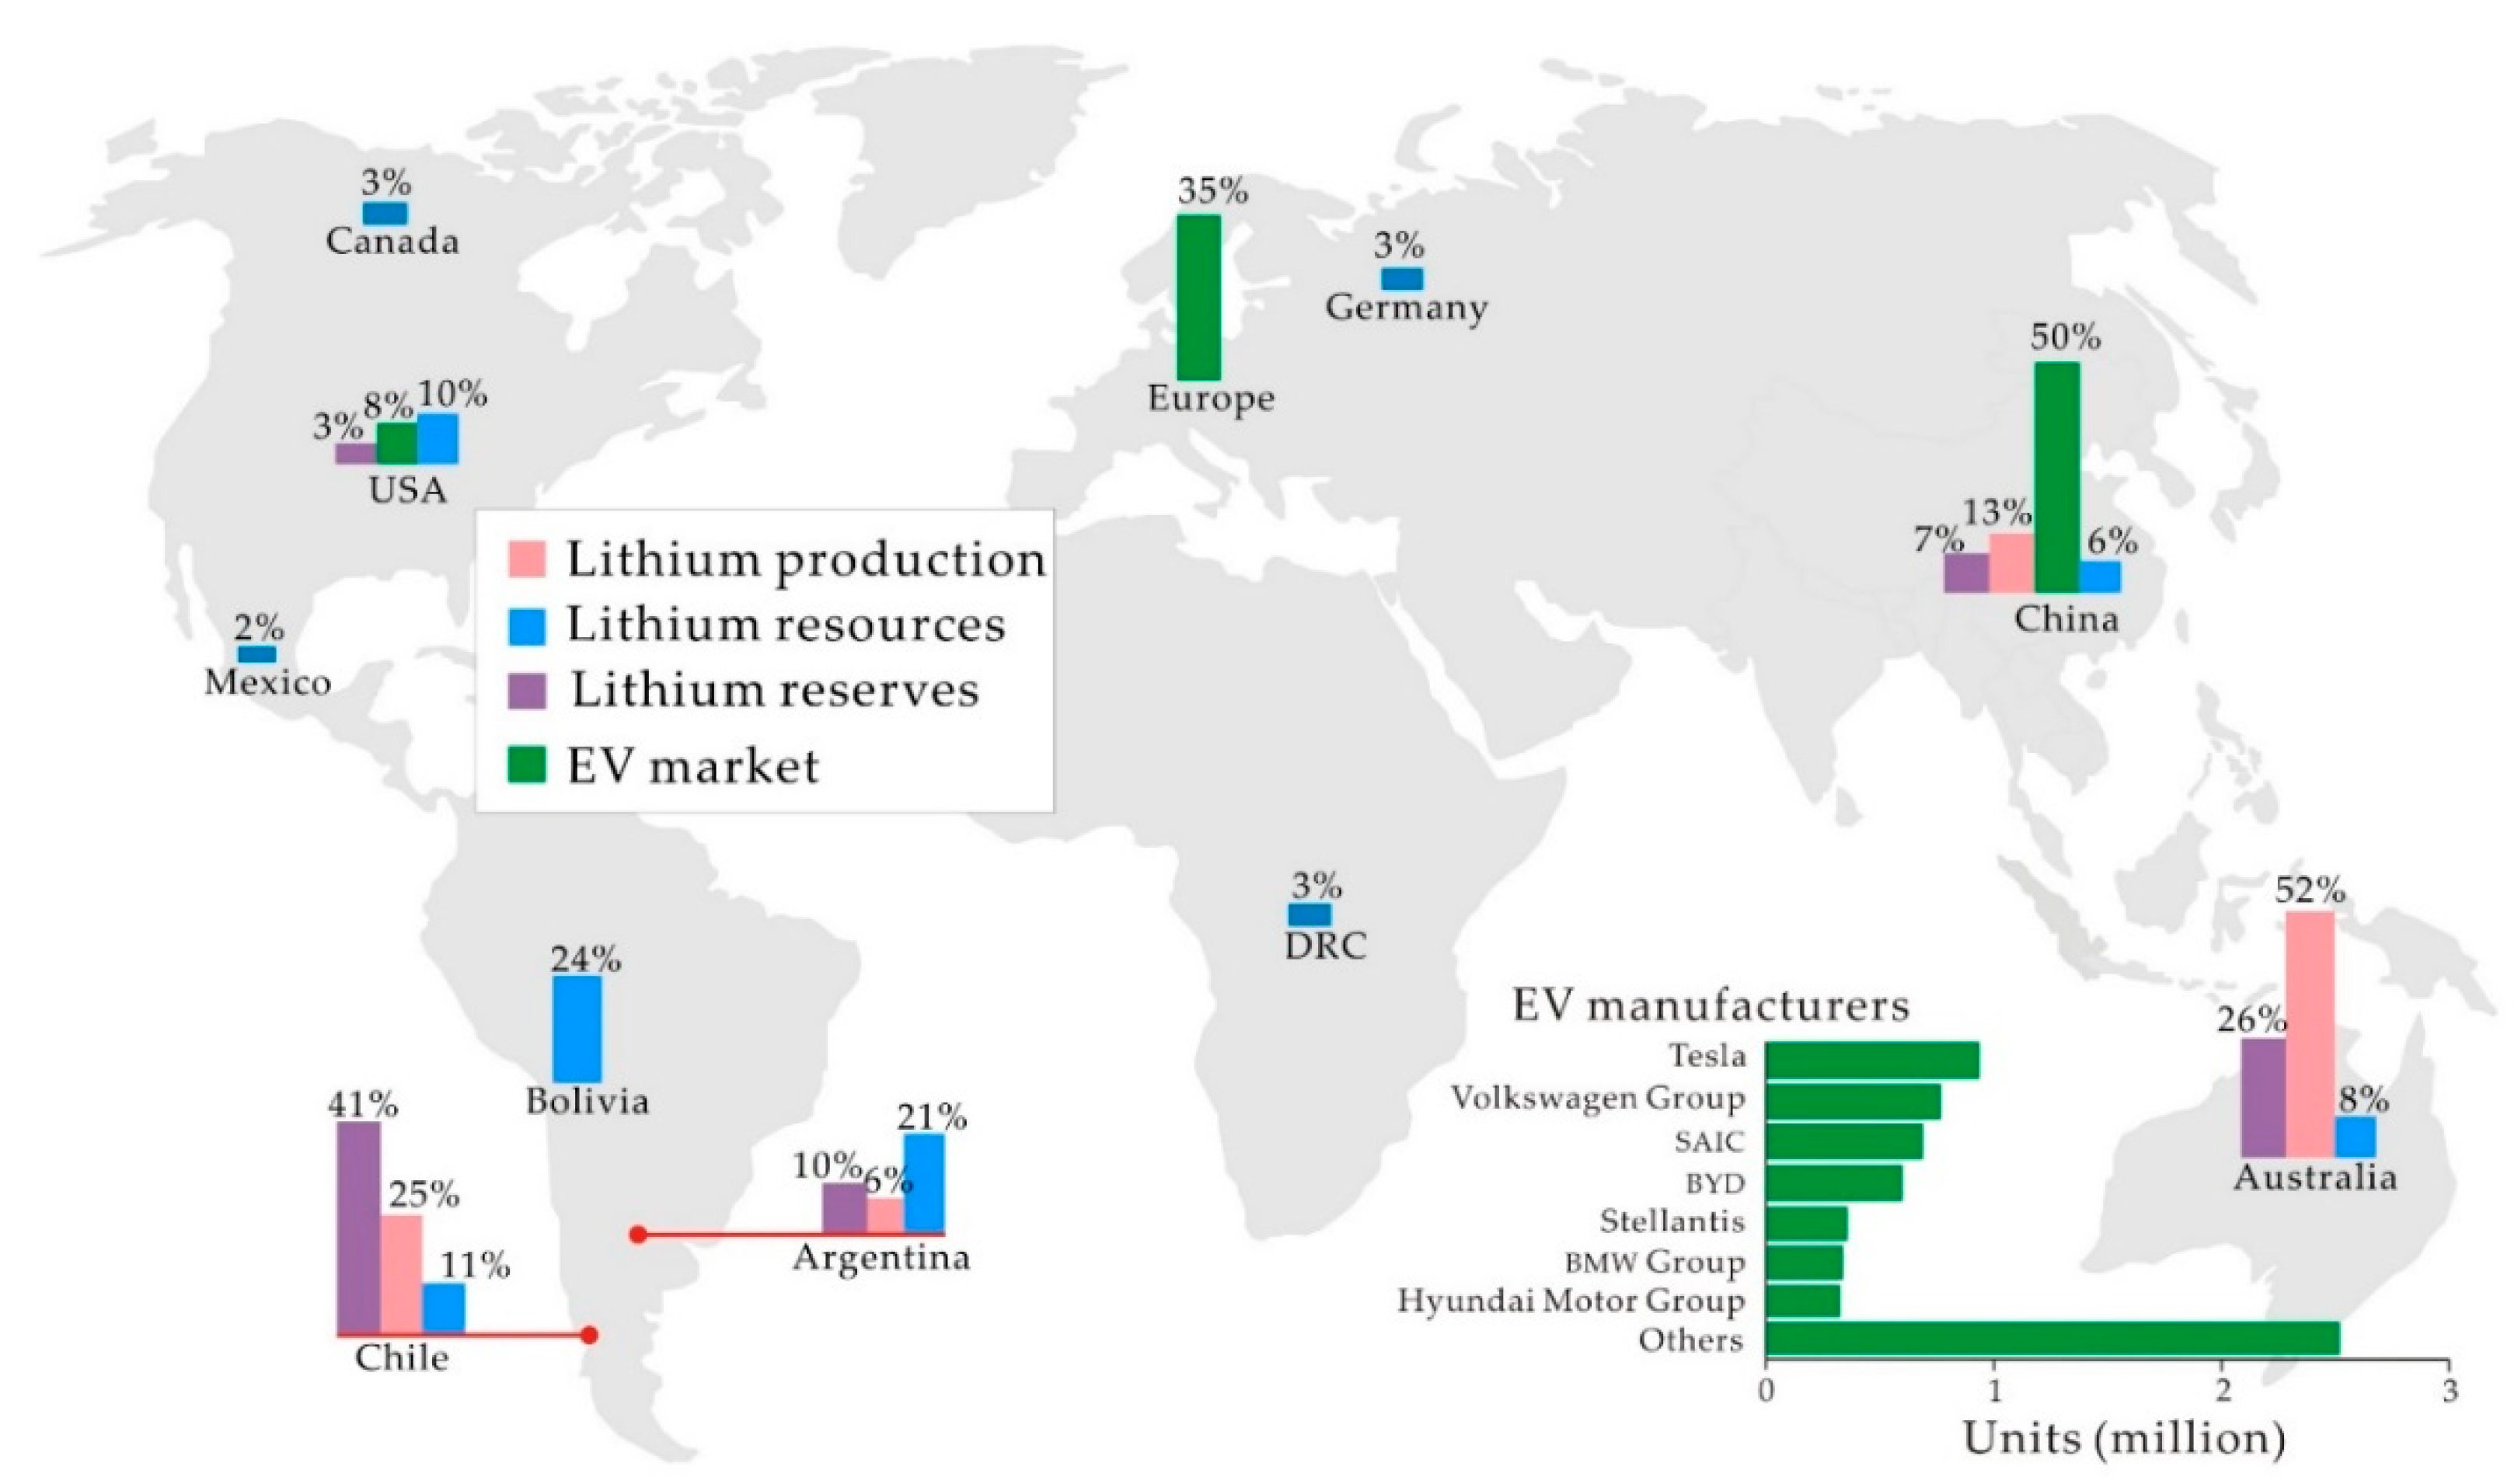
The major sources of lithium are contained in three main deposit types: pegmatites, continental brines, and hydrothermally altered clays [49]. Chile contains 41% of global reserves and is located within brine lake and salt crust deposits (sometimes called salars) [50,51]. Due to numerous faults and volcanic eruptions presented in the Chile region [49], it estimates to have a huge reserve of up to 120 thousand square kilometers [51]. Brines with a lithium high concentration of about 0.3% are found in the Salars of Chile, Bolivia, and Argentina, while lower concentrations are found in the United States (such as Kings Mountain Belt, Smackover, Salton Sea, Great Salt Lake, etc.) [52] and the Tibetan Plateau [26,53]. Pegmatites formed as a result of the crystallization of magma at depth in the crust and have considerable lithium deposits, like in Australia [52]. It can also be recovered from clays [54,55] in various ratios using techniques described in Talens Peiró et al. [26], and seawater [54,55] using an adsorption technique [56] and other techniques described in [26,56]. However, the recovered lithium concentration in seawater is relatively small at 0.17ppm compared to that of salars between 1000–3000 ppm [26].
Many sources report different reserve estimates. The assumption of different studies estimates a range of 4–30 million tons [54,57]. The highest estimate was in 2011 when they estimated 39 million tons [54], but the most recent data of 2022 estimated a rounded number of 22 million tons [41]. This difference in estimation is due to the feasible assumption of lithium recovery that is different from one researcher to another. Kunasz [58] doubted the estimation method by saying that some of the calculation methods used are overvalued due to the use of hard rock deposit guidelines in estimating brine resources. He argued that resources may turn into reserves following the advancement of extraction and production technology. Based on the three main types of lithium deposits (pegmatite and spodumene, mineralized springs, and salar sediments) with a grade range of between 1% and 2.31%, there is an estimated 1.27 million tons of Li2O. All these deposits are available in Afghanistan and can probably make Afghanistan the global lithium mining hub [26]. Countries with reserves and their mineral deposits are listed in Table 3.

2. Data and Methods

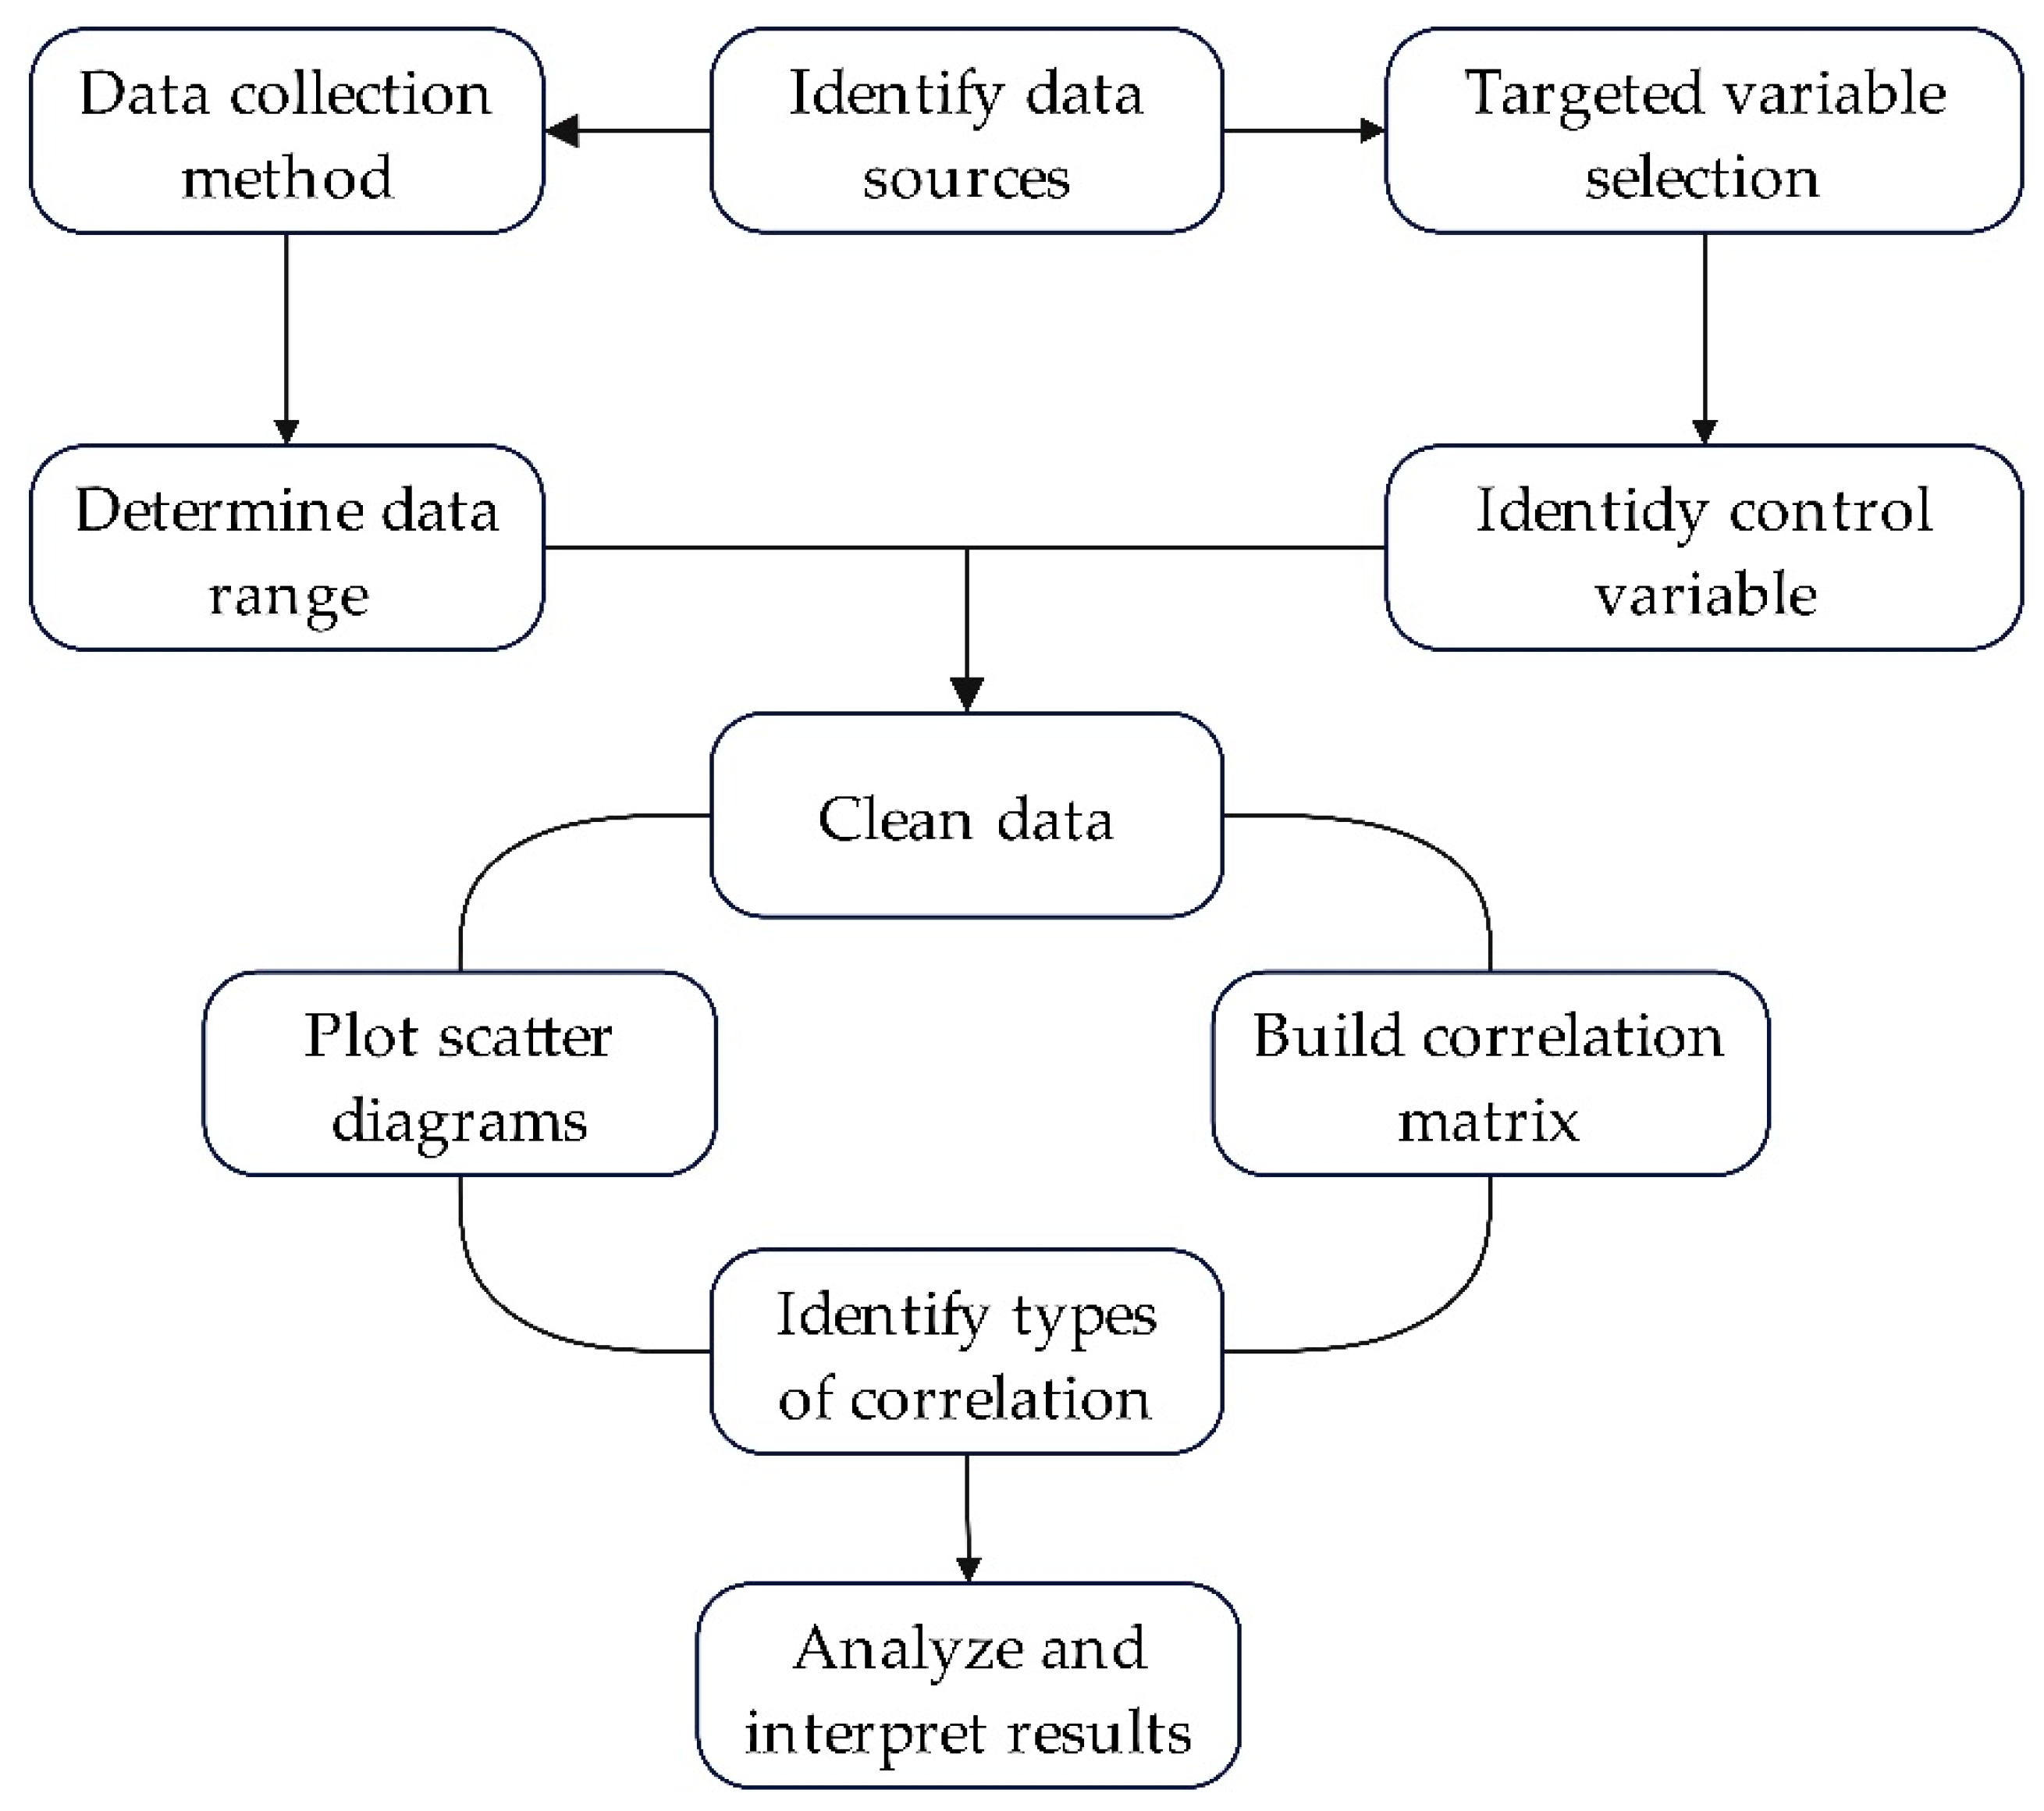
This research was carried out in a methodical manner using quantitative research theories as a guide. It was necessary to construct a research design (Figure 4) that outlines the complete process of the study in order to make sure that the data collection and analysis go as smoothly as possible.
The study follows the correlation research guidelines to establish a relationship between LRM, EVs, and CO2 emissions from road transportation. The influence of EVs on LRM production has also been investigated. Moreover, the other parameters involved in the green transportation cycle have also been observed. Archival data, one of the correlational research methods, has been used to collect data. This method helps track the statistical patterns of the above-said variables. The data collected spanned a decade (since 2010), which was chosen based on the time span of the EVs’ significance increase.
Sets of data have been collected from different sources, including public sources and specialized institutions, and published articles. The US Geological Survey (USGS) conducts research and publishes annual reports on global mineral commodities. Its reports have been used to sort data on lithium resources, production, and reserves [59]. Many studies of lithium minerals have previously been conducted [18,26,39,40,46,60,61,62] and their important data for this study were collected and reviewed. The carbon emissions and global temperature-related data have been collected from public institutions’ websites [63,64] and in various research articles like [27,30,65,66,67]. Canalys [68], IEA, and other publications provide data that helps to obtain an understanding of LIB manufacturing, consumption, and electric vehicles [29,69,70,71,72].
Statistical analysis has been conducted to examine and verify the hypothesis. For instance, Pearson correlation analysis was applied to identify the interdependence between lithium and electric vehicles, which in turn determines the degree of green transport. The correlation coefficient Equation (1) that fits the entire value of a variable between −1 and 1 has been used to measure the strength of the relationship between lithium production and EV sales and other related factors.
r = ( x i x ¯ ) ( y i y ¯ ) x i x ¯ 2 y i y ¯ 2
where r stands for correlation coefficient, x i stands for the values of the x-variable in a sample, x ¯ represents the mean of the x-variable, y i stands for the values of the y-variable in a sample, and y ¯ stands for the mean of the y-variable.
According to the characteristics of green transport cycle parameters, EV was identified as a control factor that may influence the behavior of other variables. To investigate its influence on lithium production, an algorithm (Algorithm 1) has been applied. It is seen that the timing and manufacturing of EVs are influenced externally by different factors, including EV market demand and the availability of EV stocks. That market demand seems to be the trigger for the entire process. The algorithm has been used to demonstrate how EV demand initiates and dictates the entire system of EV manufacturing and the raw material supply chain. Number of EV demand was taken as input of the algorithm to run.
Algorithm 1. Global impact of electric vehicle market demand on lithium production
Let n be the number of EV in EV stock and C be the threshold value for allowed CO2
Input:n, EV market demand
Output: Correlation between EV sales, EV stock, LIB production, CO2, CS and LRM
1Initialization of variables: assign n to EV stock
2Procedure(EV market demand)
3 EV market demand → EV sales //
4 EV sales → EV stock
5 while (Li resources! = Ø)do:
6 for eachyeardo:
7 measure CO2
8 check n in EV stock
9 if n ≤ minimumANDCO2 < Cdo:
10 extractLRM
11 produceLIB
12 ifEV demand > EV stockdo:
13 increase charging stations
14 end if
15 end if
16 end for
17 end while
18End procedure

3. Results

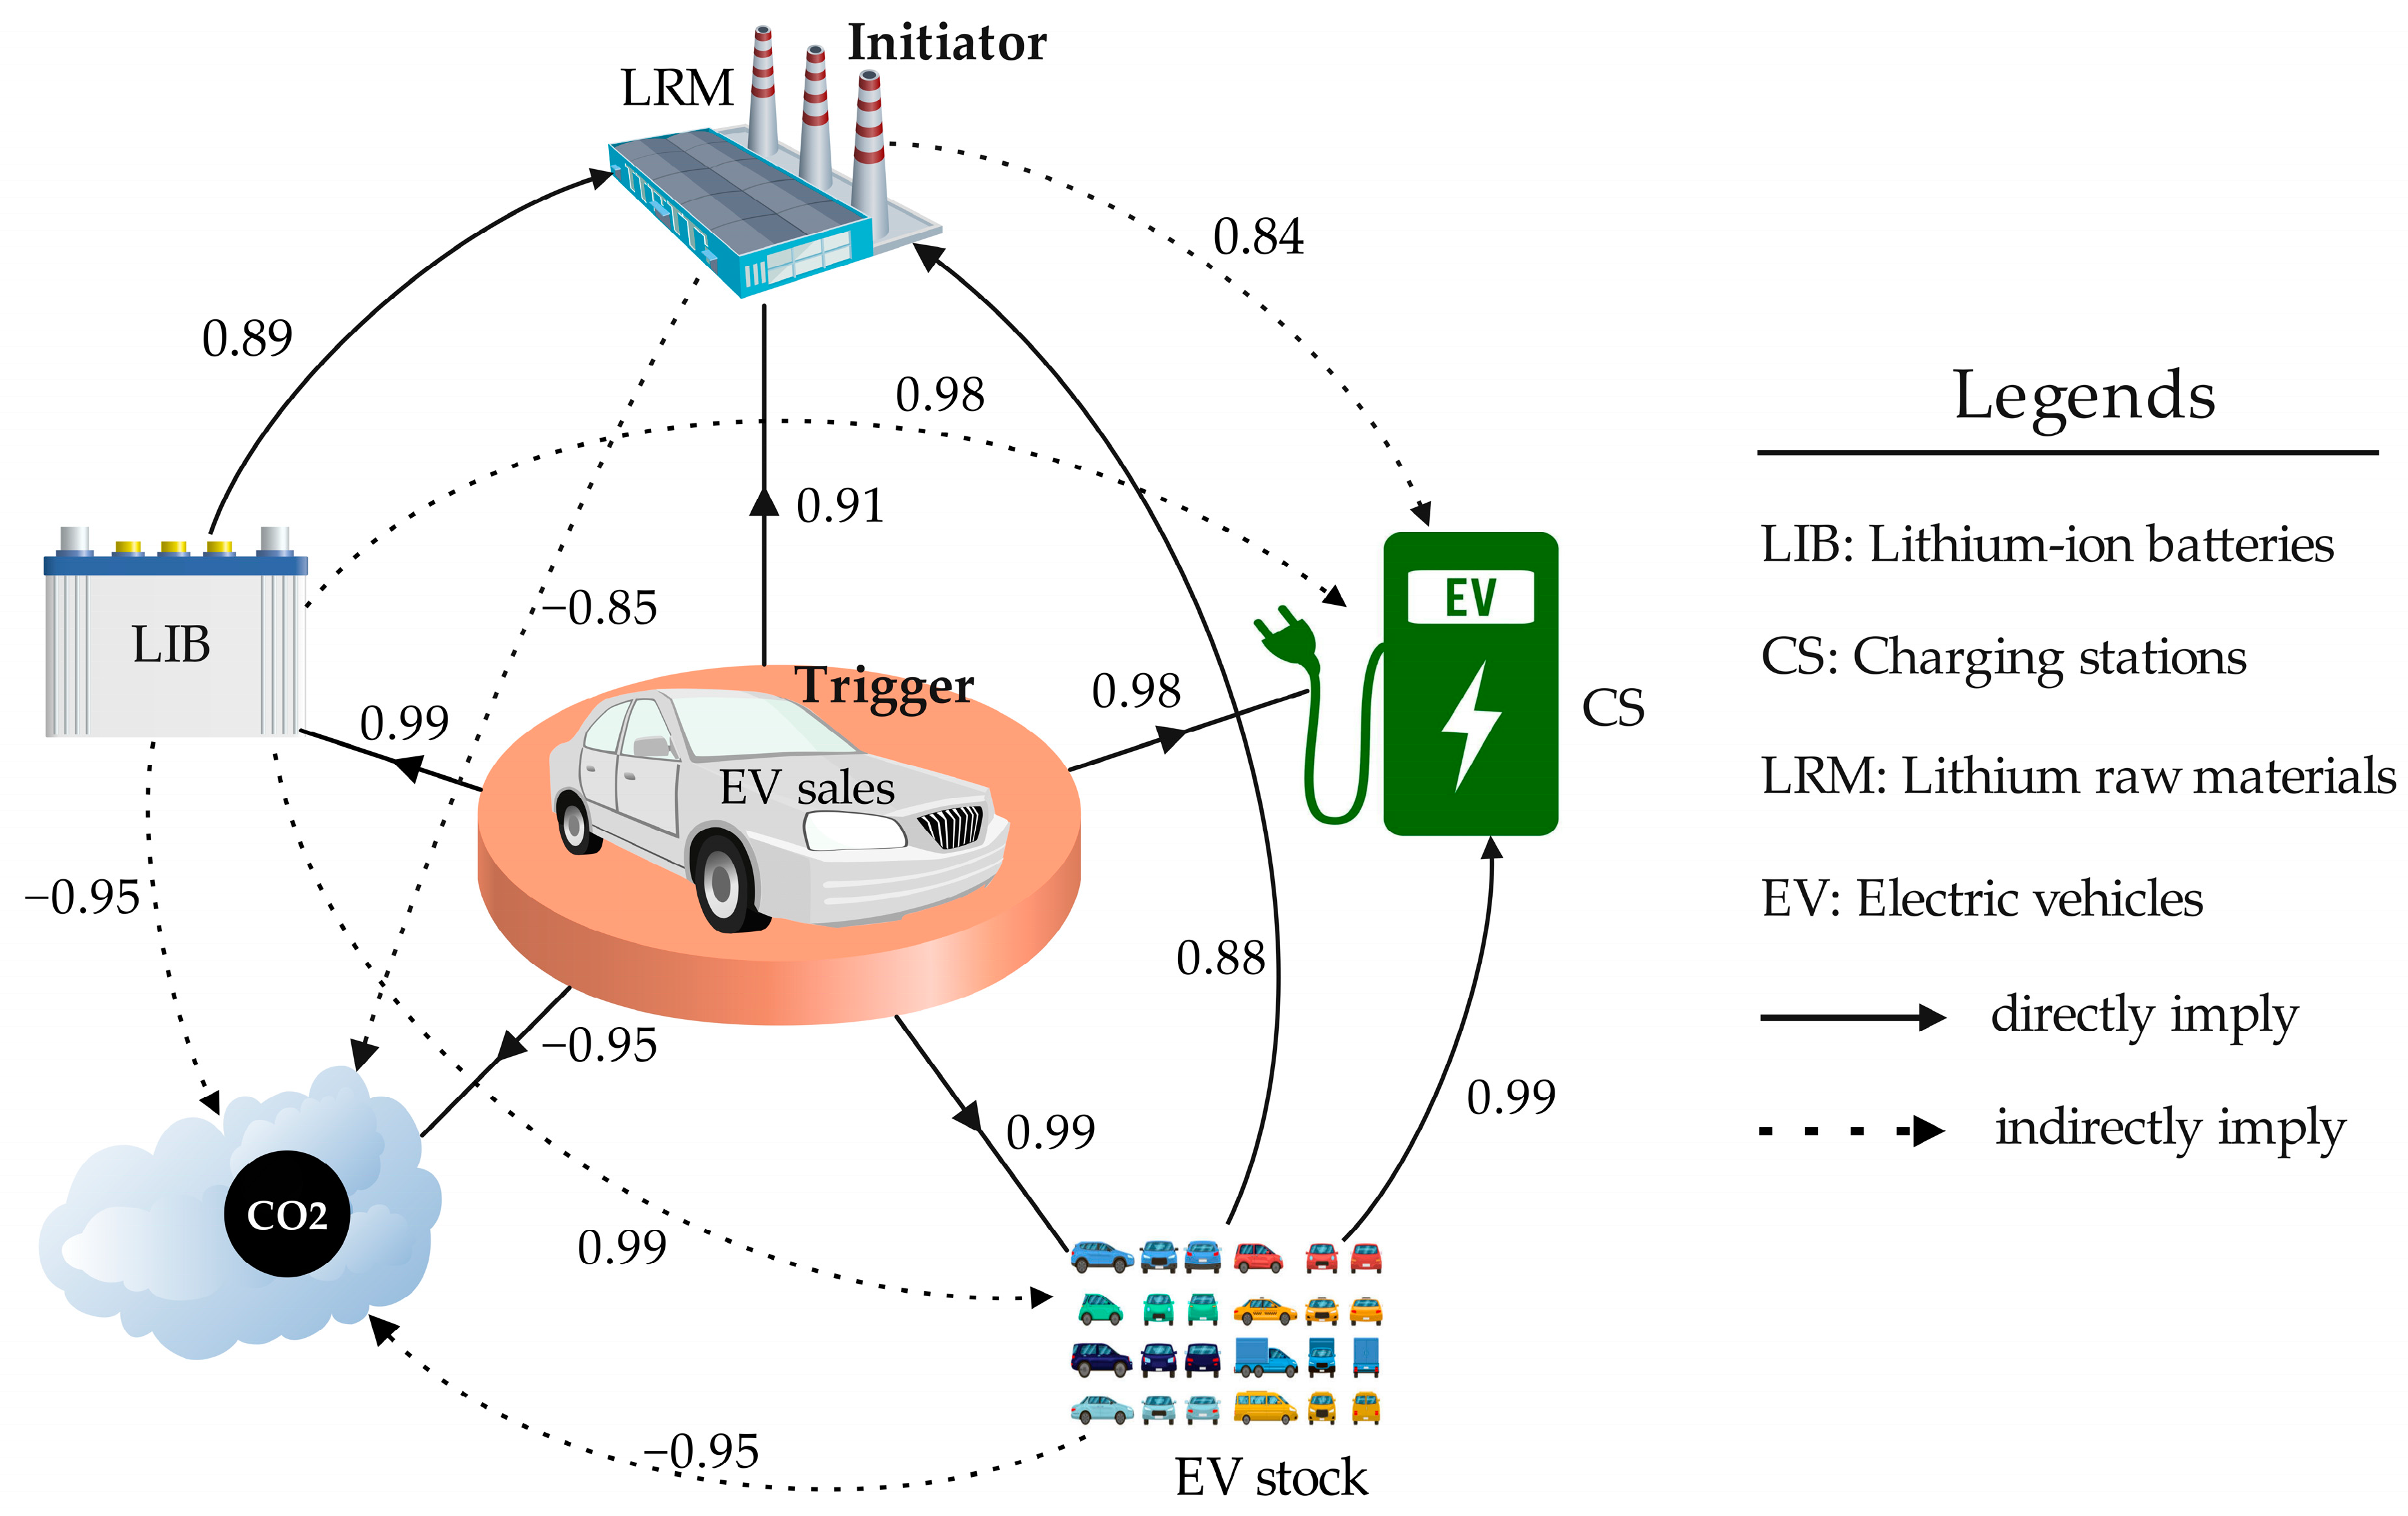
After conducting the statistical analysis on the variables, the correlation matrix that shows the core relationship between them was produced in Table 4. Both the results of the above algorithm and correlation coefficients have used to construct Figure 5. Here, the data used in algorithm and correlation coefficient calculation were collected from different sources, including EV charging stations (slow and fast chargers) [73], global EV sales [74], global electric vehicle stock and market share [75], and CO2 emissions [76].
Here, all six (6) variables involved in the cycle, which are LIB, CS, LRM, EV sales, EV stock, and CO2 emissions from road transport, have been examined. Apart from the EV sales factor, which is considered the skeleton of the entire system, some other factors have either direct or indirect influence on others. In Figure 5, black line arrows that show direct influence and dash line arrows that show indirect influence were used to briefly explain the influential relationship between variables. Considering the arrows of “direct or indirect implication” in Figure 5, it shows that EV sales have a direct influence on the other variables. The quantity of LRM supply depends on the market demand for EVs, leading to the proportionality of the LIB required to respond on the EV demand. The quantity of EV demand and LIB necessary to the market eventually determine how much quantity of lithium needed. Once the necessary LRM are produced, the manufacturing system starts. Hence, the EV demand or EV sales are considered as a trigger that sends signals to the lithium production field, and the availability of lithium determines the initiation of the manufacturing operation. Thus, the lithium raw materials is referred to as system initiator.
CO2 emissions variable is the universal recipient of other variables’ influences, and all of them implicate indirect influence on it except EV sales. Regardless, the direct or indirect influence, correlation coefficients between them remain high. Correlation coefficients determine the degree of interdependence between variables. The higher the correlation coefficient between them is, the higher the interdependence within the system.
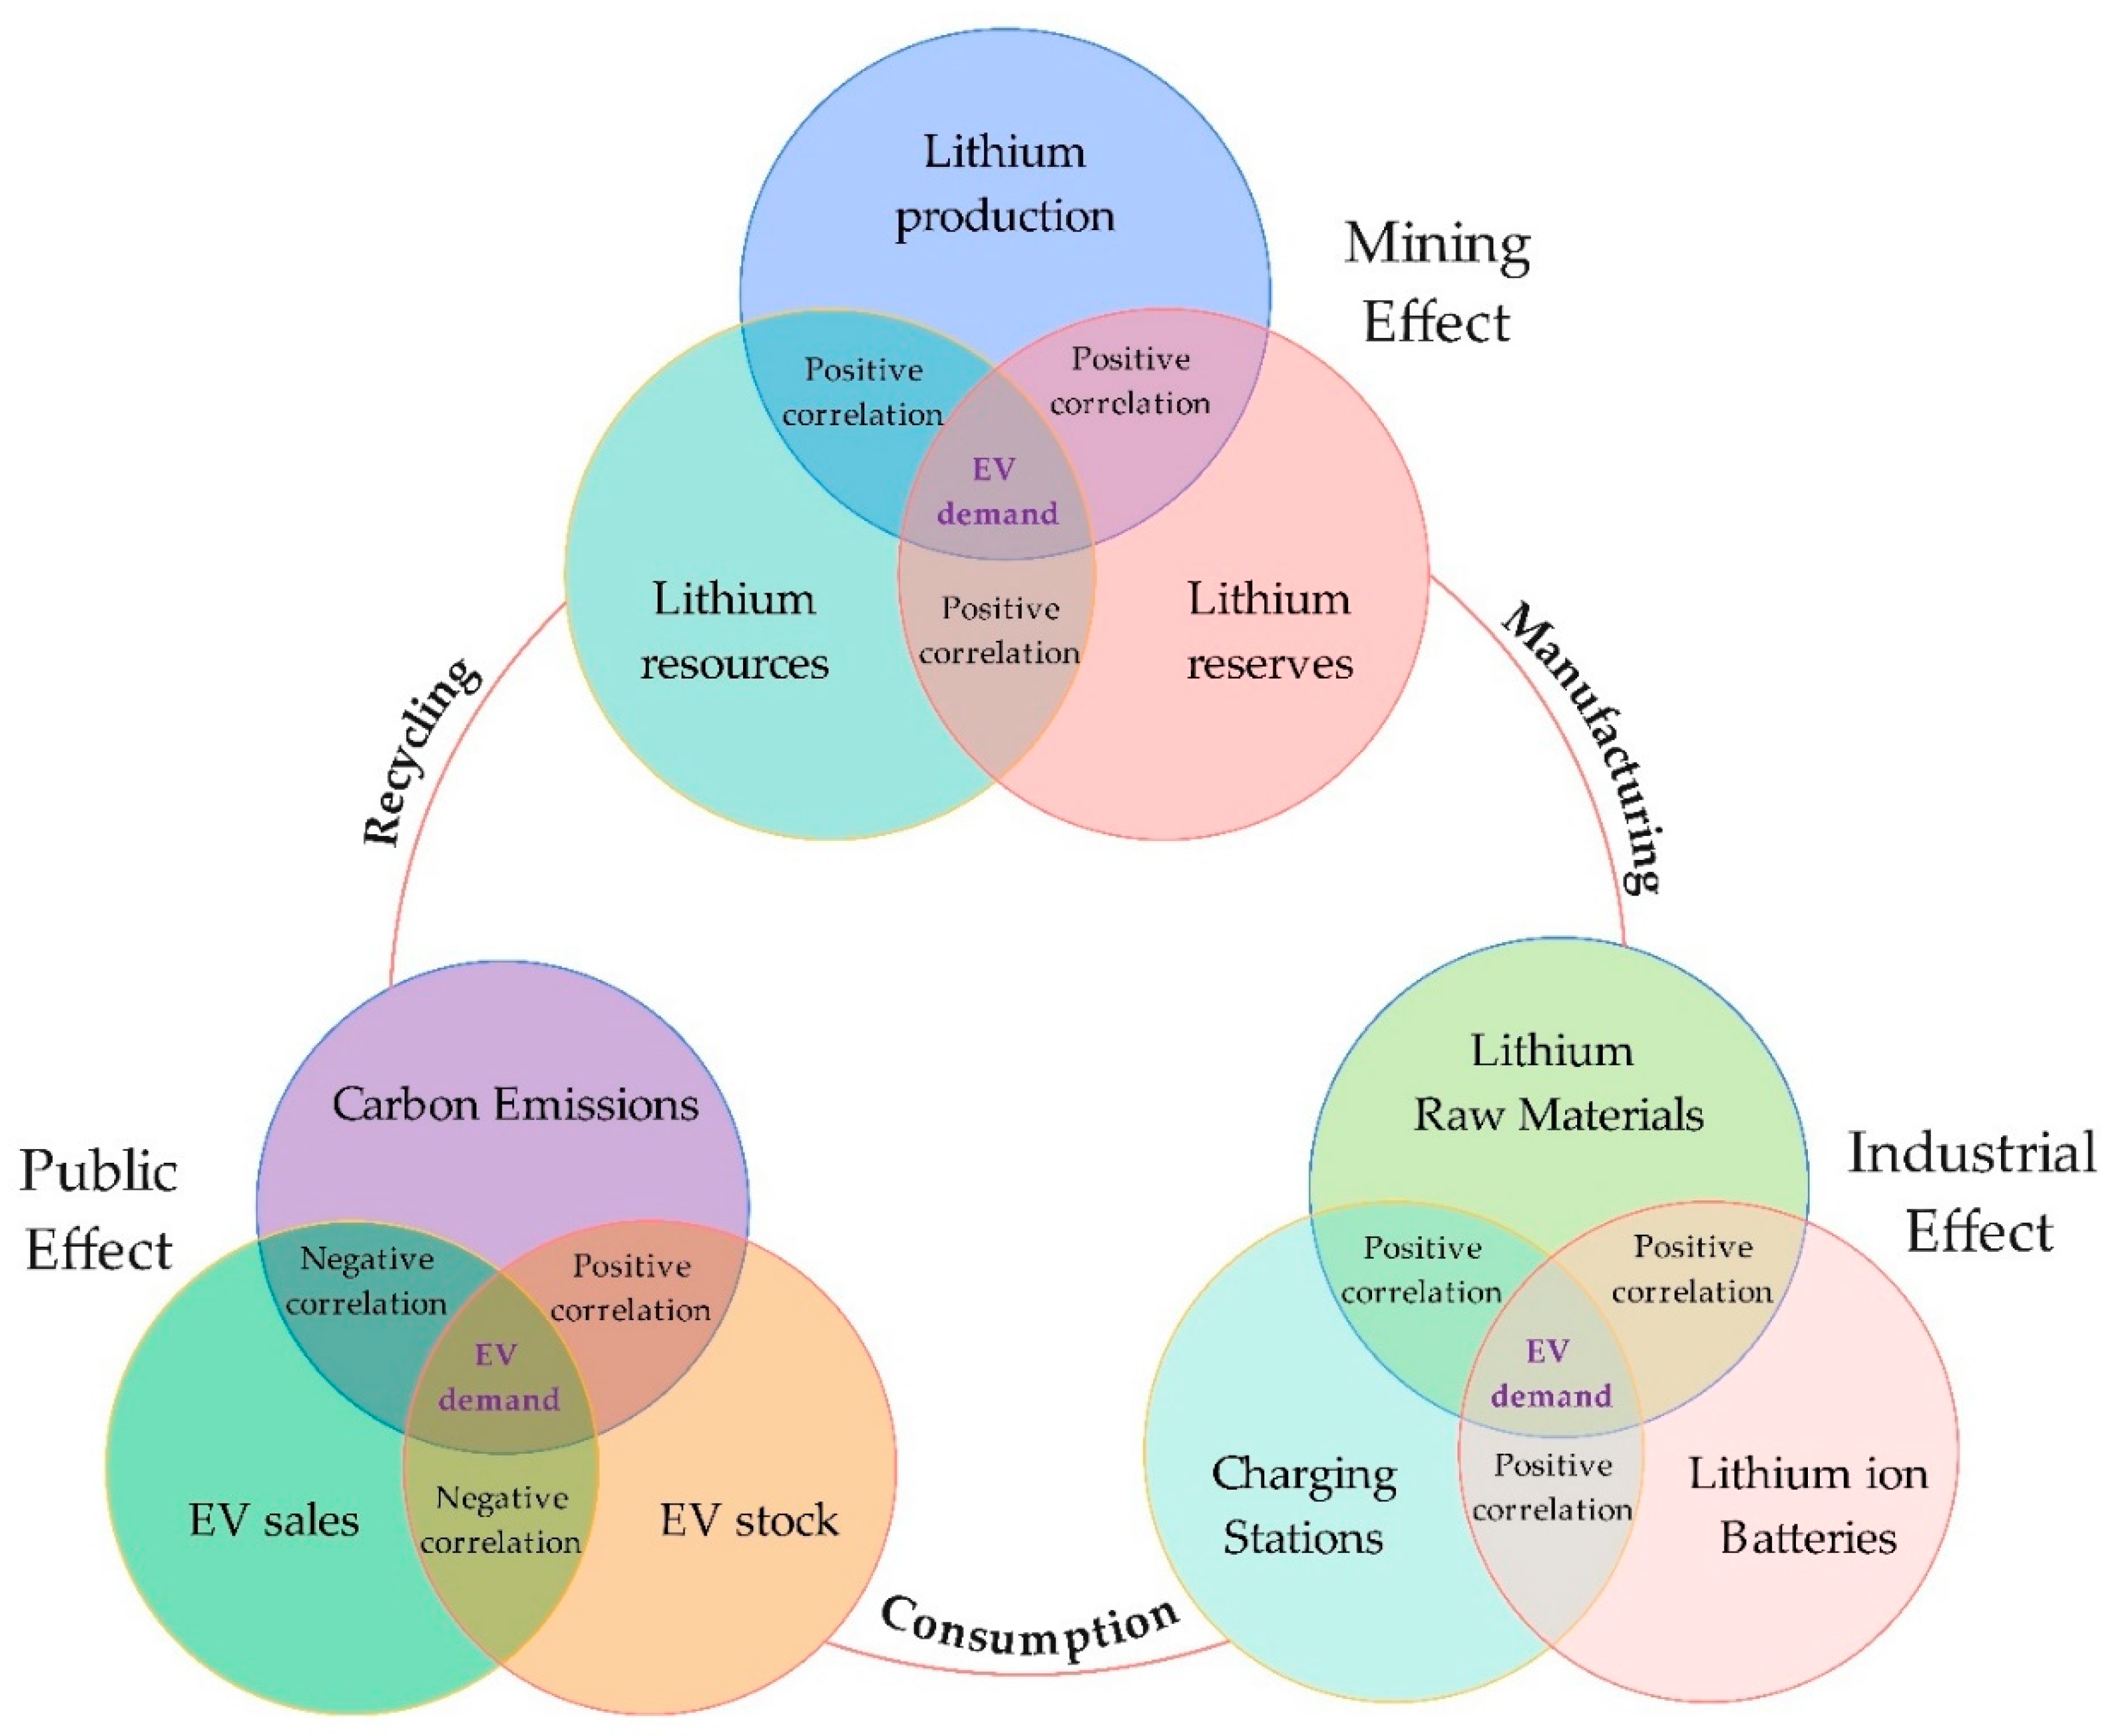
The increasing electric vehicles demand is remotely controlling the lithium supply chain from mining sites. The assessment of impact of the increasing electric vehicle demand for lithium has been evaluated based on three intercorrelated groups (Figure 6). These groups were formed based on the production environment and the correlation between them. The variables with the same environment of production or same effect are more correlated, and they are placed into the same group.

3.1. First Group: “Mining Effect”

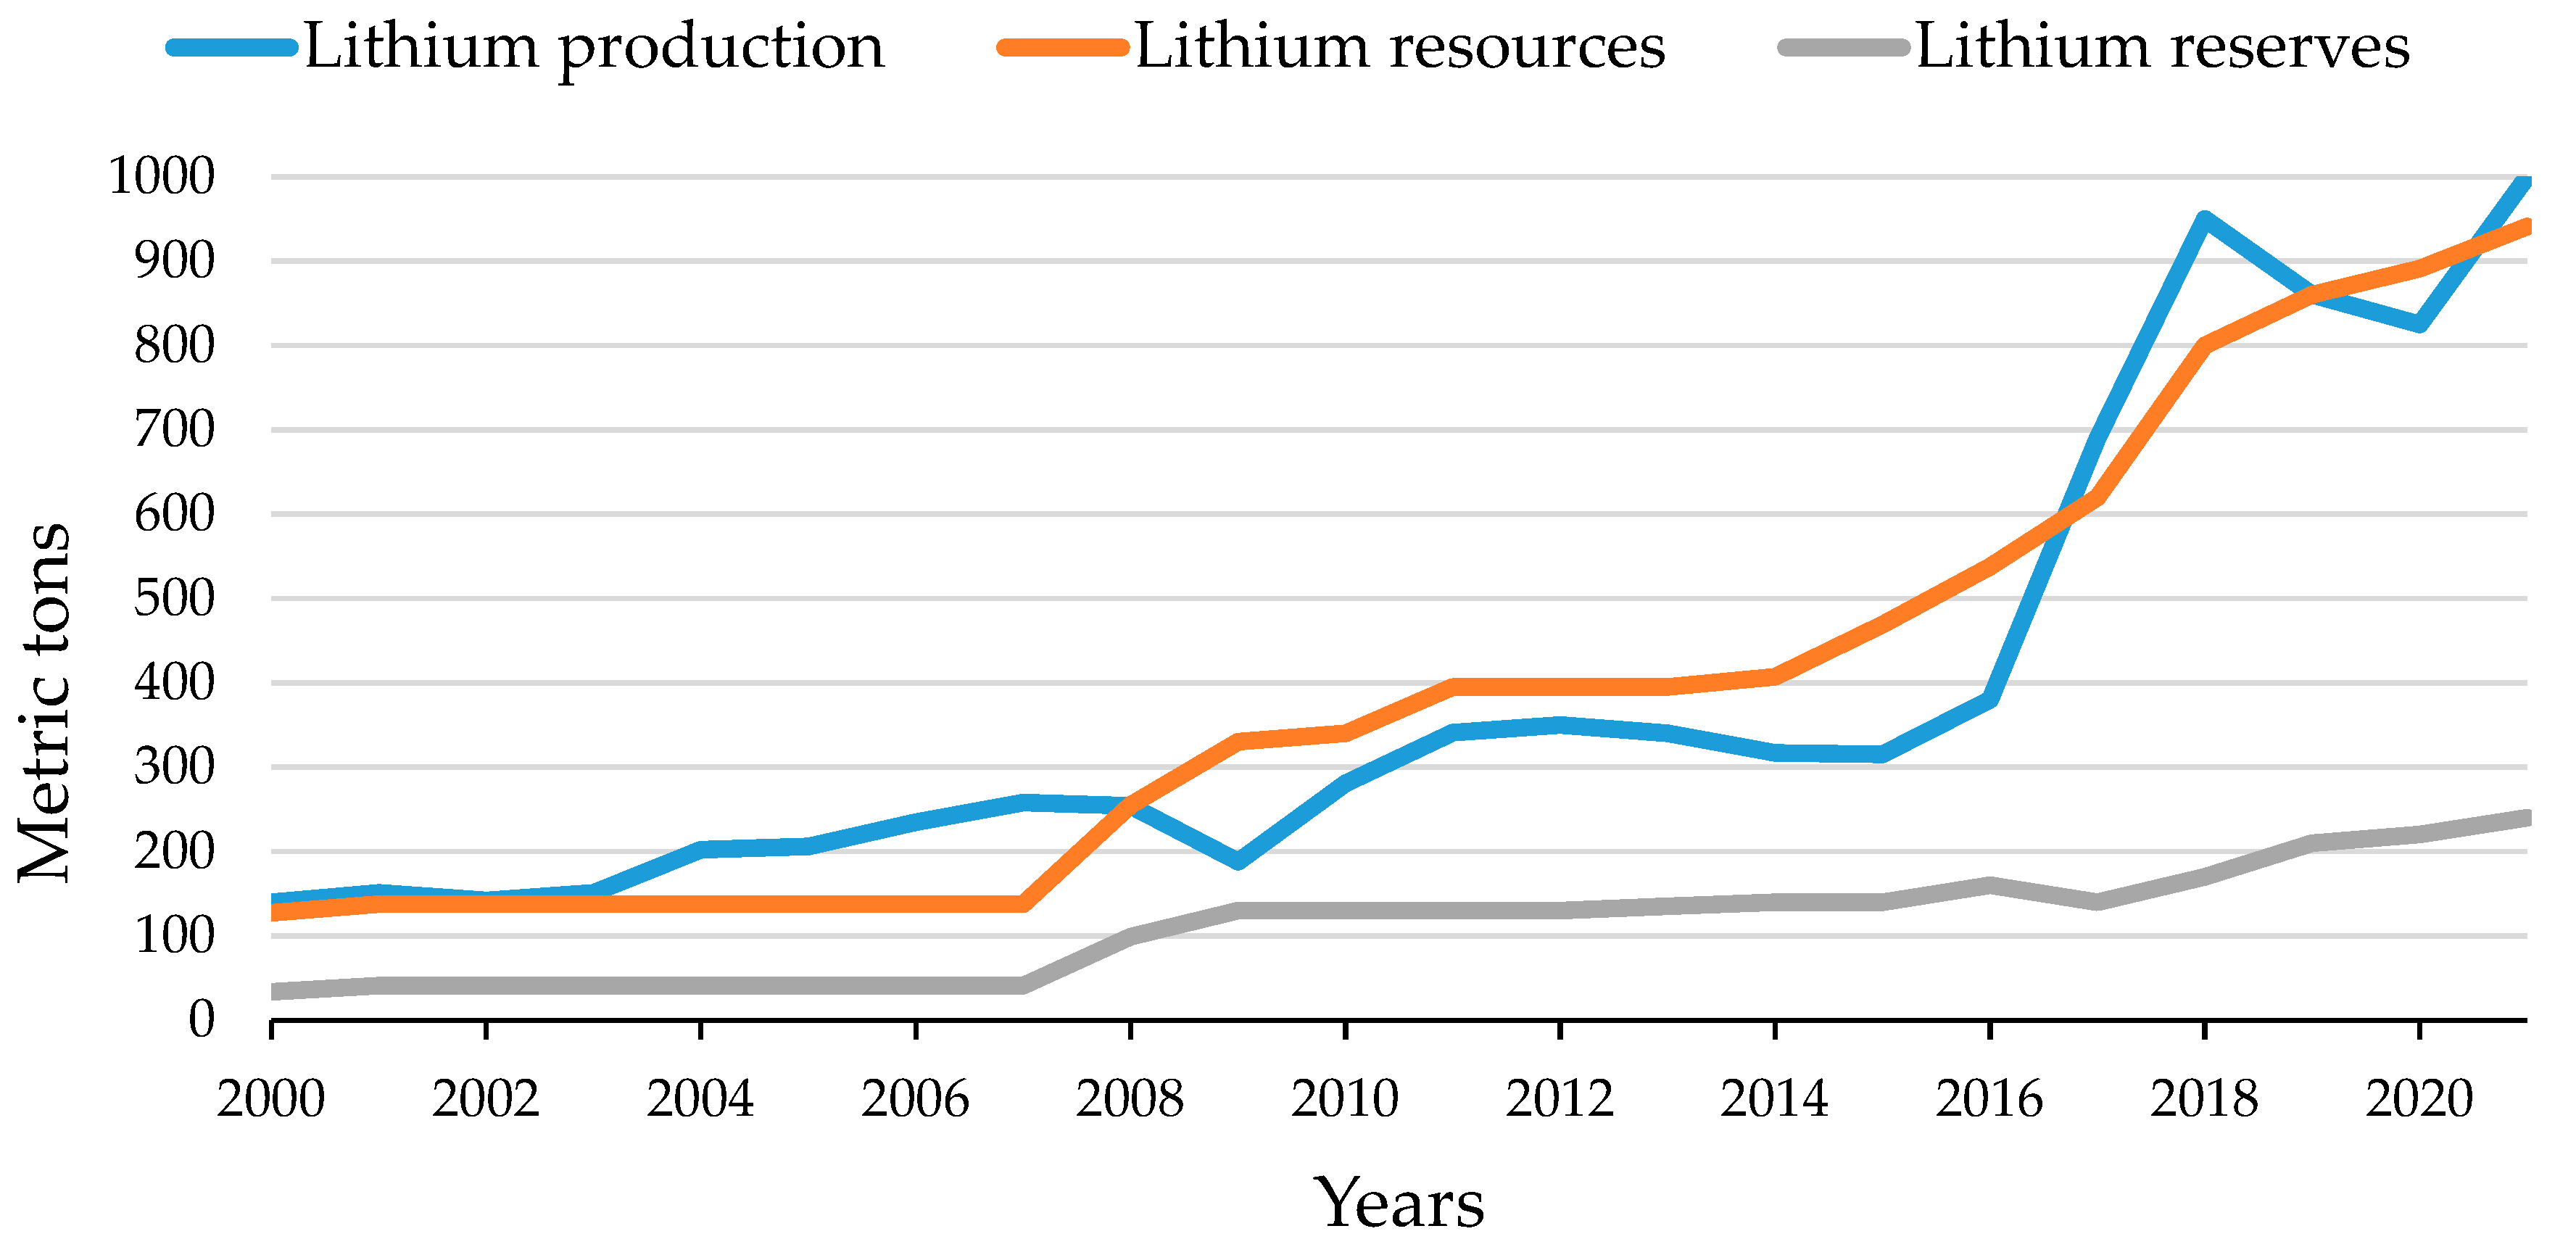
It stands for the activities that occur in the mining field and presents the data mostly collected on the ground by different methods such as geochemical, geological, and geophysical surveys. This group positively or negatively responds to the EV demand. The increase in EV demand stimulates the increase production of this group variables. Taking an example of the last two decades, the yearly average growth of lithium production, resources, and reserves was 11%, 11%, and 12%, respectively. Due to the proportionality between them, either an increase or decrease in one of them will directly impact the others. Figure 7 shows that the timing of the remarkable growth of lithium raw materials started after the electric vehicle became targeted transportation method in the global market around 2010.
However, due to COVID-19 pandemic travel restrictions that disturbed the global supply chain [77], and the consequences of lithium overproduction in 2017 and 2018 that declined price [78], production in 2019 and 2020 has declined. The exploration outcomes did not cease, which is shown by the gradual growth of new resources and reserves. After the pandemic, there was a lot of demand for lithium raw materials, which caused a lot of them to be produced.
The strong correlation coefficients between mining effect variables indicate that the availability of LRM in its current state is promising to positively respond to the EV demand. As shown in Table 5, there is a strong positive correlation between all three variables. This positive correlation, especially between the growth of lithium production and resources, may predict a prominent rise in LIB production for EVs and for other LIB-dependent devices.
The gradual rise of lithium production, which is proportional to lithium resources and reserves, can be one of the characteristics of the continuous growth of LIB manufacturing and continuous positively respond to EV demand. Even though EV demand is increasing, lithium production never stops, and LIB production did not suffer much during COVID-19 [77], demonstrating that there is a good correlation of continuous supply according to market needs.

3.2. Second Group: “Industrial Effect”

It stands for the activities that take place in the refineries, factories, and industries, or activities that involve industrial technology. The LRM is assumed to be measured in terms of lithium production from the first group of mining effects. The quantity of LRM that reach industries may determine the quantity of the LIB to be produced.
Generally, the number of batteries installed in each EV is known based on the size and use of the vehicle, and the amount of lithium needed in each battery based on the vehicle type (BEV, PHEV, or HEV) is also known [26]. However, it could be a hard task to count electric vehicles manufactured based on production batteries or vice versa. The demand for lithium and EV can be estimated based on the market growth, and the previous statistics of production can be the basis for assessing market demand satisfaction.
There is something crucial in this group, which is the “infrastructure”. It can be considered as the skeleton of the entire cycle of green transport. It does not matter how many batteries or EV are manufactured, they will all need infrastructure to operate. Among them, some are major and others are minor; here we only point out major infrastructures, which are power grids and charging stations. The availability and accessibility of charging stations are essential factors to consider while adopting EVs in the transportation system. Even though there is a range anxiety developed around those infrastructures, it has proven to be an effective green technology that can effectively reduce CO2 emissions. As governments set a timeline target for implementing full adoption of EVs, there should be cooperation with automakers to boost the effort of constructing more EV charging stations as fast as they can. The availability of the aforementioned infrastructures determines the degree of development in adopting green transport. Figure 8 show the interdependence between industrial effect variables. The strong positive correlation coefficient between LRM and LIB (0.894) indicates the growth of pairs sustainably.
China, as the largest consumer of EVs and LIB production, is investing heavily in constructing EV charging stations [79], marking a non-backing step towards green transportation. Due to the proportional relationship between LIB and charging stations, the augmentation of EV sales may trigger an increase in both LIB and LRM.

3.3. Third Group: “Public Effect”

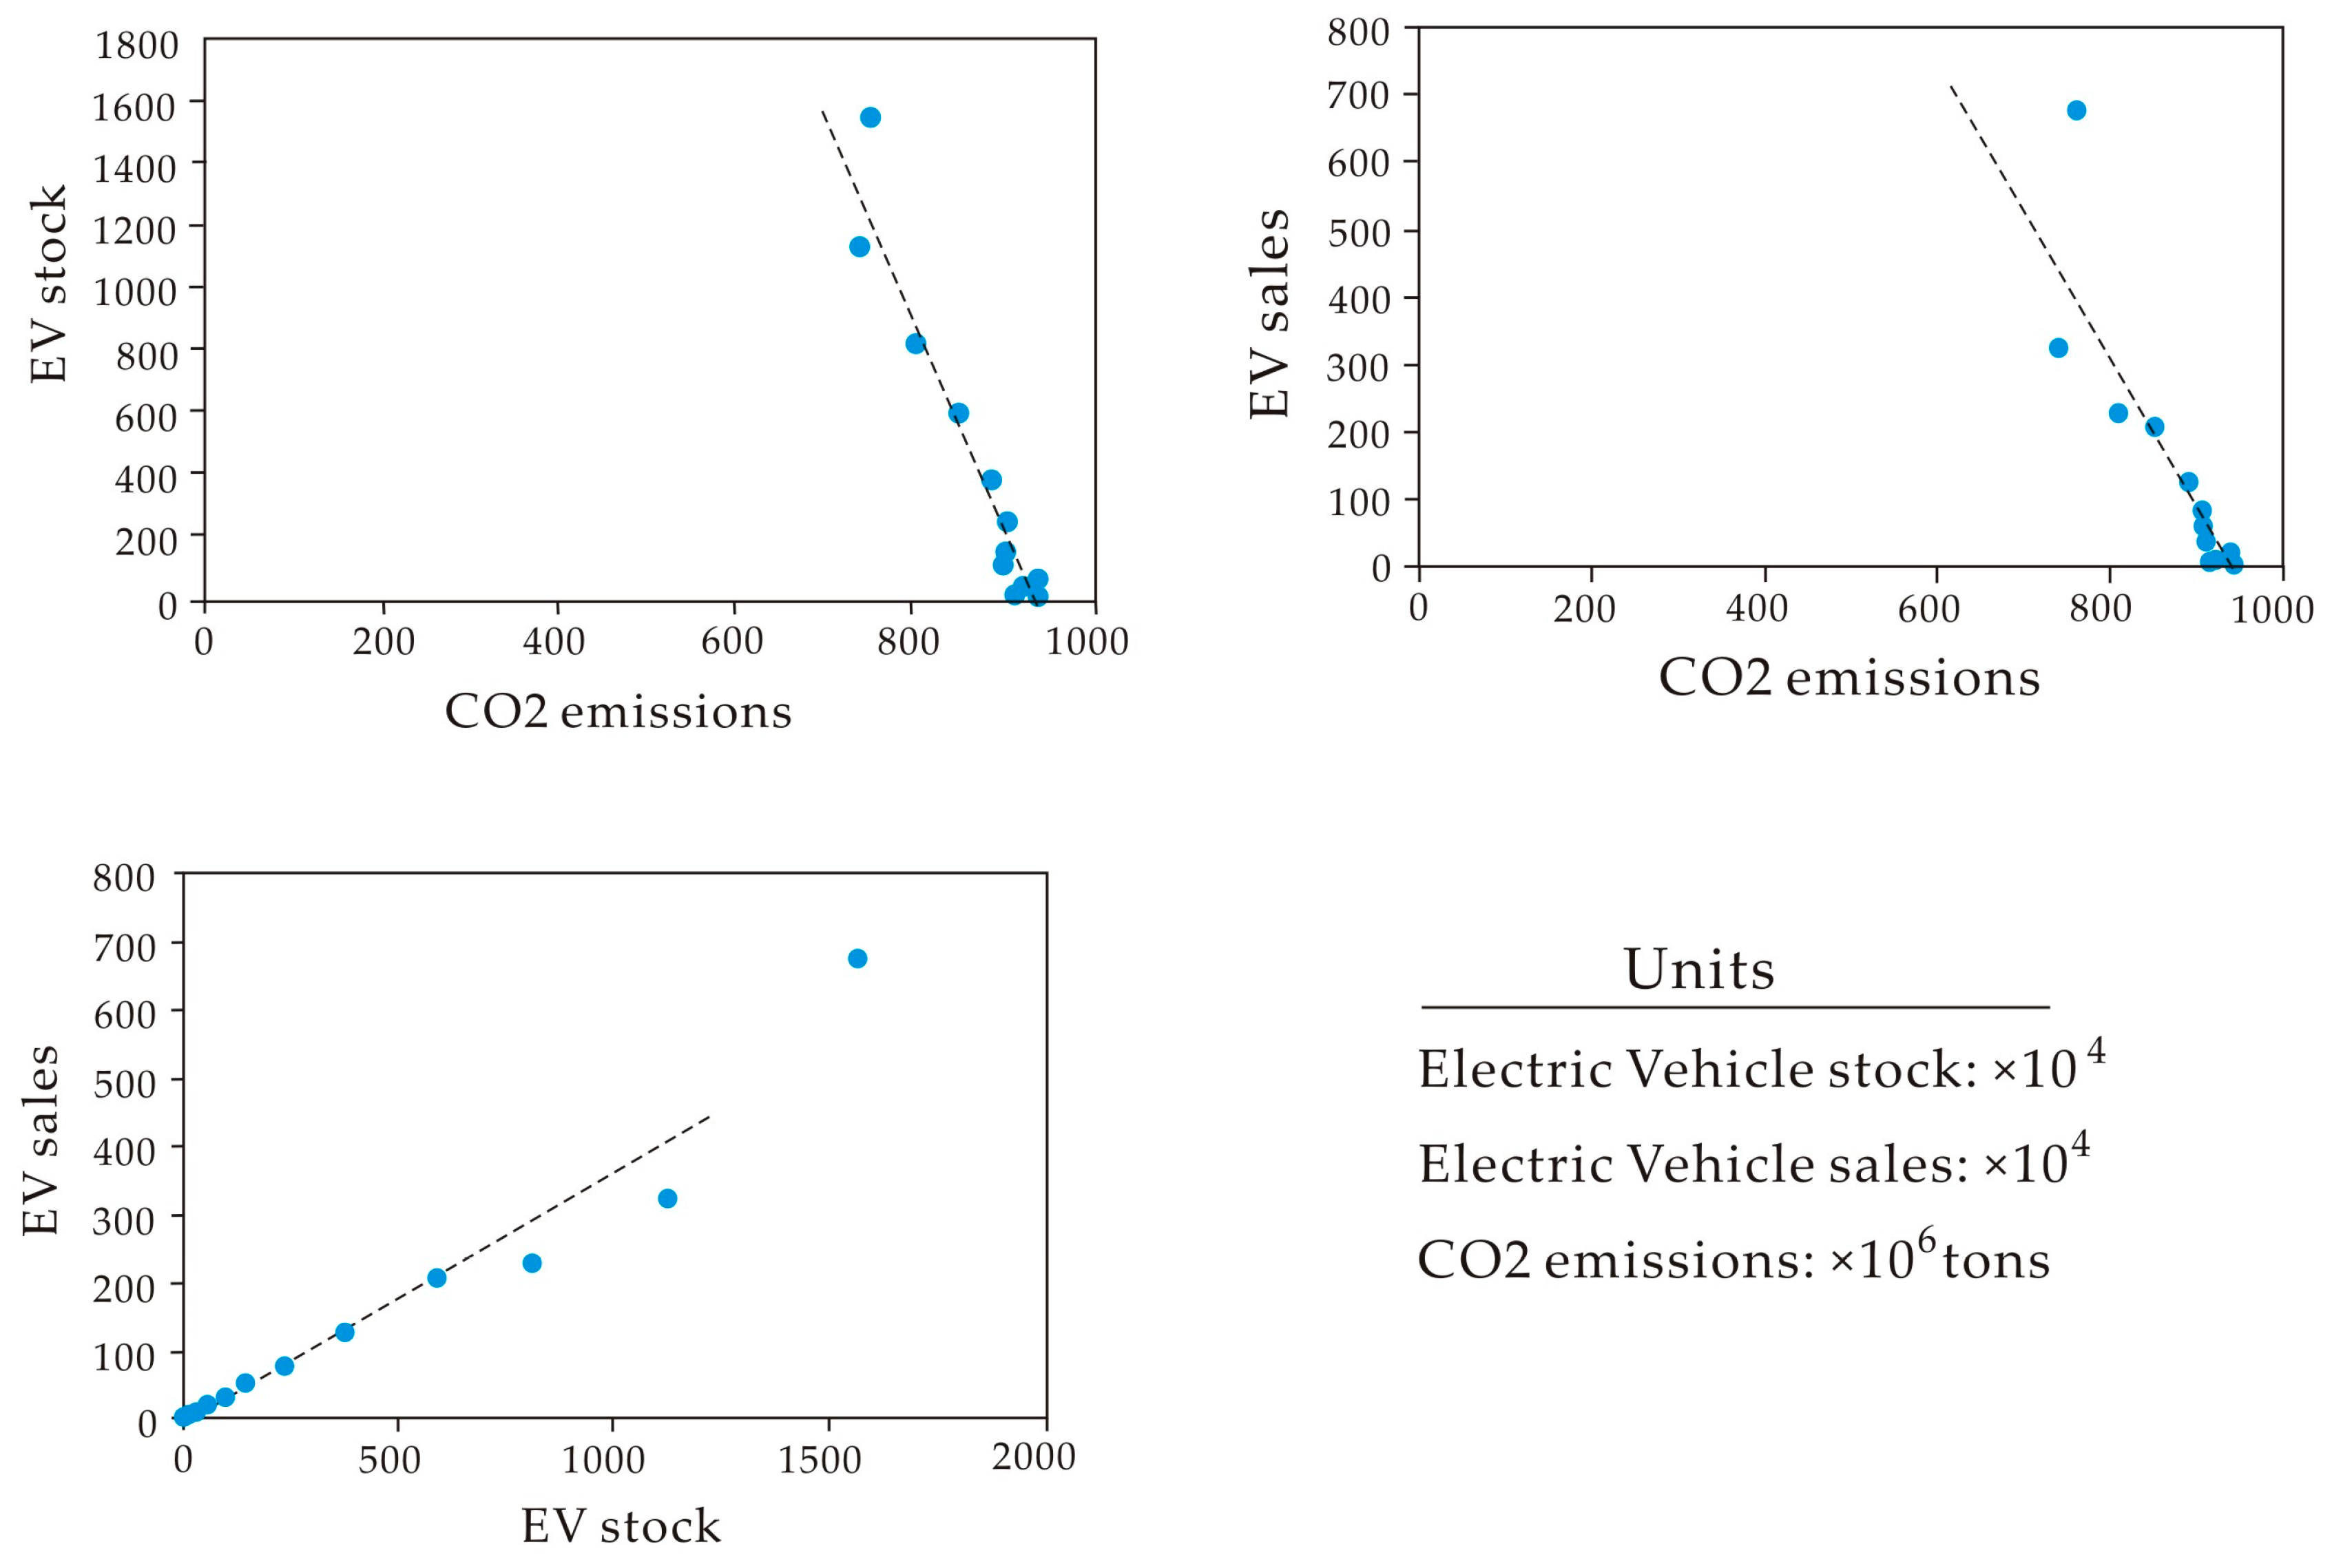
It is the consumption stage that is played by the public whereby the use of all products containing LIB occurs. This stage gives the properties of evaluating the adoption of EVs as green transport. The evaluation includes the increase of EVs on the road and the reduction of CO2 emitted from roads. From observation of Table 4 and Figure 9, there are two sets of results to be distinguished. The first set is made up of negative correlations between CO2 emitted by vehicles and global EV sales (−0.96), and CO2 emitted by vehicles and EV stock (−0.97). The negative correlation indicates the significant contribution of EVs in reducing road CO2 emissions. The second set is made up of a positive correlation between EV stock and EV sales (0.99). The rise of EV sales and stock shows a strong signal for accepting the use of EV in transportation. It significantly contributes to the decrease of the CO2 emitted from road transport, which was the philosophy and objective behind the adoption of electric vehicles. It predicts a significant reduction in CO2 emissions if the public quickly shifts from gasoline to electric vehicles.
The increase of EV in public gradually declines the CO2 emitted by transportation. Referring to the results presented in Figure 9, the negative correlation indicates that the increase in EV (notably green transport) contributes to the decline in carbon emissions. However, it is pity to say that even if the CO2 emitted by vehicles declined, there is no sign of global temperature reduction because of the gradual increase of CO2 emissions from other sources, which made global total CO2 emissions stay on the rise. It is believed that in the next decade, the proportional relationship between carbon emissions and global warming will be heavily dependent on the growth of EV consumption. Both of them are inversely proportional to green transport, which means the significant quantity of EVs consumed by the public may directly control carbon emissions and indirectly contribute to the control of global warming.

4. Discussion

4.1. Manufacturing of Lithium-Ion Battery and Demand

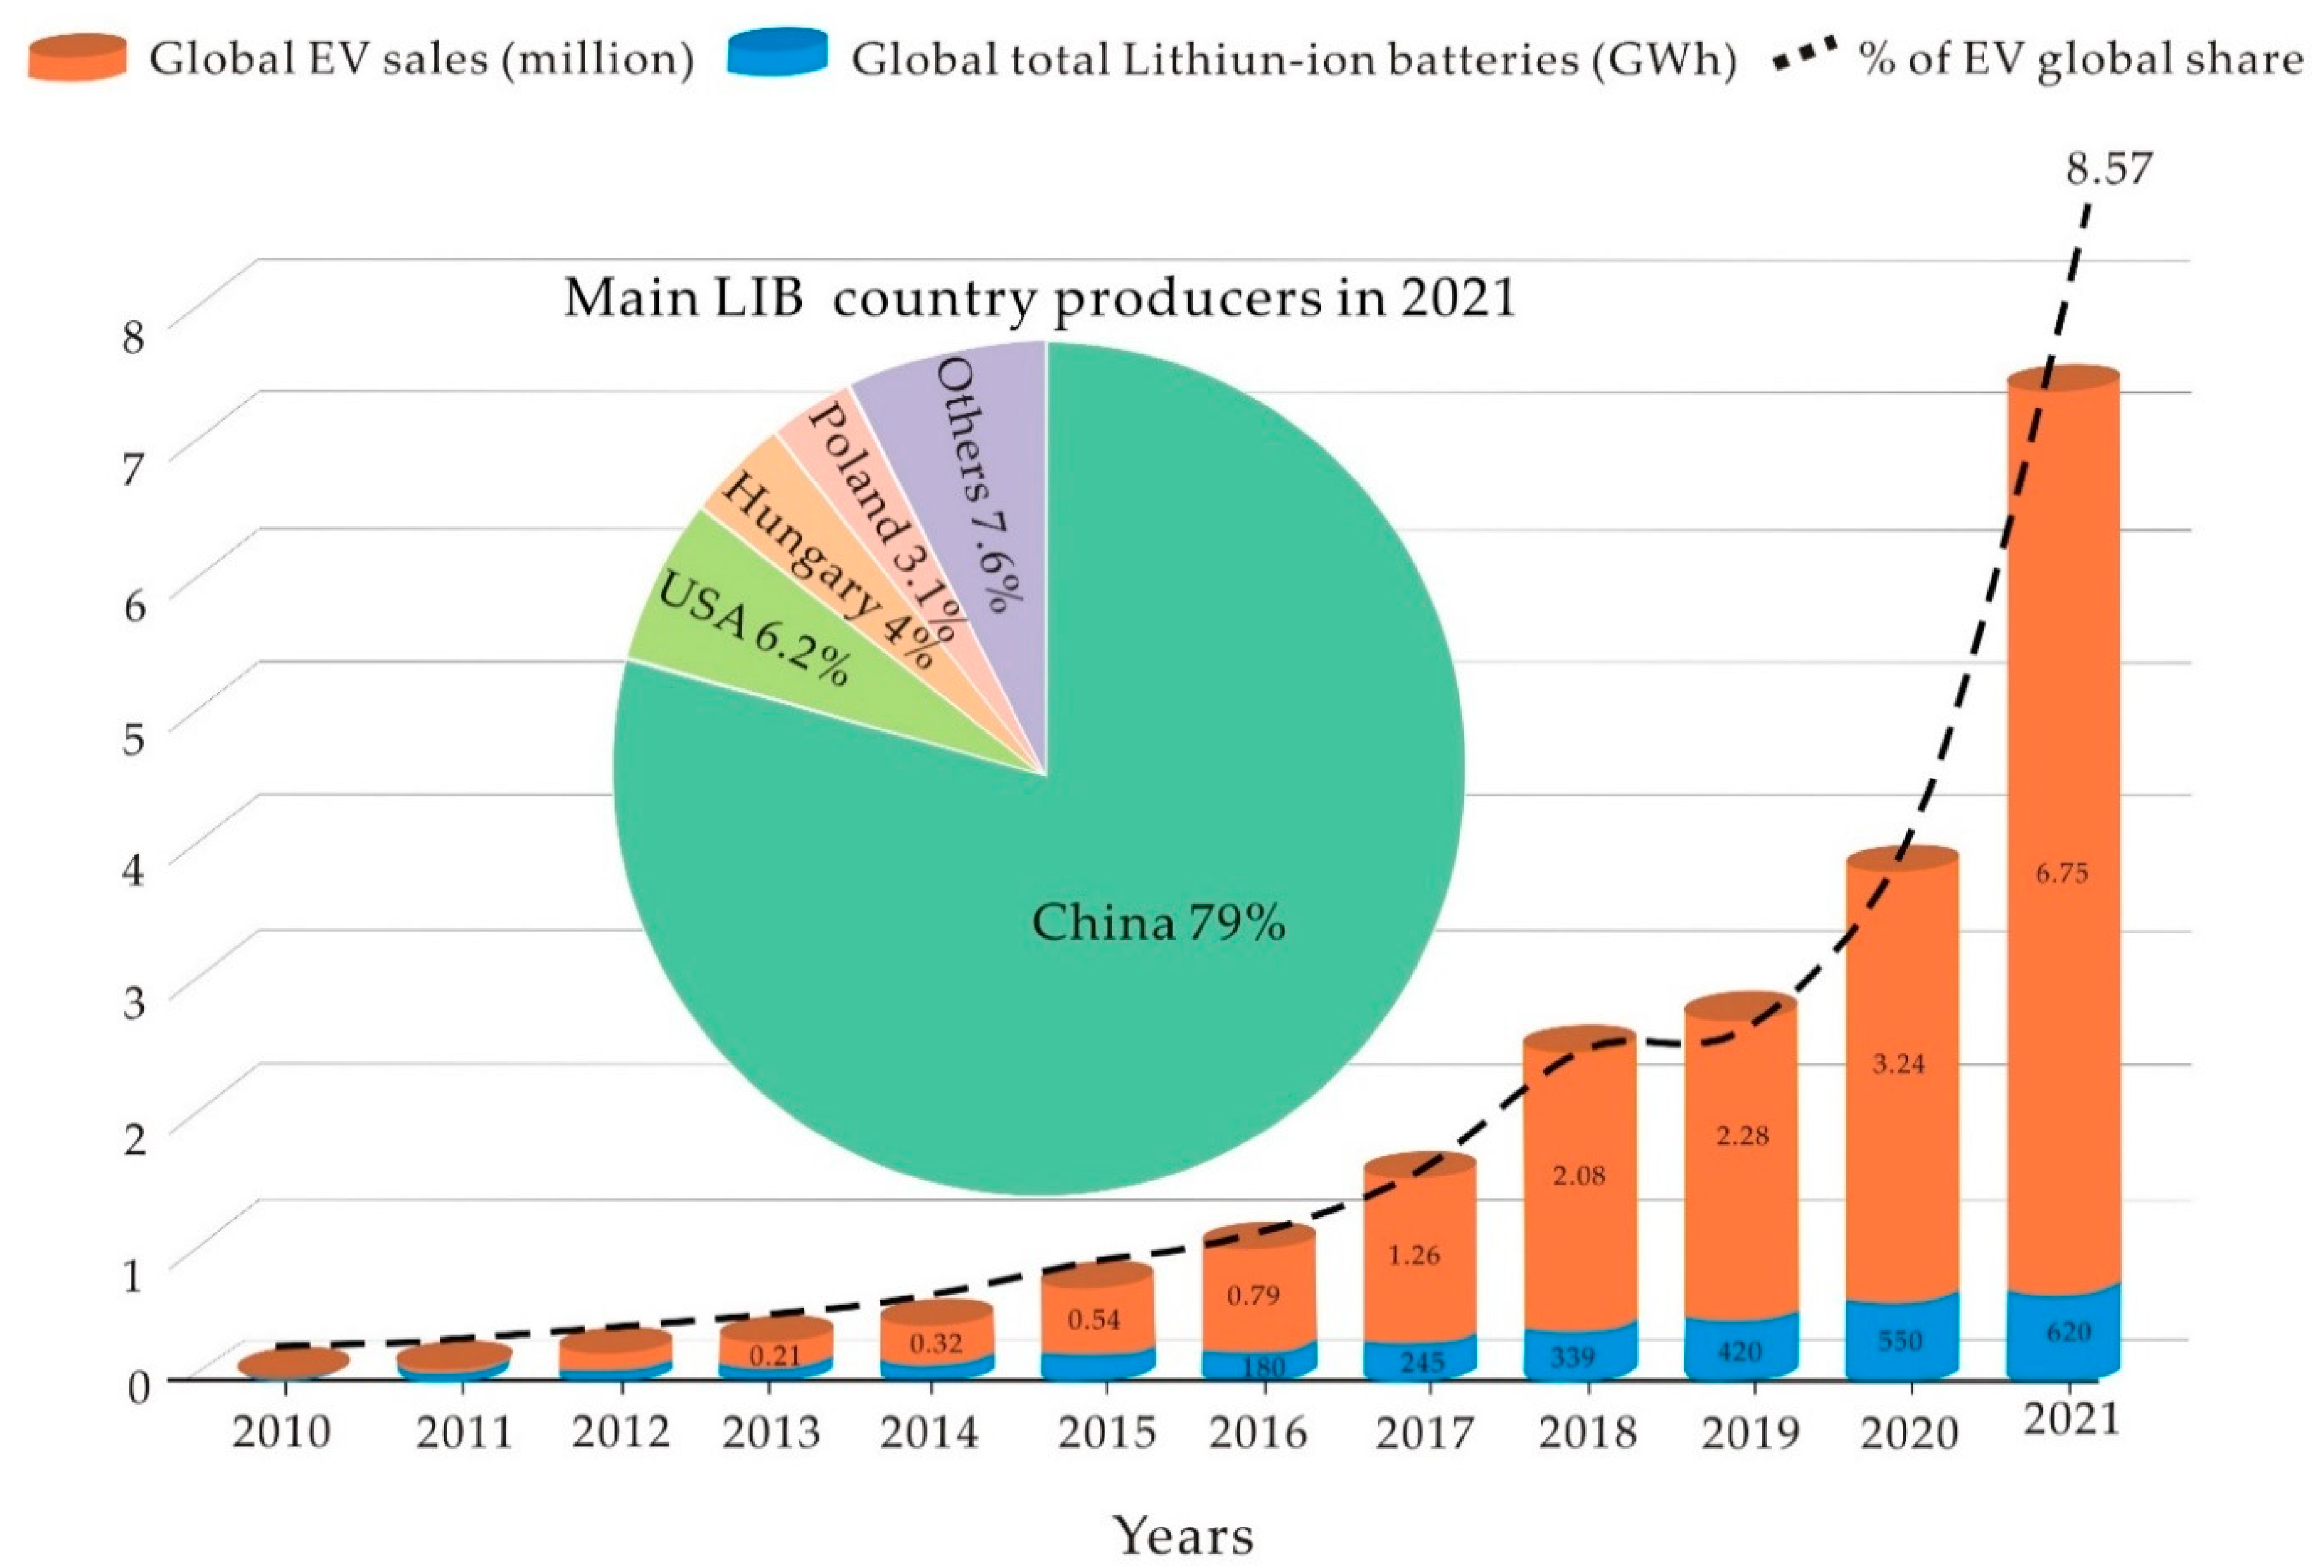
The rapid rise of LIB and EVs (Figure 10) is inevitable due to the positive mindset of climate change activists towards reducing carbon emissions. The prediction shows that it will reach around 9000 GWh in 2030 [80]. This rapid shift in transportation methods creates competition among governments (with the help of EV manufacturers) to the point where having a large capacity of domestic LIB manufacturing becomes a source of pride for a country for being ahead of the pack in the race of EV technology. The country with the highest manufacturing rate of LIB in terms of GWh corresponds to its access to raw materials. Access to LIB raw materials created a significant gap in the capacity of countries to produce LIB. For instance, as shown by statistics of 2021 [81], China is leading the race with 79% of the global LIB GWh production, while the United States comes second with 6.2%. China is not only dominating LIB production but also leading the battery supply chain as the largest exporter of LIB [82].
According to Alice and Sumangil [81], LIB production (GWh) will triple between 2020 and 2025. By accounting for global LIB production, including passenger electric vehicles, electric two/three-wheelers, electric buses, energy storage systems, electric trucks, consumer electronics, and electric off-highway vehicles, it may reach 900 GWh in 2023 [83], and by considering total LIB production regardless of the uses, it may cross 1330 GWh in 2023 [80]. At present, approximately 90% of global battery research is focusing on LIB since NiMH has reached its fundamental technical limits [84]. The decline of NiMH advantages LIB to become the dominant technology as predicted by [85] and proven to be the most promising technology for EVs. The amount of lithium used in LIB varies based on the battery chemistry and type of electric vehicle [86]. However, regardless of the chemistry of the cathode and anode, the lithium amount in a battery can vary between 0.17 kg and 12.68 kg [26]. Thus, both properties are crucial during the estimate calculation of lithium demand.

4.2. Advantages of Lithium-Ion Batteries

The development of new battery components that will considerably boost the real-world performance of LIB has been the main focus of research in the field of battery chemistry. Over the last decade, the cathode, anode, binder, and polymer’s fundamental performances have been independently improved through meticulous chemical composition alteration.
A new generation of electrochemical generators was created in the middle of the 1960s by using a very pure lithium-metal foil on an anode and a lithium salt solution as an electrolyte. The experimental development of LIB was in parallel with many other batteries such as nickel-metal hydride (Ni-MH) and nickel-cadmium (Ni-Cd) batteries. However, the performance of lithium batteries was far better than that of other types. That advantageous performance lies in the lithium ions Equation (2) produced through a straightforward reaction that releases one electron through the external circuit and introduces one ion into the cathode’s porous structure [88] (Figure 11).
L i L i + + e
The era of digitalization always considers time minimization as a primary goal. The same modern technology is focusing on new discoveries that enhance efficiency, durability, and time-saving. By considering such factors, LIB has more convincing advantages over other types of batteries. These advantages include a low memory effect, a high specific power of about 300 W/kg with a high specific energy of 100 Wh/kg, and a long life of 1000 cycles [38,91]. These excellent characteristics make LIB preferred over nickel–metal hydride batteries (NiMH) as reliable energy storage technology for electric vehicles. Interestingly, the energy storage density of LIB is twice that of NiMH batteries. Apart from its high energy density [92], LIB has shown good performance in high-temperatures and is also recyclable [38].

4.3. Lithium and Electric Vehicles Market

Recently, lithium supply has become an expanding concern owing to e-mobility obtaining a choice of internal combustion engine e-vehicles. Due to their remarkable energy storage capacity [15,40,93], Li-ion batteries have been critical contributors to e-mobility in recent decades. For example, driving 60 km in an e-vehicle requires only 1.4 to 3.0 kg of lithium [44]. Its consumption has also seen a significant increase due to the high demand for rechargeable lithium-ion batteries that are extensively used in electric vehicles, portable electronic devices, and other electric tools [41].
By considering the sources and market for lithium, EV batteries consume 65% of global lithium production. While other products require lithium metal, such as pharmaceutical tools, enamel, glass, ceramics, and lubricating grease [40,44], the global lithium demand was intended to rise to 77,200 tons [44] in 2019. An estimation shows that the consumer demand will continue to rise up to 188,000 tons by 2027 [44] and about 78% of the global supply is only from Australia and Chile, which makes it a critical metal [41,44,94]. Taking an example of China, the price of lithium carbonate reached approximately 170,000 rmb/per ton at the end of 2017, then it underwent a relatively slow decline to 41,000 rmb at the end of 2020 due to the COVID-19 pandemic that partially suspended industrial activities. Surprisingly, the price resurges from 42,000 rmb in January 2021 to 497,000 rmb per ton in March 2022. The increase in price surged by over 265% due to the unprecedented demand for lithium batteries for electronics and EVs [4]. The global electric vehicle market increased sales in 2021 and is expected to double sales and delivery in China during 2022, with an estimation of over 5 million sales and 9.5 million units worldwide [95]. This should come with a secure lithium long-term supply channel to avoid increasing mineral scarcity and environmental concerns. Since 2010, when EV ideology influenced the vehicle market, the global total of electric vehicles sold account for more than 17.6 million in 2021. Statistics for 2021 show that among global sold passenger vehicles, 8.3% are electric vehicles [69,96].
According to canalys [68], the global electric vehicle market estimates that 6.5 million electric vehicles were sold worldwide in 2021. It increased by 109% compared to 2020 sales. Those electric vehicles include fully electric and plug-in hybrid passenger cars. However, the global market itself did not grow much, only growing 4% due to the consequences of COVID-19 travel restrictions and chip shortages. Currently, China is the global leading country in consuming EVs, with 50% of all global sold EVs (Figure 12) and is also the largest manufacturer of LIB [71]. Europe comes second with 35%, and together with China make up 85% of total EV global sales, which accounts for 15% of all new car sales.

4.4. Electric Vehicles vs. Total Vehicle Vehicles

The word “technology” could be the best definition of auto industry development in the last decade. Electric vehicles have seen remarkable development during the last decade. Except for the time of COVID-19, when vehicle purchases for transport services slowed, global sales increased by more than 40% every year during the last decade. They are a critical component of attempts to decarbonize the transportation industry. While their sales are rising, the move to greener transportation may not be occurring quickly enough to achieve climate objectives. Figure 13 shows that when EV sales reached one million, overall vehicle sales started declining. Importantly, the increase in EV sales decreases the number of gasoline vehicle sales, which creates an obvious gap between the global total vehicle and gasoline vehicle sales. As the popularity of electric vehicles grows, gasoline vehicle sales fall. According to data from [97,98], the decline in gasoline vehicle and overall vehicle sales since 2017 coincides with the increase in EV sales. In 2017, annual EV sales crossed a million and it was the same time when CO2 emissions from road transport started showing a remarkable decline.

4.5. Lithium Availability and Demand

Today, lithium is among the world’s most needed commodities. Due to the hurry-up of the shift from gasoline to electric cars and the growing geopolitical oil tension, clean energy technology is among the best choices. Being a part of a solution without promising long-term sustainability is not enough. So it is inevitable to evaluate lithium availability by distinguishing its production, resources, and reserves. Since EV adoption and battery production are expanding, any new sources of lithium supply will play a critical role in mitigating the rising demand. Lithium in metallic form started getting attention in 1994, and since that time, it has gradually increased up to the present. However, it showed a slight decrease in 2009 due to the global economic crisis of 2008 [28]. According to Jaskula [41], global lithium resources have reached approximately 89 million tons, reflecting an extreme increase of over 63% since 2010 due to the growing demand for industrial uses and more than 24 countries, led by Bolivia (with 24%), sharing that resource.
The increasing demand for electronics and EVs necessitates enough LIB, which has drastically increased production. This demand has been accelerated by government policies towards the promotion of electric cars. The European Union, for example, promotes EVs through two directive bills: (1) Directive 2006/32/EC of the European Parliament and of the Council of 5 April 2006 on energy end-use efficiency and energy services; and (2) directive 2009/33/EC of the European Parliament and of the Council of 23 April 2009 aimed at promoting clean and energy-efficient road transport vehicles [26]. The European Union goes far in green transport by introducing the Green Car Initiative in its Economic Recovery Plan [99]. Furthermore, as part of the Green Car Initiative, the European Commission’s Transport and Energy General Direction (DG TREN) finances a significant European “electromobility” initiative on electric vehicles and other EV related infrastructures [100]. It recently issued a revised Clean Vehicles Directive (Dir. 2014/24/EU and 2014/25/EU) that promotes clean mobility solutions and strengthens the deployment of low-and zero-emission vehicles. Each member state of the EU launched a detailed plan for deploying electric vehicles to decrease carbon emissions to zero starting from 2021 [101]. This initiative necessitates huge lithium for LIB production.
Though the speed and duration of achieving e-mobility is different, all countries on the globe are implementing green transportation initiatives. Here, the authors take a few EU member states as an example and discuss their big plans to promote green transport for the past decades. They have put in place national programs for EVs, including financing research, purchasing EV incentives such as reducing taxes, insurance facilities, providing convenient parking and charging facilities, and numerous subsidies [26]. France is rolling out countrywide charging stations and building plants for electric vehicle batteries; Britain is ambitious to not only have the biggest electric vehicle plant in Europe but also the city of London wishes to become European EV capital by investing millions of dollars in the construction of electric vehicle infrastructure [85]. The Danish government is rolling out a nationwide grid that is composed of thousands of charging stations and the government charges EVs fewer taxes 25% compared to petrol vehicles (180% + 25%), free parking in some cities, with free recharging stations at some parking spaces. In 2011, Portugal started hurrying up to be one of the first buyers of EVs from Renault-Nissan; Spain aimed to achieve 1 million electric or hybrid vehicles on the road by 2014; In 2009, the U.S. Department of Energy allocated $2.4 billion in grants to speed up the development of batteries and electric-drive components, which made it the largest investment ever made in the history of battery technology for electric vehicles. About 40% of that fund has been allocated to LIB material supply, manufacturing, and recycling [102].
As the world recovers from the COVID-19 pandemic, which significantly affects the mineral supply chain [4,103], the growth of lithium production heightens speed. In response to the high demand for LIB and the increase in lithium price, there is a necessity to massively produce lithium raw material. In the effort to recover from the pandemic, production and consumption increased up to 21% and 33% in 2021, respectively. The estimated round numbers are approximately 100,000 tons of production and 93,000 tons of consumption in 2021 [41]. The worldwide battery factories are expected to increase lithium demand by up to 3 million tons in the next decade. This should be in line with the increasing access to raw materials for countries to increase LIB manufacturing. Beside China, many countries are also in the race of producing LIB, so as time goes on, they are ramping up the development of sustainable pathways of lithium raw materials flow and building megaprojects of LIB. If it succeeds as planned, it is expected to gradually increase global LIB production, at the same time would decrease the percentage of China’s global share and increase other countries’ shares. Such shared responsibility of LIB production could be more securing supply in the case of a pandemic or other circumstances that disturb the global supply happen.

4.6. Demand for the Two and Three-Wheelers

Two- and three-wheelers make up 90% of the global total electric vehicles on the road, and only 20% of those two- and three-wheelers are electric [104]. Transport using two/three-wheelers is growing faster in low- and middle-income countries. They are concentrated in Asian, South American, and African countries. However, countries with insufficient electric power still use fuel for two/three-wheelers and contribute to urban air pollution [105]. Countries that emit large amounts of CO2 into the atmosphere, such as China, the United States, India, and the United Kingdom, are putting extra effort into electrifying public transportation systems, and e-bikes have a clear dominance share of their electric two- and three-wheelers. Other countries prioritize the increase of electric two- and three-wheelers over cars because of their lower power consumption and easier affordability. China, for example, has a large number of electric two- and three-wheelers due to its access to batteries and electric power. Their increase is also motivated by the decline of the battery cell price up to 97% within 3 decades [106] and the expansion of charging infrastructures [75].
There are different types of batteries used in two- and three-wheelers, but the most known are lead-acid batteries and LIBs. However, regardless of the price, LIBs are the best choice for e-bikes because they are light and have a higher capacity than others. There are still some challenges with three-wheelers in developing countries due to poor drivability, electricity blackouts, long charging times [105,107], and range anxiety that hinder the electrification shift. Two- and three-wheelers are cheap and affordable for ordinary people, and their demand is quite high. Both hybrids and plug-in hybrids have been developed to reduce fuel consumption and at the same time reduce range anxiety [108].
According to the IEA [75], the stock of global electric two- and three-wheelers accounted for about 290 million in 2020, and their 2020 sales were equivalent to a third of the global total of two- and three-wheelers sold. Their stock estimates are to reach 490 million in 2030, equivalent to 40% of total two/three-wheelers. Their battery demand was about 33 GWh in 2021 [109] and is estimated to be 100 GWh in 2030 [75]. Even if the European Union market rises by 30% and boosts battery production to catch up with China, Asia is still the biggest market for two/three-wheelers. To date, more than 120 countries account for 85% of the global road fleets have announced net-zero emissions in the coming years. Countries’ timelines for banning gasoline vehicles have been published [110,111], excluding two- and three-wheelers [75]. They deal with them separately; for instance, China has already banned internal combustion engine two/three-wheelers in many cities [112]. Challenges remain in developing countries where electric power is still a major problem.

4.7. LIB Swapping Stations

With the growing number of e-mobility vehicles on the road, the charging process is becoming a challenge for drivers. It takes 30 to 40 min to recharge batteries [113]. Charging time is considered a weak point of EVs compared to fuel vehicles, which discourages or delays some people from shifting to EVs. This issue was addressed by building large-scale charging facilities, including fast-charging stations, with the goal of publicizing the development of EVs. People who are still hesitating to use EVs and some of those who are already using them have developed range anxiety (fear of getting an insufficient charge before completing the designated duty) and fear of the cost of purchasing additional batteries (as backups) that is expensive.
Apart from conventional fast-charging stations [114], the new charging infrastructure of battery swapping stations has been integrated into the charging system [115] and operates as an alternative to charging stations for reducing charging time and EV anxiety. It is a method of removing the empty batteries and replacing them with fully charged ones. This technology reduces the times wasted while charging from 40 to 5 min maximum. It is a widespread technology in China, and Chinese firm “Nio” takes the lead of this technology in China, where it owns more than 130 battery swapping stations in 58 cities in 2020 [116]. It is also expanding power swap stations in Europe (i.e., Norway) [113]. Other companies like Tesla, Honda, KYMCO, Immotor, Gogoro, etc., are also doing battery swapping systems [117,118].
The battery swapping system has broad advantages for EV drivers, including the ability to resume journeys in a minute, extending the lifetime of batteries due to slow-charging mode, always being equipped with fully charged batteries, releasing the burden of cost to replace old batteries for EV owners, getting batteries with the latest technology without additional cost, etc. The system targeted the public transportation in the beginning [114], however, it is becoming popular in all EVs. Particularly, it can be performed by a robotic system that takes less than one minute to complete the swapping operation [119]. Battery swapping stations charge the batteries in a centralized manner and ensure the high efficiency of swapping operations. Both the battery swapping system and the range-improved LIB of up to 300 miles [120] reduce EV range anxiety. It gives a choice to drivers with depleted batteries; they can either choose a charging station (if empty space is available) or go to a battery swap station. Particularly, LIB that can travel long distance up to 300 miles could help reduce EV charge anxiety (fear of not finding or accessing a charging station point), which is also growing among EV owners. It is also ranked as one of the best methods to collect old batteries for recycling.

4.8. Lithium Recycling

The transition to renewable energy technologies would result in a massive amount of spent LIBs that would need to be recycled. Zeng et al.’s [121] estimation shows that the spent LIBs may surpass 25 billion units, equivalent to 5 × 10⁵ tons in 2020. According to the LIB cathode technology [122], the end-of-life LIBs account for an important lithium concentration of about 2–15% [3].
The recycling of rechargeable batteries should not only be for recovering economic metals but also for saving the environment. There are other types of rechargeable batteries, like NiCd and NiMH, that are composed of hazardous chemical elements (Cu, Zn, Co, Mn, and Ni) and toxic elements (Hg, Pb, and Cd) [123,124,125,126] that should not be thrown in the environment. Fortunately, the high demand expectations for lithium and cobalt may prioritize the recycling of LIBs [3] over disposal. Due to several processing obstacles and challenges, the rate of LIB recycling is still low. Since the spent LIBs contain toxic materials and have a complex layered structure, manual dismantling (the separation of useful from non-useful components) is highly challenging. Additionally, due to the lack of systematic collection and sorting systems, mixing different types of spent LIBs complicates the process and reduces the effectiveness of recycling. Due to these challenges, the cost of recycled lithium may be more expensive than that from brines [3,127]. Some researchers, like Tabelin et al. [3], labeled sorting end-of-life LIBs as the major challenge for recycling companies, and urged that mixing different types of batteries (LIB, NiCd, NiMH, and others) reduces the effectiveness of the process. He suggested a battery-tagging system as one of the policies that can facilitate the segregation and collection of batteries with similar properties based on the available recycling technologies. Fortunately, the technologies that can deal with complex or mixed battery wastes are still underway, and they are being developed with a critical cost comparison of manufacturing new materials over reusing, recovering, and recycling LIBs [43,128].
Apart from lithium, spent LIBs have higher concentrations of other important metals than natural ores, including cobalt (5–30%), copper (7–25%), nickel (0.2–10%), aluminum (3–14%), and iron (20%) [121]. Considering a large numbers of metals to be recovered from LIB recycling, it is gradually becoming an interesting project for private firms and government institutions to fund [129]. Though electrification is becoming popular in developing countries, industrial-scale recycling seems to be almost impossible for those countries because of huge capital costs for plant infrastructure and the lack of viable economics to make recycling operations stand alone. Currently, industrial recycling facilities are only in developed countries, where they use methods like pyrometallurgy, hydrometallurgy or a hybrid system for recycling [3]. Moreover, the unclear supply channel of spent batteries to recycling companies still hinders significant global recycling progress.
Currently, the cost of the exploitation of primary lithium resources and reserves is low [40] and is hindering the use of secondary source lithium. As a result, the recycling rate remains insignificant compared to the total lithium supply [130]. According to Boxall et al. [43], the recovered spent LIBs are less than 2%, and the remaining 98% go for disposal, leading to the potential for serious damage to the ecosystem because of their hazardous and toxic chemicals.
The hope of recycling growth relies on the price of lithium from primary sources, which has been increasing since 2002 (from $1590/ton in 2002 [43] to $16,500/ton in 2022 [131]) and is expected to continue growing due to increasing future demand for EVs and larger grid or off-grid energy storage devices. This price growth will deplete lithium from primary sources and reinforce the recycling of LIBs to recover important metals that drive the energy transition, such as Cu, Ni, Co, and Li. There are around 25 companies either planning or currently recycling lithium batteries in North America and Europe. To increase the share of recycled lithium, it also requires strengthening the partnership between automobile companies and battery recyclers to have a sustainable supply channel for sharing batteries.

4.9. Production Growth

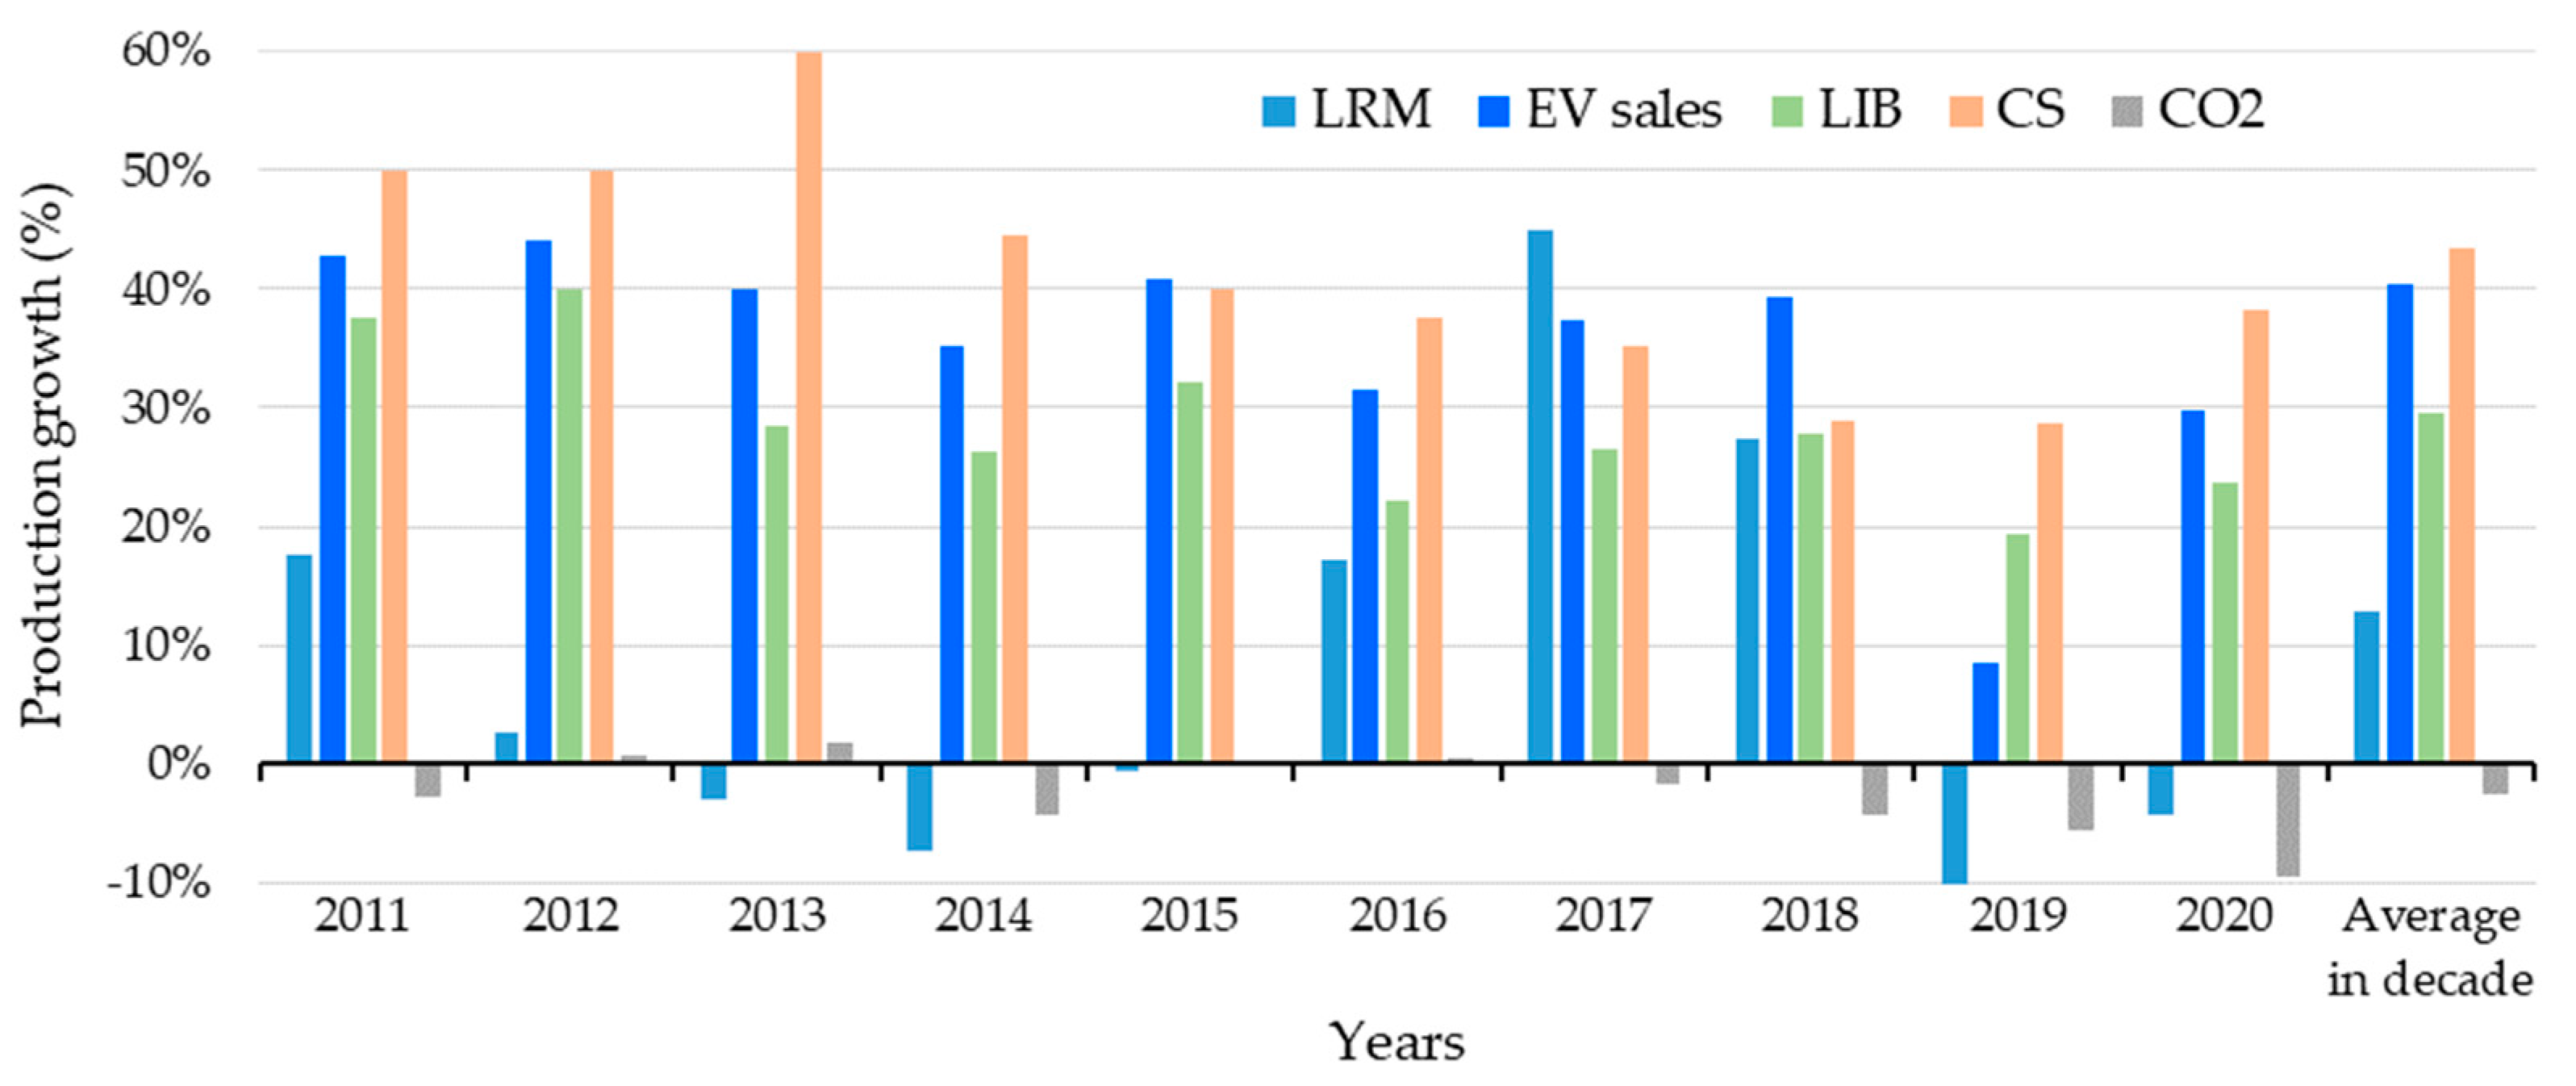
Given the last decade, which shows an increase in both production and manufacturing of devices that require LIB to function, their rise was fueled by next-generation electric car technology [4], and is expected to skyrocket in the coming years. The average of the annual growth in the last decade (which is equivalent to the mean of average growth of 10 consecutive years) of EV sales is 40% (exclude 2019), implies the increase of 30% in LIB, 12% in lithium production, 43% in charging stations, and –3% CO2 emissions from road transportation.
In 2016, there was a high demand for lithium, which encouraged company producers to increase their production. However, they ended up with overproduction in the next two years (2017 and 2018). Companies such as Pilbara Minerals and Altura Mining, for example, supplied glut production. Consequently, this overproduction directly dropped the price of lithium commodities between 2018 and 2020. For example, the LiOH price fell from $20.5/kg (January 2018) to $9/kg (December 2020), and the Li2CO3 price fell from $19.25/kg (January 2018) to $6.75/kg (December 2020) [132]. Companies were forced to reduce production in 2019 and 2020 due to the price drop, resulting in the swing in lithium production (Figure 14). Unfortunately, COVID-19 found lithium production in its swinging state and made it worse. Moreover, the reduction in production affected the lithium market to a low extent due to the previous overproduction and COVID-19 restrictions in China that slow down manufacturing.
Recently, the demand and sales of EV have skyrocketed. Its speed of increase must be proportional to the lithium supply. The waste of used LIB should be minimized by increasing the availability of technology for recycling. Lithium from both mining and recycling activities can satisfy electric vehicle and electronics demand in the long-term, and the enhancement of recycling may reduce the consumption share of lithium from mining, which should be saved for future uses. The annual increase of electric vehicle sales predicts a need for a huge amount of lithium in the future, so the plan of mobilizing more lithium resources should be put in place to avoid an early shortage of lithium. Based on the estimate, lithium consumption will reach 188,000 tons [44]. The demand for electric vehicles is increasing faster than the speed of lithium production, which means that the lithium necessary to produce LIB can exceed the lithium production in coming years. The demand may be further accelerated by the increasing geopolitical tension between oil producer and oil consumer countries.
Even if the reported reserves seem to be enough for lithium demand, many lithium production activities need to be in place to respond fast to either short-term or long-term demand. Regardless of how far lithium exploration progresses, the effort to optimize lithium recovery and recycling should be stepped up to address long-term production.

4.10. Challenges Linked to LIB

During this battle of green technology, some problems linked to LIB still persist, such as (1) reducing the amount of metal used in batteries that is not only expensive but also their mining deteriorates the environment, (2) improvement of battery recycling is also still on the list of pending problems to be dealt with [133]. China, as the global largest consumer of lithium and LIB producer [134,135], has also pointed out the issue of the inappropriate mechanism of recycling the spent LIBs [25]. Those spent LIBs could provide lithium and other metals that are necessary for manufacturing batteries [136]. Countries producing a high volume of LIB may invest heavily in recycling technology to increase local secondary sources of lithium and avoid the future risk of damping battery chemicals. To achieve recycling goals, private sectors need to step up with a significant effort rather than relying on government institution policies alone.

5. Conclusions

The discussion within this paper provides a better understanding of the dynamic behavior of lithium production, lithium-ion batteries, and electric vehicles towards reducing CO2 emissions from road transportation. It creates the inter-correlation loop for lithium supply based on how the various sections of the whole supply route relate to each other.
Since the electric vehicle industry expanded in 2010, the amount of lithium utilized in battery production has climbed from 23% in 2010 to 74% in 2021, asserting its leading position in the manufacture of lithium-ion batteries. A strong positive correlation coefficient between lithium-ion batteries and EVs (0.99) shows the proportionality of their increase. When EV sales surpassed one million, gasoline vehicle sales began to decline, signaling the steady reduction in CO2 emissions from road transport. It is reaffirmed by the strong negative correlation coefficient –0.95) between EV sales and CO2 from road transport. With rising demand for lithium-ion batteries for electronics and electric vehicles, the lithium required to produce lithium-ion batteries needs to ensure a long-term steady supply, which necessitates boosting secondary lithium sources such as recycling.

Author Contributions

Conceptualization, P.L.; Visualization, P.L.; Writing—original draft, P.L.; Funding acquisition, Y.L. and J.M.; Supervision, Y.L. and G.Y.; Validation: J.M. and G.Y.; Writing—review & editing, P.L., J.M. and G.Y.; Data curation: I.M., A.N. and H.P.K.N.; Formal analysis: I.M.; Methodology, A.N. and H.P.K.N. All authors have read and agreed to the published version of the manuscript.

Funding

This research was funded by the Ministry of Education, Youth, and Sports of Czech Republic through a research grant “SMART technologies to improve the quality of life in cities and regions” (No. CZ.02.1.01/0.0/0.0/17_049/0008452); and the Young Star of Science and Technology Plan Projects in Shaanxi Province, China Grant 2016KJXX-71.

Institutional Review Board Statement

Not applicable.

Informed Consent Statement

Not applicable.

Data Availability Statement

Data is contained within the article.

Acknowledgments

The authors gratefully acknowledge the financial support of the National Nature Science Foundation of China (41303027).

Conflicts of Interest

The authors declare no conflict of interest.

References

  1. Goodenough, J.B.; Park, K. The Li-Ion Rechargeable Battery: A Perspective. J. Am. Chem. Soc. 2013, 135, 1167–1176. [Google Scholar] [CrossRef] [PubMed]
  2. United Nations. United Nations Framework Convention on Climate Change. Available online: https://unfccc.int/process-and-meetings (accessed on 15 September 2022).
  3. Tabelin, C.B.; Dallas, J.; Casanova, S.; Pelech, T.; Bournival, G.; Saydam, S.; Canbulat, I. Towards a low-carbon society: A review of lithium resource availability, challenges and innovations in mining, extraction and recycling, and future perspectives. Miner. Eng. 2021, 163, 106743. [Google Scholar] [CrossRef]
  4. Lindagato, P.; Li, Y.; Yang, G. Save the giants: Demand beyond production capacity of tantalum raw materials. Miner. Econ. 2022. [Google Scholar] [CrossRef]
  5. Winter, M.; Brodd, R.J. What Are Batteries, Fuel Cells, and Supercapacitors? Am. Chem. Soc. 2004, 104, 4245–4269. [Google Scholar] [CrossRef] [Green Version]
  6. Liu, T.; Kim, K.C.; Lee, B.; Chen, Z.; Noda, S.; Jang, S.S.; Lee, S.W. Self-polymerized dopamine as an organic cathode for Li- and Na-ion batteries. Energy Environ. Sci. 2017, 10, 205–215. [Google Scholar] [CrossRef] [Green Version]
  7. Wang, B.G.; Liu, H.; Liu, J.; Qiao, S.; Lu, G.M.; Munroe, P. Mesoporous LiFePO 4/C Nanocomposite Cathode Materials for High Power Lithium Ion Batteries with Superior Performance. Adv. Mater. 2010, 22, 4944–4948. [Google Scholar] [CrossRef]
  8. Yoo, E.; Kim, J.; Hosono, E.; Zhou, H.; Kudo, T.; Honma, I. Large Reversible Li Storage of Graphene Nanosheet Families for Use in Rechargeable Lithium Ion Batteries. Nano Lett. 2008, 8, 2277–2282. [Google Scholar] [CrossRef]
  9. Wu, Z.; Sun, Y.; Tan, Y.; Yang, S.; Feng, X. Three-Dimensional Graphene-Based Macro- and Mesoporous Frameworks for High-Performance Electrochemical Capacitive Energy Storage. J. Am. Chem. Soc. 2012, 134, 19532–19535. [Google Scholar] [CrossRef]
  10. Wu, Z.; Parvez, K.; Feng, X.; Mu, K. Graphene-based in-plane micro-supercapacitors with high power and energy densities. Nat. Commun. 2013, 4, 2487. [Google Scholar] [CrossRef] [Green Version]
  11. Zhong, C.; Deng, Y.; Hu, W.; Qiao, J. A review of electrolyte materials and compositions for electrochemical supercapacitors. Chem. Soc. Rev. 2015, 44, 7484–7539. [Google Scholar] [CrossRef]
  12. Choi, B.G.; Yang, M.; Hong, W.H.; Choi, J.W.; Huh, Y.S. 3D Macroporous Graphene Frameworks for Supercapacitors with High Energy and Power Densities. ACS Nano 2012, 6, 4020–4028. [Google Scholar] [CrossRef] [PubMed]
  13. Fetcenko, M.A.; Ovshinsky, S.R.; Reichman, B.; Young, K.; Fierro, C.; Koch, J.; Zallen, A.; Mays, W.; Ouchi, T. Recent advances in NiMH battery technology. J. Power Sources 2007, 165, 544–551. [Google Scholar] [CrossRef]
  14. Ovshinsky, S.R.; Fetcenko, M.A.; Ross, J. A Nickel Metal Hydride Battery for Electric Vehicles. Science 1993, 260, 176–181. [Google Scholar] [CrossRef] [PubMed]
  15. Sood, P.; Kim, K.C.; Jang, S.S. Electrochemical Properties of Boron-Doped Fullerene Derivatives for Lithium-Ion Battery Applications. ChemPhysChem 2018, 19, 753–758. [Google Scholar] [CrossRef] [PubMed]
  16. Kushnir, D.; Sandén, B.A. The time dimension and lithium resource constraints for electric vehicles. Resour. Policy 2012, 37, 93–103. [Google Scholar] [CrossRef]
  17. Kosai, S.; Takata, U.; Yamasue, E. Natural resource use of a traction lithium-ion battery production based on land disturbances through mining activities. J. Clean. Prod. 2021, 280, 124871. [Google Scholar] [CrossRef]
  18. Vikström, H.; Davidsson, S.; Höök, M. Lithium availability and future production outlooks. Appl. Energy 2013, 110, 252–266. [Google Scholar] [CrossRef] [Green Version]
  19. Yin, W.; Grimaud, A.; Lepoivre, F.; Yang, C.; Tarascon, J.M. Chemical vs. Electrochemical Formation of Li2CO3 as a Discharge Product in Li-O2/CO2 Batteries by Controlling the Superoxide Intermediate. J. Phys. Chem. Lett. 2017, 8, 214–222. [Google Scholar] [CrossRef]
  20. Tarascon, J.; Armand, M. Issues and challenges facing rechargeable lithium batteries. Nature 2001, 414, 359–367. [Google Scholar] [CrossRef]
  21. Van Noorden, R. The rechargeable revolution: A better battery. Nature 2014, 507, 26–28. [Google Scholar] [CrossRef]
  22. Miedema, J.H.; Moll, H.C. Lithium availability in the EU27 for battery-driven vehicles: The impact of recycling and substitution on the confrontation between supply and demand until2050. Resour. Policy 2013, 38, 204–211. [Google Scholar] [CrossRef]
  23. Xie, F.; Czogalla, O.; Naumann, S. Lithium battery model development and application in simulation of the energy consumption of electric bus running. IFAC-PapersOnLine 2020, 53, 14230–14235. [Google Scholar] [CrossRef]
  24. Jaskula, B.W. Mineral Commodity Summary: Lithium; U.S. Geological Survey: Washington, DC, USA, 2017; pp. 100–101. [CrossRef]
  25. Zeng, X.; Li, J.; Liu, L. Solving spent lithium-ion battery problems in China: Opportunities and challenges. Renew. Sustain. Energy Rev. 2015, 52, 1759–1767. [Google Scholar] [CrossRef]
  26. Talens Peiró, L.; Villalba Méndez, G.; Ayres, R.U. Lithium: Sources, production, uses, and recovery outlook. JOM 2013, 65, 986–996. [Google Scholar] [CrossRef] [Green Version]
  27. Gates, B. How to Avoid a Climate Disaster: The Solutions We Have and the Breakthroughs We Need, 1st ed.; Alfred, A. Knopf: New York, NY, USA; Toronto, Canada, 2021; ISBN 9780385546140. [Google Scholar]
  28. Gil-Alana, L.A.; Monge, M. Lithium: Production and estimated consumption. Evidence of persistence. Resour. Policy 2019, 60, 198–202. [Google Scholar] [CrossRef]
  29. Jahangir, H.; Golkar, M.A.; Ahmadian, A.; Elkamel, A. Why Electric Vehicles? In Electric Vehicles in Energy Systems: Modelling, Integration, Analysis, and Optimization; Ahmadian, A., Elkamel, A., Behnam, M., Eds.; Springer Nature: Gewerbestrasse, Switzerland, 2020; p. 392. ISBN 9783030344481. [Google Scholar]
  30. Birol, F. World Energy Outlook; Zoerł, W., Ed.; Global Energy Trends: Paris, France, 2010; ISBN 978 92 64 08624 1. [Google Scholar]
  31. Zeng, W.; Miwa, T.; Morikawa, T. Prediction of vehicle CO2 emission and its application to eco-routing navigation. Transp. Res. Part C 2016, 68, 194–214. [Google Scholar] [CrossRef]
  32. EPA. Impacts of Climate Change. Available online: https://www.epa.gov/climatechange-science/impacts-climate-change (accessed on 8 December 2022).
  33. International Energy Agency. World Energy Outlook; U.S. Geological Survey: Reston, VA, USA, 2013. [Google Scholar]
  34. Wu, Y.; Shi, X.; Hu, C. Per capita CO2 emissions divergence influenced by bilateral trade with china under the belt and road initiative. Sustain. Prod. Consum. 2021, 27, 1589–1601. [Google Scholar] [CrossRef]
  35. Ritchie, H. Global CO2 Emisions from Transport. Available online: https://ourworldindata.org/co2-emissions-from-transport (accessed on 15 October 2022).
  36. Tiseo, I. Distribution of Carbon Dioxide Emissions Produced by the Transportation Sector Worldwide in 2020, by Subsector. Available online: https://www.statista.com/statistics/1185535/transport-carbon-dioxide-emissions-breakdown/ (accessed on 15 October 2022).
  37. Xiao, H.; Zhou, Y.; Zhang, N.; Wang, D.; Shan, Y.; Ren, J. CO2 emission reduction potential in China from combined effects of structural adjustment of economy and efficiency improvement. Resour. Conserv. Recycl. 2021, 174, 105760. [Google Scholar] [CrossRef]
  38. Khaligh, A.; Li, Z. Battery, ultracapacitor, fuel cell, and hybrid energy storage systems for electric, hybrid electric, fuel cell, and plug-in hybrid electric vehicles: State of the art. IEEE Trans. Veh. Technol. 2010, 59, 2806–2814. [Google Scholar] [CrossRef]
  39. Sun, X.; Hao, H.; Zhao, F.; Liu, Z. Tracing global lithium flow: A trade-linked material flow analysis. Resour. Conserv. Recycl. 2017, 124, 50–61. [Google Scholar] [CrossRef]
  40. Martin, G.; Rentsch, L.; Höck, M.; Bertau, M. Lithium market research—Global supply, future demand and price development. Energy Storage Mater. 2017, 6, 171–179. [Google Scholar] [CrossRef]
  41. Jaskula, B.W. Mineral Commodity Summary: Lithium; U.S. Geological Survey: Washington, DC, USA, 2022; pp. 100–101. [CrossRef]
  42. Jaskula, B.W. Mineral Commodity Summary: Lithium; U.S. Geological Survey: Washington, DC, USA, 2011; pp. 94–95. [CrossRef]
  43. Boxall, N.J.; King, S.; Cheng, K.Y.; Gumulya, Y.; Bruckard, W.; Kaksonen, A.H. Urban mining of lithium-ion batteries in Australia: Current state and future trends. Miner. Eng. 2018, 128, 45–55. [Google Scholar] [CrossRef]
  44. Kahl, M.; Pavón, S.; Bertau, M. Recycling of Primary Lithium Batteries Production Residues. ChemPhysChem 2021, 22, 577–584. [Google Scholar] [CrossRef] [PubMed]
  45. Jeppson, D.W.; Ballif, J.L.; Yuan, W.W.; Chou, B. Lithium Literature Review: Lithium’s Properties and Interactions; Engineering Development Laboratory: Richland, WA, USA, 1978. [Google Scholar]
  46. Gratz, E.; Sa, Q.; Apelian, D.; Wang, Y. A closed loop process for recycling spent lithium ion batteries. J. Power Sources 2014, 262, 255–262. [Google Scholar] [CrossRef]
  47. Reddy, M.V.; Mauger, A.; Julien, C.M.; Paolella, A.; Zaghib, K. Brief history of early lithium-battery development. Materials 2020, 13, 1884. [Google Scholar] [CrossRef] [Green Version]
  48. Nelson, P.A.; Webster, W.H.; Shimotake, H. Batteries for Electric Vehicles. New Mater. New Process. 2019, 2, 362–364. [Google Scholar] [CrossRef] [Green Version]
  49. Munk, L.A.; Hynek, S.A.; Bradley, D.C.; Boutt, D.; Labay, K.; Jochens, H. Lithium Brines: A Global Perspective. In Rare Earth and Critical Elements in Ore Deposits; Verplanck, P.L., Hitzman, M.W., Eds.; Society of Economic Geologists: Littleton, CO, USA, 2016; Volume 18, pp. 339–365. ISBN 9781629490922. [Google Scholar]
  50. Risacher, F.; Alonso, H.; Salazar, C. The origin of brines and salts in Chilean salars: A hydrochemical review. Earth-Sci. Rev. 2003, 63, 249–293. [Google Scholar] [CrossRef]
  51. Cabello, J. Lithium brine production, reserves, resources and exploration in Chile: An updated review. Ore Geol. Rev. 2021, 128. [Google Scholar] [CrossRef]
  52. Gruber, P.W.; Medina, P.A.; Keoleian, G.A.; Kesler, S.E.; Everson, M.P.; Wallington, T.J. Global lithium availability: A constraint for electric vehicles? J. Ind. Ecol. 2011, 15, 760–775. [Google Scholar] [CrossRef]
  53. Yu, J.Q.; Gao, C.L.; Cheng, A.Y.; Liu, Y.; Zhang, L.; He, X.H. Geomorphic, hydroclimatic and hydrothermal controls on the formation of lithium brine deposits in the Qaidam Basin, northern Tibetan Plateau, China. Ore Geol. Rev. 2013, 50, 171–183. [Google Scholar] [CrossRef]
  54. Yaksic, A.; Tilton, J.E. Using the cumulative availability curve to assess the threat of mineral depletion: The case of lithium. Resour. Policy 2009, 34, 185–194. [Google Scholar] [CrossRef]
  55. Tahil, W. The Trouble with Lithium: Implications of Future PHEV Production for Lithium Demand; Meridian International Research: Martainville, France, 2007. [Google Scholar]
  56. Yoshizuka, K.; Kitajou, A.; Holba, M. Selective recovery of lithium from seawater using a novel MnO2 type adsorbent III—Benchmark evaluation. ARS Sep. Acta 2006, 4, 78–85. [Google Scholar]
  57. Jaskula, B.W. Mineral Commodity Summaries: Lithium; U.S. Geological Survey: Washington, DC, USA, 2013. [CrossRef]
  58. Kunasz, I.A. Brines Resources and Reserves. Analysis of and Practical Recommendations for CIM’s Publication “Best Practices for Resource and Reserve Estimation for Lithium Brines”. Tucson Arizona, USA. TRU Group. 2013; p. 7. Available online: https://trugroup.com/whitepapers/Kunasz-CIM-Lithium-Best-Practice-TRU-2013-01-25.pdf (accessed on 13 November 2022).
  59. U.S. Geological Survey Mineral Commodity Summaries 1994–2022. Available online: https://www.usgs.gov/centers/national-minerals-information-center/mineral-commodity-summaries (accessed on 20 June 2022).
  60. Jaskula, B.W. 2017 Minerals Yearbook: Lithium; U.S. Geological Survey: Reston, VA, USA, 2020. [Google Scholar]
  61. Goonan, T.G. Lithium Use in Batteries [Circular 1371]; U.S. Geological Survey: Washington, DC, USA, 2012.
  62. Emmanuel, L.; Ben, K. Lithium Supply Is Set to Triple by 2025. Will it Be Enough? Available online: https://www.spglobal.com/en/research-insights/articles/lithium-supply-is-set-to-triple-by-2025-will-it-be-enough (accessed on 21 April 2022).
  63. Ritchie, H.; Roser, M.; Rosado, P. CO2 and Greenhouse Gas Emissions. Available online: https://ourworldindata.org/co2-and-other-greenhouse-gas-emissions (accessed on 23 May 2022).
  64. EPA Global Greenhouse Gas Emissions Data. Available online: https://www.epa.gov/ (accessed on 15 October 2022).
  65. Bamisile, O.; Obiora, S.; Huang, Q.; Yimen, N. Impact of economic development on CO2 emission in Africa: The role of BEVs and hydrogen production in renewable energy integration. Int. J. Hydrogen Energy 2022, 46, 2755–2773. [Google Scholar] [CrossRef]
  66. Tucki, K.; Orynycz, O. Perspectives for Mitigation of CO2 Emission due to Development of Electromobility in Several Countries. Energies 2020, 13, 4127. [Google Scholar] [CrossRef]
  67. Birol, F. World Energy Outlook; International Energy Agency: Paris, France, 2013; ISBN 9789264201309. [Google Scholar]
  68. Canalys Global Electric Vehicle Sales up 109% in 2021, with Half in Mainland China. Available online: https://www.canalys.com/newsroom/global-electric-vehicle-market-2021 (accessed on 21 July 2022).
  69. International Energy Agency. Global EV Outlook: Entering the Decade of Electric Drive; OECD Publishing: Paris, France, 2020. [Google Scholar]
  70. Mandys, F. Electric vehicles and consumer choices. Renew. Sustain. Energy Rev. 2021, 142, 110874. [Google Scholar] [CrossRef]
  71. Muratori, M.; Alexander, M.; Arent, D.; Bazilian, M.; Cazzola, P.; Dede, E.M.; Farrell, J.; Gearhart, C.; Greene, D.; Jenn, A.; et al. The rise of electric vehicles—2020 status and future expectations. Prog. Energy 2021, 3, 022002. [Google Scholar] [CrossRef]
  72. Bernard, M.R.; Hall, D.; Lutsey, N. Update on Electric Vehicle Uptake in European Cities; International Council on Clean Transportation: Washington, DC, USA, 2021. [Google Scholar]
  73. BloombergNEF Electric Vehicle Outlook. 2021. Available online: https://energydata.info/organization/bloomberg-new-energy-finance (accessed on 21 June 2022).
  74. Irle, R. EV Volume Global EV Sales for 2022. Available online: https://www.ev-volumes.com/country/total-world-plug-in-vehicle-volumes/ (accessed on 21 June 2022).
  75. IEA. Global EV Outlook 2021: Accelerating Ambitions Despite the Pandemic; International Energy Agency: Paris, France, 2021. [Google Scholar]
  76. Umwelt Bundesamt Total Greenhouse Gas Emissions Per Year. Available online: https://www.umweltbundesamt.de/en (accessed on 30 April 2022).
  77. Dyatkin, B.; Meng, Y.S. COVID-19 disrupts battery materials and manufacture supply chains, but outlook remains strong. MRS Bull. 2020, 45, 700–702. [Google Scholar] [CrossRef]
  78. Jaskula, B.W. Mineral Commodity Summary: Lithium; U.S. Geological Survey: Washington, DC, USA, 2021. [CrossRef]
  79. Yu, J.J.; Tang, C.S.; Li, M.K.; Shen, Z.J.M. Coordinating Installation of Electric Vehicle Charging Stations between Governments and Automakers. Prod. Oper. Manag. 2022, 31, 681–696. [Google Scholar] [CrossRef]
  80. Tyson, M.; Charlie, B. Breakthrough Batteries: Powering the Era of Clean Electrification. Rocky Mt. Inst. 2019, 2, 1–84. [Google Scholar]
  81. Alice, Y.; Sumangil, M. Top Electric Vehicle Markets Dominate Lithium-Ion Battery Capacity Growth. Available online: https://www.spglobal.com/marketintelligence/en/news-insights/blog/top-electric-vehicle-markets-dominate-lithium-ion-battery-capacity-growth (accessed on 12 February 2022).
  82. Gao, S.; Gong, X.; Liu, Y.; Zhang, Q. Energy consumption and carbon emission analysis of natural graphite anode material for lithium batteries. Mater. Sci. Forum 2018, 913, 985–990. [Google Scholar] [CrossRef]
  83. Xiao, M. General Motors and LG Chem Joint Venture—How Does This Differ From Tesla and Panasonic? Available online: https://www.interactanalysis.com/general-motors-and-lg-chem-joint-venture-how-does-this-differ-from-tesla-and-panasonic/ (accessed on 30 April 2022).
  84. Kromer, M.A.; Heywood, J. Electric Powertrains: Opportunities and Challenges in the US Light-Duty Vehicle Fleet. 2007. Available online: http://hdl.handle.net/1721.1/40372 (accessed on 30 April 2022).
  85. Hacker, F.; Harthan, R.; Matthes, F.; Zimmer, W. Environmental impacts and impact on the electricity market of a large scale introduction of electric cars in Europe: Critical Review of Literature. ETC/ACC Tech. Pap. 2009, 4, 169. [Google Scholar]
  86. Gaines, L.; Nelson, P. Lithium-Ion Batteries: Possible Materials Issues. In Proceedings of the 13th International Battery Materials Recycling Seminar and Exhibit, Argonne, IL, USA, 18 March 2009; U.S. Department of Transportation, Broward County Convention Center: Fort Lauderdale, FL, USA, 2009; pp. 1–16. [Google Scholar]
  87. Paoli, L.; Gül, T. Electric Cars Fend Off Supply Challenges to More than Double Global Sales. Available online: https://www.iea.org/commentaries/electric-cars-fend-off-supply-challenges-to-more-than-double-global-sales?utm_content=bufferd90dd&utm_medium=social&utm_source=twitter.com&utm_campaign=buffer (accessed on 16 March 2022).
  88. Julien, C.; Nazri, G.-A. Solid State Batteries: Materials Design and Optimization, 1st ed.; Springer New York: New York, NY, USA, 1994; ISBN 978-1-4615-2704-6. [Google Scholar]
  89. Jiang, F.; Peng, P. Elucidating the Performance Limitations of Lithium-ion Batteries due to Species and Charge Transport through Five Characteristic Parameters. Sci. Rep. 2016, 6, 32639. [Google Scholar] [CrossRef] [PubMed] [Green Version]
  90. Zhao, D.; Li, S. Regulating the Performance of Lithium-Ion Battery Focus on the Electrode-Electrolyte Interface. Front. Chem. 2020, 8, 821. [Google Scholar] [CrossRef] [PubMed]
  91. Chalk, S.G.; Miller, J.F. Key challenges and recent progress in batteries, fuel cells, and hydrogen storage for clean energy systems. J. Power Sources 2006, 159, 73–80. [Google Scholar] [CrossRef]
  92. Hou, J.; Wang, X.; Su, Y.; Yang, Y.; Gao, T. Parameter Identification of Lithium Battery Model Based on Chaotic Quantum Sparrow Search Algorithm. Appl. Sci. 2022, 12, 7332. [Google Scholar] [CrossRef]
  93. Kavanagh, L.; Keohane, J.; Cabellos, G.G.; Lloyd, A.; Cleary, J. Global lithium sources-industrial use and future in the electric vehicle industry: A review. Resources 2018, 7, 57. [Google Scholar] [CrossRef] [Green Version]
  94. Ziemann, S.; Müller, D.B.; Schebek, L.; Weil, M. Modeling the potential impact of lithium recycling from EV batteries on lithium demand: A dynamic MFA approach. Resour. Conserv. Recycl. 2018, 133, 76–85. [Google Scholar] [CrossRef]
  95. Trading Economics Lithium Carbonate Prices in China. Available online: https://tradingeconomics.com/commodity/lithium (accessed on 25 March 2022).
  96. Corby, S. How Many Electric Cars Are There in the World? Available online: https://www.carsguide.com.au/ev/advice/how-many-electric-cars-are-there-in-the-world-85961 (accessed on 30 April 2022).
  97. Placek, M. Worldwide Motor Vehicle Production 2000–2021. Available online: https://www.statista.com/statistics/262747/worldwide-automobile-production-since-2000/ (accessed on 12 December 2022).
  98. Carlier, M. Motor Vehicle Sales Worldwide 2005–2021. Available online: https://www.statista.com/statistics/265859/vehicle-sales-worldwide/ (accessed on 12 December 2022).
  99. European Commission. European Green Cars Initiative. Available online: http://www.green-cars-initiative.eu/ (accessed on 20 April 2021).
  100. European Commission. Clean Urban Transport. Electric Vehicles. Available online: http://ec.europa.eu/transport/urban/vehicles/%20road/electric_en.htm (accessed on 22 November 2021).
  101. European Commission. Clean Vehicles Directive. Available online: https://transport.ec.europa.eu/transport-themes/clean-transport-urban-transport/clean-and-energy-efficient-vehicles/clean-vehicles-directive_en (accessed on 12 October 2022).
  102. U.S. Geological Survey. Minerals Yearbook: Metals and Minerals; U.S. Geological Survey: Washington, DC, USA, 2010.
  103. Akcil, A.; Sun, Z.; Panda, S. COVID-19 disruptions to tech-metals supply are a wake-up call. Nature 2020, 587, 365–367. [Google Scholar] [CrossRef]
  104. Arroyo, F.A.; Vesin, V.; Menéndez, A.; Bonneau, P.X. The Electrification of Two- and Three-Wheelers in the Sahel—Four Questions to Understand (and Guide) the Transition. Available online: https://blogs.worldbank.org/transport/electrification-two-and-three-wheelers-sahel-four-questions-understand-and-guide (accessed on 8 December 2022).
  105. Maddumage, W.; Perera, M.; Attalage, R.; Kelly, P. Power management strategy of a parallel hybrid three-wheeler for fuel and emission reduction. Energies 2021, 14, 1833. [Google Scholar] [CrossRef]
  106. Astute Analytica. Global Electric Two & Three-Wheeler Market, by Vehicle Type, by Usage, by End-User, Estimation & Forecast, 2017–2030; Research and Markets: Dublin, Ireland, 2022. [Google Scholar]
  107. Reference revised as Majumdar, D.; Jash, T. Merits and Challenges of E-Rickshaw as An Alternative form of Public Road Transport System: A Case Study in the State of West Bengal in India. Energy Procedia 2015, 79, 307–314. [Google Scholar] [CrossRef] [Green Version]
  108. Chen, Z.; Mi, C.C.; Xu, J.; Gong, X.; You, C. Energy management for a power-split plug-in hybrid electric vehicle based on dynamic programming and neural networks. IEEE Trans. Veh. Technol. 2014, 63, 1567–1580. [Google Scholar] [CrossRef]
  109. McKerracher, C.; O’Donovan, A.; Soulopoulos, N.; Grant, A.; Mi, S.; Doherty, D.; Fisher, R.; Cantor, C.; Lyu, J.; Ampofo, K.; et al. Electric Vehicle Outlook 2022. BloombergNEF 2022, 38, 1–11. [Google Scholar]
  110. Coltura Gasoline Vehicle Phase-Out Advances around the World. Available online: https://www.coltura.org/world-gasoline-phaseouts (accessed on 7 December 2022).
  111. Wu, Q.; Sun, S. Energy and Environmental Impact of the Promotion of Battery Electric Vehicles in the Context of Banning Gasoline Vehicle Sales. Energies 2022, 15, 8388. [Google Scholar] [CrossRef]
  112. IEA. Global EV Outlook 2018—Towards Cross-Modal Electrification; International Energy Agency: Paris, France, 2018. [Google Scholar]
  113. Murray, A. Will swapping out electric car batteries catch on? BBCNews 2022, 11, 78. [Google Scholar]
  114. Zheng, Y.; Dong, Z.Y.; Xu, Y.; Meng, K.; Zhao, J.H.; Qiu, J. Electric vehicle battery charging/swap stations in distribution systems: Comparison study and optimal planning. IEEE Trans. Power Syst. 2014, 29, 221–229. [Google Scholar] [CrossRef]
  115. Zeng, B.; Luo, Y.; Zhang, C.; Liu, Y. Assessing the impact of an EV battery swapping station on the reliability of distribution systems. Appl. Sci. 2020, 10, 8023. [Google Scholar] [CrossRef]
  116. Hanley, S. NIO Completes More Than 500,000 Battery Swaps. Available online: https://cleantechnica.com/2020/05/31/nio-completes-more-than-500000-battery-swaps/ (accessed on 28 November 2022).
  117. Adegbohun, F.; von Jouanne, A.; Lee, K.Y. Autonomous battery swapping system and methodologies of electric vehicles. Energies 2019, 12, 667. [Google Scholar] [CrossRef] [Green Version]
  118. Toll, M. Gogoro Named Global Leader in Light Electric Vehicle Battery Swapping, Passes 200 Million Swaps. Available online: https://electrek.co/2021/08/30/gogoro-named-global-leader-in-light-electric-vehicle-battery-swapping-passes-200-million-swaps/ (accessed on 28 November 2022).
  119. Zhong, L.; Pei, M. Optimal design for a shared swap charging system considering the electric vehicle battery charging rate. Energies 2020, 13, 1213. [Google Scholar] [CrossRef] [Green Version]
  120. Feil, C. What is EV Range Anxiety and how Can We Overcome It? Available online: https://www.geotab.com/blog/range-anxiety/ (accessed on 29 November 2022).
  121. Zeng, X.; Li, J.; Singh, N. Recycling of spent lithium-ion battery: A critical review. Crit. Rev. Environ. Sci. Technol. 2014, 44, 1129–1165. [Google Scholar] [CrossRef]
  122. Alfaro-Algaba, M.; Ramirez, F.J. Techno-economic and environmental disassembly planning of lithium-ion electric vehicle battery packs for remanufacturing. Resour. Conserv. Recycl. 2020, 154, 104461. [Google Scholar] [CrossRef]
  123. Anju, M.; Banerjee, D.K. Associations of cadmium, zinc, and lead in soils from a lead and zinc mining area as studied by single and sequential extractions. Environ. Monit. Assess. 2011, 176, 67–85. [Google Scholar] [CrossRef]
  124. Winslow, K.M.; Laux, S.J.; Townsend, T.G. A review on the growing concern and potential management strategies of waste lithium-ion batteries. Resour. Conserv. Recycl. 2018, 129, 263–277. [Google Scholar] [CrossRef]
  125. Silwamba, M.; Ito, M.; Hiroyoshi, N.; Tabelin, C.B.; Fukushima, T.; Park, I.; Jeon, S.; Igarashi, T.; Sato, T.; Nyambe, I.; et al. Detoxification of lead-bearing zinc plant leach residues from Kabwe, Zambia by coupled extraction-cementation method. J. Environ. Chem. Eng. 2020, 8, 104197. [Google Scholar] [CrossRef]
  126. Silwamba, M.; Ito, M.; Hiroyoshi, N.; Tabelin, C.B. Recovery of Lead and Zinc from Zinc Plant Leach Residues by Concurrent Dissolution-Cementation. Metals 2020, 10, 531. [Google Scholar] [CrossRef] [Green Version]
  127. Christmann, P.; Gloaguen, E.; Labbé, J.F.; Melleton, J.; Piantone, P. Global Lithium Resources and Sustainability Issues. In Lithium Process Chemistry: Resources, Extraction, Batteries, and Recycling; Chagnes, A., Światowska, J., Eds.; Elsevier: San Diego, CA, USA, 2015; pp. 1–40. ISBN 9780128014172. [Google Scholar]
  128. Casals, L.C.; García, B.A.; Aguesse, F.; Iturrondobeitia, A. Second life of electric vehicle batteries: Relation between materials degradation and environmental impact. Int. J. Life Cycle Assess. 2017, 22, 82–93. [Google Scholar] [CrossRef]
  129. Department of Industry, Science and Resources. Resources and Energy Quarterly. Available online: https://www.industry.gov.au/publications/resources-and-energy-quarterly (accessed on 26 November 2022).
  130. Reck, B.K.; Graedel, T.E. Challenges in metal recycling. Science 2012, 337, 690–695. [Google Scholar] [CrossRef] [PubMed]
  131. Metalary Lithium Price. Available online: https://www.metalary.com/lithium-price/ (accessed on 28 November 2022).
  132. Batteries News Lithium Price Forecast: Will The Price Keep its Bull Run? Available online: https://batteriesnews.com/lithium-price-forecast-price-keep-bull-run/ (accessed on 28 November 2022).
  133. Castelvecchi, D. Electric cars and batteries: How will the world produce enough? Nature 2021, 596, 336–339. [Google Scholar] [CrossRef] [PubMed]
  134. Song, J.; Yan, W.; Cao, H.; Song, Q.; Ding, H.; Lv, Z.; Zhang, Y.; Sun, Z. Material flow analysis on critical raw materials of lithium-ion batteries in China. J. Clean. Prod. 2019, 215, 570–581. [Google Scholar] [CrossRef]
  135. Financial Times Electric Cars: China Powers the Battery Supply Chain. Available online: https://www.ft.com/content/455fe41c-7185-11e9-bf5c-6eeb837566c5 (accessed on 21 June 2022).
  136. Gmar, S.; Muhr, L.; Lutin, F.; Chagnes, A. Lithium-Ion Battery Recycling: Metal Recovery from Electrolyte and Cathode Materials by Electrodialysis. Metals 2022, 12, 1859. [Google Scholar] [CrossRef]
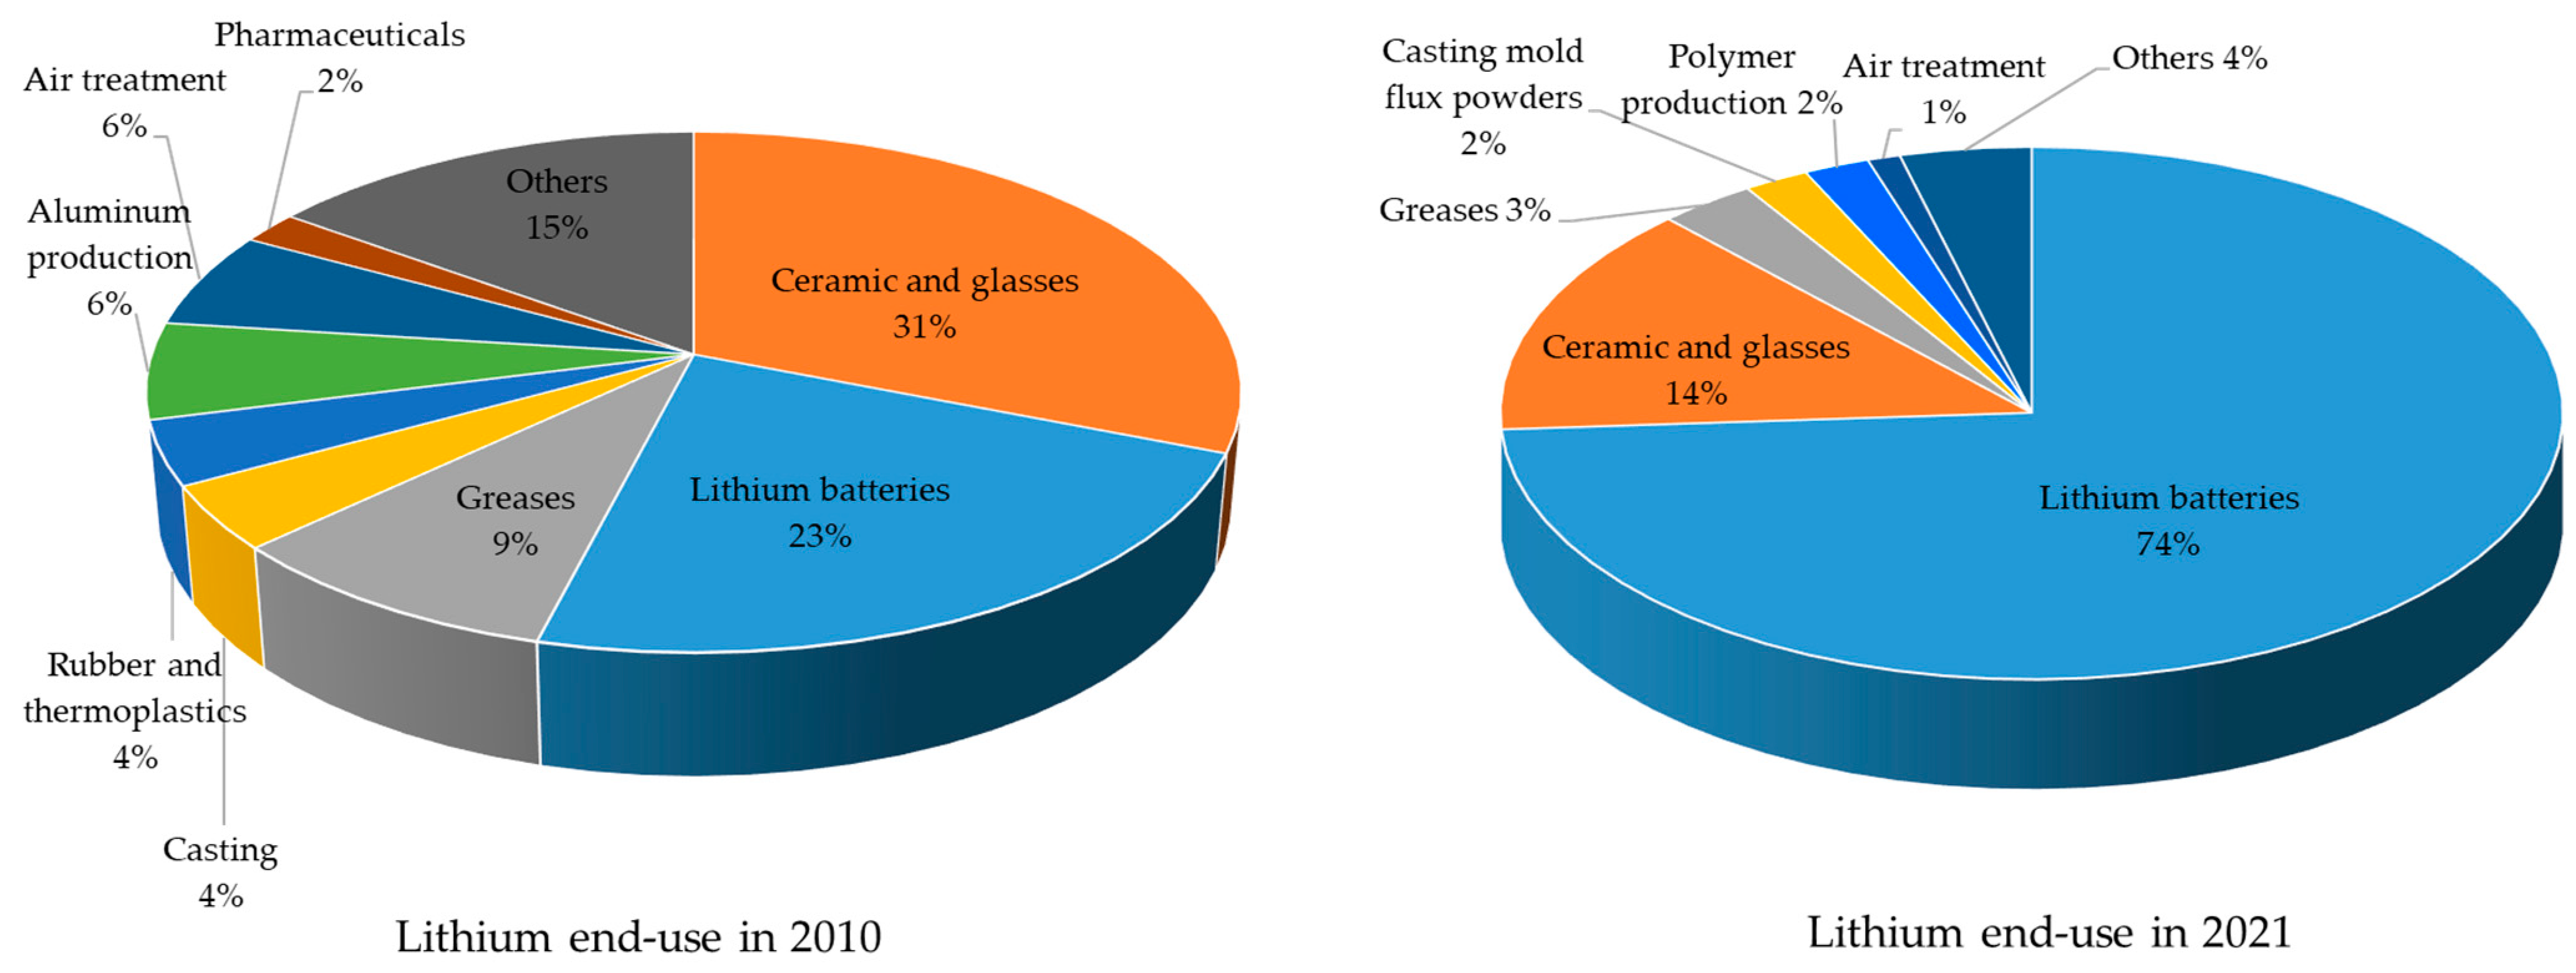
Figure 1. Transportation carbon emissions by sub-sectors. Data from [35,36].
Applsci 13 00405 g001
Figure 2. Main applications of lithium.
Applsci 13 00405 g002
Figure 3. The simplified scenario of lithium to electric vehicles.
Applsci 13 00405 g003
Figure 4. Conceptual research design.
Applsci 13 00405 g004
Figure 5. Relationship between element compositions of the EV manufacturing cycle. Numbers indicate the correlation coefficient between parameters.
Applsci 13 00405 g005
Figure 6. Closed loop of lithium supply chain and its transformation toward EVs.
Applsci 13 00405 g006
Figure 7. Trends of Lithium production (102), resources (105), and reserves (105) between 1994 and 2021.
Applsci 13 00405 g007
Figure 8. Scatter diagram showing the correlation between global lithium-ion batteries, global lithium raw materials, and global charging stations.
Applsci 13 00405 g008
Figure 9. Scatter diagram of correlation between electric vehicle stock, electric vehicle sales, and CO2 emission from road transport.
Applsci 13 00405 g009
Figure 10. The trend of global lithium-ion batteries and electric vehicles in the last decade. Data from [72,83,87].
Applsci 13 00405 g010
Figure 11. Lithium ions flow from the anode to the cathode and push electrons to flow within outside circuit. The electric vehicle charges in the reverse process. Adapted from [89,90].
Applsci 13 00405 g011
Figure 12. The availability of lithium and electric vehicle sales by countries in 2021. This figure presents round numbers of countries greater than 2% excluding the United States production. Data from [40,67].
Applsci 13 00405 g012
Figure 13. Electric vehicles vs. gasoline vehicles.
Applsci 13 00405 g013
Figure 14. The annual trends of electric vehicle stock, electric vehicle sales, CO2 emission from road transport, Lithium production, Lithium-ion battery, and charging stations.
Applsci 13 00405 g014
Table 1. Applications of different Lithium-ion batteries. Adapted from [43,46].
TypeApplicationsEstimated Global Market Share (%)
Primary Lithium They are single-use LIB for electronics, that range from button cells to car batteries.n/a
Lithium cobalt oxide (LiCoO2)They have the high energy storage density required for portable electronics. Thus, used in portable electronic devices (e.g., phones, laptops, tablets, cameras, etc.).37.2
Lithium nickel manganese cobalt oxide (NMC) (LiNiMnCoO2)They are used in power tools, EVs, energy storage, and medical devices.29
Lithium manganese oxide (LiMn2O4)It has a shorter life than others and has a high discharge or recharge with better thermal stability. It is used in power tools, EVs, and medical devices. 21.4
Lithium nickel oxide (LiNiO2) They are used in EVs.7.2
Lithium iron phosphate (LiFePO4)Not thermally stable as other cathodes. They are used in energy storage tools, EVs, and medical devices5.2
Table 2. Types of electric vehicles based on battery technology. Data from [29].
Types of Electric VehiclesDescriptions
All-electric VehiclesAll-electric vehicles are the first generation of EVs that use the energy stored in batteries to power electric motors and provide propulsion power. They are called non-polluting vehicles or zero pollution vehicles. They are plug-in electric vehicles (PEVs). Although they have the advantage of being charged to the power grid either at home or in public places, their batteries are of limited capacity and cannot run long distances. They do not give off any greenhouse gases at all and can be charged with energy from renewable sources.
Hybrid Electric Vehicles (HEVs)They have both a fuel engine and an electric motor. Their battery capacity is sufficient to save energy from the fuel engine and brakes. About 1.5 million HEVs have been sold in the last decade. However, they are dependent on the fossil fuel consumption engine.
Plug-in Hybrid Electric Vehicles (PHEVs)They are combinations of Hybrid Electric Vehicles (HEVs) and All-Electric Vehicles. Their batteries require more capacity than HEVs because they are rechargeable from the power grid. The PHEV battery must be capable of fast discharge and fast recharge. It is therefore possible to travel longer distances.
Table 3. Main lithium-bearing minerals that have greater lithium content by countries. Adapted from [18].
CountryMain MineralFormulaLithium Content (%)
AfghanistanspodumeneLiAlSi2O63.73
AustraliaspodumeneLiAlSi2O63.73
AustriaspodumeneLiAlSi2O63.73
BrazilePetaliteLiAlSi4O102.09
spodumeneLiAlSi2O63.73
CanadaspodumeneLiAlSi2O63.73
pegmatitesUnspecified0.49
petaliteLiAlSi4O102.09
ChinaLepidoliteKLi2Al(Al,Si)3O10(F,OH)23.58
spodumeneLiAlSi2O63.73
petaliteLiAlSi4O102.09
DRCspodumeneLiAlSi2O63.73
FinlandspodumeneLiAlSi2O63.73
MaliAmblygonite(Li,Na)AlPO4(F,OH)3.44
PortugalPetaliteLiAlSi4O102.09
NamibiaPetaliteLiAlSi4O102.09
Russiapegmatitesnot specified0.49
LepidoliteKLi2Al(Al,Si)3O10(F,OH)23.58
spodumeneLiAlSi2O63.73
SerbiaJadariteLiNaSiB3O7(OH)3.16
SpainLepidoliteKLi2Al(Al,Si)3O10(F,OH)23.58
SwedenspodumeneLiAlSi2O63.73
USAspodumeneLiAlSi2O63.73
pegmatitesNot specified0.49
HectoriteNa0.3(Mg,Li)3Si4O10(OH)20.53
ZimbabwepegmatitesNot specified0.49
spodumeneLiAlSi2O63.73
Table 4. Correlation coefficients of parameters involved in the lithium-EV simplified supply channel. LRM: Lithium Raw Materials, CS: Charging Stations, LIB: Lithium-ion Batteries, EV: Electric Vehicle, CO2: Carbon dioxide emitted from road transport.
ParametersLRMCSLIBEV SalesEV StockCO2
LRM1
CS0.841
LIB0.890.981
EV sales0.910.990.991
EV Stock0.881.000.990.991
CO2−0.80−0.98−0.96−0.96−0.971
Table 5. Pearson correlation of mines effect group at a significant level of 0.01.
ParametersLithium ProductionLithium ResourcesLithium Reserves
Lithium Production1
Lithium Resources0.9581
Lithium Reserves0.870.9591
Disclaimer/Publisher’s Note: The statements, opinions and data contained in all publications are solely those of the individual author(s) and contributor(s) and not of MDPI and/or the editor(s). MDPI and/or the editor(s) disclaim responsibility for any injury to people or property resulting from any ideas, methods, instructions or products referred to in the content.