Article

Demonstration of Fat Properties in Diagnostic Ultrasound Images through the Development of a Modular Phantom

1
Department of Radiological Science, Daegu Catholic University, Gyeongsan-si 38430, Republic of Korea
2
Medical Metrology Team, Korea Research Institute of Standards and Science (KRISS), Daejeon 34113, Republic of Korea
*
Authors to whom correspondence should be addressed.
Appl. Sci. 2023, 13(1), 432; https://doi.org/10.3390/app13010432
Submission received: 7 November 2022 / Revised: 13 December 2022 / Accepted: 27 December 2022 / Published: 29 December 2022

Abstract

:
The proportion of fat content in the body is important in the classification and grading of disease. In a clinical situation, the image characteristics of adipose tissue are used as information in diagnosing disease. Therefore, the imaging characteristics of adipose tissue on ultrasound images should be understood in a comprehensive manner. In this study, we describe the imaging characteristics of adipose tissue using ultrasound phantoms representing three different fat fractions. The three fat fractions were 0%, 40%, and 80%, and the phantoms consisted of agarose gel containing either distilled water or one of two emulsions. To characterize the fat content, the gel phantoms were scanned using an Accuvix V10 ultrasound system. Both the brightness of the ultrasound image and the attenuation of the ultrasound echo increased with increasing fat content. Deep structures could not be observed clearly in areas with high fat content. Both pure water and fat appeared to be echo-free. Pure water displayed acoustic enhancement, while fat displayed acoustic shadowing. However, the emulsion appeared to be hyperechoic because of the difference in acoustic impedance between water and fat. The results show that well-characterized fat fraction images can potentially be used to understand the characteristics of adipose tissue human body on ultrasound.

1. Introduction

Adipose tissue is a connective tissue composed mostly of fat cells that plays an important role in absorbing body heat as a buffer and as an insulating layer under the skin [1]. Adipose tissue also helps to regulate glucose, cholesterol, and hormone metabolism. A healthy person’s total body weight has a fat content of approximately 20–25% [2].
Although a certain amount of adipose tissue is beneficial to the body, an excessive amount leads to obesity, which increases the risk of developing type 2 diabetes [3]. Non-alcoholic fatty liver disease (NAFLD), which is associated with type 2 diabetes, is becoming increasingly common, affecting approximately 20% of the general population [4]. NAFLD is associated with metabolic comorbidities such as cardiovascular disease, hypertension, and hyperlipidemia. Some groups of people with NAFLD are more likely to develop a higher stage of liver fibrosis or non-alcoholic steatohepatitis [5]. These diseases increase liver-related morbidity and mortality, leading to a higher risk of cirrhosis; liver failure; and, occasionally, liver cancer [6].
An early diagnosis of steatosis is critical if the patient is to recover [7]. There are various methods for quantitatively diagnosing steatosis, such as liver biopsy and ultrasound imaging [8,9,10,11,12,13]. A liver biopsy is a representative evaluation method for diagnosing steatosis. However, it is an invasive procedure, which can have side effects such as pain, bleeding, infection, and even death in rare cases [8,11]. Furthermore, it is affected by sampling variability due to small tissue samples [9]. Because of these limitations, non-invasive methods have been proposed as potential diagnostic alternatives with different sensitivities and accuracies [12].
As a non-invasive evaluation method, ultrasound imaging is widely used for diagnosing steatosis [11,13]. From both a convenience and economic perspective, ultrasound can be the primary diagnostic tool for diagnosing NAFLD since it allows for not only the evaluation of hepatic steatosis but also a comprehensive study of other abdominal organs [12,14]. In a healthy liver, intrahepatic blood vessels are clearly distinguishable on an ultrasound image, and the posterior aspect of the liver is well delineated. The liver parenchyma is uniform and appears brighter than the kidney parenchyma. In a fatty liver, however, the echo of the liver parenchyma increases, which makes it difficult to observe the deeper portions [11,15]. In addition, intrahepatic blood vessels in a fatty liver are not always clearly distinguishable.
However, it is difficult to understand the characteristics of a fatty liver because of complicated factors from the structure of the human body. For instance, the intensity of the high echo changes depending on the fat content ratio, and the fat may appear as a low echo rather than a high echo in an ultrasound image as a result of the surrounding anatomical and physiological influences [16,17]. Despite the differences in the characteristics of ultrasound images depending on fat content and anatomical characteristics, previous studies have attempted to analyze the ultrasound image characteristics of fat content throughout the human body [15,18,19].
In this study, we developed a module phantom to visualize and qualitatively evaluate the unique ultrasound image characteristics for different fat contents. A fat-mimicking material was prepared to demonstrate fat properties in the ultrasound image according to the fat content. Generally, the ultrasound images depend on the level of training and experience of the sonographer because the transducer is held by hand during ultrasound scanning. In this study, fat-mimicking materials and ultrasound probes were fixed to a LEGO-compatible module frame for reproducibility. Based on our results, ultrasound images of varying fat content can be reproduced using our module phantom, which can then be used to understand its characteristics.

2. Materials and Methods

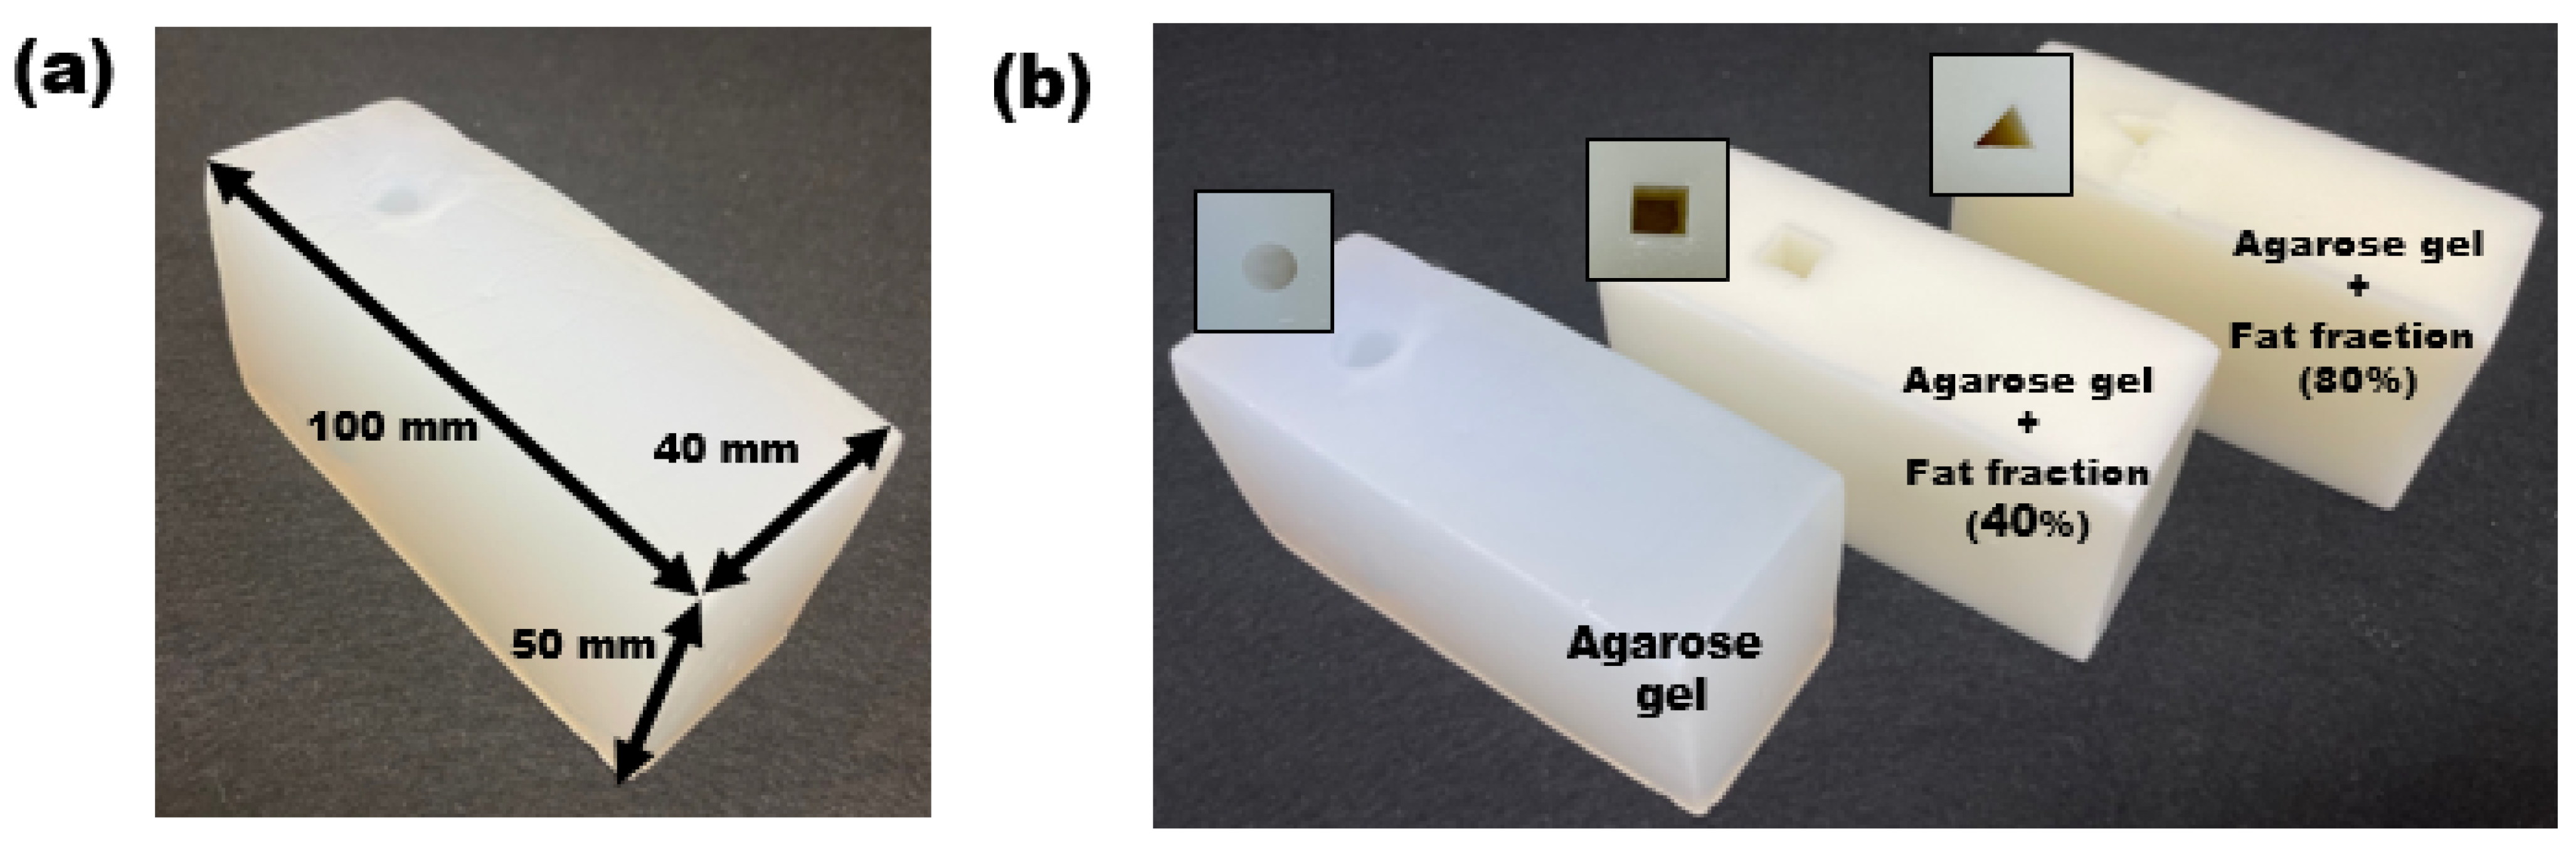
2.1. Fabrication of the Emulsion Phantom

The emulsion phantom, which was based on agarose gel, was constructed with a 40 and 80 weight% (w%) oil fraction. The oil used was grapeseed oil, which has a lipid profile similar to that of human fat, can mimic adipose tissue, has high purity, and is relatively cheap [20]. To prepare the agarose phantom without an oil fraction, 2% w/v agarose gel (Sigma-Aldrich, Saint Louis, MO) was poured into 240 mL of deionized, demineralized water, and the mixture was stirred with a magnetic stirrer on a hotplate (PC-420D, Corning, NY, USA) at 260 rpm and 260 °C for 25 min. To prepare the 40% and 80% emulsion phantoms, 2% w/v agarose gel (Sigma-Aldrich, Saint Louis, MO, USA) and 20% w/v emulsions were poured into 200 mL of deionized, demineralized water, and the mixtures were stirred with a magnetic stirrer on a hot plate (PC-420D, Corning, NY, USA) at 280 rpm and 280 °C for 30 min. Since the emulsions were not fully mixed at this point, they were further stirred at 400 rpm for 20 min. The gel-type emulsion phantom is 40 mm in width, 100 mm in length, and 50 mm in height, as shown in Figure 1a. The brick-type gel phantoms appear milky as the oil proportion increases. The circular-shaped phantom is composed of agarose gel with 0% fat content, and the square-shaped and triangular-shaped phantoms have 40% and 80% fat content, respectively (Figure 1b).

2.2. MRI Image Acquisition for Phantom Verification

The oil content of the emulsified phantoms was validated using magnetic resonance imaging (MRI), as shown in Figure 2. Oil-rich objects appear bright in T1-weighted images. An MRI scanner can also suppress the oil signal through fat-suppression technology. The phantom imaging was performed by using a 3-T MAGNETOM Skyra MRI scanner (Siemens Medical Solutions, Erlangen, Germany) with a 64-channel Head and Neck RF Coil. The scanner bore size was 70 cm. The 2D spin echo, T1, and fat-suppression T1 images were obtained using the following imaging parameters: TR = 650 ms, TE = 6.9 ms, matrix size = 384 × 384, FOV = 192 mm × 192 mm, flip angle = 70°, and slice thickness = 5 mm.

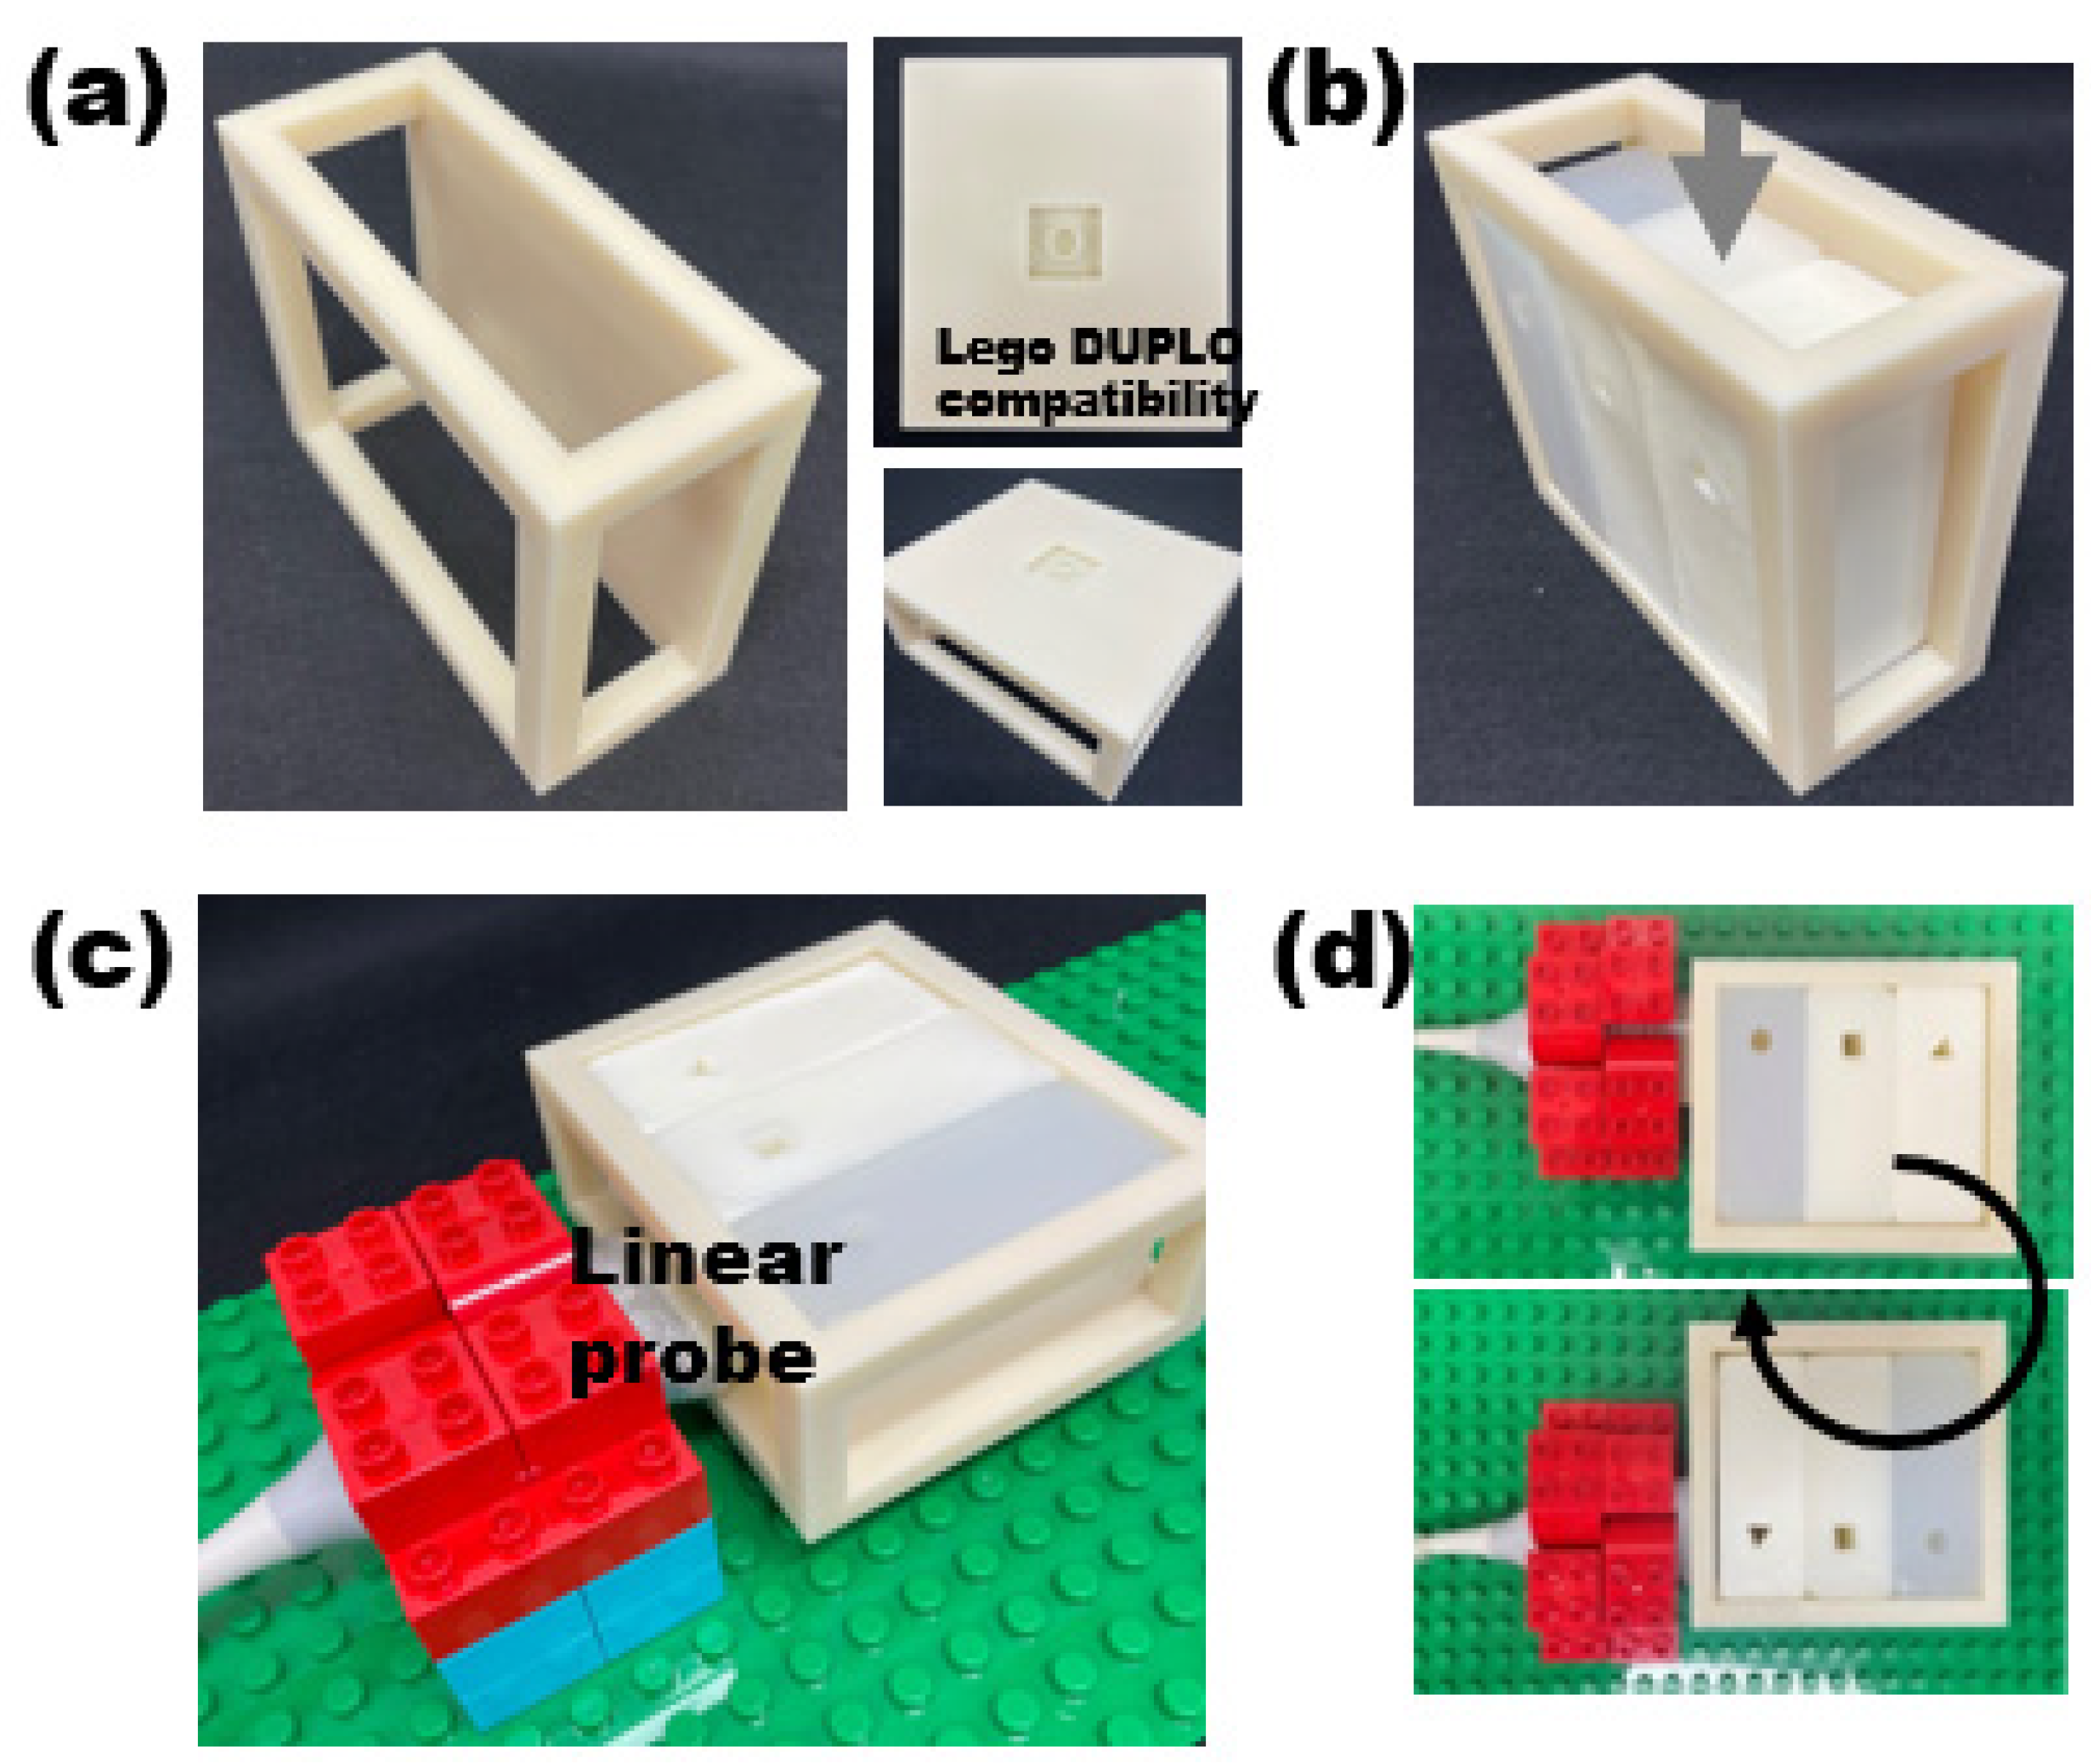
2.3. LEGO-Compatible Modular Frame for Reproducible Image Acquisiton

We developed a LEGO-compatible modular frame to minimize the effect of transducer movement on image acquisition and reproducibly demonstrate fat properties in ultrasound images as shown in Figure 3a. The modular frame is designed to be compatible with LEGO DUPLO, and the LEGO-compatible module frame is made in an open type so that the gel phantom can be easily inserted and disassembled and can be scanned freely from various directions. Figure 3b shows that one agarose phantom and two emulsion phantoms were inserted into the module frame. The scanning was performed by fixing the linear probe with LEGO bricks. After securing the probe, the phantom can assemble to the LEGO plate using a stud-and-tube coupling system, as shown in Figure 3c,d. The strong interlocking bricks reduce the geometric variation between the probe and phantom during ultrasound scanning. The LEGO-compatible module frame was made of ABS (Acrylonitrile butadiene styrene) material; the inner diameter of the frame was 120 mm in width, 100 mm in length, and 40 mm in height; and the outer diameter was 140 mm in width, 120 mm in length, and 60 mm in height.

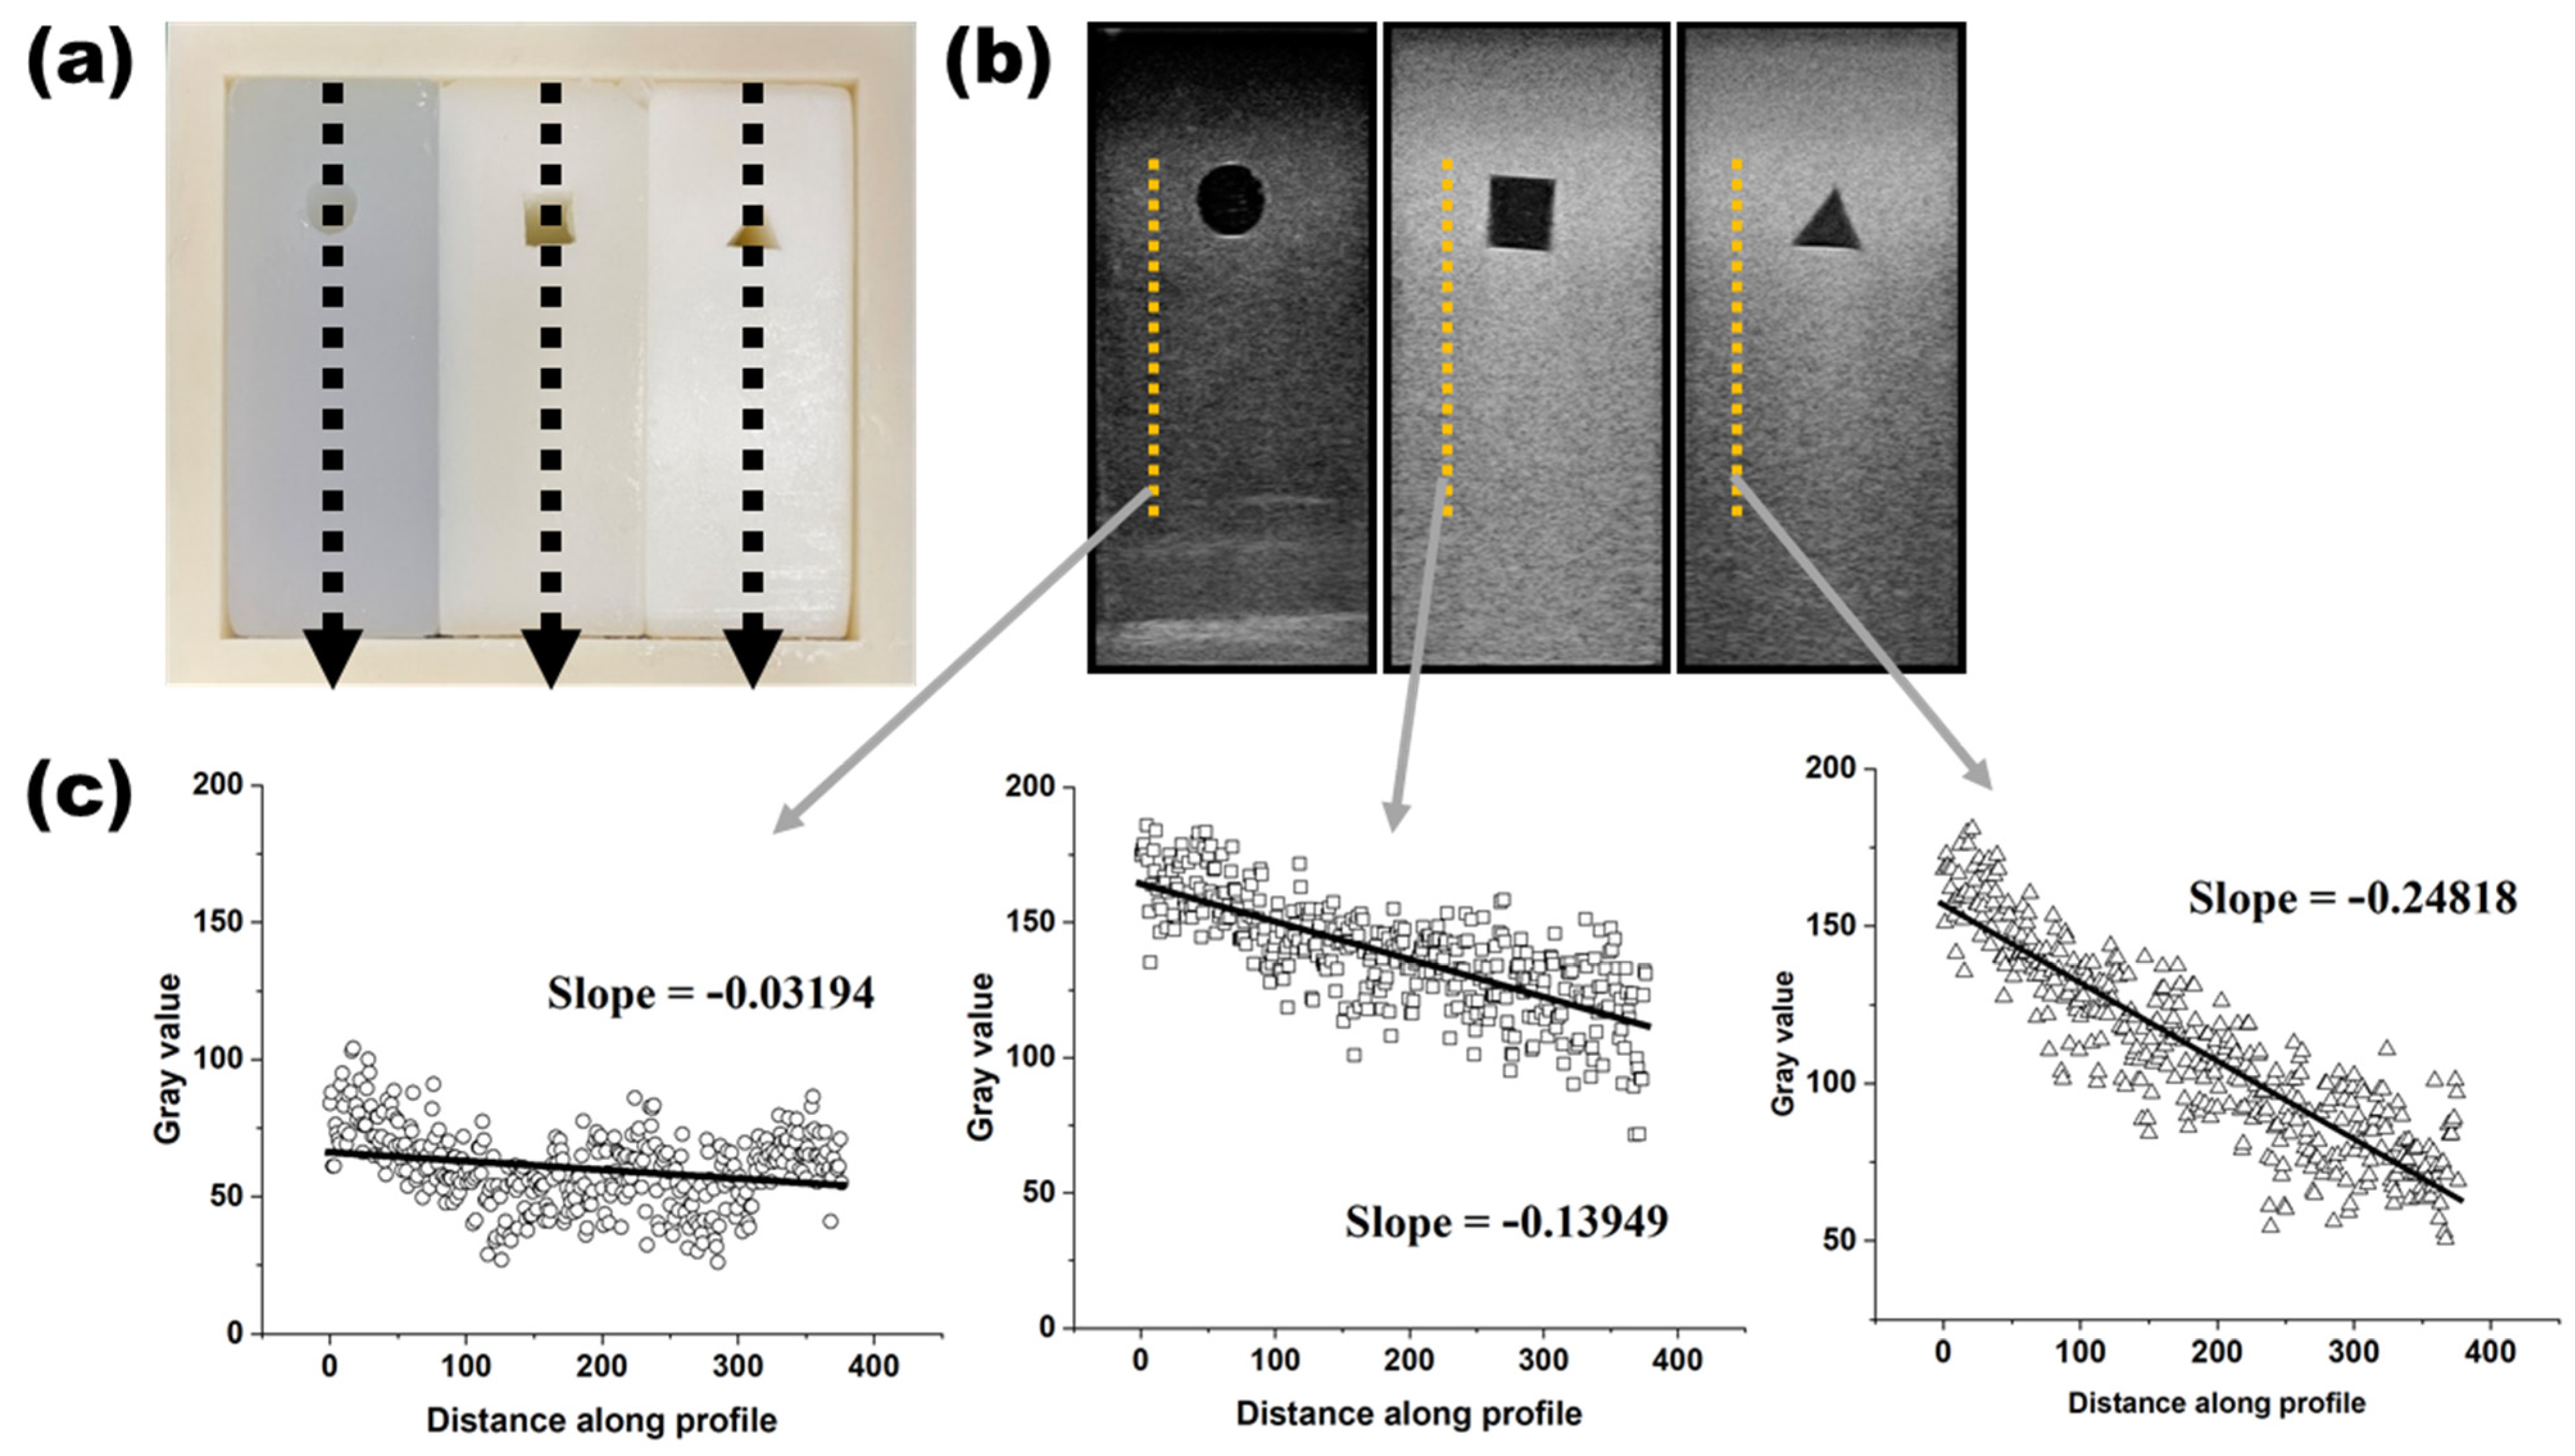
2.4. Acquisition of Ultrasound Image and Analysis

The experiment was carried out using a standard sonographic technique with a linear transducer with a frequency of 5–12 MHz on an Accuvix V10 ultrasound diagnostic system (Samsung Medison, Seoul, South Korea). The width size of the transducer is 48 mm, and the ultrasound image was scanned with a maximum depth of 90 mm, a gain of 53, and a dB of 105. Time-gain compensation (TGC) were constantly maintained during image acquisition. The circular, rectangular, and triangle holes were filled with water. Based on the agarose phantom, the image intensity attenuation was analyzed according to the oil content.
After each phantom was scanned, a line profile was obtained from the resulting image. The line profile is set to the lateral side in order to avoid the central region acoustic enhancement artifact. The level of image degradation depending on the oil content was also analyzed by comparing the ultrasound images scanned after setup, as shown in Figure 3d.

3. Results

In this study, MRI scans were performed in order to prove the validity of the fabricated phantom and to confirm that the fat content was properly distributed (Figure 2). T1-weighted images (Figure 2b) become brighter as fat content increases. By contrast, T1-weighted images with fat-suppression (Figure 2c) become darker with increasing fat content.
By combining fat-mimicking material into a LEGO-compatible module frame, the phantom was built with an open frame, allowing for scans from all directions, and for multiple perspectives (Figure 3).
Figure 4 shows the images obtained by arranging the verified phantoms side-by-side on the module frame and then scanning them with ultrasound. The black dotted line shows the direction in which the ultrasound beam is transmitted (Figure 4a). Brightness increased when the fat content was 40% and 80% than when the fat content was 0% (Figure 4b). Additionally, in the plot profile analysis, it can be seen that the gradient of the straight line becomes steeper as fat content increases, and attenuation occurs more often. The yellow dotted line is the line profile, which was set laterally to avoid posterior acoustic enhancement artifacts in the center.
Figure 5 explains the attenuation. When the ultrasonic beam transmitted a high fat content of 80% (Figure 5d), the beam attenuation was increased more than in the lower fat content or the 0% fat content (Figure 5b). Therefore, the visibility of the rectangular part decreased more in Figure 5d than in Figure 5b.
Figure 6 shows that the characteristics shown in the image are significantly different depending on which materials were injected into the round, square, and triangular shapes. In Figure 6, the white arrows indicate posterior acoustic enhancement. Figure 6a was injected with water. It showed relatively lower attenuation than the surrounding materials, and posterior acoustic enhancement characteristics were visible. On the other hand, oil exhibited relatively higher attenuation than the surrounding materials due to its absorbing properties of sound waves, as shown in Figure 6b. Since this difference in acoustic impedance increases reflection and decreases transmission, the beam barely reaches the back of the structure. This characteristic is known as the posterior acoustic shadow and can be seen in the oil below.
Figure 7 compared the echo characteristics by injecting water, oil, and the emulsified substance, which is a mixture of water and oil, into a circular shape part. Water and oil showed no echo [21], but the emulsified substances appeared hyperechoic since the water and oil mixed in emulsified substances increase the internal interface [22]. The hyperechoic signal is received by the transducer because more scattering is generated compared with the surrounding tissue. This shows that emulsions, as diffuse reflectors, cause the ultrasound waves to scatter.

4. Discussion

A modular phantom was developed to visualize and evaluate the unique ultrasound image characteristics of differing fat content. The characteristics of adipose tissue in ultrasound, which is typically seen in the organs of the human body, were seen through our phantom. We noticed that:
(1)
The brightness and attenuation of fat content in the phantom were similar to those seen in mild, moderate, and severe fatty livers;
(2)
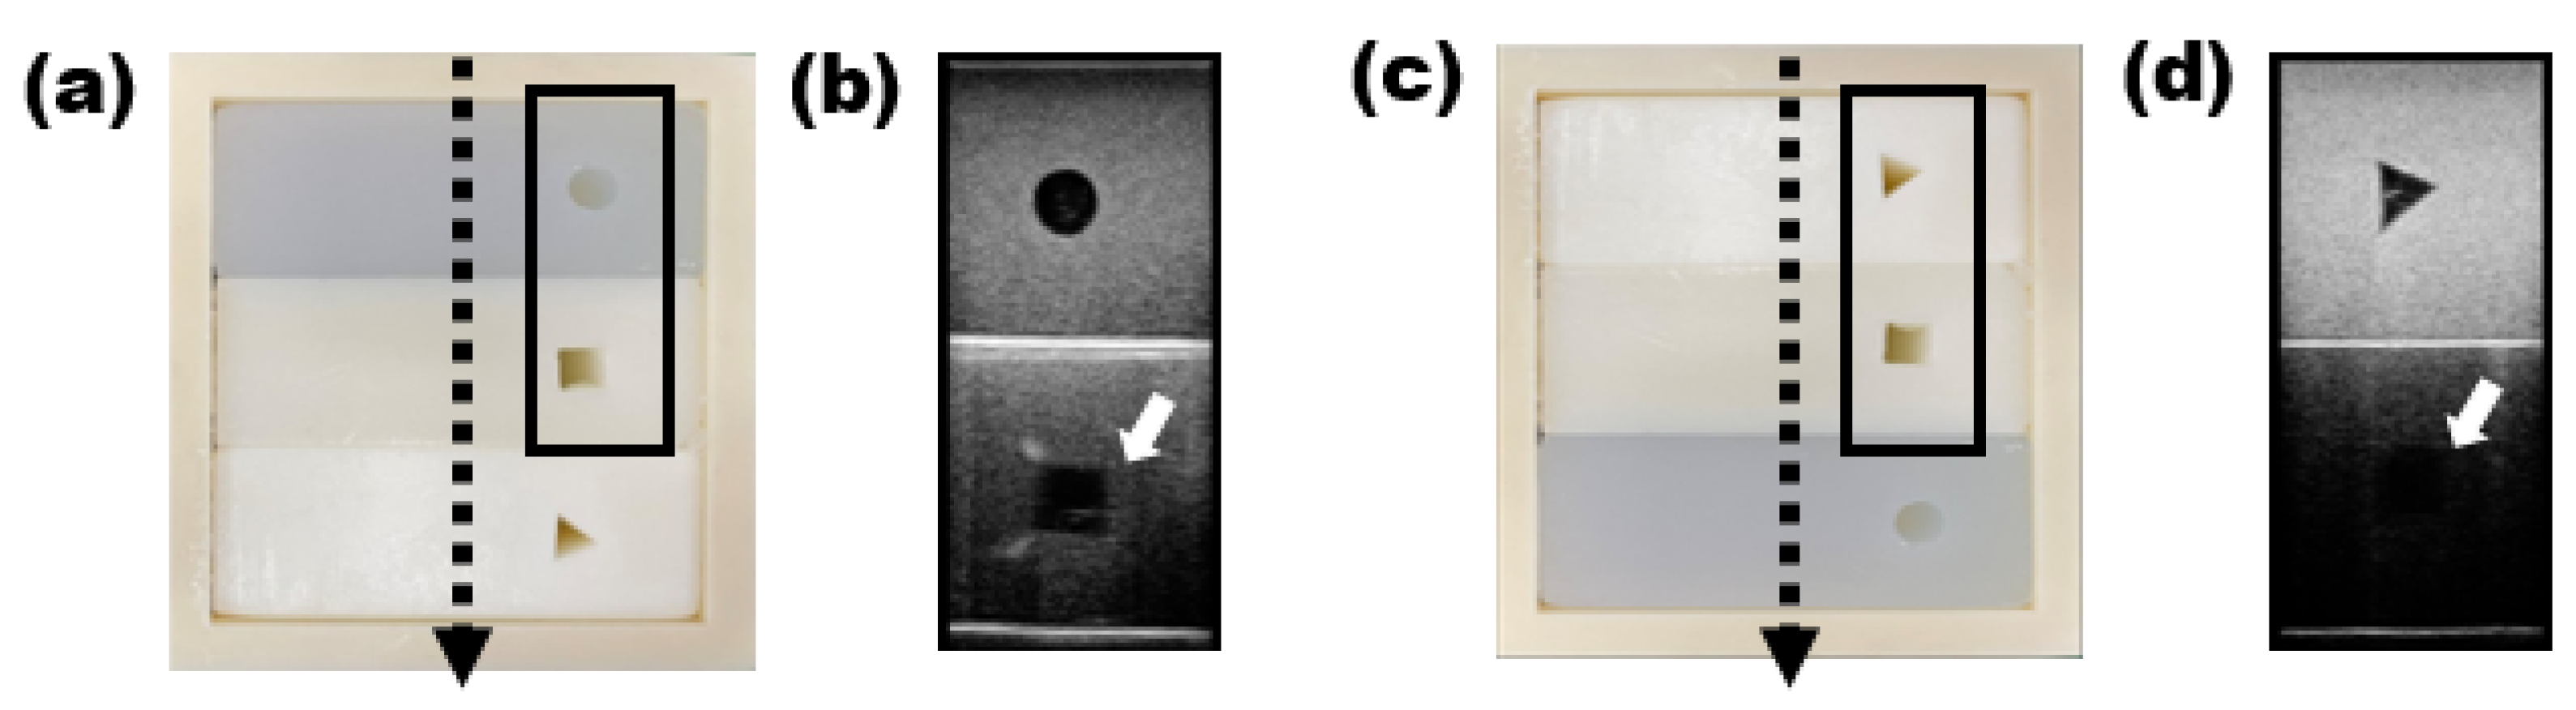
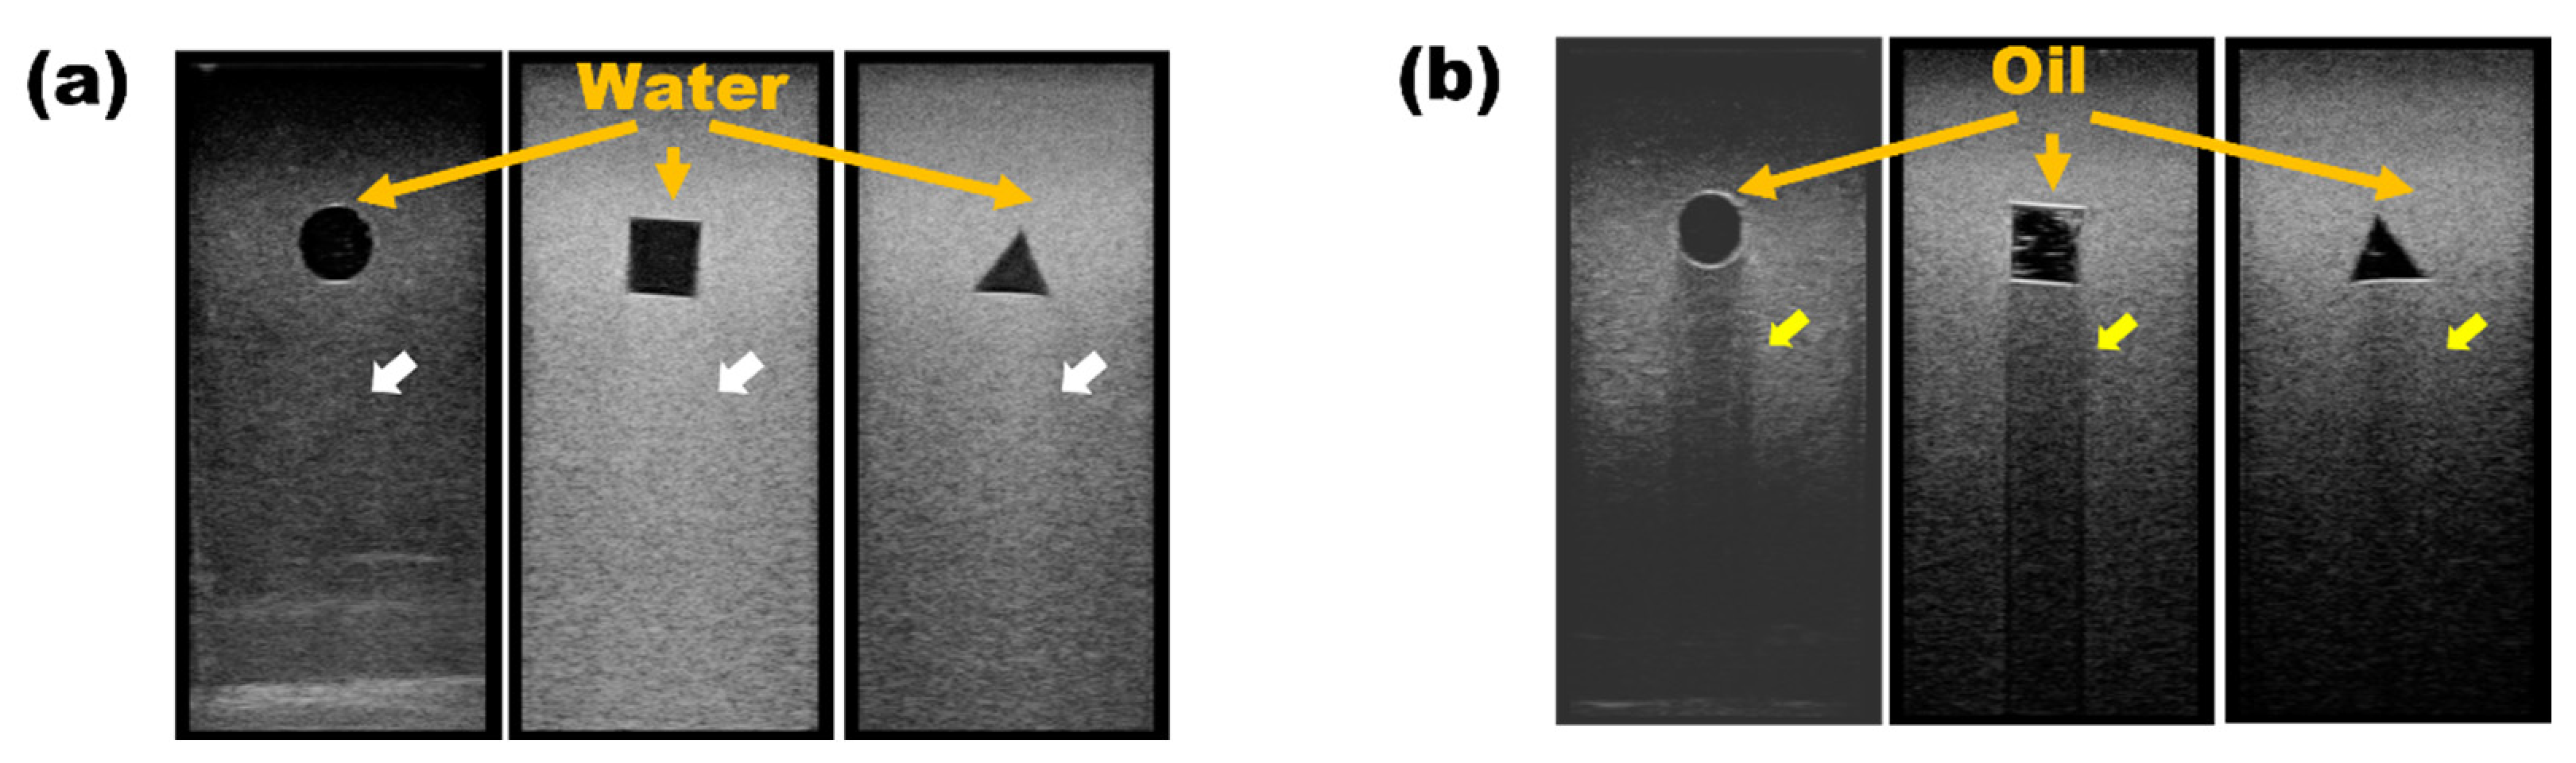
Posterior acoustic enhancement, which is mainly seen in anechoic cysts with clear boundaries, was also observed, along with the posterior acoustic shadowing caused by high attenuation such as oil cyst of the breast [23].
(3)
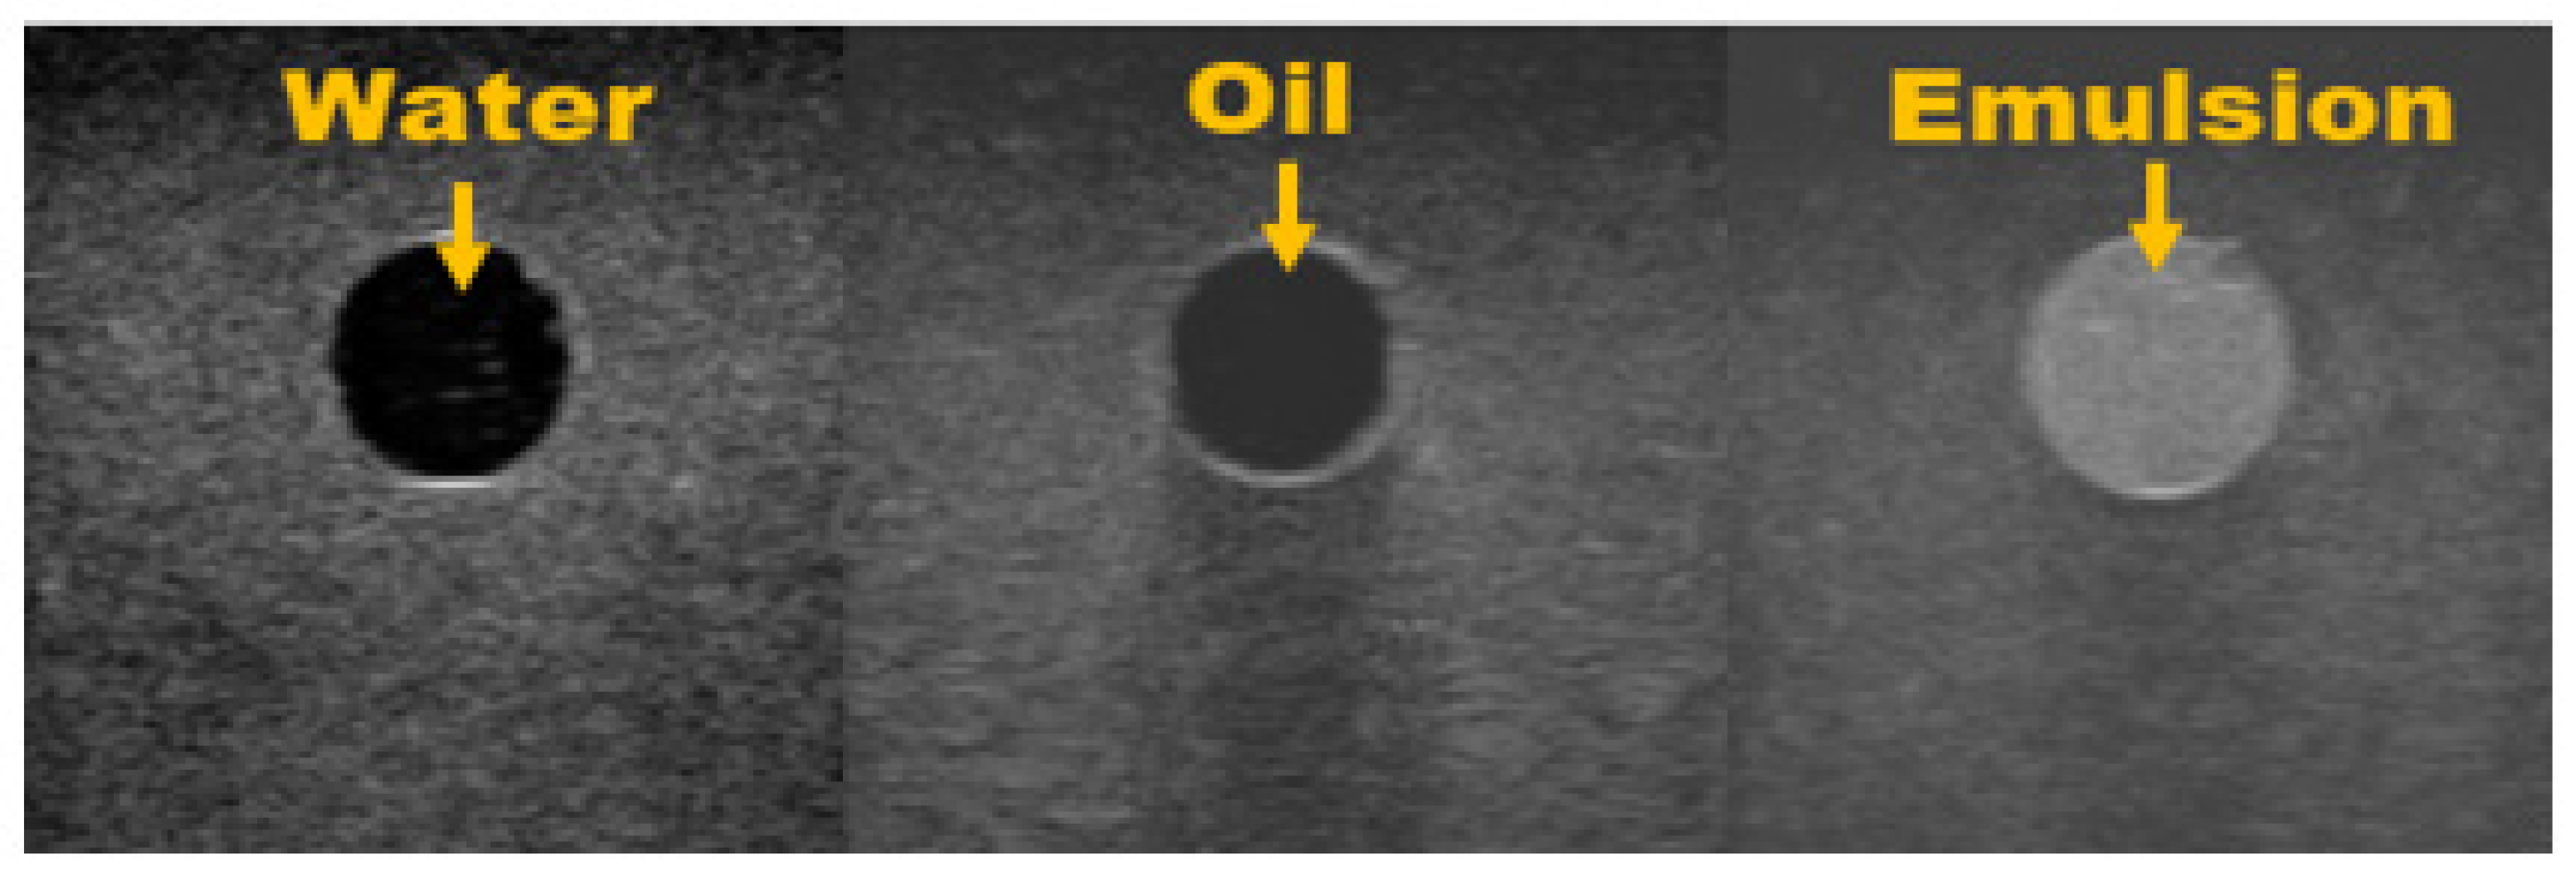
Pure water and fat appeared to be echo-free, while an emulsion of water and fat showed a remarkably hyperechoic pattern [22].
A typically observed clinical phenomenon in the fatty liver, cyst, and oil cyst patients was verified with the gel-type modular phantom.
Agarose gel was chosen as the tissue-mimicking material used in the phantom. The agarose gel is time- and cost-effective, easy to manufacture, and non-toxic [24]. Various materials other than agarose gel were considered but were ultimately excluded. Carbopol took a long time to completely mix as it became lumpy when mixed with water. Polyurethane takes a long time to degas, and there is a greater difference in the propagation speed of sound in soft tissue compared with other tissue mimics, while gelatin also took a relatively long time to degas and was softer than agarose gel. However, a well-known disadvantage of using agarose gel as a phantom is that it is very susceptible to mold growth and therefore has a relatively short lifespan. However, wrapping it in plastic wrap and storing it in the refrigerator can prolong its usefulness.
In another study, phantoms were manufactured with an agarose gel content of 4% [25,26,27]. However, a hardening phenomenon appeared after stirring with a stirrer, and degassing was not performed properly. If degassing is not done properly, a lot of air is generated in the gel phantom. The 3% content also had a similar phenomenon to 4%, so the agarose content was set to 2% of DI water. Ultrasound imaging uses the reflection of waves for imaging. If the target object has inherent inhomogeneities, it can distort the incident and the reflected propagating waves. Consequently, the presence of air bubbles in the material can induce wave-speed fluctuations, and multiple scattering leads to artifacts or distortion in the resulting images. Therefore, when preparing the fat-mimicking material, air bubbles were removed by degassing and checked by MRI to confirm their absence.
Fatty liver is evaluated to have high intensity and attenuation as fat content increases in ultrasound B-mode images. We first presented qualitative ultrasound imaging characteristics in the phantom, not in the human body. The attenuation coefficient according to fat content has been reported recently [28]. The ultrasound attenuation coefficient of the agar-based phantoms varied in the range of 0.30–1.49 dB/cm-MHz. The attenuation was increased in proportion to the concentration of agar and fatty evaporated milk. We are planning a systematic quantification study on the imaging characteristics of emulsified materials according to fat content. In addition, we plan to conduct a detailed analysis of the agarose gel content and stability when conducting quantitative research in the future.
For the reproducibility of the acquisition of ultrasound images according to the fat content, it is essential to minimize the movement of the ultrasound probe when making the phantom. Generally, the reproducibility of ultrasound images is affected by the level of training and experience of the sonographer because the transducer is held by hand during ultrasound scanning. Proper pressure at the time of image acquisition, fixation of the probe position, and co-location of the probe during repeated imaging are significant factors for reproducibility. These factors were achieved by a fixed ultrasonic probe to a LEGO-compatible module’s frame.
Ultrasound images were acquired with constant total gain, TGC, and dynamic range. Currently, the modular frame presented in this study plays a very important role in minimizing the influence of image parameters. This is because the image is acquired only by the movement of the phantom after fixing both the probe and image parameters. Since it was manufactured as an open frame, a phantom can be inserted at a desired position. Images can be scanned from multiple directions, and more diverse ultrasound image characteristics can be known by scanning not only a single phantom scan but also two phantoms at the same time.
It is suitable to fix the phantom to the frame because the size of the phantom and frame are similar. However, it causes some scratches in the process of inserting or disassembling the phantom. Even with some scratches, it does not affect the acquisition of ultrasound images. If the frame size is made the same in width and length but only the height is increased by 1–2cm, this disadvantage will be sufficiently compensated while maintaining the adhesion. Additionally, the hole was drilled from top to bottom of the phantom, and there was a possibility of leakage when material was injected into the hole. To resolve the problem, we scanned the bottom of a LEGO-compatible module frame with a polyurethane cloth. The polyurethane cloth and phantom adhere tightly to each other to prevent leakage. This kit will be updated in the future.
Our study is a qualitative study based on sonographic images. In general, the imaging characteristics of fat contents were qualitatively assessed in patients in clinical settings. However, we qualitatively assessed them in phantoms, not in patients. Recently, quantitative studies using phantoms for fat content have been reported [29,30]. Based on these studies and our findings, we are planning an ultrasound imaging quantification study using phantoms.

5. Conclusions

In this work, we fabricated the emulsion phantom and developed a LEGO-compatible modular frame to demonstrate fat properties in ultrasound images. Our results showed that the phantom reproducibly simulates the fat properties of the ultrasound interactions in living tissues, such as the characteristics seen from the posterior of the structure depending on the brightness, attenuation, and absorption degree. We believe that the phantom reproducibly demonstrates fat properties in ultrasound images by reducing the effect of transducer movement on beginners.

Author Contributions

Conceptualization, S.I.L., C.H., C.L. and H.-M.C.; methodology, S.I.L. and C.H.; validation, S.I.L. and C.H.; formal analysis, C.L. and H.-M.C.; investigation, S.I.L.; resources, C.L. and H.-M.C.; data curation, S.I.L.; writing—original draft preparation, S.I.L., C.L. and H.-M.C.; writing—review and editing, C.H., C.L. and H.-M.C.; visualization, C.H.; supervision, H.-M.C.; and funding acquisition, C.L. and H.-M.C. All authors have read and agreed to the published version of the manuscript.

Funding

This research was funded by Korea Medical Device Development Fund grant by the Korea Government (the Ministry of Science and ICT, the Ministry of Trade, Industry and Energy, the Ministry of Health and Welfare, and the Ministry of Food and Drug Safety) (grant number RS-2020-KD000017), and by the Measurement Standard and Technology R&D Programs funded by Korea Research Institute of Standards and Science (grant number KRISS–GP2022-0006).

Institutional Review Board Statement

Not applicable.

Informed Consent Statement

Not applicable.

Data Availability Statement

The data that support the findings of this study are available from the corresponding author upon reasonable request.

Conflicts of Interest

The authors declare no conflict of interest.

References

  1. Dragoo, J.L.; Shapiro, S.A.; Bradsell, H.; Frank, R.M. The essential roles of human adipose tissue: Metabolic, thermoregulatory, cellular, and paracrine effects. J. Cartil. Jt. Preserv. 2021, 1, 100023. [Google Scholar] [CrossRef]
  2. Luo, L.; Liu, M. Adipose tissue in control of metabolism. J. Endocrinol. 2016, 231, R77–R99. [Google Scholar] [CrossRef] [Green Version]
  3. Choe, S.S.; Huh, J.Y.; Hwang, I.J.; Kim, J.I.; Kim, J.B. Adipose Tissue Remodeling: Its Role in Energy Metabolism and Metabolic Disorders. Front. Endocrinol. 2016, 7, 30. [Google Scholar] [CrossRef] [PubMed] [Green Version]
  4. Lin, S.C.; Heba, E.; Wolfson, T.; Ang, B.; Gamst, A.; Han, A.; Erdman, J.W., Jr.; O’Brien, W.D., Jr.; Andre, M.P.; Sirlin, C.B.; et al. Non-invasive diagnosis of non-alcoholic fatty liver disease and quantification of liver fat using a new quantitative ultrasound technique. Clin. Gastroenterol. Hepatol. 2015, 13, 1337–1345.e6. [Google Scholar] [CrossRef] [PubMed] [Green Version]
  5. Stefan, N.; Häring, H.U.; Cusi, K. Non-alcoholic fatty liver disease: Causes, diagnosis, cardiometabolic consequences, and treatment strategies. Lancet Diabetes Endocrinol. 2019, 7, 313–324. [Google Scholar] [CrossRef] [PubMed]
  6. Brunt, E.M.; Wong, V.W.S.; Nobili, V.; Day, C.P.; Sookoian, S.; Maher, J.J.; Bugianesi, E.; Sirlin, C.B.; Neuschwander-Tetri, B.A.; Rinella, M.E. Nonalcoholic fatty liver disease. Nat. Rev. Dis. Prim. 2015, 1, 15080. [Google Scholar] [CrossRef]
  7. Kramer, H.; Pickhardt, P.J.; Kliewer, M.A.; Hernando, D.; Chen, G.-H.; Zagzebski, J.A.; Reeder, S.B. Accuracy of Liver Fat Quantification with Advanced CT, MRI, and Ultrasound Techniques: Prospective Comparison with MR Spectroscopy. Am. J. Roentgenol. 2017, 208, 92–100. [Google Scholar] [CrossRef] [Green Version]
  8. Chowdhury Aqib, B.; Mehta Kosha, J. Liver biopsy for assessment of chronic liver diseases: A synopsis. Clin. Exp. Med. 2022, 1–13. [Google Scholar] [CrossRef]
  9. Schwenzer, N.F.; Springer, F.; Schraml, C.; Stefan, N.; Machann, J.; Schick, F. Non-invasive assessment and quantification of liver steatosis by ultrasound, computed tomography and magnetic resonance. J. Hepatol. 2009, 51, 433–445. [Google Scholar] [CrossRef]
  10. Troelstra, M.A.; Witjes, J.J.; van Dijk, A.M.; Mak, A.L.; Gurney-Champion, O.; Runge, J.H.; Zwirs, D.; Stols-Gonçalves, D.; Zwinderman, A.H.; ten Wolde, M.; et al. Assessment of imaging modalities against liver biopsy in nonalcoholic fatty liver disease: The Amsterdam NAFLD-NASH cohort. J. Magn. Reson. Imaging 2021, 54, 1937–1949. [Google Scholar] [CrossRef]
  11. Pirmoazen, A.M.; Khurana, A.; El Kaffas, A.; Kamaya, A. Quantitative ultrasound approaches for diagnosis and monitoring hepatic steatosis in nonalcoholic fatty liver disease. Theranostics 2020, 10, 4277–4289. [Google Scholar] [CrossRef] [PubMed]
  12. Festi, D.; Schiumerini, R.; Marzi, L.; Di Biase, A.R.; Mandolesi, D.; Montrone, L.; Scaioli, E.; Bonato, G.; Marchesini-Reggiani, G.; Colecchia, A. The diagnosis of non-alcoholic fatty liver disease—Availability and accuracy of non-invasive methods. Aliment. Pharmacol. Ther. 2013, 37, 392–400. [Google Scholar] [CrossRef] [PubMed]
  13. Bierig, S.M.; Jones, A. Accuracy and cost comparison of ultrasound versus alternative imaging modalities, including CT, MR, PET, and angiography. J. Diagn. Med. Sonogr. 2009, 25, 138–144. [Google Scholar] [CrossRef] [Green Version]
  14. Monteiro, P.A.; Antunes, B.D.M.M.; Silveira, L.S.; Christofaro, D.G.D.; Fernandes, R.A.; Freitas, I.F. Body composition variables as predictors of NAFLD by ultrasound in obese children and adolescents. BMC Pediatr. 2014, 14, 25. [Google Scholar] [CrossRef] [Green Version]
  15. Zhang, Y.N.; Fowler, K.J.; Hamilton, G.; Cui, J.Y.; Sy, E.Z.; Balanay, M.; Hooker, J.C.; Szeverenyi, N.; Sirlin, C.B. Liver fat imaging—A clinical overview of ultrasound, CT, and MR imaging. Br. J. Radiol. 2018, 91, 20170959. [Google Scholar] [CrossRef] [Green Version]
  16. Spencer, G.M.; Rubens, D.J.; Roach, D.J. Hypoechoic fat: A sonographic pitfall. Am. J. Roentgenol. 1995, 164, 1277–1280. [Google Scholar] [CrossRef] [Green Version]
  17. Venta, L.A.; Dudiak, C.M.; Salomon, C.G.; Flisak, M.E. Sonographic evaluation of the breast. Radiographics 1994, 14, 29–50. [Google Scholar] [CrossRef] [Green Version]
  18. Andre, M.P.; Han, A.; Heba, E.; Hooker, J.; Loomba, R.; Sirlin, C.B.; Erdman, J.W.; O’Brien, W.D. Accurate diagnosis of nonalcoholic fatty liver disease in human participants via quantitative ultrasound. In Proceedings of the 2014 IEEE International Ultrasonics Symposium, Chicago, IL, USA, 3–6 September 2014; IEEE: Piscataway, NJ, USA, 2014. [Google Scholar]
  19. Leivas, G.; Maraschin, C.K.; Blume, C.A.; Telo, G.H.; Trindade, M.R.; Trindade, E.N.; Diemen, V.V.; Cerski, C.T.S.; Schaan, B.D. Accuracy of ultrasound diagnosis of nonalcoholic fatty liver disease in patients with classes II and III obesity: A pathological image study. Obes. Res. Clin. Pract. 2021, 15, 461–465. [Google Scholar] [CrossRef]
  20. Keenan, K.E.; Wilmes, L.J.; Aliu, S.O.; Newitt, D.C.; Jones, E.F.; Boss, M.A.; Stupic, K.F.; Russek, S.E.; Hylton, N.M. Design of a breast phantom for quantitative MRI. J. Magn. Reson. Imaging 2016, 44, 610–619. [Google Scholar] [CrossRef] [Green Version]
  21. Fornage, B.D.; Tassin, G.B. Sonographic appearances of superficial soft tissue lipomas. J. Clin. Ultrasound 1991, 19, 215–220. [Google Scholar] [CrossRef]
  22. Inampudi, P.; Jacobson, J.; Fessell, D.P.; Carlos, R.C.; Patel, S.V.; Delaney-Sathy, L.O.; van Holsbeeck, M. Soft-Tissue Lipomas: Accuracy of Sonography in Diagnosis with Pathologic Correlation. Radiology 2004, 233, 763–767. [Google Scholar] [CrossRef] [PubMed]
  23. Harvey, J.A.; Moran, R.E.; Maurer, E.J.; A DeAngelis, G. Sonographic features of mammary oil cysts. J. Ultrasound Med. 1997, 16, 719–724. [Google Scholar] [CrossRef] [PubMed] [Green Version]
  24. McGarry, C.K.; Grattan, L.J.; Ivory, A.M.; Leek, F.; Liney, G.P.; Liu, Y.; Miloro, P.; Rai, R.; Robinson, A.; Shih, A.J.; et al. Tissue mimicking materials for imaging and therapy phantoms: A review. Phys. Med. Biol. 2020, 65, 23TR01. [Google Scholar] [CrossRef] [PubMed]
  25. Hines, C.D.; Yu, H.; Shimakawa, A.; McKenzie, C.A.; Brittain, J.H.; Reeder, S.B. T1 independent, T2* corrected MRI with accurate spectral modeling for quantification of fat: Validation in a fat-water-SPIO phantom. J. Magn. Reson. Imaging Off. J. Int. Soc. Magn. Reson. Med. 2009, 30, 1215–1222. [Google Scholar]
  26. Hernando, D.; Sharma, S.D.; Aliyari Ghasabeh, M.; Alvis, B.D.; Arora, S.S.; Hamilton, G.; Pan, L.; Shaffer, J.M.; Sofue, K.; Szeverenyi, N.M.; et al. Multisite, multivendor validation of the accuracy and reproducibility of proton-density fat-fraction quantification at 1.5 T and 3T using a fat–water phantom. Magn. Reson. Med. 2017, 77, 1516–1524. [Google Scholar] [CrossRef] [Green Version]
  27. Jang, J.K.; Lee, S.S.; Kim, B.; Cho, E.S.; Kim, Y.J.; Byun, J.; Park, B.J.; Kim, S.Y.; Kim, J.H. Agreement and reproducibility of proton density fat fraction measurements using commercial MR sequences across different platforms: A multivendor, multi-institutional phantom experiment. Investig. Radiol. 2019, 54, 517–523. [Google Scholar] [CrossRef]
  28. Drakos, T.; Antoniou, A.; Evripidou, N.; Alecou, T.; Giannakou, M.; Menikou, G.; Constantinides, G.; Damianou, C. Ultrasonic attenuation of an agar, silicon dioxide, and evaporated milk gel phantom. J. Med. Ultrasound 2021, 29, 239. [Google Scholar]
  29. Ferraioli, G.; Kumar, V.; Ozturk, A.; Nam, K.; de Korte, C.L.; Barr, R.G. US Attenuation for Liver Fat Quantification: An AIUM-RSNA QIBA Pulse-Echo Quantitative Ultrasound Initiative. Radiology 2022, 302, 495–506. [Google Scholar] [CrossRef]
  30. Labyed, Y.; Milkowski, A. Novel Method for Ultrasound-Derived Fat Fraction Using an Integrated Phantom. J. Ultrasound Med. 2020, 39, 2427–2438. [Google Scholar] [CrossRef]
Figure 1. (a) Brick-type gel phantom (dimensions: 100 mm × 40 mm × 50 mm), (b) emulsion phantom based on agarose containing fat fractions of 40% and 80%. A circular, rectangular, and triangle hole was drilled in the respective phantoms (the circular hole indicates agarose gel, the rectangular hole indicates 40% fat fraction gel, and the triangular hole denotes 80% fat fraction gel).
Applsci 13 00432 g001
Figure 2. Imaging validation of emulsion gel phantom using MRI. (a) Line by line emulsion phantom (b) in the T1 weighted image (T1w); the image becomes brighter as fat content increases. (c) With fat-suppression, the phantom with higher oil content appears darker.
Applsci 13 00432 g002
Figure 3. Experimental setup for the ultrasound imaging of the emulsion gel phantom using a modular frame. (a) LEGO-compatible modular frame. (b) It consists of an open frame so that it is easy to insert a phantom and scan images from multiple directions. (c) In order to increase reproducibility, an ultrasound image was obtained by fixing the transducer with a LEGO block. (d) The phantom was rotated clockwise and scanned.
Applsci 13 00432 g003
Figure 4. Intensity attenuation by fat content. (a) The gel phantom was inserted into the module, and the ultrasound beam was transmitted in the direction of the black dotted line. (b) The corresponding ultrasound image. (c) Line profiles in each phantom with the yellow dotted line showing the line profile. The line profile is set to the lateral side to avoid the central region artifact (acoustic enhancement).
Applsci 13 00432 g004
Figure 5. Image degradation by fat content. The black box shows the region of interest on the image. Ultrasound images (b,d) are the images corresponding to phantoms (a,c). Unlike image (b), the rectangular structure (d) is not visible in the ultrasound image because of the high fat content.
Applsci 13 00432 g005
Figure 6. Image characteristics by injected water and oil. (a) The white arrows represent posterior acoustic enhancement. The water attenuates and absorbs the ultrasound less than the surrounding gel. (b) However, oil with higher acoustic impedance attenuates the ultrasound more than the surrounding gel. This phenomenon is called posterior acoustic shadow, and it represented by the yellow arrows.
Applsci 13 00432 g006
Figure 7. Comparison of echo characteristics by injected water, oil, and emulsion. The water and oil appear echo-free, but the emulsions are hyperechoic. Unlike pure water or oil, emulsions have varying acoustic impedance. Water and oil contained in the emulsion solutions are mixtures, and they appear increasingly hyperechoic as the internal interface increases.
Applsci 13 00432 g007
Disclaimer/Publisher’s Note: The statements, opinions and data contained in all publications are solely those of the individual author(s) and contributor(s) and not of MDPI and/or the editor(s). MDPI and/or the editor(s) disclaim responsibility for any injury to people or property resulting from any ideas, methods, instructions or products referred to in the content.

