1. Introduction
The automatic dependent surveillance-broadcast (ADS-B) is a system that periodically transmits its state vector (position, velocity, and other information) to other airplanes [
1]. When compared to conventional radar technology, the ADS-B system can offer more precise and real-time monitoring data for aircraft. It has low-cost maintenance and long useful life and can expand the airspace capacity in areas lacking radar [
2,
3]. ADS-B offers multiple advantages to pilots, operators, and air traffic controllers; overall, ADS-B enhances every flight’s safety and efficiency.
Sending (ADS-B Out) and receiving (ADS-B In) are the two main functional categories of the Airborne ADS-B application. The receiver plays a crucial role in ADS-B technology. Consequently, it is vital to explore ADS-B receiving strategies, and key requirements.
This work deals with the hardware architecture and configuration explanation, the presentation of enhanced pulse and bit detection schemes, the BladeRF receiver and its features, and, ultimately, the achieved results using the system. The whole setup is intended to validate and perform an extensive performance analysis, with the clear goal of evaluating: (i) is the sensitivity key requirement fulfilled in lab conditions? (ii) what is the real-time system behavior and performance during the flight test with the presence of high ADS-B signal load by deploying enhanced reception techniques? (iii) what is the system outcome performance in comparison with reliable resources? The major innovation in this work consists of:
implementation of pulse detection schemes including cross-correlation and leading-edge and bit detecting techniques consists of central sampling and multiple sampling in a thorough simulation environment, as advised by RTCA. RF receptions are deployed in close accordance with the requirements of actual hardware (HW) devices.
while the receiving methods are delineated in RTCA guidance, to our best understanding the evaluation of their doable performance with the realistic system functioning in real environments has not been addressed. Especially, when the system performance can be challenged in the presence of increasing air traffic volumes.
Detection of the Mode-S 1090 MHz waveform preamble pulse, detection of the bits and declaration of each bit confidence value, and detection and correction of error are all included in extended Squitter reception. In this study, enhanced Extended Squitter reception methods are described and implemented in both MATLAB Simulink and C++ of SDAR. Enhanced Squitter reception takes the advantage of multiple amplitude samples to not only increase bit quality and declare precision but also be more competent algorithms for error detection and correction. The result of the simulation, and lab experimental shows better performance of mentioned scheme than other techniques. Preamble detection accuracy of interfered signal with mode A/C and additive gaussian white noise for received signals over −86 is 100 percent. The packet Error Rate (PER) and Bit Error Rate (BER) of multiple sampling techniques are below 10 percent for signals above −82 dBm. In addition, experimental result in the operational environment proves that deploying analog front-end SDR slow attach AGC brings about significant improvement in ADS-B sensitivity and performance.
2. Literature Review
The 1090 MHz Mode Select (S) transponder is required for aircraft that fly at 18,000 feet and higher and is the standard throughout much of the world. A Mode S transponder’s 1090 MHz Extended Squitter connection is also employed to transmit ADS-B signals. By taking into account that ADS-B has been conceptualized as a development of Mode S, the technical literature has dealt with the subject of insight into how the performance of ADS-B technology can be affected by the modern surveillance systems functioning in the same 1090 MHz frequency channel [
4,
5,
6].
On the one hand, critical concerns like the potential weaknesses and their probable causes, as well as their possible downsides on the Air Traffic Control (ATC) operating state of the ADS-B technology have been explored [
7]. On the other hand, considering the fact ADS-B messages volume is increasing constantly since there is an increment trend in the number of aircraft installed with ADS-B facilities [
8,
9]. Besides, the quantity of ground stations supplied with ADS-B instruments is rising and it facilitates receiving surveillance air traffic messages and making accessible an enormous number of ADS-B data generated by the field for the research society [
10].
Prior studies and findings on the evaluation of enhanced receipt methods in the occurrence of interference are described in [
11,
12] by W. Harman. The results are demonstrated in various received power signal levels versus the probability of corrected messages captured by the receiver. Subsequent guidelines in the RTCA related to enhanced reception designs, in [
13] present two developed decoding methods that have been put under trial and assessed based on Bit Error Rate (BER) versus Signal-to-Noise Ratio (SNR). In comparison to the standard technique, simulation outcomes demonstrate that the exploitation of multiple samples is able to improve the decoding mechanism. Furthermore, another study of the implementation of matched digital filters for preamble pulse detection in conjunction with a multilevel threshold detection for decoding with mean input was conducted [
14]. Apart from that, an N-confidence error correction algorithm has been offered by [
15], based on the matched filter decoding scheme for enhancing ADS-B performance in weak signals, however, all trials were done in Simulink. In [
16], further improvement in ADS-B performance has been achieved by combining enhanced techniques with antenna arrays to mitigate the receiver sensitivity. Moreover, other studies and works have been carried out based on the multi-channel receivers’ technique [
17,
18,
19,
20]. The researchers aimed to use signal separation techniques to find out solutions for decoding overlapped Mode S frames. Furthermore, cross-correlation is one of the often-used techniques for preamble detection. Cross-correlation detection is carried out in the potentially valid signal sequence to locate the highest value that meets the cross-correlation threshold. The start of the data block may be where the maximum value is located. The research’s result is demonstrated in the probability of preamble detection versus SNR [
21]. Nonetheless, a comprehensive study of ADS-B enhanced detection techniques was done in the work [
22]. The researchers developed a simulation environment to model an operational scenario by generating ADS-B frames and Mode A/C interfering signals. The result is shown in signal power against preamble detection. Ultimately, measurement-based evaluation of extended squitter detection likelihood in actual scenarios has been conducted by [
23], to be more specific, this study was limited to air-to-ground stations, and it is done based on the RTCA-enhanced methods through receivers. The flexibility and modularity feature of Software Defined Radio (SDR) facilitates the assessment and testing of innovative ADS-B receiver advancements to be done quickly. For this purpose, a software-defined receiver, an array antenna, along with a created analog front-end was deployed to employ a multi-channel receiver for 1090 MHz ADS-B signals [
24]. Although this approach is interesting, it fails to take into account the possibility of implementation in aircraft since the hardware and setup equipment is excessively big and hefty.
3. Methodology and Solutions
The system structure and related MATLAB simulation processing blocks are displayed in
Figure 1. It composes of the Demodulator at 1090 MHz, Preamble Pulse Detection, Enhanced Bit Detection CRC Error Detection and Correction, and the ADS-B Decoding blocks on the receiving side. Details related to each block are provided in the following sections.
Before the design of the ADS-B receiver, it is crucial to consider the following major expectations:
Digital domain environment: All design has been done in the discrete-time domain since the aim is to use SDR devices and run the avionic function as an App.
Processing Efficiency: The design should be performed in a way that all information is done in real-time without any missing information.
ADS-B Receiving Device Output: Need to be in a proper format that can be utilized by other systems to be displayed or saved in the database.
3.1. Multiple Amplitude Samples Algorithm
The 112-bit Mode S waveform used in the extended squitter is depicted in
Figure 2. It illustrates the ADS-B message waveform. This waveform uses pulse position modulation (PPM) to modulate data. A pulse in the bit position’s leading half denotes a binary ONE. A pulse representing a binary ZERO is at the trailing half-bit position.
The four-pulse preamble signals signify the start of the Squitter reception. A dynamic power threshold is adjusted to 6 dB lower than the preamble level during preamble detection. The squitter reception processor will not be able to see any signals that are received below this level.
The 24-bit CRC found in the parity identity (PI) field is used to identify errors after all of the bits have been received. The squitter is given to surveillance processing if no errors are found. An error correction approach is used if an error is found (implied by a non-zero value of error syndrome). One stronger overlapping Mode A/C False Replies Unsynchronized In Time (FRUIT) error can be corrected by the existing error correction procedure. This error is generated by unwanted responses by ground stations, and it leads to overlapping with the originated signal at the receiver end known as FRUIT.
There are two widely used preamble detection techniques for detecting the signal’s valid pulse position (VPP) [
11], leading-edge position (LEP), and falling edge position (FEP) between 0 to 8 microseconds of the burst. Nonetheless, cross-correlation is one of the suggested solutions for preamble detection which is done in [
21]. In our research, the preamble detection comparison between the leading-edge and cross-correlation performance is done.
Following Investigation, a leading-edge position approach is deployed for preamble detection. To be more specific, if a sample has a large slope in the interval prior to it and a less than substantial slope in the interval after it, it is deemed to have a leading edge.
Figure 3 flowchart explicitly illustrates the preamble detection procedure.
In the initial stage, SDR needs to be configured according to ADS-B frequency, bandwidth as well as sampling rate, afterward the received data will be validated based on the leading edge in order to find out the pulse position [
25]. In the second stage, when four pulses with the same spacing as the Mode S preamble are found, the preamble detection process starts to validate four pulses with timings of 0, 1.0, 3.5, and 4.5 microseconds. During preamble detection, a Reference Power Level is produced for purpose of re-triggering and demodulating the entire data block. It computes based on middle samples matching with pulse position and power of samples which are within 2dB tolerance. In the next step, 1, 3.5, and 4.5 microseconds tests are done to detect later preamble pulses if there is any overlapped signal. For instance, a test for one microsecond is necessary to look for high power in the pulse positions 1, 2, 4.5, and 5.5 microseconds following the start to address this potential overlap issue.
In addition, the preamble is put to another test to ensure its validity. This test determines whether at least two out of the four preamble pulses have power levels that are within the ±3 dB range of the Reference Level. Otherwise, the preamble is rejected.
DF validation is applied for each chip duration lasting 0.5 microseconds. If a Valid Pulse Position is located at, or inside ± sample of, the leading-edge time for a given chip, a pulse is considered to have been detected. If each chip’s peak amplitude is equal to or more than the threshold which is 6 dB lower than the preamble reference level, the detected preamble is then considered genuine. Otherwise, the preamble is discarded.
As the last step, re-triggering activation will be evaluated and performed in case of finding stronger signals and later overlaps. In the meantime, if all validations pass, the enhanced bit detection process will be executed.
3.2. Enhanced Bit Detection and Confidence Declaration
One of the prevalent methods for the detection of the bit and calculation of confidence values is the center sample technique. The actual amplitude of the center samples for two consecutive chips is measured and based on each chip position, the chip with greater amplitude is designated as a bit value. However, the center sample method is simple for implementation, it will fall short of the standards set for Class A2 and A3 in terms of performance. Only the multi-sample techniques can perform and accomplish the required performance for these classes of equipment [
1,
11].
The bit and confidence values are calculated using all samples of each Mode S bit position in the multi-sample technique [
1].
Figure 4 illustrates the required steps for this purpose.
As an initial step, it is essential to create an amplitude window and to classify detected chips to A in which samples fall into ±3 dB of the preamble reference level. In addition, classify detected chips to B if the sample amplitude value is below a minimum threshold. Nonetheless, a minimum amplitude threshold is set to 6 dB lower than the reference level. The second step is to determine and compute the weighting factor of each category for every chip according to the sample’s position.
The preamble is thought to be matched by samples that fall within the amplitude window and this is indicated by ChipTypeA and referred to as Match Preamble in the flowchart. While the lack of transmitted energy is thought to be indicated by samples that fall below the minimum threshold and it is indicated by ChipTypeB. Therefore, in the third step, counters of ChipTypeA and ChipTypeB for a bit “0” and “1” need to be computed.
In step four, the results of two equations using the aforementioned counters are used to generate two scores that represent how much the sample pattern has a correlation either with a transmitted bit 0 or a transmitted bit 1. The score equations are presented in
Figure 4.
In step five, the bit value is determined by the highest score. When there is a tie, the bit is set to zero by default (0). The bit has high confidence if the difference is three or more, otherwise, it has low confidence.
3.3. ADS-B Error Detection and Correction Techniques
There are three new methods for error identification and correction which are introduced in [
1]. The first method deploys the current Sliding Window methodology, called “Conservative”, in order to lower the rate of undetected errors. The second method, called “Whole Message”, simulates how whole Mode A/C FRUIT (unwanted overlapping interference) may impact bit and confidence declarations. The third method, dubbed “Brute Force”, does a constrained exhaustive search of all bit reversal sequences in search of low-confidence bits [
26].
By employing the “Brute Force” method of Cyclic Redundancy Check (CRC) based on the bit and confidence declarations outlined above, it is possible to discover and fix ADS-B data bits errors.
Figure 5 is the flow of the detailed error correction procedure. Upon receiving ADS-B data a CRC error detection can produce an error syndrome. If the error syndrome is equal to “0”, the ADS-B message is accepted. If it is not “0”, the algorithm checks the possibility of error correction by computing the length of the low confidence region and the number of its bits. Only when all the message’s low confidence bits fall within a 24-bit frame and there are no more than 12 low confidence bits, the error correction algorithm will perform. In the first step, the conservative technique applies, if the error is corrected, the message will be modified accordingly and accepted, otherwise try every set of low confidence bits that is conceivable (if there are more than five low confidence bits, the received ADS-B data is discarded) and accept the set that is equivalent to the error syndrome.
3.4. ADS_B in Message Decoder
Upon receiving the ADS-B message, two subfunctions of the decoder and message assembly need to be executed to perform all control, decoding, and formatting tasks required to transform the received information into properly structured reports for usage by operator programs. Either the ADS-B receiver element itself or an additional decoding unit with an interface to the receiver may carry out these subfunctions. In this research, Universal Glass Cockpit (UGC) software, which is User Datagram Protocol (UDP) based connection software for displaying information, has been used for ADS-B in the user interface.
The components of an ADS-B burst data are immediately classified by their Type Code value. The key attributes downlinked by every Type Code are call sign, latitude, longitude, altitude, speed, tracking angle, and vertical rate. Within the same group, Type Code values also have their individual indicators. For instance, a TC of 1 to 4 in the identification group denotes various aircraft categories as described by the Mode-S standard in accordance with [
1]. Therefore, the message decoding is performed based on Type Code (5 bits), ICAO aircraft address (24 bits), and Data (56 bits). It is highly important to link data with the same ICAO in order to have a consistent track of aircraft. All mentioned activities have been done and validated with the open-source code of the pyModeS decoder [
27].
Figure 6 shows a sample outcome of the UGC application for ADS-B In during the flight test. It displays each flight ID information including position and velocity information, and distance from the airplane in the table format.
4. Analog Front-End and AGC Slow Attack Mode
SDR system has an analog front end to deal with received analog signals [
28]. It is crucial to provide a suitable signal prior to digital conversion with the ADC (Analog to Digital Converter). The slow attack mode is designed for signals that change slowly, such as those in several FDD applications, like WCDMA and FDD LTE. The second-order control loop with hysteresis used by the slow attack AGC modifies gain to maintain the average signal strength within a predefined window. Using the AD9361 RF Agile Transceiver within the Blade-RF, the receiver gain control mode function is activated on AGC slow attack mode. The control loop’s concept is shown in
Figure 7 [
28] which stores the inner high threshold and inner low threshold settings in negative decibels relative to full scale (dBFS). The outer high threshold and outer low threshold parameters are set as dB deltas to the inner thresholds. Programmable gain step sizes are available for A, B, C, and D. The gain index pointer’s modification, once an average signal power threshold is exceeded, depends on these step sizes.
Table 1 indicates slow attack AGC s parameters and associated registers [
29]. They need to be well-tuned and adjusted to fulfill MOPS requirements in SDAM. In the case of ADS-B In, sensitivity needs to be considered as one of the key requirements [
1].
5. Experimental Results
Two major experiments were performed; the first one was done in the LASSENA laboratory of the ETS university with aim of key requirements validation and the second experiment was performed in the light aircraft (Cessna C-172) from Saint-Hubert (CYHU) Airport to Mirabel (CYMX) Airport to evaluate system performance in the operational environment.
Figure 8 illustrates the simulation block of ADS-B In. It consists of the BaldeRF subsystem, converting complex inputs to magnitude, Enhanced preamble detection, Enhanced bit detection, CRC check and error correction, and UPD interface with UGC application.
Cross-correlation and leading-edge are two major approaches that are examined in the Simulink environment based on the
Figure 9 simulation test bench.
Figure 9 shows that ADS-B message generator block is combined with primary interference FRUIT A/C; afterward, it is amplified and sent to the ADS-B message schedular in order to send the message based on transmission rate (it could be periodically or random); then white Gaussian noise is added to the signal, and ultimately, the signal is transmitted by BladeRF with a sampling rate of 12 MHz and central frequency of 1090 MHz.
Figure 10 demonstrates preamble detection accuracy for various tests including cross-correlation, Leading-edge in MGC mode and slow attack mode, and linear and logarithmic amplifier approaches. Linear and logarithmic amplifier approaches’ values are exploited from the article [
22]. Based on the results, slow attack AGC mode has a 100 percent preamble detection in 2 dB weaker signal power than the logarithmic amplifier approach.
Similarly, the same test is performed for the measurement of packet and bit error rate of both central sampling and multiple sampling methods in various modes.
Figure 11 illustrates explicitly that slow attack PER and BER in the multiple-sampling method is far better for poor signal than other methods. It is worthwhile to note that error correction is not applied during PER and BER tests.
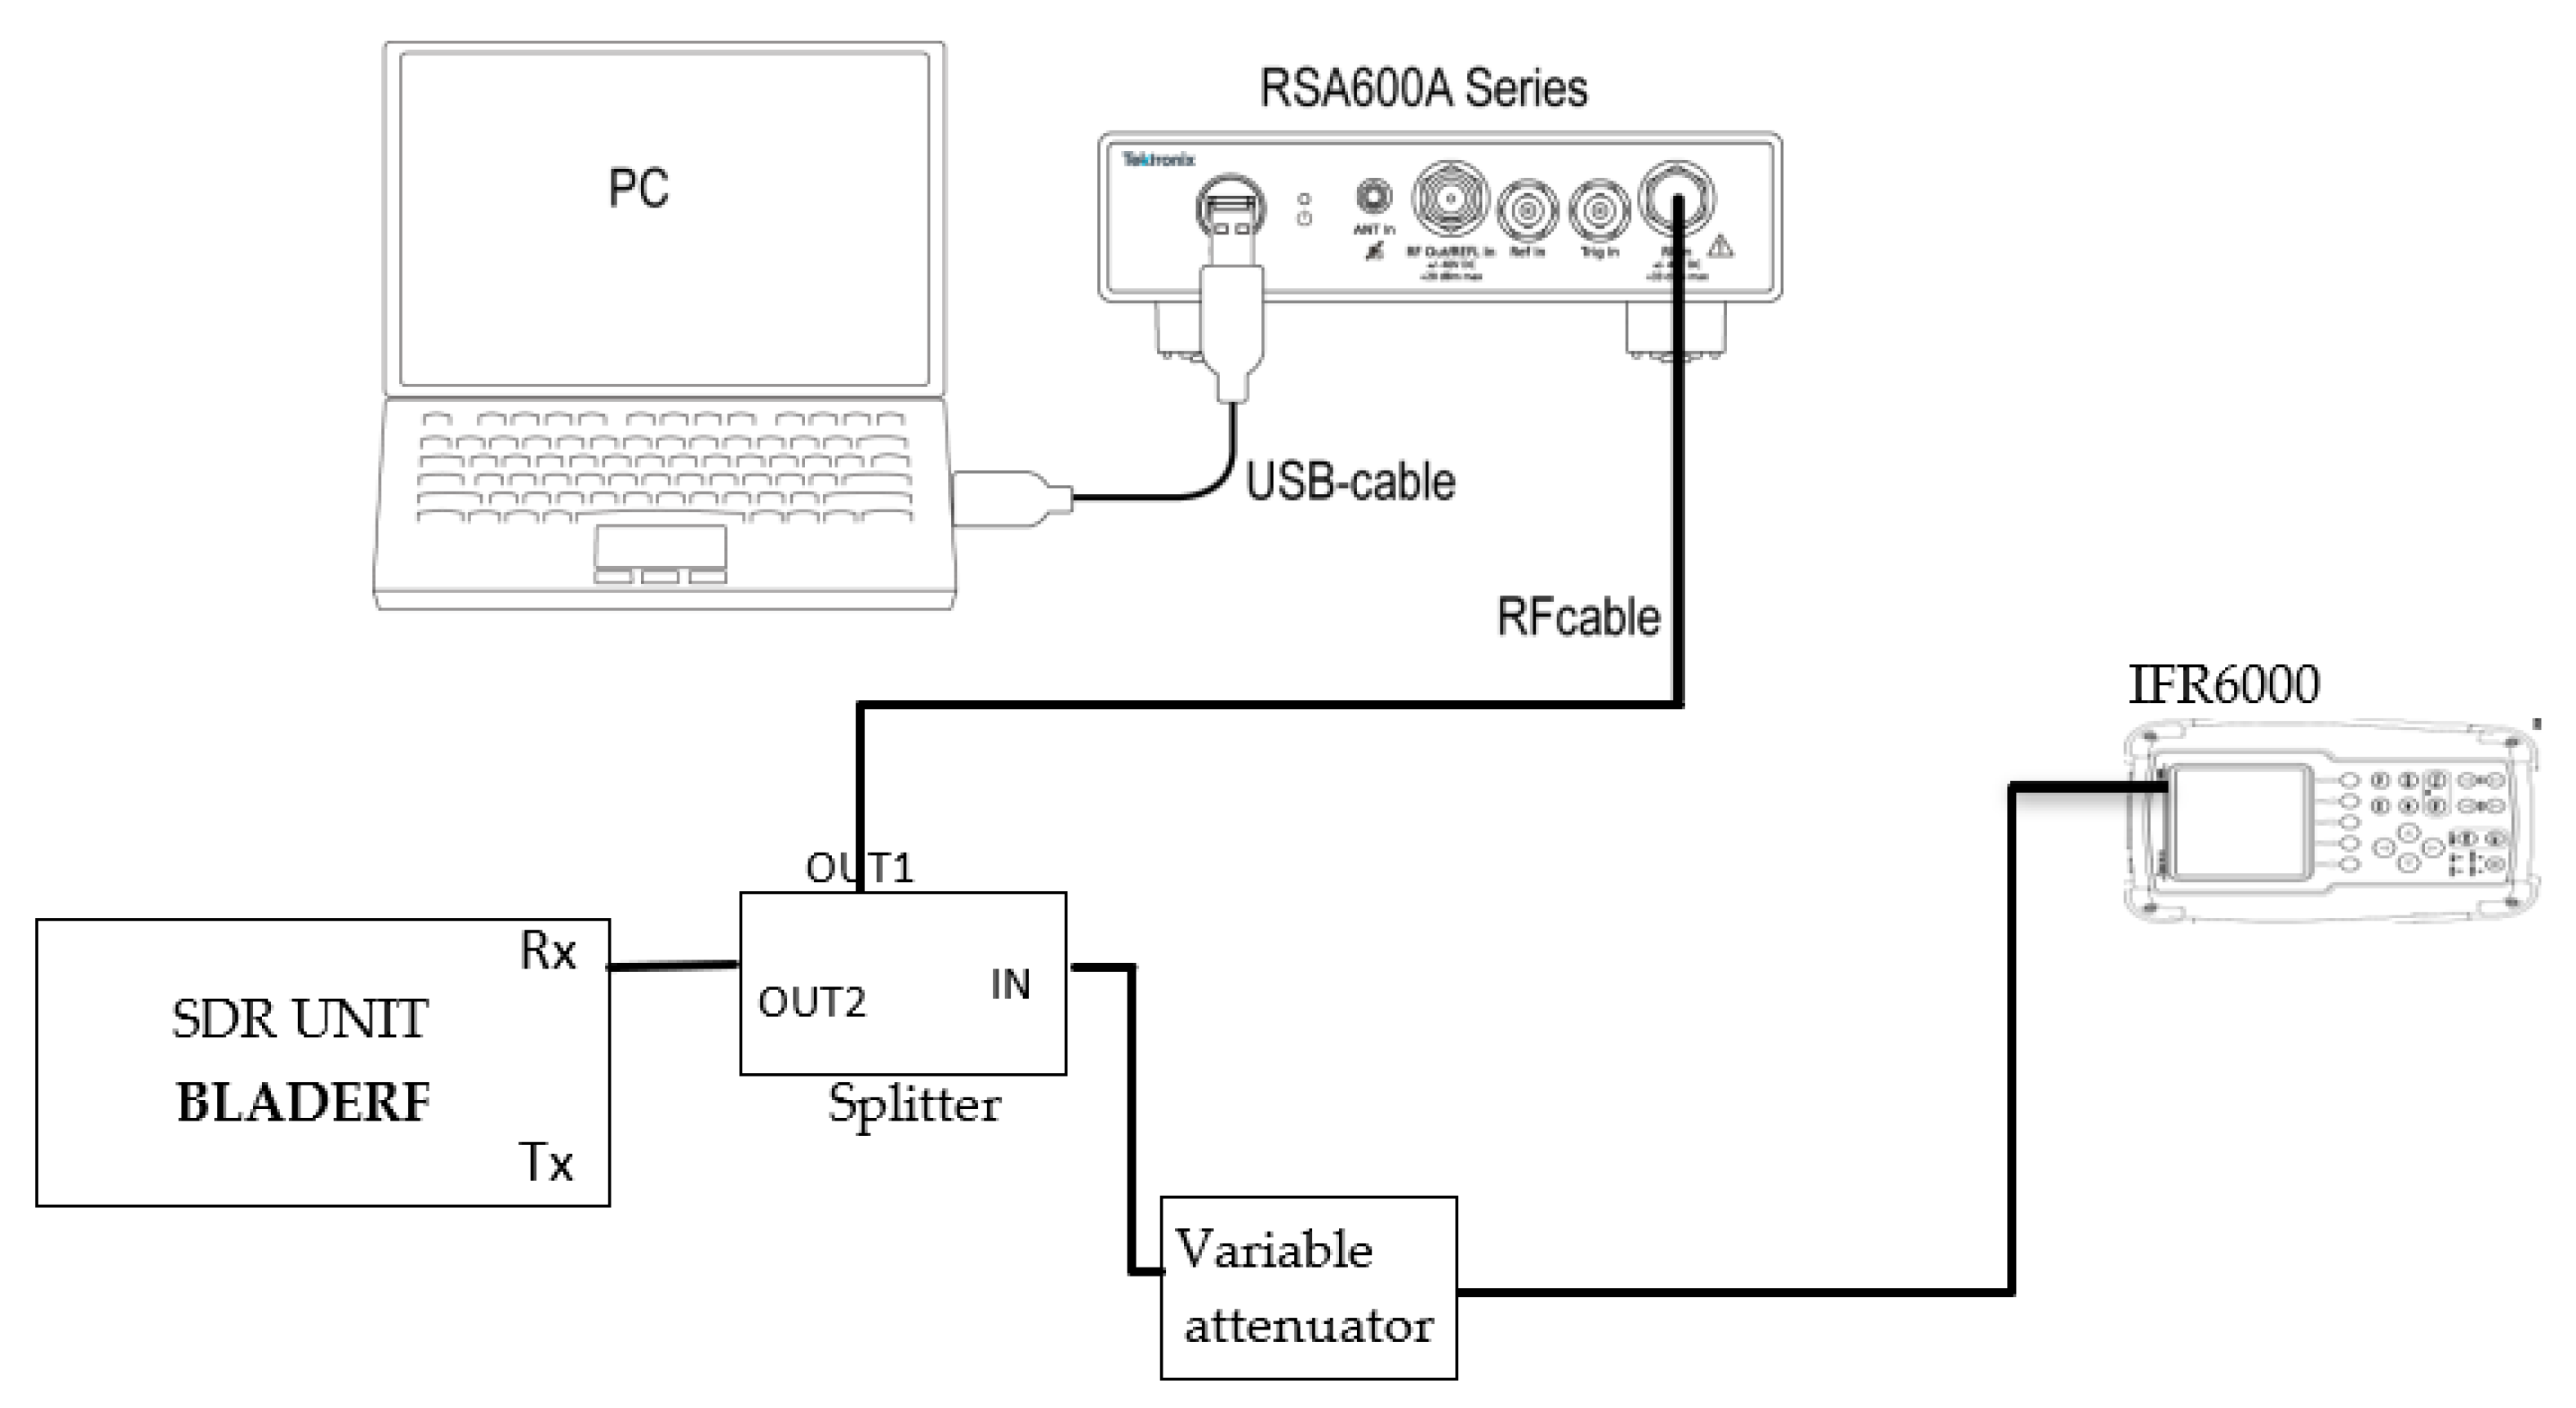
Figure 12 shows the test bench diagram which is designed to perform sensitivity tests in the lab. As the block diagram illustrates, the IFR6000 test equipment generates ADS-B signals, afterward, the signal is weakened by a variable attenuator. Then splitter provides two outputs of signal with the same signal strength; one of them is used as Rx input of ADS-B In for the SDR unit under the test and another one is used as spectrum analyzer input to do power measurements. Note that the power splitter is generating 3 dB losses for both parties. Therefore, the received signal power level at BladeRF RX and Spectrum analyzer input is the same.
In addition, FAA proposed the following requirement need to be met at the end of the receiver’s antenna:
The minimum trigger level (MTL) of an ADS-B receiver processing signals within the frequency span of 1089 to 1091 MHz shall respect the MTL constraints which are provided in
Table 2 [
1].
The result of the test for various scenarios including Manual gain control, Slow attack AGC mode, and slow attack AGC with error correction is shown in
Figure 13. It reveals that sensitivity improved significantly by activation of slow attack AGC and tuning its related parameter. Additional accuracy is achieved by applying the error correction algorithm which is explained in
Section 3.3.
Furthermore, it was completely necessary to use a Distance Measuring Equipment (DME) antenna for the flight test to capture and record ADS-B messages as the DME antenna frequency range covers 1090 MHz of ADS-B.
Figure 14 shows all the required equipment for the flight experiment. It is crucial to shield BladeRF with the aluminum box to avoid interference impact on the GPS device.
Considering above mentioned result, slow attack AGC help to leverage ADS-B In sensitivity. Comparing the result of fixed gain and AGC activation demonstrates that in the case of AGC activation, sensitivity criteria are fulfilled and ADS-B In performance is improved significantly since both poor and strong signals power are mapped into the specific range of power signal levels to be detected and decoded. This leads to an extension in reception coverage range as flight tests’ results reveal, ADS-B In coverage range is increased significantly from 20 km to over 500 km according to
Figure 15. The result was extracted from the flight test which was conducted in August 2022. Kindly note that there were no ADS-B signals in the distance range of 230 km to 630 km.
Apart from real-time displaying ADS-B In results, the flight test post-processing and logs analysis was done to validate system performance. In summary, two flight tests were conducted on 13 July and 1 August 2022, the flight duration was about 80 minutes and 70 minutes respectively. Overall, over 137,000 messages without error were decoded, and 185 unique flight IDs were identified. In Addition, the top ten detected flight IDs were identified and validated with FlightAware [
30] log history data.
Figure 16 shows the top 10 detected messages related to the call sign during the flight on the 1st of August 2022. It is important to mention that the call sign is extracted from BDS08 burst data which broadcasts every 5 seconds, and it is used to match position and velocity data to aircraft identification based on ICAO.
The sample result of the comparison is demonstrated in
Figure 17 and
Figure 18.
Figure 17 shows position elements including latitude, longitude, and altitude comparison of sample aircraft with FlightAware logs. In addition,
Figure 18 provides velocity factors consisting of speed and heading comparison for the same aircraft data with FlightAware logs. In both cases, the results are quite matching for a considerable time range (8 min). It signifies that the system is capable to track aircraft continuously without missing any data and it validates the system integrity performance.
Figure 19 shows the number of correctly decoded messages per second. It shows that system is capable to receive and decode over 30 messages per second in the operational environment. To be more specific, it reveals that in some portion of flight time, however, the number of generated ADS-B signals is high, and the system was capable to capture the signal in ADS-B high traffic density circumstances without error. In addition, the system is robust to the internal interference which is generated by vicinity airplanes since there is a chance of overlapping the ADS-B signals.
6. Discussion
The principal goal of this work is to design, develop, and implement an ADS-B software application capable of ADS-B signal reception by deploying advanced algorithms during pulse detection, bit detection, and error correction toward certifiable SDAM and capable of a receiving, decoding, and tracking aircraft information in long-distance ranges with high integrity and robustness. In the meantime, the ADS-B Apps should be not only easily integrated with the airplane but also minimize the size, weight, power, and cost.
Prior to applying the ADS-B reception algorithm in the digital domain, it is completely necessary to have an acceptable RF signal level since setting manual Gain may lead to either saturation in case of the high-power input signal and high gain setting, or loss of data in case of the low-power input signal and low gain setting. While the aim of slow attack AGC activation and applying proper settings is to prevent the above-mentioned circumstances and issues. Proper setting of AGC parameter brings about optimum gain setting according to input signal strength level. Besides, it is crucial to make AGC activated in ADS-B In since signal strength varies based on distance, transmitted signal power, and type of antenna. Furthermore, it is necessary to take into consideration that the slow attack AGC is not the same as digital gain which merely increases the gain of both signal and noise by multiplying the setting factor, and the overall signal-to-noise ratio remains the same. Whereas the slow attack AGC and gain adjustment applied prior to A/D and to the analog signal, thus it enhances quantization error and signal-to-noise ratio (SNR).
In this research, leading-edge pulse detection is used to detect and validate the preamble pulses. Two major factors of accuracy and real-time processing play pivotal roles. Therefore, it is necessary to accomplish accuracy criteria and to consider processing time. As discussed earlier, the leading-edge and multiple amplitude samples algorithms are preferred to cross-correlation and the central sampling approaches. The reason is having high accuracy and robustness to the interference and overlapping phenomenon. In this method, applying a higher sampling rate may lead to improving the accuracy of pulse detection, however, it brings about a higher processing load and may cause data loss.
Apart from pulse detection, the enhanced bit detection algorithm is deployed to detect bits and score each bit’s confidence level. The confidence declaration is computed based on the sample position within the pulse and given higher weightage to center samples. In addition, low-confidence bits are used as possible candidates for error correction if the error syndrome value is nonzero.
Although taking the diverse advantage of antenna array enhances ADS-B receiver sensitivity, in practice installation of more antennas in the aircraft, particularly in small ones is not feasible. In this research, a DME antenna is used in the flight test to validate system performance and behaviors in the operational environment.
7. Conclusions
This paper investigates the end-to-end steps of ADS-B reception methods and challenges and offers a possible solution in each stage. On the one hand, it proposed slow attack gain control to enhance SNR and mitigate quantization error. Thus, the received ADS-B low-level and high-level signal strength maps to the specific range which is quite suitable for the digital domain to do further processing. On the other hand, in the digital domain, the enhanced pulse detection algorithm is deployed to detect pulses and to prevent earlier preamble circumstances. The result proves that the preamble detection accuracy of signals above −86 dBm is 100 percent. Besides, the enhanced bit detection algorithm is used to score bit confidence for detecting bits and applying error correction in case of any CRC error. According to conducted test results, the PER and BER of the multiple-sampling technique are below 10 percent for received signals’ power above −82 dBm. Finally, the system is capable to decode received messages and displaying them in proper format which is quite informative and user-friendly.
Apart from the real-time processing, the logs of decoded messages are used for post-analysis of system performance. Although it is not possible to illustrate all analysis results in this paper, providing samples of results including validation of sample aircraft information like position and velocity elements, and comparing the results with valid resources prove that the system has promising performance in the working environment. Additionally, the results demonstrate that the system is capable to receive and decode ADS-B signals in long-distance range. Besides, the system experienced ADS-B high traffic load during the flight test, and the system is competent to detect and capable to capture a high load of ADS-B traffic which signifies that the system has higher capacity in real-time operation and robustness to ADS-B signal overlapping phenomenon. Overall, the system performance is quite promising.
Despite the designed receiver showing satisfactory results for both in-lab and in-flight, multiple antennas can be utilized to acquire the ADS-B signals from different directions for further improvement (sensitivity and robustness). The system can get the benefit of diversity gain to enhance mentioned key requirements. It is also feasible to be implemented by BladeRF since it has an inbuilt MIMO 2 × 2 feature. For more than two antennas, it is vital to take advantage of more SDRs with the same center frequencies for collecting the ADS-B data simultaneously. It is well worth applying an antenna array for ADS-B receivers in the ground-based station, however, it is not feasible to apply this method for aircraft due to antenna installation limitations. Nonetheless, the receiver is designed and examined in the lab and operational environment to detect preamble pluses, bit detection, and error detection and correction. Even though Montreal’s air traffic load is high, performing the extra experimental tests in a highly congested air-traffic region and validating its performance will bring additional credits in terms of higher load handling as well as ADS-B signal overlapping robustness.


