Article

Environment-Aware Energy Efficient and Reliable Routing in Real-Time Multi-Sink Wireless Sensor Networks for Smart Cities Applications

by
Fatma H. El-Fouly
1,*,
Mnaouer Kachout
2,3,
Yasser Alharbi
3,
Jalawi Sulaiman Alshudukhi
3,
Abed Alanazi
4 and
Rabie A. Ramadan
3,5,*
1
Department of Communication and Computer Engineering, Higher Institute of Engineering, El-Shorouk Academy, El-Shorouk City 11837, Egypt
2
Innov’COM, Sup’Comp, Carthage University, Tunis 1054, Tunisia
3
Computer Science Department, College of Computer Science and Engineering, Hail University, Hail 8650, Saudi Arabia
4
Department of Computer Science, College of Computer Engineering & Sciences, Al Kharj 11942, Saudi Arabia
5
Department of Computer Engineering, Faculty of Engineering, Cairo University, Cairo 12613, Egypt
*
Authors to whom correspondence should be addressed.
Appl. Sci. 2023, 13(1), 605; https://doi.org/10.3390/app13010605
Submission received: 22 November 2022 / Revised: 24 December 2022 / Accepted: 26 December 2022 / Published: 2 January 2023

Abstract

:

Featured Application

Authors are encouraged to provide a concise description of the specific application or a potential application of the work. This section is not mandatory.

Abstract

Internet of things (IoT) is one of the leading technologies that have been used in many fields, such as environmental monitoring, healthcare, and smart cities. The core of IoT technologies is sensors; sensors in IoT form an autonomous network that is able to route messages from one place to another to the base station or the sink. Recently, due to the rapid technological development of sensors, wireless sensor networks (WSNs) have become an important part of IoT. However, in applications such as smart cities, WSNs with one sink might not be suitable due to the limited communication range of sensors and the wide area to be covered. Therefore, multi-sink WSN solutions seem to be suitable for such applications. The multi-sink WSNs are gaining popularity because they increase network throughput, network lifetime, and energy usage. At the same time, multi-hop routing is essential for the WSNS to collect data from sensor nodes and route it to the sink node for decision-making. Many routing algorithms developed for multi-sink WSNs focus on being energy efficient to extend the network lifetime, but the delay was not the main concern. However, these algorithms are unable to deal with such applications in which the data packets have to reach sink nodes within predefined real-time information. On the other hand, in the most existing routing schemes, the effects of the external environmental factors such as temperature and humidity and the reliability of real-time data delivery have largely been ignored. These issues can dramatically influence the network performance. Therefore, this paper designs a routing algorithm that satisfies three critical conditions: energy-efficient, real-time, environment-aware, and reliable routing. Therefore, the routing decisions are made according to different parameters. Such parameters include environmental impact metrics, energy balance metrics to balance the energy consumption among sensor nodes and sink nodes, desired deadline time (required delivery time), and wireless link quality. The problem is formed in integer linear programming (ILP) for optimal solution. The problem formulation is designed to fully understand the problem with its major constraints by the sensor networks research community. In addition, the optimal solution for small-scale problems could be used to measure the quality of any given heuristic that might be used to solve the same problem. Then, the paper proposes swarm intelligence to solve the optimization problem for large-scale multi-sink WSNs as a heuristic algorithm. The proposed algorithm is evaluated and analyzed compared with two recent algorithms, which are the most related to our proposal, SMRP and EERP protocols using an extensive set of experiments. The obtained results prove the superiority of the proposed algorithm over the compared algorithms in terms of packet delivery ratio, deadline miss ratio, average end-to-end delay, network lifetime, and energy imbalance factor under different aspects. In particular, the proposed algorithm requires more computational energy compared to comparison algorithms.

1. Introduction

The wireless sensor network (WSN) contains numerous sensor nodes deployed densely over the monitored area. Such nodes are low-cost and can communicate with each other via wireless links to send their collected data to the sink node. However, energy conservation is a crucial challenge in designing WSNs due to the nodes’ energy constraints. At the same time, since the sensor nodes are usually deployed in hazardous or inaccessible areas, it could be impossible or inconvenient to recharge their batteries. Therefore, the network lifetime and energy saving have great scope in the research field [1,2].
Communication has been proven to be the major source of energy consumption in WSNs [3]. Consequently, many existing routing techniques were used to attempt to find the shortest path for data transmission to minimize energy consumption. However, the shortest path approach did not prolong the network’s lifetime. The network’s energy usage must be balanced for energy-efficient routing [4,5,6].
Although many researchers based their research on the design of routing protocols in WSNs where a single sink is often chosen to prolong the network lifetime [7,8,9,10,11], the WSNs with a single sink still suffers from many problems. The main problem is that the sensor nodes located close to the sink node become depleted more quickly than the other distant nodes of the network ones as they need to relay more traffic in multi-hop WSNs. Therefore, the energy–hole problem emerged due to the unbalanced energy consumption, which will inevitably affect the lifetime of the whole network [12]. As a result, it may be infeasible to use WSN with a single sink. Therefore, to avoid or bypass the energy hole formation problem, multi-sink strategies for avoiding such problems have been developed [5,6,13,14,15]. The main idea of such strategies is that multiple sink nodes are located at fixed positions in the monitored field to collect the sensed nodes’ data. In addition, energy balancing can be achieved among sensor nodes, and thus the energy–hole problem can be effectively mitigated with multi-sink topology; relatively speaking, it is better than a single sink in a number of ways. Firstly, the network throughput can be improved under a multi-sink environment, whereas if any sink node fails for any reason, the data will be transmitted through other sinks.
As the use of multiple sinks decreases, the average distance between sensor nodes and sink nodes, data transmission latency decreases, and the energy consumption is reduced. Last, but not least, deploying multiple sink nodes in the network may help alleviate the traffic congestion issue to some degree [12,16,17]. However, the optimum selection of sink nodes is uncertain since the sensor nodes must choose the best sink for data transfer.
Another challenging issue is that environmental conditions influence the WSN performance since it is commonly installed in hostile environments, exposing sensor nodes and sink nodes to failure. Thus, the network seldom works. For instance, sensor and sink nodes are more likely to fail at high temperatures and might be entirely burnt out. Moreover, their short-circuits probability would be raised at extremely high humidity [7,15,18]. Thus, reducing network performance consequences such as temperature and humidity is important. Therefore, the data flow should be prevented from transmitting through dangerous areas (for example, areas located in a harsh environment). If the data flow crosses a risky zone, such as a fire zone, data delivery will be cut off due to burned relay nodes. Consequently, environmental awareness should be considered when designing the routing algorithm.
Although WSNs are a potential solution for a wide range of real-time applications, such as industrial automation, the sensed data must be delivered to the sink node in real-time (deadline). In this scenario, timely data transfer guarantees that the appropriate actions are made, whereas late data delivery affects the action’s efficacy [8]. Therefore, this issue has to be considered in constructing the routing paths.
Another challenging issue in WSN is the reliability of data transmission, which is the data delivery guarantees reaching its destination. Due to wireless communication’s inherent nature in sensor networks, packet losses are quite inevitable. Wireless connections are prone to network disturbances due to some environmental parameters, such as interference and fading. This would increase the retransmission possibility of lost packets and thus causes more energy consumption and more delivery delay. Therefore, the quality of wireless links is another factor that needs to be considered when designing the routing technique for WSNs [7,8].
For resolving the problems mentioned above, swarm intelligence (SI) approaches are developed to deliver effective optimization solutions for a wide variety of WSN situations because of their flexibility and adaptability in solving many complex problems. Almost all swarm intelligence optimization approaches are inspired by ant colonies, bees, and animal swarms. The ant colony optimization (ACO) approach resembles social ant colonies. The pheromone concentration indicates solution quality in ACO to find the ideal solution. Usually, the problem is connected to pheromone concentration [19,20].
The work in this paper consists of two phases. The first phase is the selection of the optimal sink. The first phase is proposing an efficient sink node selection strategy, as many researchers based their research on problems related to optimal sink selection. Most of them also tried to determine the optimal sink based on nodes’ energy and the transmission energy consumption [21,22] without considering the environmental effect, which may be affected by path changes. Sink node selection under difficult situations is uncertain. Therefore, this paper uses environmental awareness to reduce the sink’s environmental effect. Secondly, the delivery delay of real-time data packets would negatively influence the real-time data flow’s latency and/or throughput. Thirdly, when choosing the appropriate sink algorithm to reduce the packet miss ratio, it is vital to balance the energy costs against the advantages of achieving the delivery time (percentage of delivered packets that missed their deadline). Last, the sink load metric is proposed to maximize network lifetime by balancing all sink nodes’ energy consumption.
The second phase is the routing algorithm, up to our knowledge; numerous research publications have examined the routing problem in multi-sink WSNs. Most suggested solutions aim to increase energy efficiency [5,6,23,24,25,26,27,28,29]. Such studies do not address the environmental effect of routing protocol design. Therefore, they can not adapt quickly to environmental disturbances such as rainstorms and wildfires. To the best of our knowledge, up to the time of writing this paper, only one routing protocol [15] considered energy besides environment awareness to increase routing reliability and energy efficiency under hostile situations. The problem with such an algorithm is that it cannot be used in real-time. So, this paper suggests a routing algorithm that tries to reduce the adverse environmental effects on data delivery and is also suitable for real-time applications. It also looks at the link quality so that it does not send data packets down paths that are not reliable. Additionally, a novel function that interrelates residual energy and sensor node load is advocated to balance energy utilization. The major contributions are as follows:
(1)
Proposing an energy-efficient, reliably environmentally aware for a real-time routing for multi-sink WSNs considering the environmental data, link quality, delay, energy, and load balancing.
(2)
Describing the routing problem in large-scale multi-sink WSN in the form of 0/1 integer programming.
(3)
The routing problem is formulated in the form of 0/1 integer programming for other researchers to understand and reuse.
(4)
Swarm intelligence is introduced as a heuristic solution.
The following is the outline for the paper. Section 2 describes the most related work, while the problem to be solved is stated in Section 3. The problem is formulated in Section 4. The proposed approach is explained in detail in Section 5, while the results are given in Section 6. The paper is concluded in Section 7.

2. Related Work

Researchers have proposed numerous research articles that discuss the routing problem in multi-sink WSNs [5,6,15,23,24,25,26,27,28,29,30]. This section discusses the most related research to our proposed approach.
Sustainable multipath routing protocol for multi-sink WSNs in harsh environments (SMRP) is presented in [15]. A mixed potential field is utilized in such a protocol to make routing decisions. The mixed field is constructed according to the environment information of sensor nodes, nodes’ energy, and depth. The environmental field utilizes sensor node environmental data to prevent data packets from being transmitted on unsafe paths to lower the influence of environmental factors on network data transmission. The potential energy field is used to avoid nodes with insufficient energy in order to improve network energy balance. Using the depth potential field, data packets are directed toward the sink.
However, from the previous study of SMRP algorithm, it is clear that it has some limitations, since they do not consider some critical issues. First, it overlooks the reliability of data transmission. WSNs depend on reliable data transfer. Ignoring such concerns might increase packet loss, waste energy, and delay packet retransmission. This clearly impacts network efficiency. The second issue is that it misses real-time data transmission. Real-time delivery of data is difficult in WSNs. Transmission of crucial real-time data within a predetermined deadline enables prompt action, whereas late delivery reduces the efficacy of the action done. Ignoring this problem might increase missed deadlines and packet drops.
Energy efficient multi-sink routing protocol (EERP) for multi-sink WSNs is presented in [23]. Such an algorithm attempted to find the optimal path for data routing using multiple parameters. The nodes’ energy, energy consumption rate, and hop count are parameters. The nodes’ energy and energy consumption rates balance energy consumption and prevent nodes with low energy from being a part of the routing process. The hop count parameter ensures that data is sent closer to the sink and avoids a loop.
Energy optimized routing algorithm (EORA) for multi-sink wireless sensor networks is proposed in [24]. This routing algorithm uses a hybrid virtual potential field to construct routing paths. The potential hybrid field is constructed according to the nodes’ hop and energy. The nodes’ energy virtual potential field is used to balance energy utilization so as the nodes with low energy are prevented from being a part of the routing decision. Hop virtual potential field guarantees the data flow towards the sink and eliminates routing loops.
Nevertheless, despite the authors of EERP and EORA algorithms [23,24] suggesting trustworthy techniques and effective energy, they do not consider some critical issues. First, they ignore environmental consequences. Neglecting this challenge might make them unable to adapt to environmental changes such as wildfires and rainstorms, as well as impairing network performance. Secondly, they don’t account for lossy links caused by fading and interference. As described previously, ignoring such a problem might increase data loss, retransmission delay, and energy waste. Finally, they can not achieve real-time communications; therefore, they can not send data packets before the deadline. As has been said, timely data supply ensures relevant actions are made, whereas late data delivery reduces the efficacy of such activities.

3. Problem Modelling

This section describes the research problems, and our primary goals are explained. Consider that a set of sensor nodes monitors a field F(A) for a time horizon T . This monitored field is divided into N equal-sized zones. The set of zones is denoted by A = { A 1 , A 2 , , A N } . A time-varying weight metric is assigned for each zone iA, where tT. This weight metric specifies the significance of each zone’s observations across horizon T. (surveillance requirements).
Prior studies were based on static and location-aware sensor nodes. Additionally, the data from the monitored field sensors is collected by using multiple sink nodes. Networks are represented using undirected weighted graph G (V, E), where V is the nodes set, and E is the edges, where x, yV. Vertices represent sensor nodes, whereas edges indicate communication connections between them. An edge exists between nodes x and y only if they can communicate. Additionally, the MAC layer PRR [31] measures connection quality.
Let us start with one of the main goals in this paper, which is the selection of the optimal sink for data collection that plays a vital role in conserving the sensor nodes’ energy to extend the network lifetime. So, the selected sink node should meet the following restrictions:
(1)
Provides the shortest transmission distance to minimize energy consumption.
(2)
Provides the minimum value for the proposed load metric to achieve balanced energy consumption.
(3)
Away from the danger zones to keep the path of the data transmission safe as much as possible.
(4)
Provides the lowest end-to-end latency for real-time data transmission and eliminates sensor node buffer overflow due to limited buffer capacity.
The second goal of this paper is to shorten the communication distance along the routing path to save energy and make the network last longer. Additionally, energy management is considered while designing the proposed routing protocol. It also examines how to reduce environmental factors’ influence on urgent data packet routing by avoiding hazardous zones and finding the safest paths to the sink. Real-time transmission of urgent data packets is discussed. Additionally, the issue of reliable routing paths is discussed. To attain this aim, the proposed route must fulfill the following criteria:
(1)
Minimum communication distance.
(2)
Less likely to be cut off as a result of environmental reasons.
(3)
Maximum reliability.
(4)
Minimum end-to-end delay.
(5)
In order to establish a better energy balance, the nodes participating in the path have the highest value resulting from the new proposed energy load function.

4. Formulation for Optimal Solution

Due to our optimization expertise, addressing issues optimally makes them simpler to grasp for a better heuristic to be utilized later. In this section, the problem is mathematically formulated based on integer linear programming (ILP). Although ILP assures an optimal solution and a thorough knowledge of the problem’s major limitations and large-scale problems are intractable due to time and/or memory requirements. To ensure the efficiency of the given solution, ILP is used to address small-scale problems. To fully understand our solutions’ notations, see Table 1.
In this paper, the routing problem in multi-sink WSNs is one of the NP-hard optimization problems in which the optimized path for each source node should pass through a predefined set of the relay nodes in the sensor field where each relay node can be visited only once. However, optimal path determination is challenging due to many of the constraints to be taken into consideration.
Let us begin with the environmental constraint. The sensor nodes and mobile sink in WSNs are particularly prone to failure when they are deployed in hostile areas. So, the mobile sink must not cross through dangerous areas. Additionally, the environmental effect on urgent data routing should be lowered as much as possible. Such data must not be sent across dangerous places to guarantee reliable transmission in harsh environments.
To calculate the environmental effect of a single factor f on zone i at time t, apply the following equation:
E I i f ( t ) = { 1 i f   ZED L f ZED i f ZED H f Z E D H f Z E D i f ZED max f ZED H f + 1 i f   ZED i f > ZED H f ZED i f ZED L f ZED L f ZED min f + 1 i f   ZED i f < ZED L f
Inspired by [7], Equation (1) shows the scenario:
First, the environmental data value of any zone i for environmental factor f is computed. Based on the normal operating range ( E D L f , E D H f ) , if it is achieved, it means that the sensor nodes’ performance in that zone would not be influenced by environmental factor f, which means the environmental effect metric E I i f ( t ) is set to 1. Suppose zone i’s environmental data are beyond the typical range. In that case, environmental factor f will detrimentally affect the sensor nodes in that zone, causing them to deteriorate and increasing the risk of malfunctions. Therefore, E I i f ( t ) is decreased. Figure 1 depicts the trend of the given function in Equation (1), which reflects the environment single factor impact metric.
Actually, many environmental factors influence the performance of WSNs. So, the environmental impact metric should be determined for multiple environmental factors as follows [15]:
M E I i ( t ) = min { E I i f 1 ( t ) , E I i f 2 ( t ) }
where E I i f 1 ( t )   and   E I i f 2 denotes to the single environmental effect metrics of zone i at time t in relation to the environmental factors f1 and f2. Indeed, suppose the sensor nodes’ performance in a certain zone would be severely affected by one of the many environmental factors. In that case, the sink node shouldn’t cross that zone. Additionally, its sensor nodes should be prevented from being selected as a next-hop through the routing process of urgent messages. Therefore, among the environmental metrics values of different factors, the multiple environmental impact metric is represented by the minimum value [18].
On the other hand, if such a wildfire occurs in a particular zone, it is expected to spread rapidly to neighboring zones. So, neighboring zones are still considered hazard zones even though this incident did not spread to them. For urgent data, to keep the mobile sink path and routing paths from environmental risks as early as possible, it is important to link each zone’s environmental effect metric with its neighbors. A zone’s environmental impact on zone j is defined as follows [15]:
N E I i j ( t ) = K i j M E I j ( t )
The attenuation coefficient, Kij was calculated as follows:
K i j = 1 + E D i j E D i j min E D i j max E D i j min
where E D i j min and E D i j max represent the minimum and maximum distance between the center of zone i and j. For square/circular zone with side length/diameter, a, E D i j min and E D i j max could be calculated as follows:
E D ij min = a
E D ij max = 2 2 a
For rectangular shaped zone with side length, L, and side width, w, E D i j min and E D i j max could be calculated as follows:
E D ij min = L
E D ij max = 2 L 2 + w 2
Equations (3) and (4) show that the attenuation coefficient is proportional to zone i and j distance. This is because each zone is more sensitive to environmental threats from its neighbors when they are closer. As numerous bordering zones surround each zone, each has its own neighboring environmental effect metric. As the final neighbouring environmental effect is the least value across all adjacent metrics is chosen as follows:
N E I i ( t ) = min { N E I i j ( t ) | j N Z i }
Finally, the final environmental effect of zone i is computed by combining the multiple environmental impacts M E I i ( t ) and the environmental impact of the neighbouring zone N E I i ( t ) , as follows:
F E I i ( t ) = { M E I i ( t ) i f   N E I i ( t ) = 1 M E I i ( t ) + N E I i ( t ) 2 + exp ( K i j ) o t h e r w i s e
According to Equation (10), the proposed final environmental effect metric is based on the insignificant nearby environmental impact during normal operation periods. If a neighbour’s environmental effect is one, it is appropriate to ignore it. As a zone’s neighbour’s attenuation coefficient drops, so should its final environmental metric. This means the closest neighbourhood zone will have a larger environmental impact. So, the final environmental metric should be proportional to the attenuation coefficient. Finally, the exponential function is used where a small attenuation coefficient value results in a reasonably large decrease in the proposed metric result.
We must assess the impact of the environmental characteristics on each sensor node or/and sink node since the routing algorithm must avoid risky regions. According to Equation (11), the following is the ultimate environmental effect measure for a sensor/sink node x in zone i is defined in Equation (11) as follows:
E I M x i ( t ) = F E I i ( t )
In an optimal sink selection algorithm, in order to avoid the sink node in the danger zones, the sink nodes in the candidate sink node set S N t that have a final environmental impact metric larger than the threshold value are added to the final candidate sink node-set, F S N t . Formally, as in Equation (12),
F S N t = { s i | s i S N t , E I M s i i ( t ) > E I t h } .
Actually, due to the use of a multi-hop routing technique, the sink node neighbors must be used as relay nodes. That is to say, the residual energy of the sink’s neighbors can reflect the load of the corresponding sink. Therefore, to achieve load balancing among multiple sink nodes, the sink node suffering from a heavy load should be avoided, and thus some measures should be taken to make the sensor nodes transmit their data to the other sink nodes. In this paper, the minimum residual energy of the sink node neighbors is used as a measure of each sink node load. Equation (13) presents the sink load metric of candidate sink node si at time t:
S L M s i ( t ) = min ( R E S N E s i )
Indeed, developing a routing algorithm that balances energy usage and energy awareness while being suitable for real-time applications is a big challenge. Therefore, the routing algorithm should prioritize energy-efficient transmission while being suitable for real-time applications. Consequentially, in our model, the distance-hop metric is incorporated into the optimal sink selection decision. As indicated in Equation (14), the energy metric of each sink node si is constructed by using the minimum hop counts from the source node s to the candidate sink si as follows:
D h M s i s = 1 m h c s s i
The real-time data must be sent to the mobile sink within predefined deadlines; performance is assessed by how many packets are received before the deadline. Therefore, urgent messages must be transmitted with the proper latency, reducing packet loss. For a particular sink node si selected by sensor node x, the desired delivery speed for the message is defined by Equation (15) as follows [32]:
D s x s i = E D ( x , s i ) ( t ) D e a d l i n e
According to Equation (15), the desired speed is directly proportional to the sink node distance. As the sink’s distance grows, the needed speed increases. Therefore, critical messages will not arrive in time. Consequently, the increase in lost packets affects real-time performance. Therefore, taking into account the minimization of the distance to sink nodes in selecting the optimal sink node is highly required to enhance real-time performance. Consequently, this paper considers the distance to the sink node, whereas the sink node with the minimum distance should be selected as the optimal sink node.
In case of events occurring in some areas, the routing procedure is invoked. Hence, this paper’s main problem is finding the optimal sink node and route for data transmission. The developed routing algorithm aimed at minimizing packet loss ratio and end-to-end delay of the routing path simultaneously. A set of constraints is defined for such optimization problems, including energy consumption balance, environmental impact minimization, reliability of data transmission, and real-time data delivery.
It is known in WSNs that communication energy is related to the transmission distance. The quickest way considerably decreases energy use. However, the shortest path approach did not prolong the network’s lifetime. The network’s energy usage must be balanced for energy-efficient routing.
Relying entirely on sensor nodes’ residual energy is not the ideal way to establish network energy balance [7]. The routing protocol must refrain from using low-energy, high-traffic nodes as next-hops in order to achieve a better energy balance. Using the recommended new function, the energy load function, it is feasible to include the remaining energy and traffic load of sensor nodes and let them significantly impact choosing the next hop [7].
The total number of messages sent by each node should match that of the node. This should contain the number of messages at such node and neighboring nodes to relay. Equation (16) presents the proposed traffic load function of node y at time t.
N L y ( t ) = { T M y ( t ) i f   E D ( y , M S ) ( t ) E D ( x , M S ) ( t ) 0 o t h e r w i s e
E C L y ( t ) = 1 exp ( I E y ( R E y ( t ) ( N L x ( t ) H E x y ) ) I E y )
Equation (17) suggested new energy consumption load function expresses node y’s energy use after sending all messages. Any tiny change in the exponential function input causes a huge output change. By exponential function, a slight change in nodes’ energy leads to selecting the most energy-efficient relay node [33].
Urgent, real-time data must be sent to the chosen sink within predefined deadlines; performance is assessed by how many of packets received before the deadline. Therefore, real-time messages must be transmitted with the proper speed, reducing packet loss. Equation (18) defines the required message delivery speed for candidate node y as follows:
R d y ( t ) = E D ( x , s i ) E D ( y , s i ) d e l a y x y
For every neighbour node x, its candidate neighbours C N E N x with relaying delays smaller than the required delay are added to the final candidate neighbour set F N E N x . Formally, as in Equation (19),
F N E N x = { y | y C N E N x , R d y > D s x s i }
As in Equations (20) and (21), the total end-to-end delay and packet loss ratio of the routing paths from all source nodes S t to the selected sink nodes in a graph G is defined as the summation of all edge contributions along the routing path:
Total   packet   loss   ratio   ( G , L ) = t T s S t m M s t x , y E ξ x y s m P L R x y
Total   end-to-end   delay   ( G , L ) = t T s S t m M s t x , y E ξ x y s m D x y
The problem is formulated using the computations:
Z I P 1 = min t T s S t m M s t x , y E ξ x y s m P L R x y
Z I P 2 = min t T s S t m M s t x , y E ξ x y s m D x y
Subject to:
s i S N t r s i E I M s i t ( t ) > E I t h t T  
s i S N t r s i 1 t T
s i S N t ψ s i s = 1 s S , t T
n F S N t { s i } E n ( E I M s i i ( t ) E I M n j ( t ) ) < 0   s i F S N t , t T
2 n F S N t { s i } E n = I s i + 1 s i F S N t , S t V , t T
n F S N t { s i } E n 1 s i F S N t , S t V , t T
s i F S N t I s i 1   F S N t S N t , S t V , t T  
k F S N t { s i } h k s ( D h M k D h M s i ) < 0 s S t , s i F S N t , S t V , t T
2 k F S N t { s i } h k s = d s i s + 1 s S t , s i F S N t , S t V , t T
k F S N t { s i } h k s 1 s S t , s i F SN t , S t V , t T  
s i F S N t d s i s 1 s S t , FSN t SN t , S t V  
k F S N t { s i } ε f ( S L M f ( t ) S L M s i ( t ) ) < 0 t T
2 f F S N t { s i } ε f = m s i + 1 s i F S N t , F S N t S N t , t T
f F S N t { s i } ε f 1 s i F S N t , s S t , S t V , t T
s i F S N t m s i s   1   s S t , S t V , F S N t S N t , t T
s i F S N t I s i d s i s m s i ψ s i s s S t , S t V , t T
y C N E N x c y R d y > D s x s i x , C N E N x V , s i FSN t  
y C N E N x c y 1 x , C N E N x V  
y F N E N x o y ( p P y S i α ( y , s i ) p ) > 0 FNEN x V , s i S N
y F N E N x o y 1 FNEN x V
x F N E N x ω x y s m 1 s S t , m M s t , y F N E N x , S t , F N E N x V , t T
l F N E N x { y } a l ( R d l ( t ) R d y ( t ) ) < 0 y F N E N x , F N E N x V , t T
2 l F N E N x { y } a l = d e y + 1 y F N E N x , F N E N x V
l F N E N x { y } a l 1 y F N E N x , F N E N x V
y F N E N x d e y 1 F N E N x V
υ F N E N x { y } b υ ( E C L y ( t ) E C L υ ( t ) ) < 0   y F N E N x , F N E N x V
2 υ F N E N x { y } b υ = e y + 1 y F N E N x , F N E N x V
υ F N E N x { y } b υ 1 y F N E N x , F N E N x V
y F N E N x e y 1 F N E N x V
n F N E N x { y } v n ( E I M y i ( t ) E I M n j ( t ) ) < 0 y F N E N x , F N E N x V
2 n F N E N x { y } v n = N y + 1 y F N E N x , F N E N x V
n F N E N x { y } v n 1 y F N E N x , F N E N x V
y F N E N x N y 1 F N E N x V
y F N E N x c y o y e y N y ω x y s m s S t , m M s t , x , S t , F N E N x V , t T
x , y L ξ x y s m 1   s S t , m M s t , S t V , t T
p P y t α y p 1 y F N E N x , F N E N x , x V , t T
{ r s i , ψ s i s , E n , I s i , h s i s , d s i s , ε f , m s i , ξ x y s m , α y p , ω x y s m , c y , o y , b υ , e y , v n , N y } = 0   or   1 s S t , m M s t , x , n , ν , S t V , t T
Constraints in Equations (24) and (25) ensure that the final candidate sink node set F S N t has only the sink nodes with a final environmental impact metric larger than the threshold value; it often has fewer members S N t . If no sink nodes in the candidate set S N t fulfil this condition, the F S N t will have no members. Therefore, such constraints are also used to ensure that F S N t has members. Otherwise, the network fails. Constraint in Equation (26) is used to avoid cycles. For each time interval, the selection of the sink node si as the optimal sink for each source node s has a cost of 1. Constraints in Equations (27)–(30) guarantee that the selection of a sink node si as the optimal sink for source node s satisfies the maximum final environmental impact metric condition so that the data packets are transmitted on a safe path away from the dangers area. Constraints in Equations (31)–(34) are used to find the best trade-off between energy consumption and target delay. Any source node s must choose only one sink node si from the final sink nodes set F S N t , which has the minimum value of D h M s i compared with other sink nodes. Constraints in Equations (35)–(38) are utilized to balance multiple sinks load, which significantly enhances network lifetime. The selected sink si must have the maximum value of load metric compared with other candidate sink nodes. Constraint in Equation (39) ensures that the decision variable ψ s i s is enforced to 1 when the sink node si has the maximum value of both metrics E I M s i i ( t ) and S L M s i ( t ) , and the minimum value of D h M s i s compared with other sink nodes.
Constraints in Equations (40) and (41) are utilized to ensure that the forwarding candidate neighbor set F N E N x contains only the neighbor nodes that have relaying speeds higher than the desired speed; it has often less members than C N E N x . If no neighbor node in the candidate set C N E N x satisfies this condition, the F N E N x will not have a member. Therefore, such constraints are used to ensure the presence of members in the set F N E N x otherwise, drop control is called. Constraints in Equations (42) and (43) ensure that every neighbor node y reaches the selected sink node. Any neighbor node y must be on at least one path to the selected sink. Constraint in Equation (44) is intended to prevent any cycle. For the same source node s and message m, the use of any neighbor node y as a relay node has a cost of 1. Constraints in Equations (45)–(48) ensure that only one neighbor node y meets the maximum relaying speed criterion while real-time data packets are delivered to the selected sink on time. Constraints in Equations (49)–(52) ensure energy consumption balance to prolong the network lifetime. The only neighbor node y that has the highest value E C L y ( t ) must be selected from the final neighbor set of the sensor node x. Constraints in Equations (53)–(56) guarantee that the sensor node x selects only one neighbor node y from its final neighbor set that meets the maximum final environmental impact metric condition so that data packets are sent to the selected sink in safe paths away from hazards. Constraint in Equation (57) is utilized to ensure that the decision variable ω x y s m is enforced to 1 when: (1) the neighbor node y reaches the selected sink, (2) it has the minimum value of R d y compared with other neighbor nodes, and (3) it has the maximum value of E I M y i ( t ) and E C L y ( t ) compared with other neighbors. Constraints in Equations (58) and (59) are a redundancy constraint, where all x , y L d x y s m and p P y s i α y p must be greater than or equal to 1. Constraint in Equation (60) the decision variables { d x y s m , α y p , ω x y s m , c y , o y , b υ , e y , v n , N y } are equal to 0 or 1.

5. Swarm-Based Solution

This section presents the greedy algorithm as the optimum method discussed previously is not applicable for large-scale WSNs. The recommended method is for small and large-scale real-time WSNs.

5.1. Optimal Sink Selection Problem

In ACO, ants search for a solution to the optimal sink selection issue by randomly moving around the sink nodes set at each time interval. Each ant k begins its tour at each source node and constructs connected covers by transitioning between sink nodes in the development graph. Ant k applies a probabilistic transition rule at each tour construction step to select which sink node it will be selected next. The probability that ant k will select sink node si for source node s is given by:
P s s i k ( t ) = [ τ s s i 1 ( t ) ] ω 1 [ η s i 1 ( t ) ] ω 2 [ λ s i 1 ( t ) ] ω 3 l F S N t [ τ s l 1 ( t ) ] ω 1 [ η l 1 ( t ) ] ω 2 [ λ l 1 ( t ) ] ω 3  
-
τ s s i 1 ( t ) represents the pheromone value at time t, η s i 1 ( t ) between sink node si and source node s.
-
ω 1 , ω 2 , and ω 3 are the weight factors that control the pheromone value and the heuristic information parameters, respectively, and η s i 1 ( t ) and λ s i 1 ( t ) are the heuristic information.

5.1.1. Pheromone Calculation

The pheromone value is updated using the distance hop metric since the selected sink node should offer the most suitable trade-off between energy utilization and in-time data delivery. The increasing density of the pheromone value is as follows:
Δ τ s s i 1 = D h M s i s
The increase in the pheromone density is defined as:
τ s s i 1 ( t ) = ( 1 ρ 1 ) τ s s i 1 ( t 1 ) + ρ 1 Δ τ s s i 1
where ρ 1 ( 0 , 1 )   ρ UOTE is the evaporation factor [7].

5.1.2. Calculation of the Heuristic Information

Since it is essential to make the data transmission invulnerable to environmental impact, the data messages should be transmitted on a safe path away from the dangerous area. So, the environmental impact metric is considered as heuristic information that helps select the sink node under suitable environments and bypass the dangerous areas to a certain limit. The selection of the sink node with maximum environmental impact is required to lower the impact of the external environmental factors on the data transmission. Thus, the final environmental impact metric of sink node si in zone i is used as heuristic information as follows:
η s i 1 ( t ) = E I M s i ( t ) l F S N t E I M l ( t )
The candidate sink node with a higher η s i 1 ( t ) value has less negative impacts on packet delivery and will be selected as the optimum sink.
Any sink node with heavy weight should not be selected to balance sink node traffic and prolong the network lifetime. As a result, while choosing the sink node, the load metric of sink nodes is used as heuristic information, as demonstrated by:
λ s i 1 ( t ) = 1 S L M s i ( t ) l F S N t 1 S L M s i ( t )
The candidate sink has a higher λ s i 1 ( t ) value, implying it has less load and will be picked more often.

5.2. Routing Problem

The original ACO method has been updated since it must minimize both time and complexity for the suggested algorithms to be acceptable for real-time applications:
Any real-time data packets should be routed via the relay nodes until they reach the selected sink. Each source node looks at its neighbors and unicasts the packet to the best one using the ACO algorithm probability. The packet is then routed via this neighbor, who has chosen the best relay node among its neighbors until it reaches the selected sink. This means a route has been identified from the source node carrying crucial data to the designated sink, and the data packet arrives simultaneously. This reduces the ACO method’s time and complexity. It is decided during packet transmission which path the real-time data packet will take.
Two steps make up the suggested solution. If a particular source node in the first phase has to communicate real-time data to the selected sink through the routing process, it sends a forward ant across neighboring nodes, which serves as a relay node until the selected sink receives the data. Before choosing the relay nodes, each node must determine which of its neighbors is allowed to take part in the routing operations. The neighbor nodes that can achieve the necessary speed are the ones that are qualified to be regarded as candidate relay nodes and participate in the routing process. The neighbor node is qualified if it can transmit the data packet to the selected sink in a period of time that is less than or equal to the packet’s remaining deadline. On the other side, we will cooperate with all neighbor nodes if no neighbor node meets such a requirement.
Second, the forward ant chooses the next hop based on probability as a relay node at each neighbor node. The likelihood of choosing a neighbor to serve as the next-hop relay node, which is specified by Equation (65), is computed using a number of variables, including the relaying speed, environmental effect metric, energy consumption load metric, connection quality, along with the pheromone value as follows:
P x y k ( t ) = [ τ x y 2 ( t ) ] ϕ 1 [ η x y 2 ( t ) ] ϕ 2 [ λ x y 2 ( t ) ] ϕ 3 [ β x y 2 ( t ) ] ϕ 4 [ γ x y 2 ( t ) ] ϕ 5 [ δ x y 2 ] ϕ 6 l F C H N x [ τ x l 2 ( t ) ] ϕ 1 [ η x l 2 ( t ) ] ϕ 2 [ λ x l 2 ( t ) ] ϕ 3 [ β x l 2 ( t ) ] ϕ 4 [ γ x l 2 ( t ) ] ϕ 5 [ δ x y 2 ] ϕ 6
where τ x y 2 ( t ) is the pheromone value of the link (x, y) at the time t, η x y 2 ( t ) , λ x y 2 ( t ) , β x y 2 ( t ) , γ x y 2 ( t ) , and δ x y 2 ( t ) are the heuristic information; ϕ 1 , ϕ 2 , ϕ 3 , ϕ 4 , ϕ 5 , and ϕ 6 are the control factors that control the pheromone value and the heuristic information parameters, respectively.

5.2.1. Pheromone Calculation

Path quality and latency are used to determine the update pheromone. This improves network reliability and latency. Transmission, propagation, queuing, and processing are end-to-end delays. The processing delay may be removed owing to the sensor nodes’ speed [8].
Pheromone density increase along path p is defined as:
Δ τ 2 = ( P R R p ) + ( I D L d e l a y p )
The forward ant travels to the mobile sink, where the pheromone update value is calculated and sent back to the source node as a backward ant. Whenever a node x receives a backward ant from a node y, it modifies the concentration of pheromones in the following way:
τ x y 2 ( t ) = ( 1 ρ 3 ) τ x y 2 ( t 1 ) + ρ 3 Δ τ 2
where ρ 3 ( 0 , 1 ) ρ ∈ (0,1) tells the pheromone evaporation rate, which is the evaporation constant that [5].

5.2.2. Heuristic Information Computation

A final environmental impact metric is taken into account to ensure that the routing protocol is not exposed to environmental impact, which helps select cluster heads in suitable surroundings and bypasses harmful places to a certain extent. Thus, the following heuristic information is calculated by the final environmental impact as follows:
η x y 2 ( t ) = E I M y i ( t ) l F C H N x E I M l i ( t )
The candidate relay node with a higher value η x y 2 has less environmental influences on urgent data packet delivery and is more likely to be chosen.
To guarantee timely delivery of urgent data, pick the forwarding node with the greatest relaying speed among candidates. Relaying speed is heuristic information calculated by Equation (70).
λ x y 2 ( t ) = R d y ( t ) l F C H N x R d l ( t )
The candidate relay that has a higher value of η i j 1 offers more speed in the transmission of real-time data and has more chance of being the next relay. Selecting the neighbor node with the highest relaying speed at each hop will reduce the delivery time.
The suggested energy consumption load metric is heuristic information that is considered since energy consumption balance is a critical difficulty in designing an energy-efficient routing algorithm for WSNs.
β x y 2 ( t ) = E C L y ( t ) l F C H N x E C L y ( t )
The neighbor node with a higher value of β x y 2 has a higher residual energy after sending all its traffic load messages, and thus has a more chance of being selected as the next forwarder. Some crucial data packets may be lost as a consequence of the lossy links in WSNs, wasting energy, and adding to the delay caused by the need to retransmit missing packets. One main thing affecting end-to-end latency, packet delivery rate, and energy efficiency is packet loss. The lossy feature of wireless connections across it may be described by the PRR. As a result, the following is how the path quality is defined. As a result, the connection quality is regarded as heuristic data, which are defined as:
γ x y 2 ( t ) = P R R x y l F C H N x P R R x l
The forwarder node with a greater value of γ x y 2 has a better link quality and has more opportunity to be chosen as a relay node.
In resource-constrained WSNs, the real-time routing algorithm should identify next-hop nodes that give the best energy/latency trade-off. Therefore, hop counts to the sink should be regarded as a heuristic for routing decisions.
δ x y 2 ( t ) = 1 m h c y s i l F C H N x 1 m h c l s i
A neighbour node with a greater δ x y 2 value is closer to the sink node than the other candidates and has a better probability of becoming the next forwarder.

6. Performance Evaluations

To assess the effectiveness of our proposal, numerical simulation experiments are carried out in this section. The assessment criteria are presented first. The assessment process is then explained. The simulation results and benchmark comparisons are then shown.

6.1. Performance Evaluation Criteria

Four quantitative measures are taken into account to provide a balanced assessment of the effectiveness of the proposed method. Here is a breakdown of the standards we will be using to evaluate the candidates:
-
Network Lifetime [8] is the amount of time that has passed since the network’s first node failed because of a dead battery.
-
Packet Delivery Ratio (PDR) [8]. The ratio of the number of messages successfully received by the sink node to the total number of messages sent by all source nodes.
-
Deadline miss ratio [8]. This is the number of packets whose deadlines were missed because they never reached the sink node.
-
Average end-to-end delay [8]. This is the meantime for a data packet to transit from its source nodes to the sink.
-
Energy Imbalance Factor (EIF) [15]. This is the standard deviation of the network’s residual energy. It is a measure of the routing protocol’s efficacy in terms of energy-saving balance.
E I F = 1 n i = 1 n ( R E i R E a v g ) 2
where n, REi, and REavg are the number of nodes, the node’s i residual energy, and all nodes’ average residual energy, respectively

6.2. Simulation Model

Our proposed algorithms were rigorously tested through a set of experiments built into the Matlab environment. All of the tests were performed on a Windows 7 machine equipped with a 2.3GHz Intel Core i5 dual-core CPU, 4GB of RAM and the latest updates. The simulation setup includes a mobile sink and N sensor nodes spread out across a 1000 m2 region. All sensor nodes are assumed to be stationary after deployment. After being deployed into a field, all sensor nodes are supposed to remain in one place. It is also assumed that the mobile sink will begin its journey through the cluster heads from the centroid location. The mobile sink must move between the cluster nodes and then return to its original place. The simulation results for homogenous networks are presented. Moreover, all subsequent tests are carried out on the premise that the network is impacted by environmental events such as forest fires and rainstorms.
As in [15], we used a radiation model to simulate wildfires. The data flow is generated by a Poisson process with a mean parameter, λ. In addition, the study uses a model of WSNs with lossy links (see [34] for more information). The energy-consumption model described in [34] is used in our experiments. The simulation settings are summarised as follows.
The uniform random deployment strategy is used for the conducted experiments. An amount of 300 sensor nodes are deployed in the monitored field with a maximum retransmission number limited to 4. Additionally, the packet size and the buffer size are set to 50 bytes and 128 bytes, respectively. Moreover, the path loss exponent is set to 3, and the frequency is set to 868 MHz. For the transmission power, the initial energy of nodes and noise floor are set to 0 dBm, 125 mJ, and −115 dBm, respectively. Regarding the maximum radio range, data rate, shadow fading variance, reference distance, event area (wildfire), event area (rainstorm), extreme range (temperature), and extreme range (relative humidity) are set to 150 m, 20 Kbps, 3, 1 m, circles with a radius from 5 m and 50 m, block-shape with coverage from 1000 m2 to 40,000 m2, [0, 50] °C, [30%, 80%], [−10, 100] °C, and [0%, 100%], respectively.

6.3. Simulation Results

We compare the network lifetime, packet miss ratio, end-to-end delay, packet delivery ratio, energy imbalance factor, and time complexity of our proposal with the SMRP [15] and EERP [23] to assess its feasibility and effectiveness. Unlike the EERP, since our proposal takes into consideration the environmental impact as one of the main metrics in the routing process of the real-time data, all subsequent experiments are carried out with two scenarios since our solution takes the environmental effect into account as one of the key criteria in both the route determination of the mobile sink and the routing mechanism of the urgent data.
  • First scenario: This is considered with regard to the environmental statistics that are within the normal range; therefore, environmental influences do not affect network performance. This demonstrates the performance of the approaches under normal environmental conditions.
  • Second scenario: It is assumed that the environmental data are outside the normal range. It demonstrates the performance of the approaches under environmental conditions outside the normal range. In the second scenario, all following studies assume the network is impacted by wildfire. Environmental events are considered to occur 400 s after network start-up.
To be fair, the number of routing paths for each source node in all three routing protocols is set to 1.

6.3.1. Evaluation of Packets Delivery Ratio (PDR)

In this series of tests, the performance of the proposed algorithm is assessed in terms of the packet delivery ratio compared to SMRP [15] and EERP [23] for the two scenarios mentioned above under different traffic rates and a different number of sink nodes.
 1.
PDR evaluation under the first scenario
This experiment compares network PDR to the average traffic rate under normal ranges.
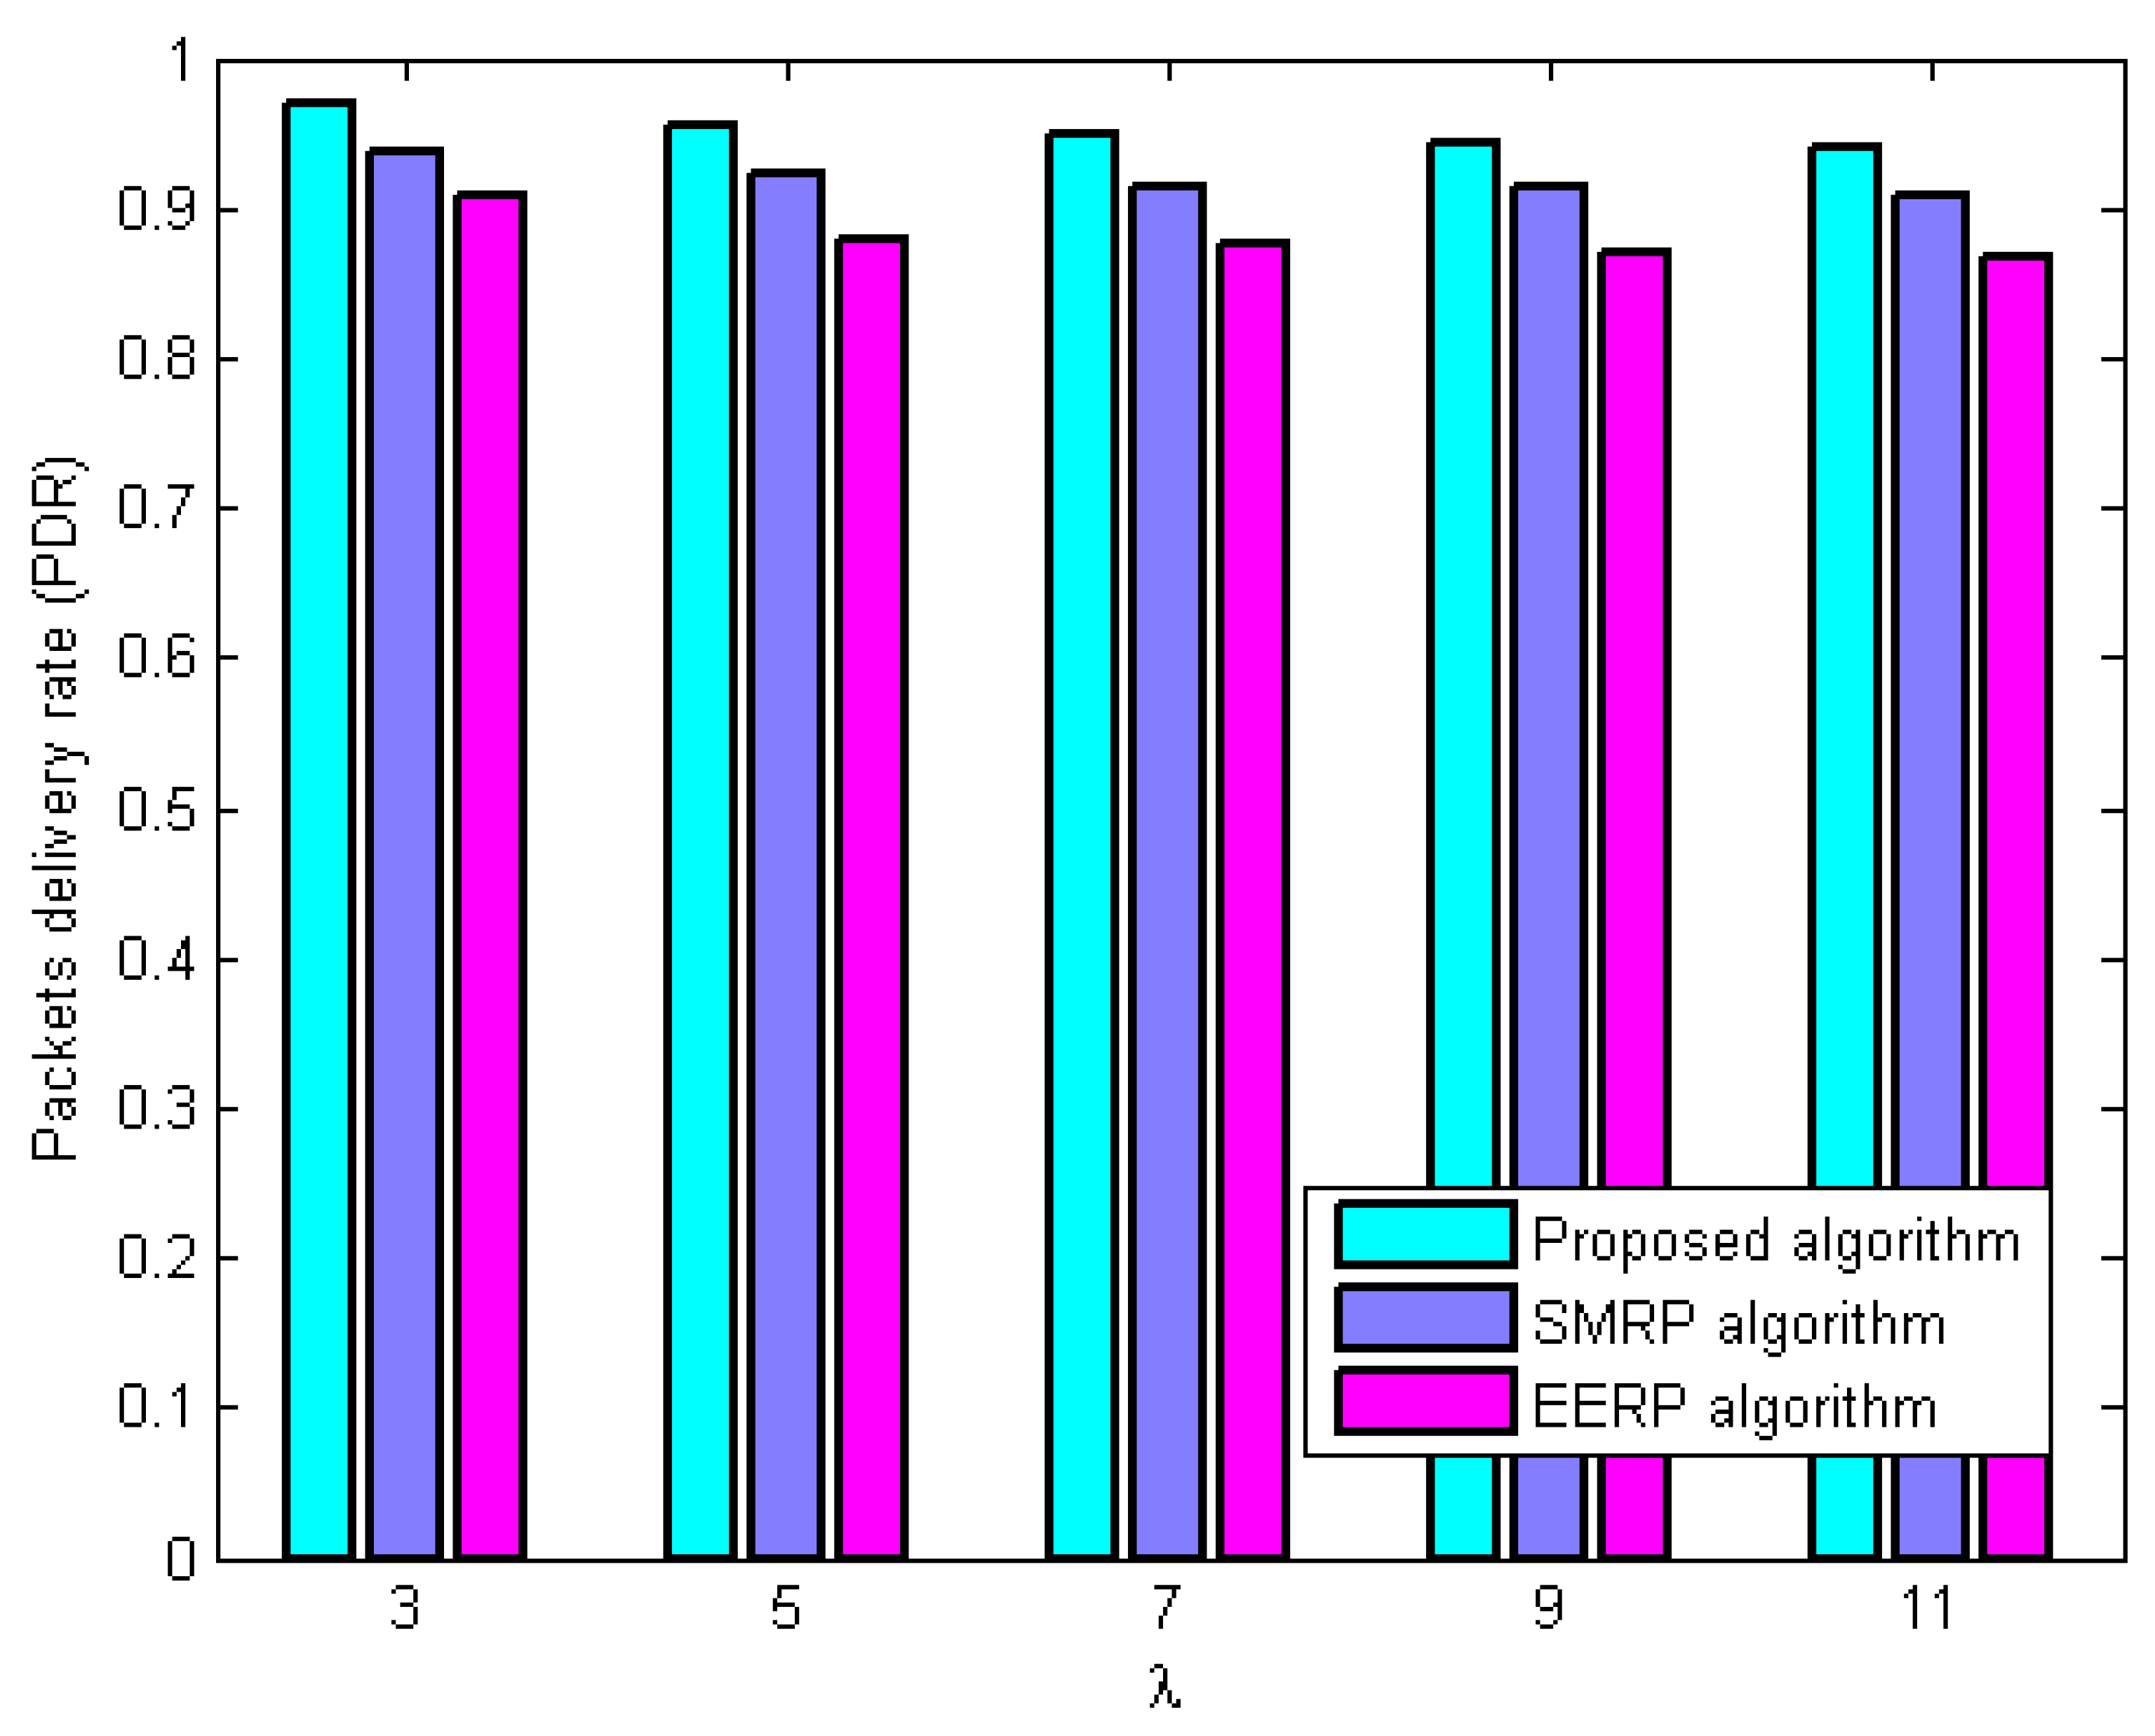
In the first experiment, we examine how the PDR varies throughout the network in response to a change in the first scenario’s average traffic rate. To begin, the average traffic rate λ was changed from 3 to 11 packets per second. There will always be three nodes in the network that act as sinks. In the first case, as seen in Figure 2, the PDR of the network varies in line with the average traffic. Figure 2 clearly demonstrates that the proposed method increases the network’s average traffic rate and achieves the highest PDR compared to the alternatives. As in this scenario, the environmental data are assumed to be in the normal range, and thus the corresponding value of the environmental impact metric is one. The reason for this improvement is that the quality of the link is taken into account when choosing the next forwarder. This means that data packets are sent more reliably.
On the contrary, SMRP and EERP algorithms did not consider how to avoid the lossy links, thus leading to more packet loss, and negatively affecting the network throughput.
In the second experiment, the PDR of the network was evaluated with a variable number of sink nodes. This variation has 1–3 sink nodes. Three packets per second is the typical traffic rate. Figure 3 shows the fluctuation in network PDR with varying numbers of sink nodes. More sink nodes boost network performance, as shown in the figure. More sink nodes may minimise the average distance between sensor nodes and sink nodes, thus decreasing the influence of environmental variables on data routing. Regardless of the number of sink nodes, the proposed algorithm delivers the best network PDR. Since SMRP and EERP do not consider link quality, and unreliable links might disrupt data transmission. This is why the proposed algorithm has a higher PDR than SMRP and EERP.
 2.
PDR evaluation under the second scenario
In this set of experiments, network PDR is explored with varying traffic rates and sink nodes.
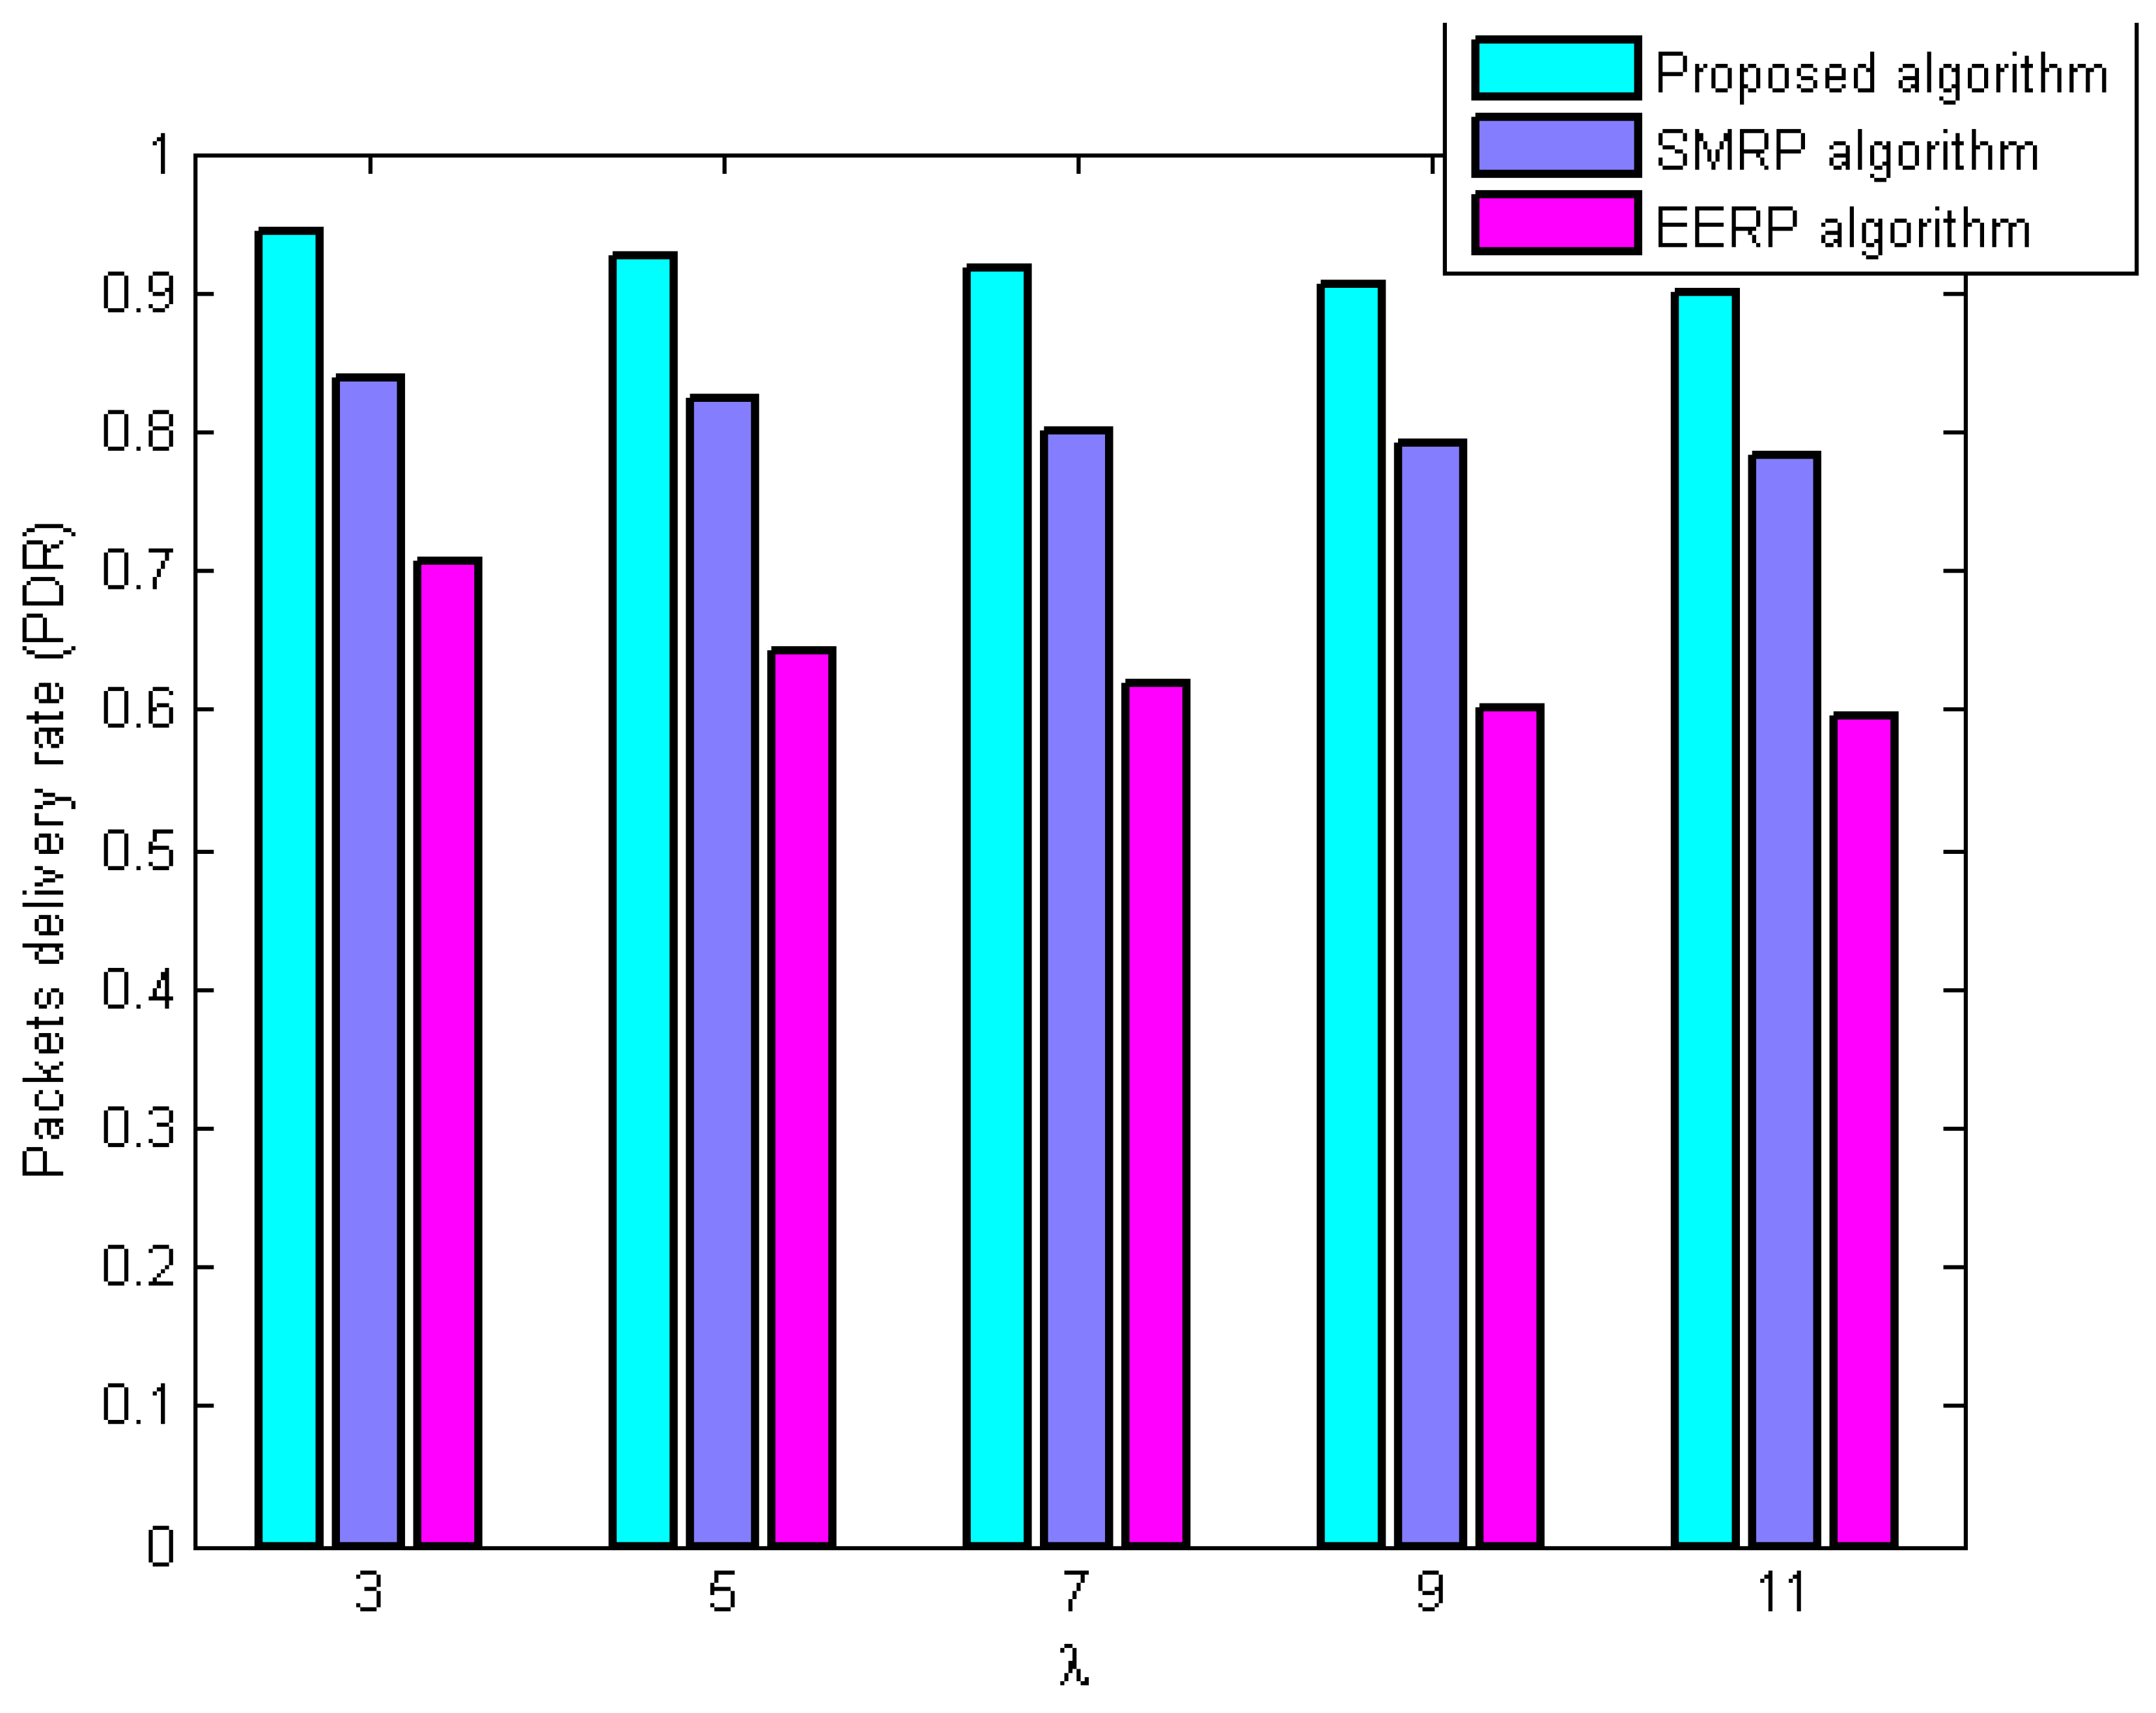
The first experiment in this set compares network PDR to the average traffic rate under the second scenario. For testing this variation, the average traffic rate is in a range from 3 to 11 packets per second, with three sink nodes in the network.
Figure 4 displays network PDR for the second scenario with varied traffic rates. The proposed approach provides the highest PDR compared to SMRP and EERP. Additionally, it outperforms the other algorithms in the first scenario for the following reasons.
As the environmental parameters in this scenario are supposed to be beyond the typical range, routing paths are subject to environmental factors, which may increase the number of environmental cutoffs. This would increase the network data loss rate. The proposed algorithm is environment-aware routing such as SMRP, which can avoid hazardous zones but has a better PDR than SMRP. The modified environmental impact metric justifies why the proposed algorithm can outperform SMRP in PDR. In the case of EERP, its routing paths will eventually cross danger zones since the environmental influence on routing performance is not considered, increasing the probability of packet loss. This explains why EERP has poor performance.
In the second simulation experiment, the network PDR is studied with a varied number of sink nodes. In this experiment, the number of sink nodes is varied from one to three, while the average traffic rate is three packets per second. Figure 5 illustrates the network PDR with varying numbers of sink nodes in the second scenario. This figure shows that additional sink nodes have improved network PDR. This improvement is due to adding additional sink nodes to the network, reducing data transmission paths.
As a result, the impact of the environmental conditions on the data routing decreases, which improves the network PDR. However, it can be easily obtained that the proposed algorithm performs best compared with the others. In addition to the reasons mentioned above, which made the proposed approach outperforms the other algorithms in the first scenario, the proposed bypasses the danger zones and discovers safer paths for the data transmission through its modified environmental impact metric than those computed by SMRP. In the case of EERP, the environmental impact on the routing paths is not considered, making them easy to cut off due to environmental reasons, resulting in a low delivery ratio. This reveals why the EERP performs worse in terms of PDR than that of SMRP and the proposed algorithm.

6.3.2. Miss Ratio Deadline Evaluation

In this series of experiments, the performance of the proposed method is assessed in terms of the deadline miss ratio in comparison to SMRP [15] and EERP [23] for the above-mentioned scenarios under different traffic rates, a different number of sink nodes, and different deadline values.
 1.
Deadline miss ratio evaluation under the first scenario
This set of experiments examines the variation of deadline miss ratio with average traffic rate, sink node number, and deadline value under the first scenario.
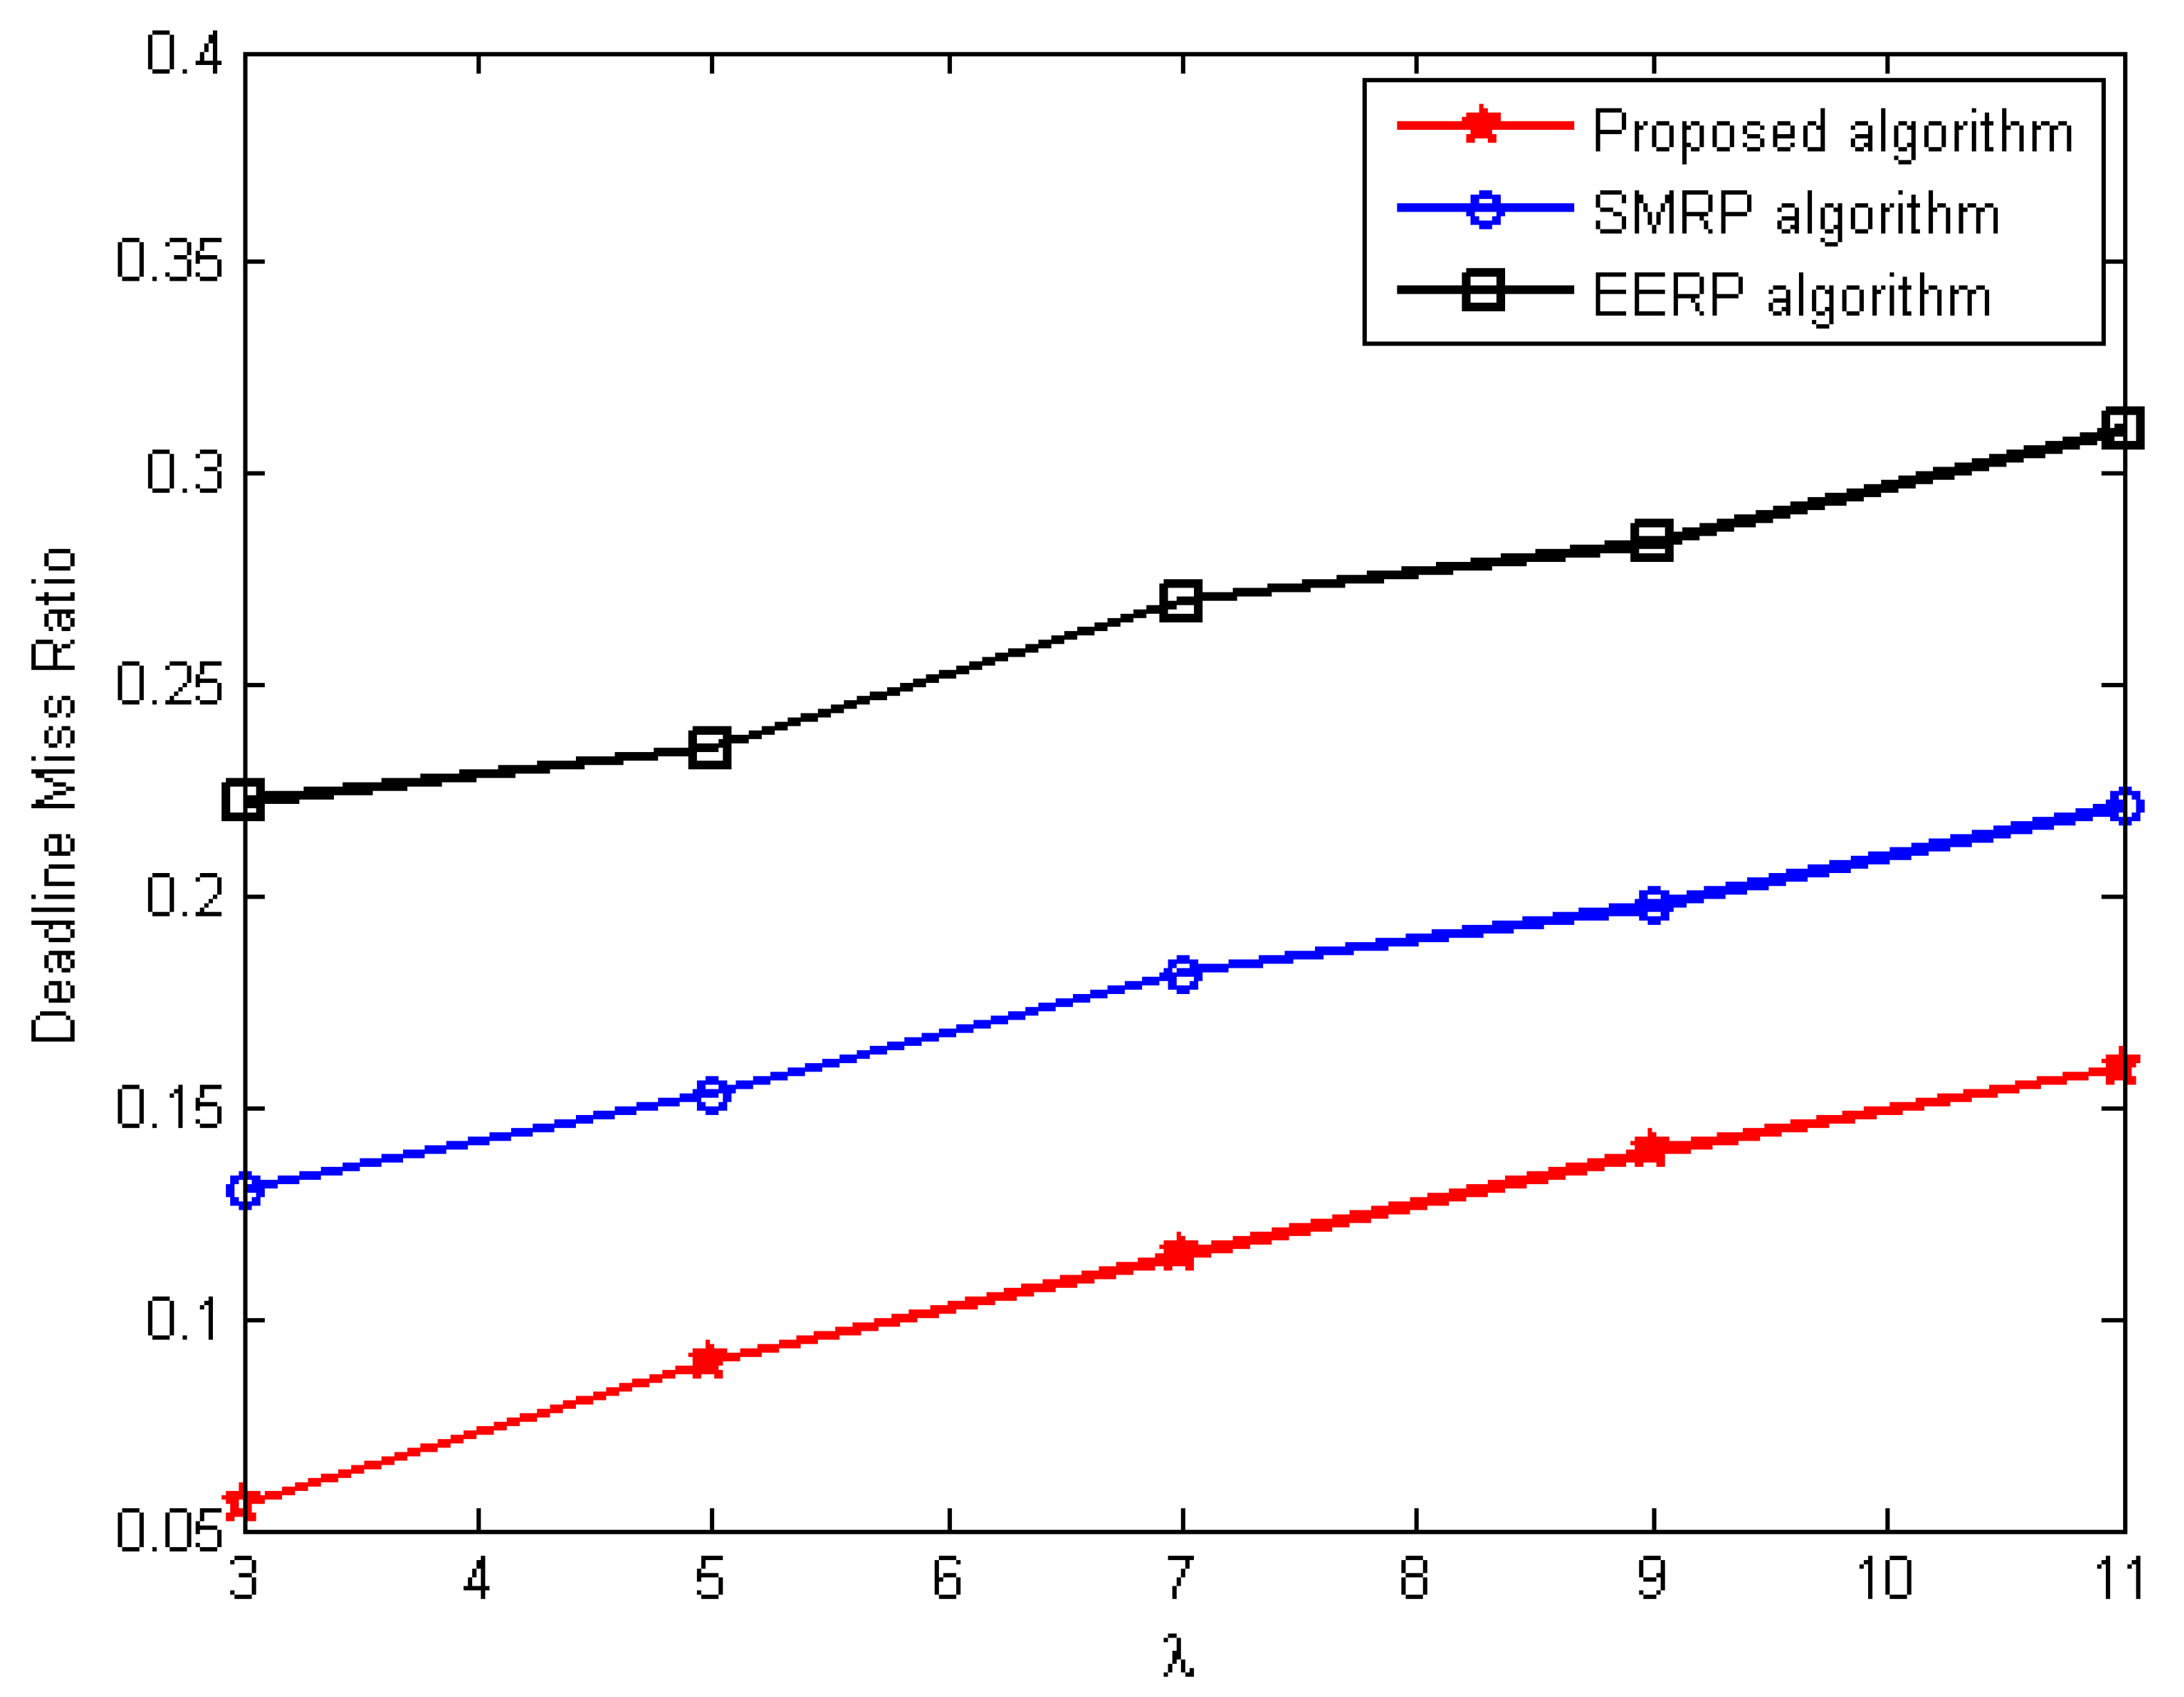
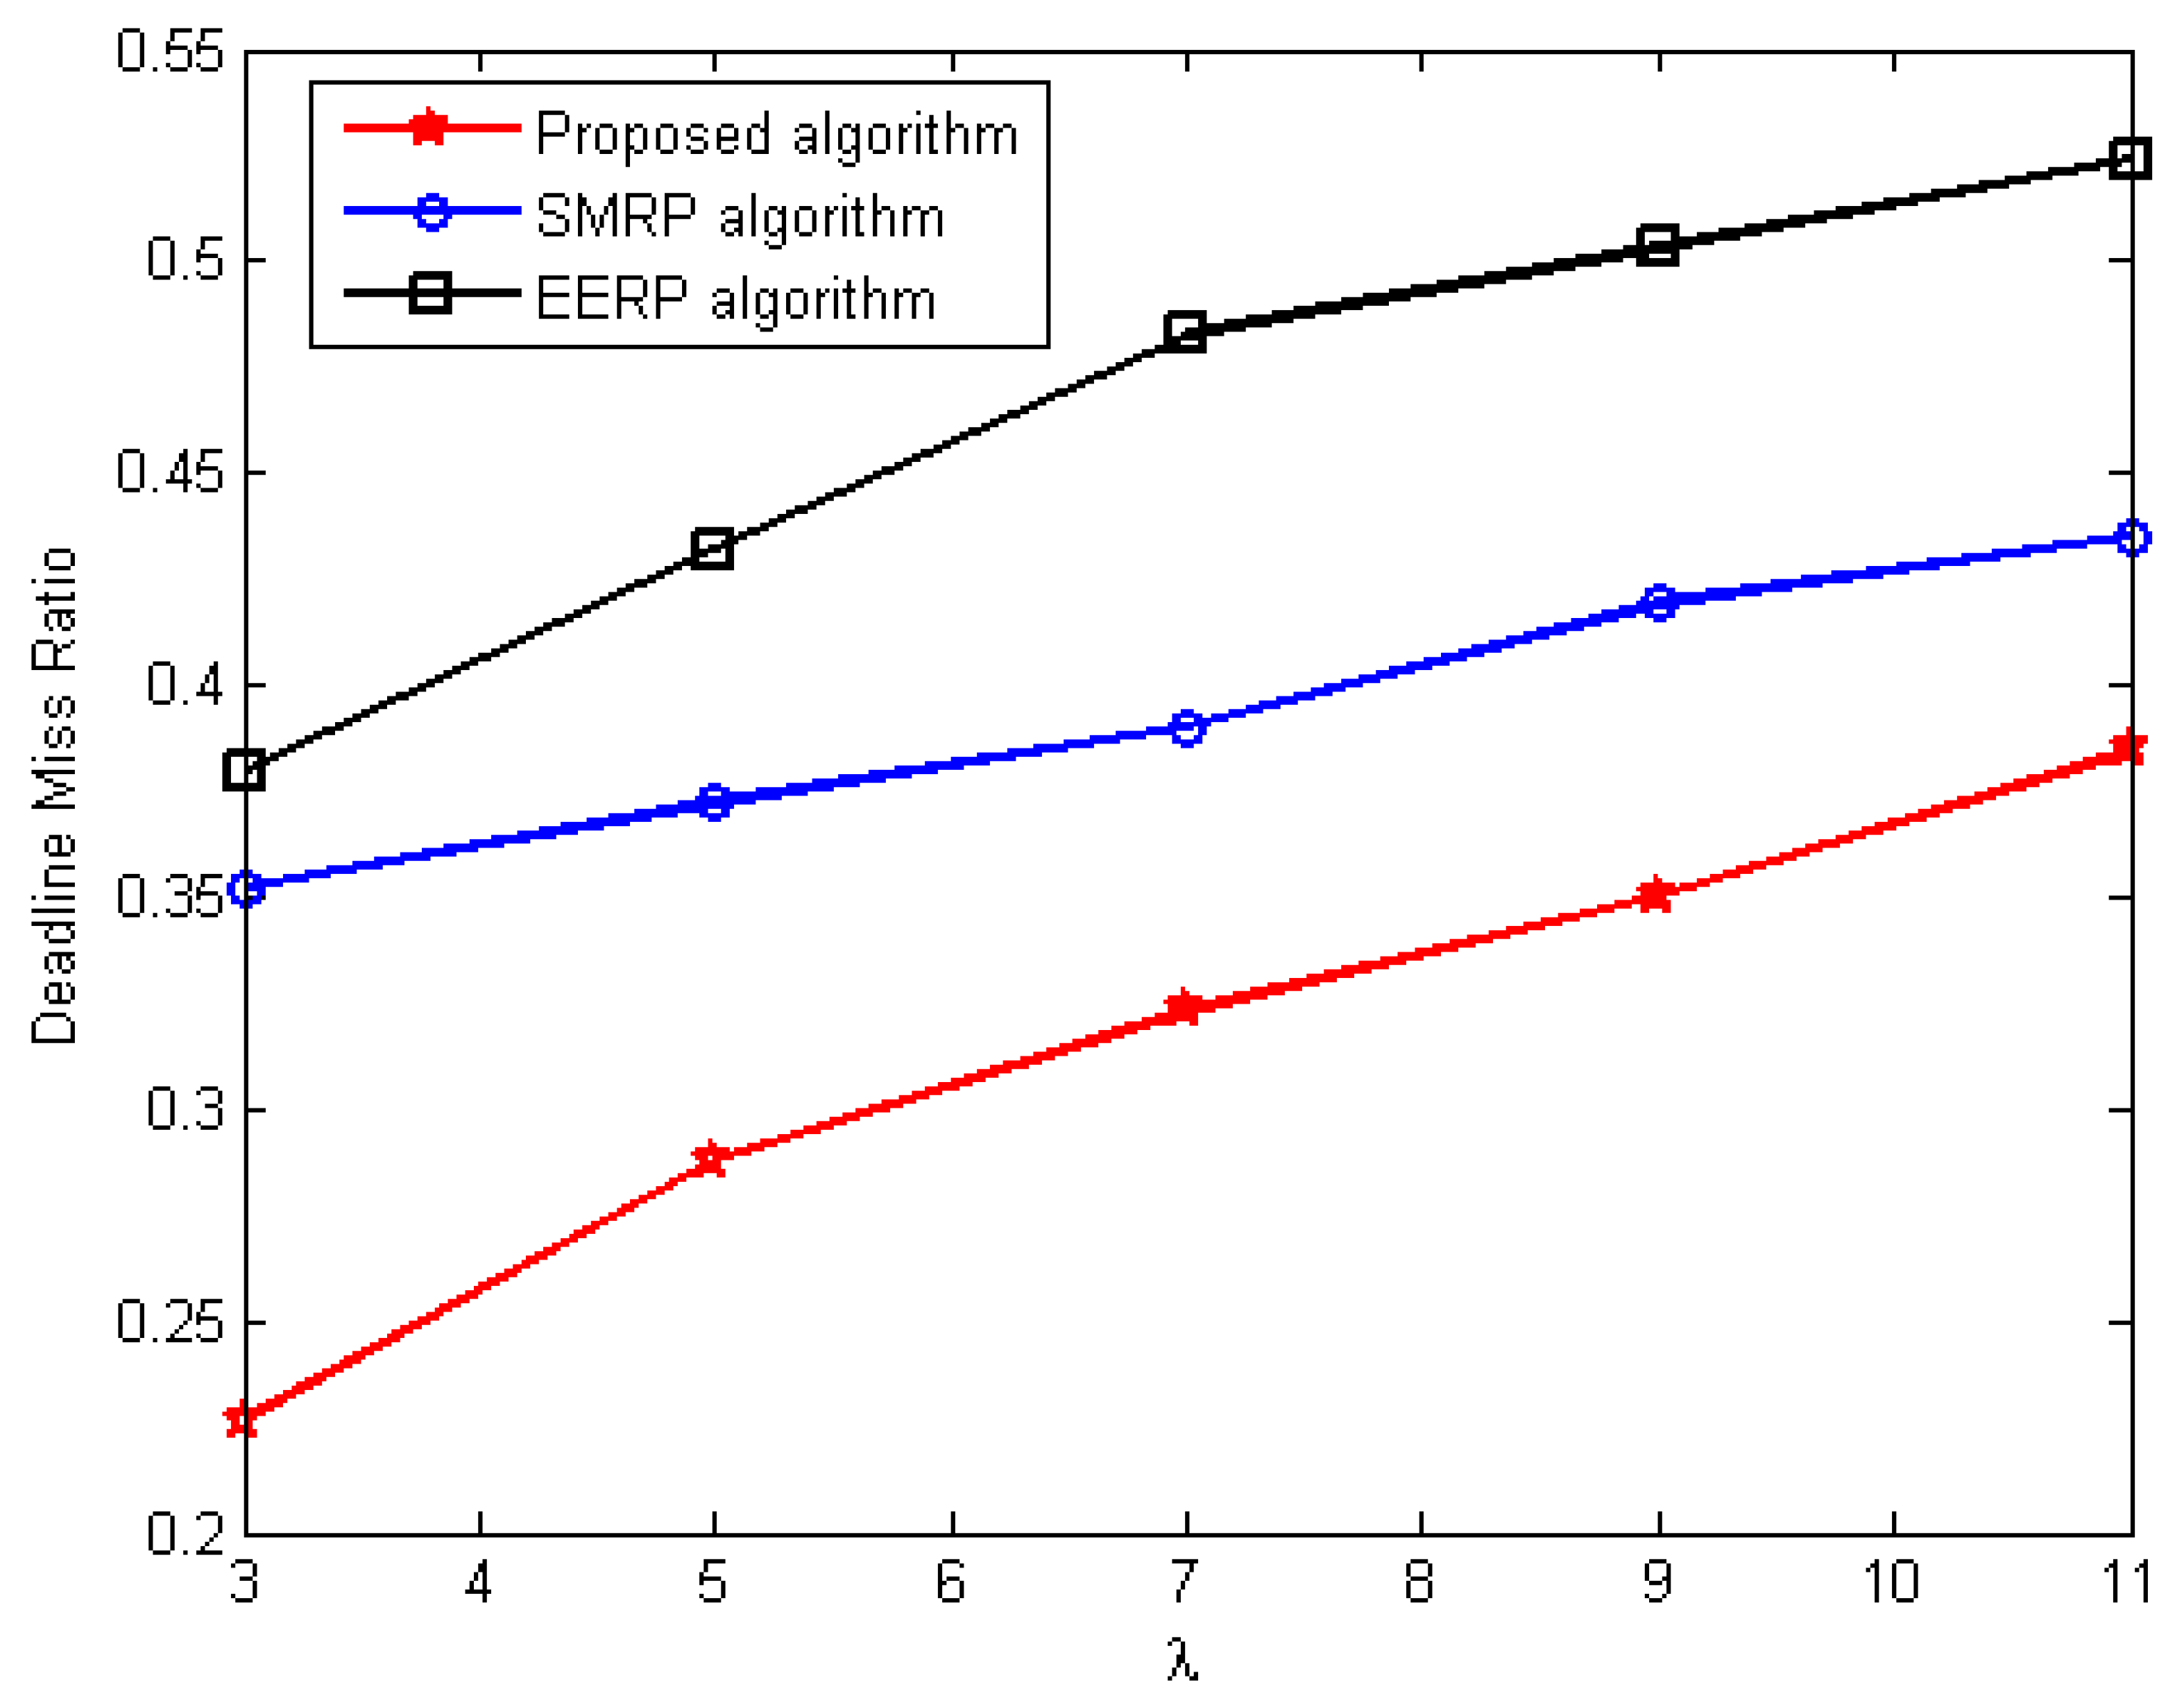
First experiment examines how the deadline miss ratio varies with the average traffic rate. To evaluate this variation, the simulation experiment increases the average traffic rate from three to 11 packets per second while keeping the sink nodes and deadline at three and 700 ms. Figure 6 compares deadline miss ratios with various traffic rates. As shown in the figure, the proposed routing method produced a lower deadline miss ratio than that of the SMRP and EERP algorithms. The proposed algorithm changes the target packet speed at each hop and picks relay nodes that can deliver the data on time. The relaying speed is then considered while picking the next forwarder. Moreover, it evaluates link quality to reduce retransmission latency. Such parameters reduce the packet miss ratio.
In the case of the SMRP and EERP routing algorithms, the real-time delivery of data is not considered; therefore, the bounded delay requirements are not satisfied. Additionally, the packets in such algorithms cannot avoid unreliable paths, which causes a lot of lost packets and thus increases the delivery delay due to packet retransmission. Hence, this increases the deadline miss ratio.
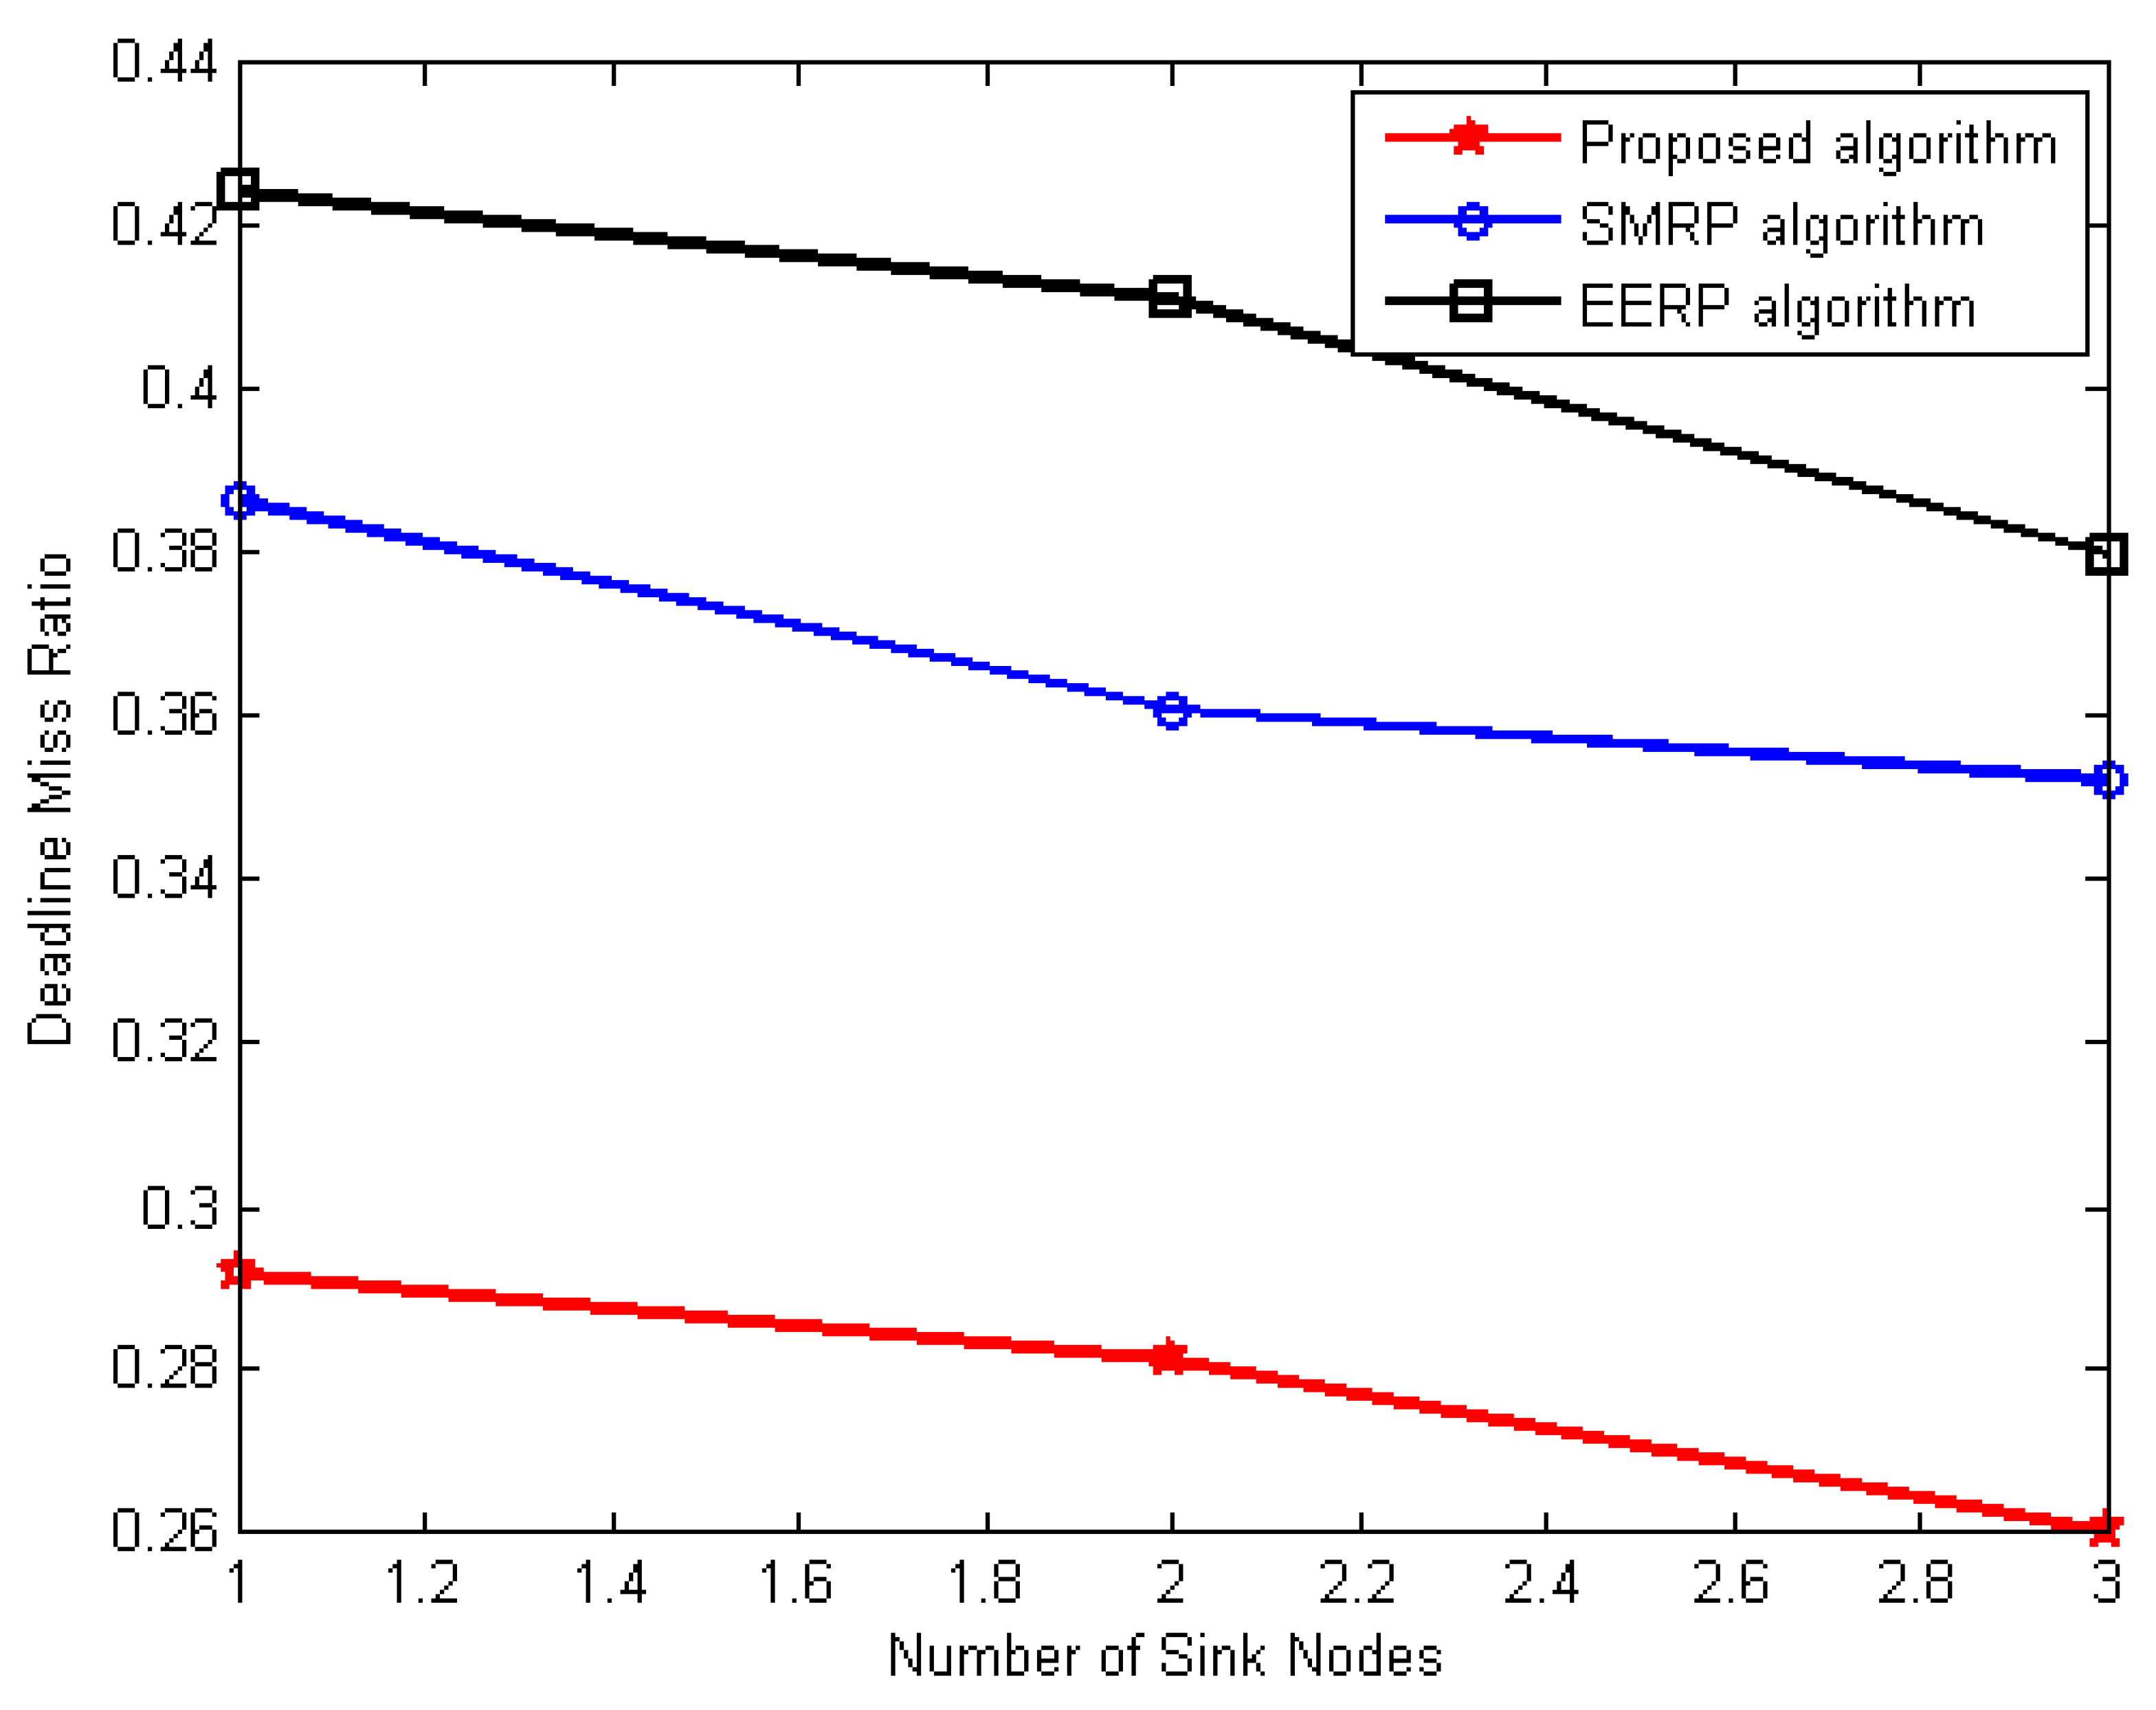
The primary purpose of the second simulation experiment is to analyze the deadline miss ratio with the number of sink nodes under the first scenario. The simulation experiment is launched to examine this variance by varying the number of sink nodes from one to three nodes while fixing the deadline and average traffic rate at 700 ms and three packets per second, respectively. Figure 7 shows the variation of the deadline miss ratio with respect to a different number of sink nodes. As shown in the figure, the deadline miss ratio decreases with the increasing number of sink nodes. Actually, with deploying more sink nodes in the network, the data packets have to take a shorter distance to reach sink nodes, which improves the delivery latency, and thus the deadline miss ratio will be decreased. However, the figure demonstrates that the suggested method increases the number of sink nodes while delivering the lowest deadline miss ratio among the available solutions. This is because it integrated the relaying speed and link quality in making routing decisions, which decreases the delivery delay and, thus, the deadline miss ratio. On the other hand, the SMRP and EERP routing algorithms have to take longer delivery delays as they do not consider the real-time delivery of data and reliability of data transmission.
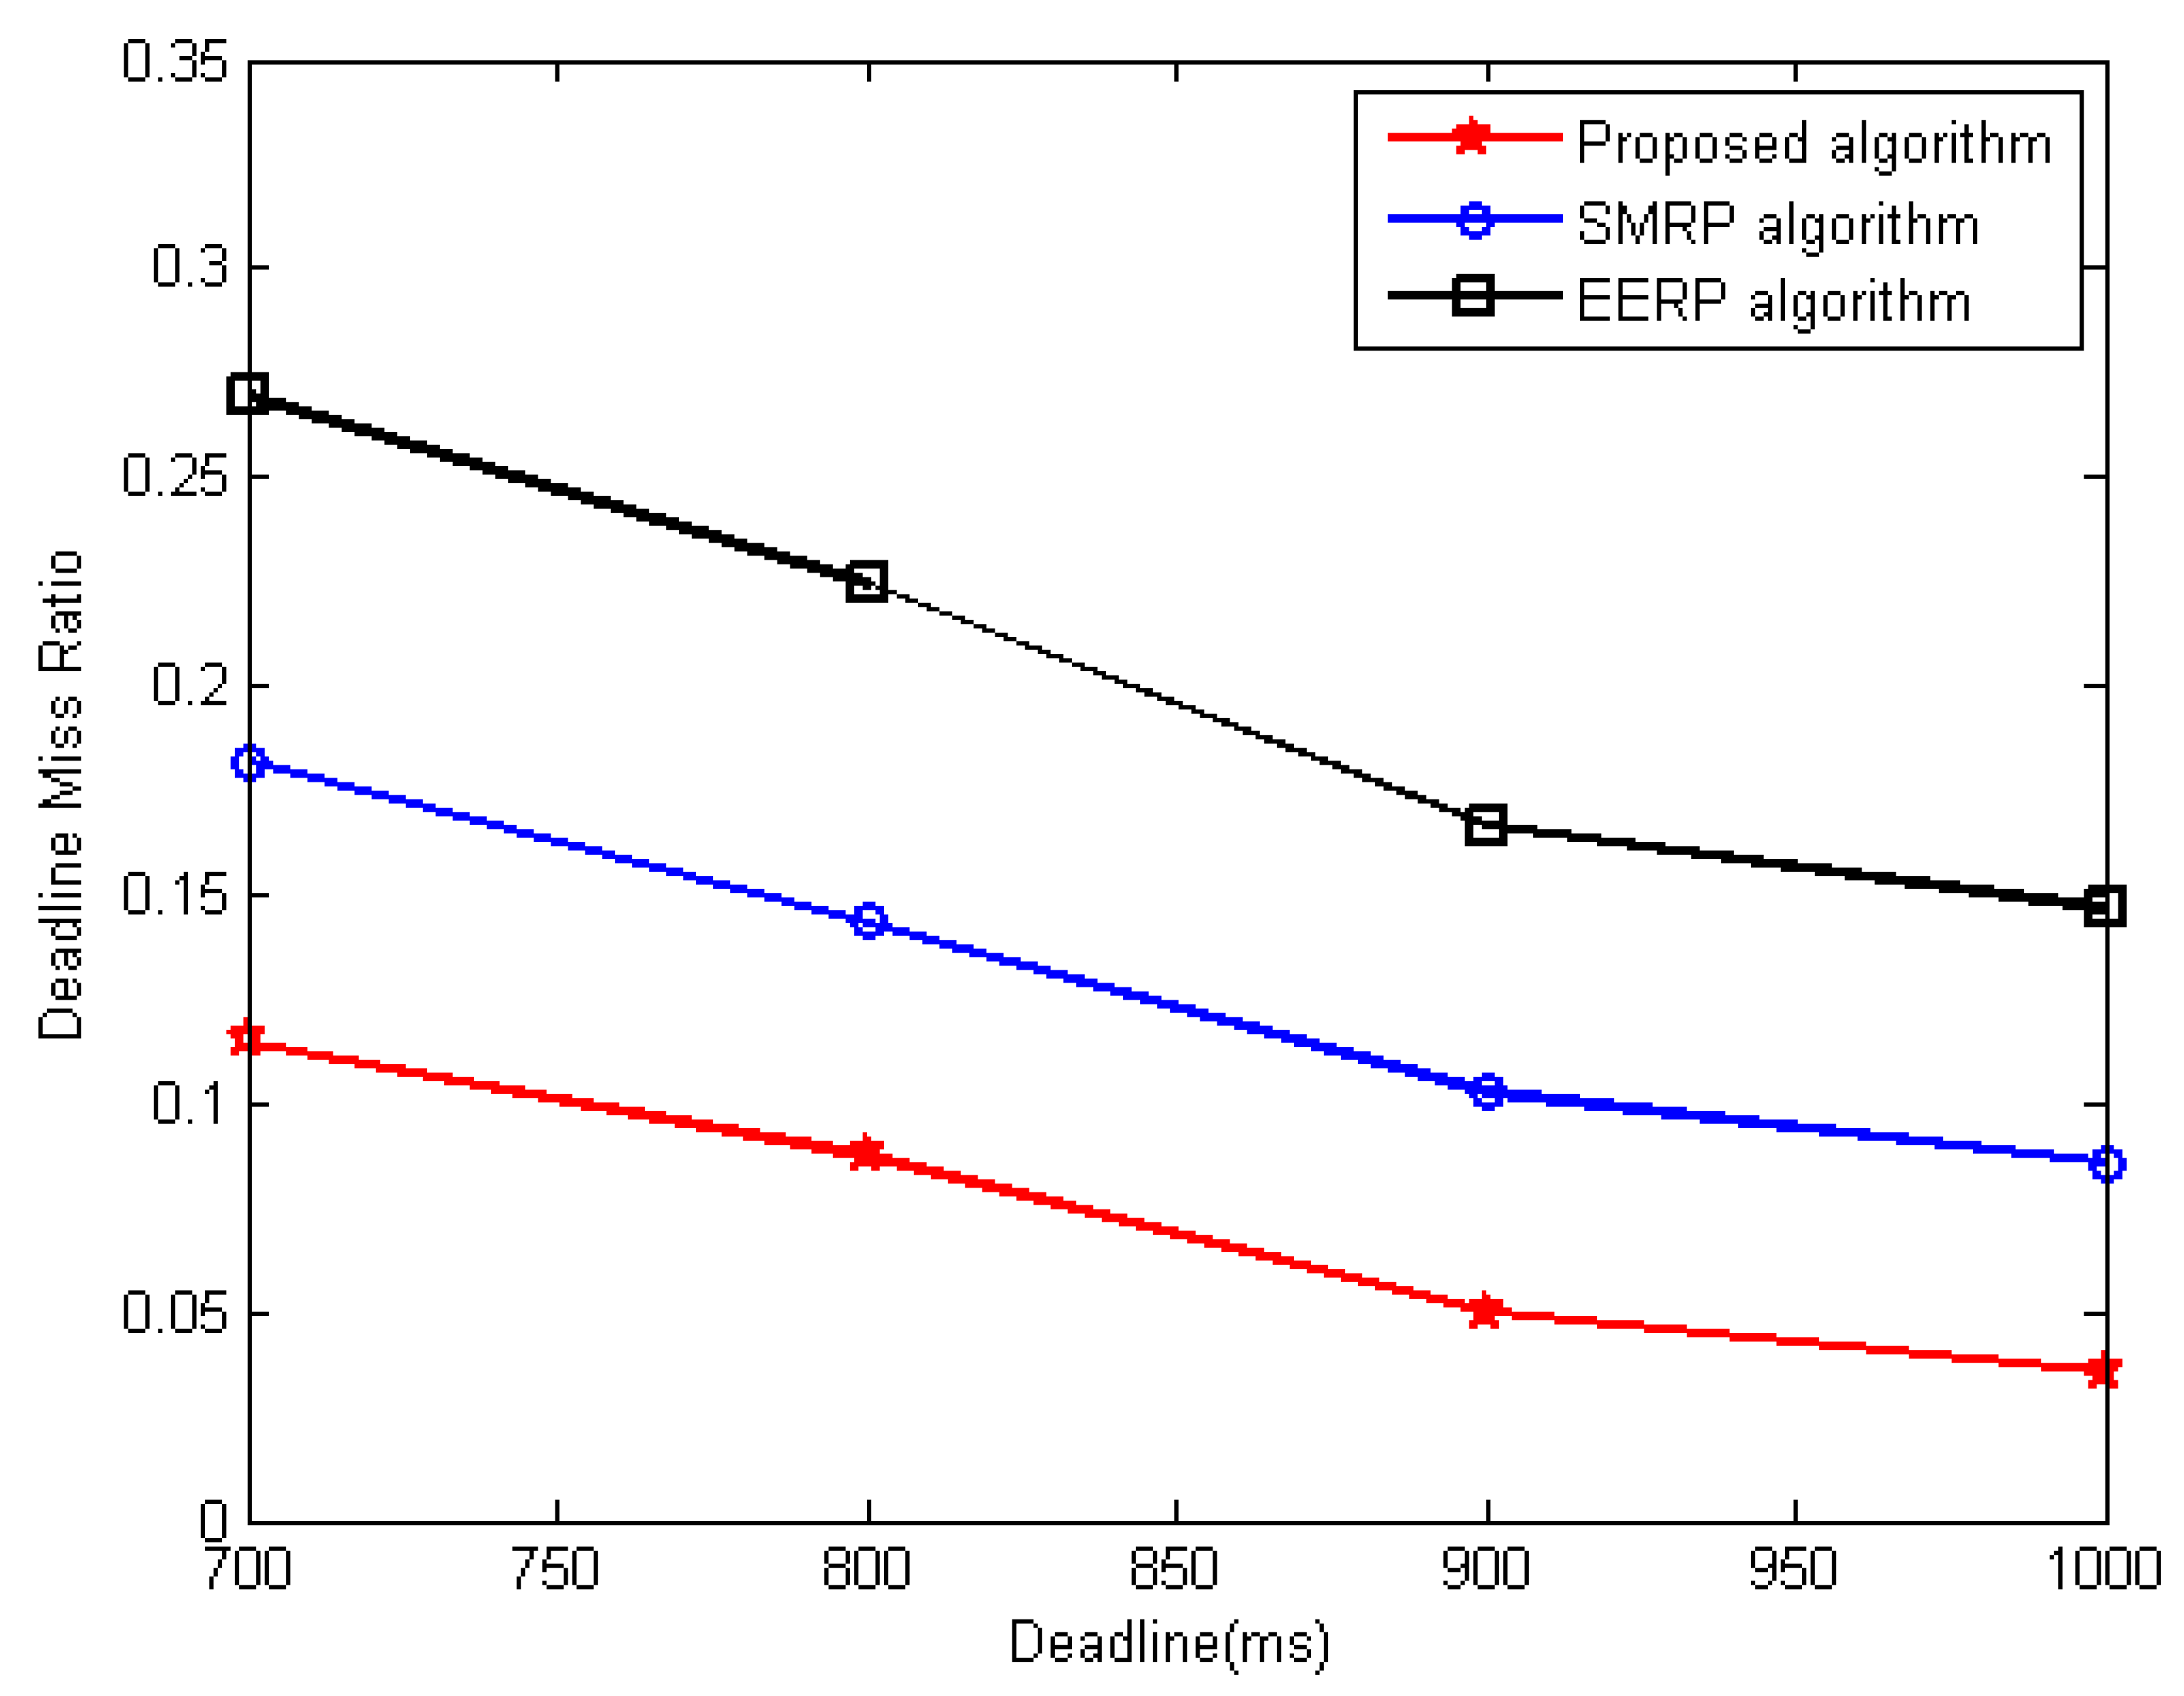
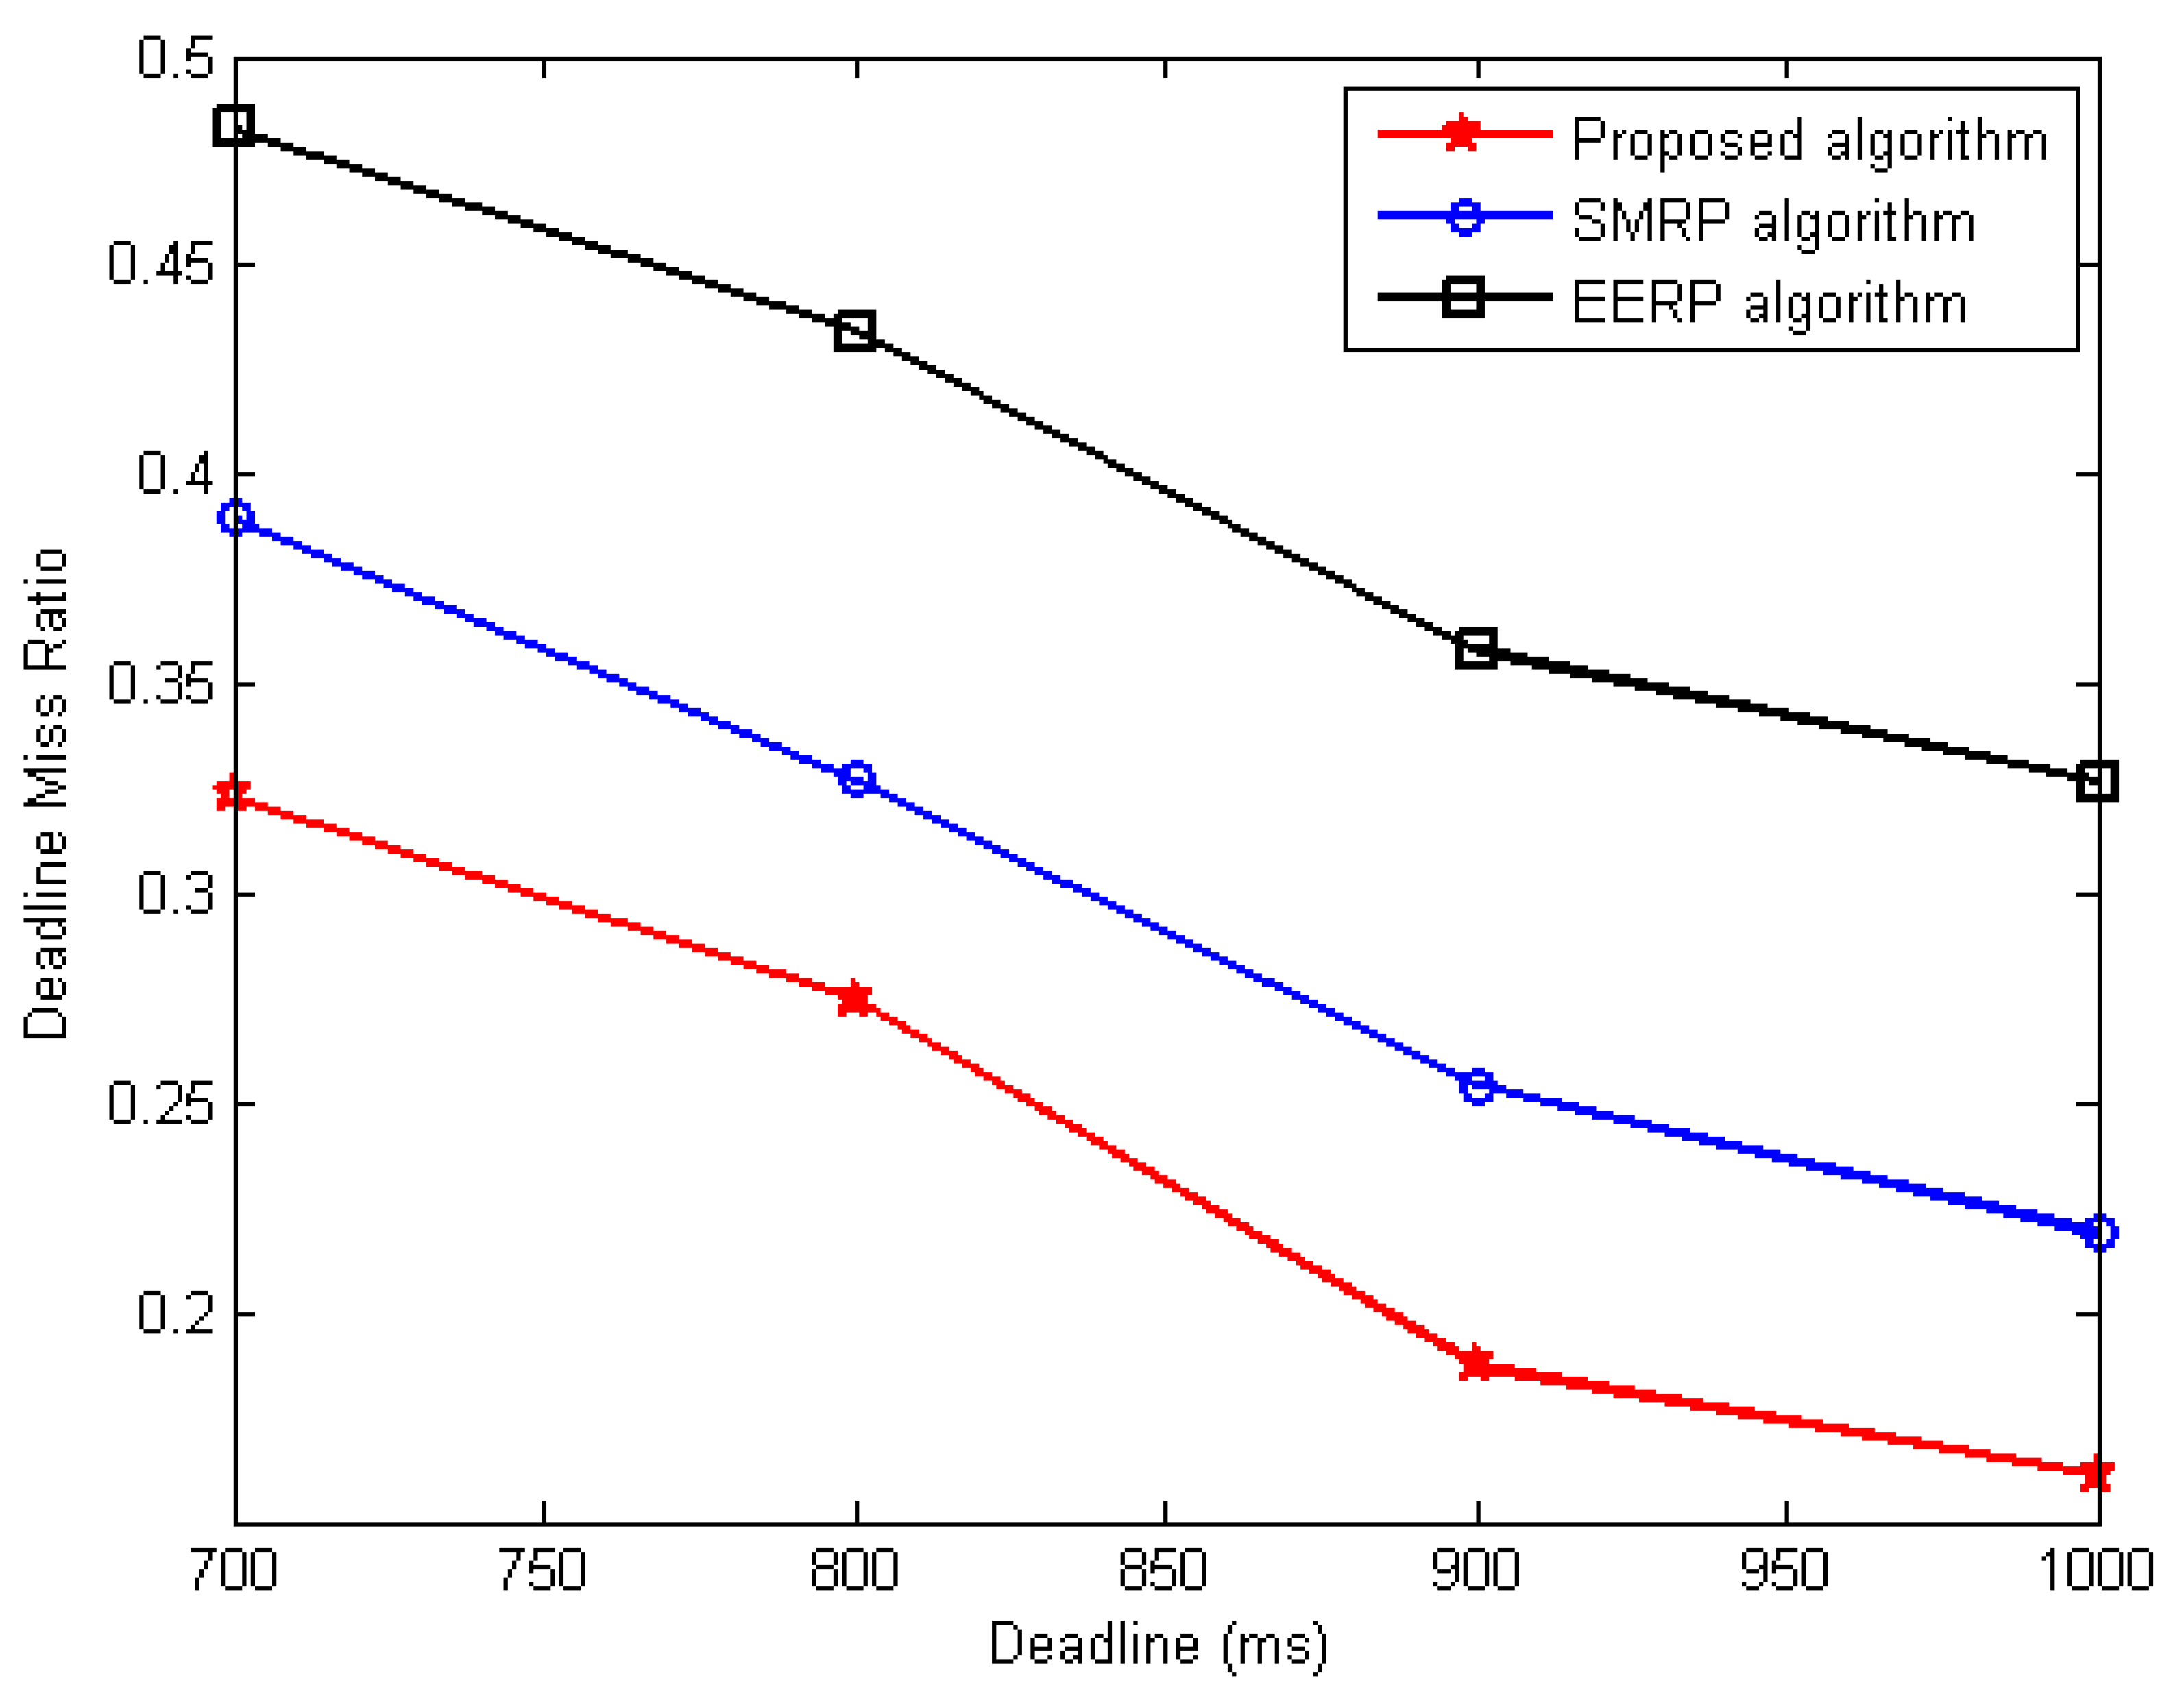
The third simulation experiment evaluates how the deadline miss ratio increases under the first scenario. This experiment adjusts the deadline from 700 to 1000 ms, but the number of sink nodes and average traffic rate is kept the same. Figure 8 shows deadline miss ratios. Figure 8 shows that missed deadlines decrease as deadlines become extended. Packets take longer to reach sink nodes as deadlines increase. It speeds up the delivery of packets to the sink node. The proposed algorithm achieves the lowest deadline-miss ratio by selecting relay nodes that can transmit real-time data packets on time. Link quality is also considered, which lowers delivery delay due to retransmission. SMRP and EERP cannot offer timely messaging services. They do not address how to prevent unreliable wireless networks, which affects delivery delays because of missed packet retransmission.
 2.
Deadline miss ratio evaluation under the second scenario
For the second scenario, the effectiveness of the suggested technique is evaluated in this set of experiments and contrasted to earlier research SMRP [15] and EERP [23]. The experiment involves varying the average traffic rate and deploying different number of sink nodes in the network.
The deadline miss ratio in the first simulation experiment is compared to the second scenario’s average traffic rate. This experiment adjusts the average traffic rate from three to 11 packets per second, using three sink nodes and a 700 ms deadline. Figure 9 shows how delays change with traffic volume. This figure demonstrates that the suggested solution outperformed others despite increasing network traffic. The proposed algorithm outperforms SMRP and EERP in the first scenario for the following reasons. As with SMRP, the proposed approach uses a modified environmental impact metric to avoid risk zones and find safer data transmission routes. The proposed approach seeks to create data routes less likely to be cut off due to environmental factors, resulting in more reliable links and reduced delivery delay.
The obtained results further validate that the proposed environmental impact metric leads to safer routing paths than those computed by SMRP. This explains why the proposed approach superior to the others. Regarding the EERP algorithm, it does not consider the environmental impact on the routing performance, hence a poor performance in terms of packet delivery ratio, which in turn increases the delivery delay and, thus, the deadline miss ratio. Therefore, it has the worst performance in terms of deadline miss ratio.
The second experiment examines the deadline miss ratio with varied numbers of sink nodes. This experiment varies the number of sink nodes from one to three while keeping the average traffic rate and packet deadline at three packets per second and 700 ms, respectively. Figure 9 and Figure 10 demonstrate how missed deadlines vary with sink nodes. The deadline miss ratio decreases with more sink nodes, as shown in the figure. As the number of sink nodes increases, data packets travel shorter distances, reducing delivery delays. As a consequence, the deadline miss ratio reduces. The proposed algorithm has the lowest deadline–miss ratio. In addition to the reasons mentioned above, the proposed algorithm is environment-aware, which helps avoid danger zones. Thus, the environmental effect is less likely to cut off routing paths, minimising packet loss and delivery delay.
Although the SMRP is also an environment-aware routing algorithm, the results are evidence that the proposed environmental impact metric helps to discover safer routing paths than those computed by SMRP. In the case of EERP, the impact of the external environment on the routing performance is not considered, which implies that the packet loss ratio and the delivery delay will be increased. Hence, its deadline miss ratio becomes worse than the proposed SMRP algorithms.
The third simulation experiment analyses deadline miss rates with varied deadline values in scenario 2. This experiment varied the deadline from 700 to 1000 ms while keeping sink nodes and traffic rate at three nodes and three packets per second. Figure 11 shows how the deadline miss ratio increases for the second scenario. The deadline miss ratio decreases as the deadline value increases, as more packets reach sink nodes before their deadlines. The suggested algorithm has the lowest deadline miss rate. In addition to the reasons mentioned before, which make the proposed algorithm better than SMRP and EERP routing algorithms under the first scenario, the rest of the reasons can be justified as follows. The proposed algorithm can bypass the danger zones and discover safer paths to sink nodes than those computed by SMRP. In EERP, the data packets have to cross the danger zones as the environmental impact is not considered, making them much more likely to be cut off. Thus, this increases the packet loss rate, increasing the delivery delay and, thus, the deadline miss ratio.

6.3.3. Network Lifetime Evaluation

In this set of experiments, the performance of the proposed algorithm is evaluated in terms of network lifetime compared to SMRP [15] and EERP [23] for the two scenarios mentioned above under different traffic rates and a different number of sink nodes.
 1.
Network lifetime evaluation under the first scenario
This set of experiments studies the variation of network lifetime with respect to the average traffic rate and a different number of sink nodes under environmental conditions inside the normal range.
The first experiment evaluates the network lifetime in the first scenario. In this experiment, the average traffic rate ranges from three to 11 packets per second, using three sink nodes. Figure 12 shows the network lifetime vs. traffic rate for the first case. As seen in this figure, the proposed approach increases network lifetime compared to the others. As in this scenario, the environmental data are assumed to be in the normal range, and thus the corresponding value of the environmental impact metric is one. This improvement is because the proposed routing algorithm employs node traffic load and residual energy to balance network energy usage across sensor nodes. It prevents lost links to save energy wasted by retransmitting dropped packets. Furthermore, due to the proposed sink load metric, the proposed sink node selection algorithm effectively balances the network energy consumption among sink nodes. On the other hand, the SMRP and EERP algorithms depend on residual energy to balance energy consumption, which is inadequate according to this work’s observations.
Nevertheless, although the SMRP and EERP attempt to route data along the quickest path, their lack of knowledge regarding data transmission reliability wastes energy by retransmitting missed packets. Finally, the proposed algorithm can better use multi-sink advantages in energy balance. That is to say, the newly proposed sink load metric helps to balance the energy consumption among sink nodes
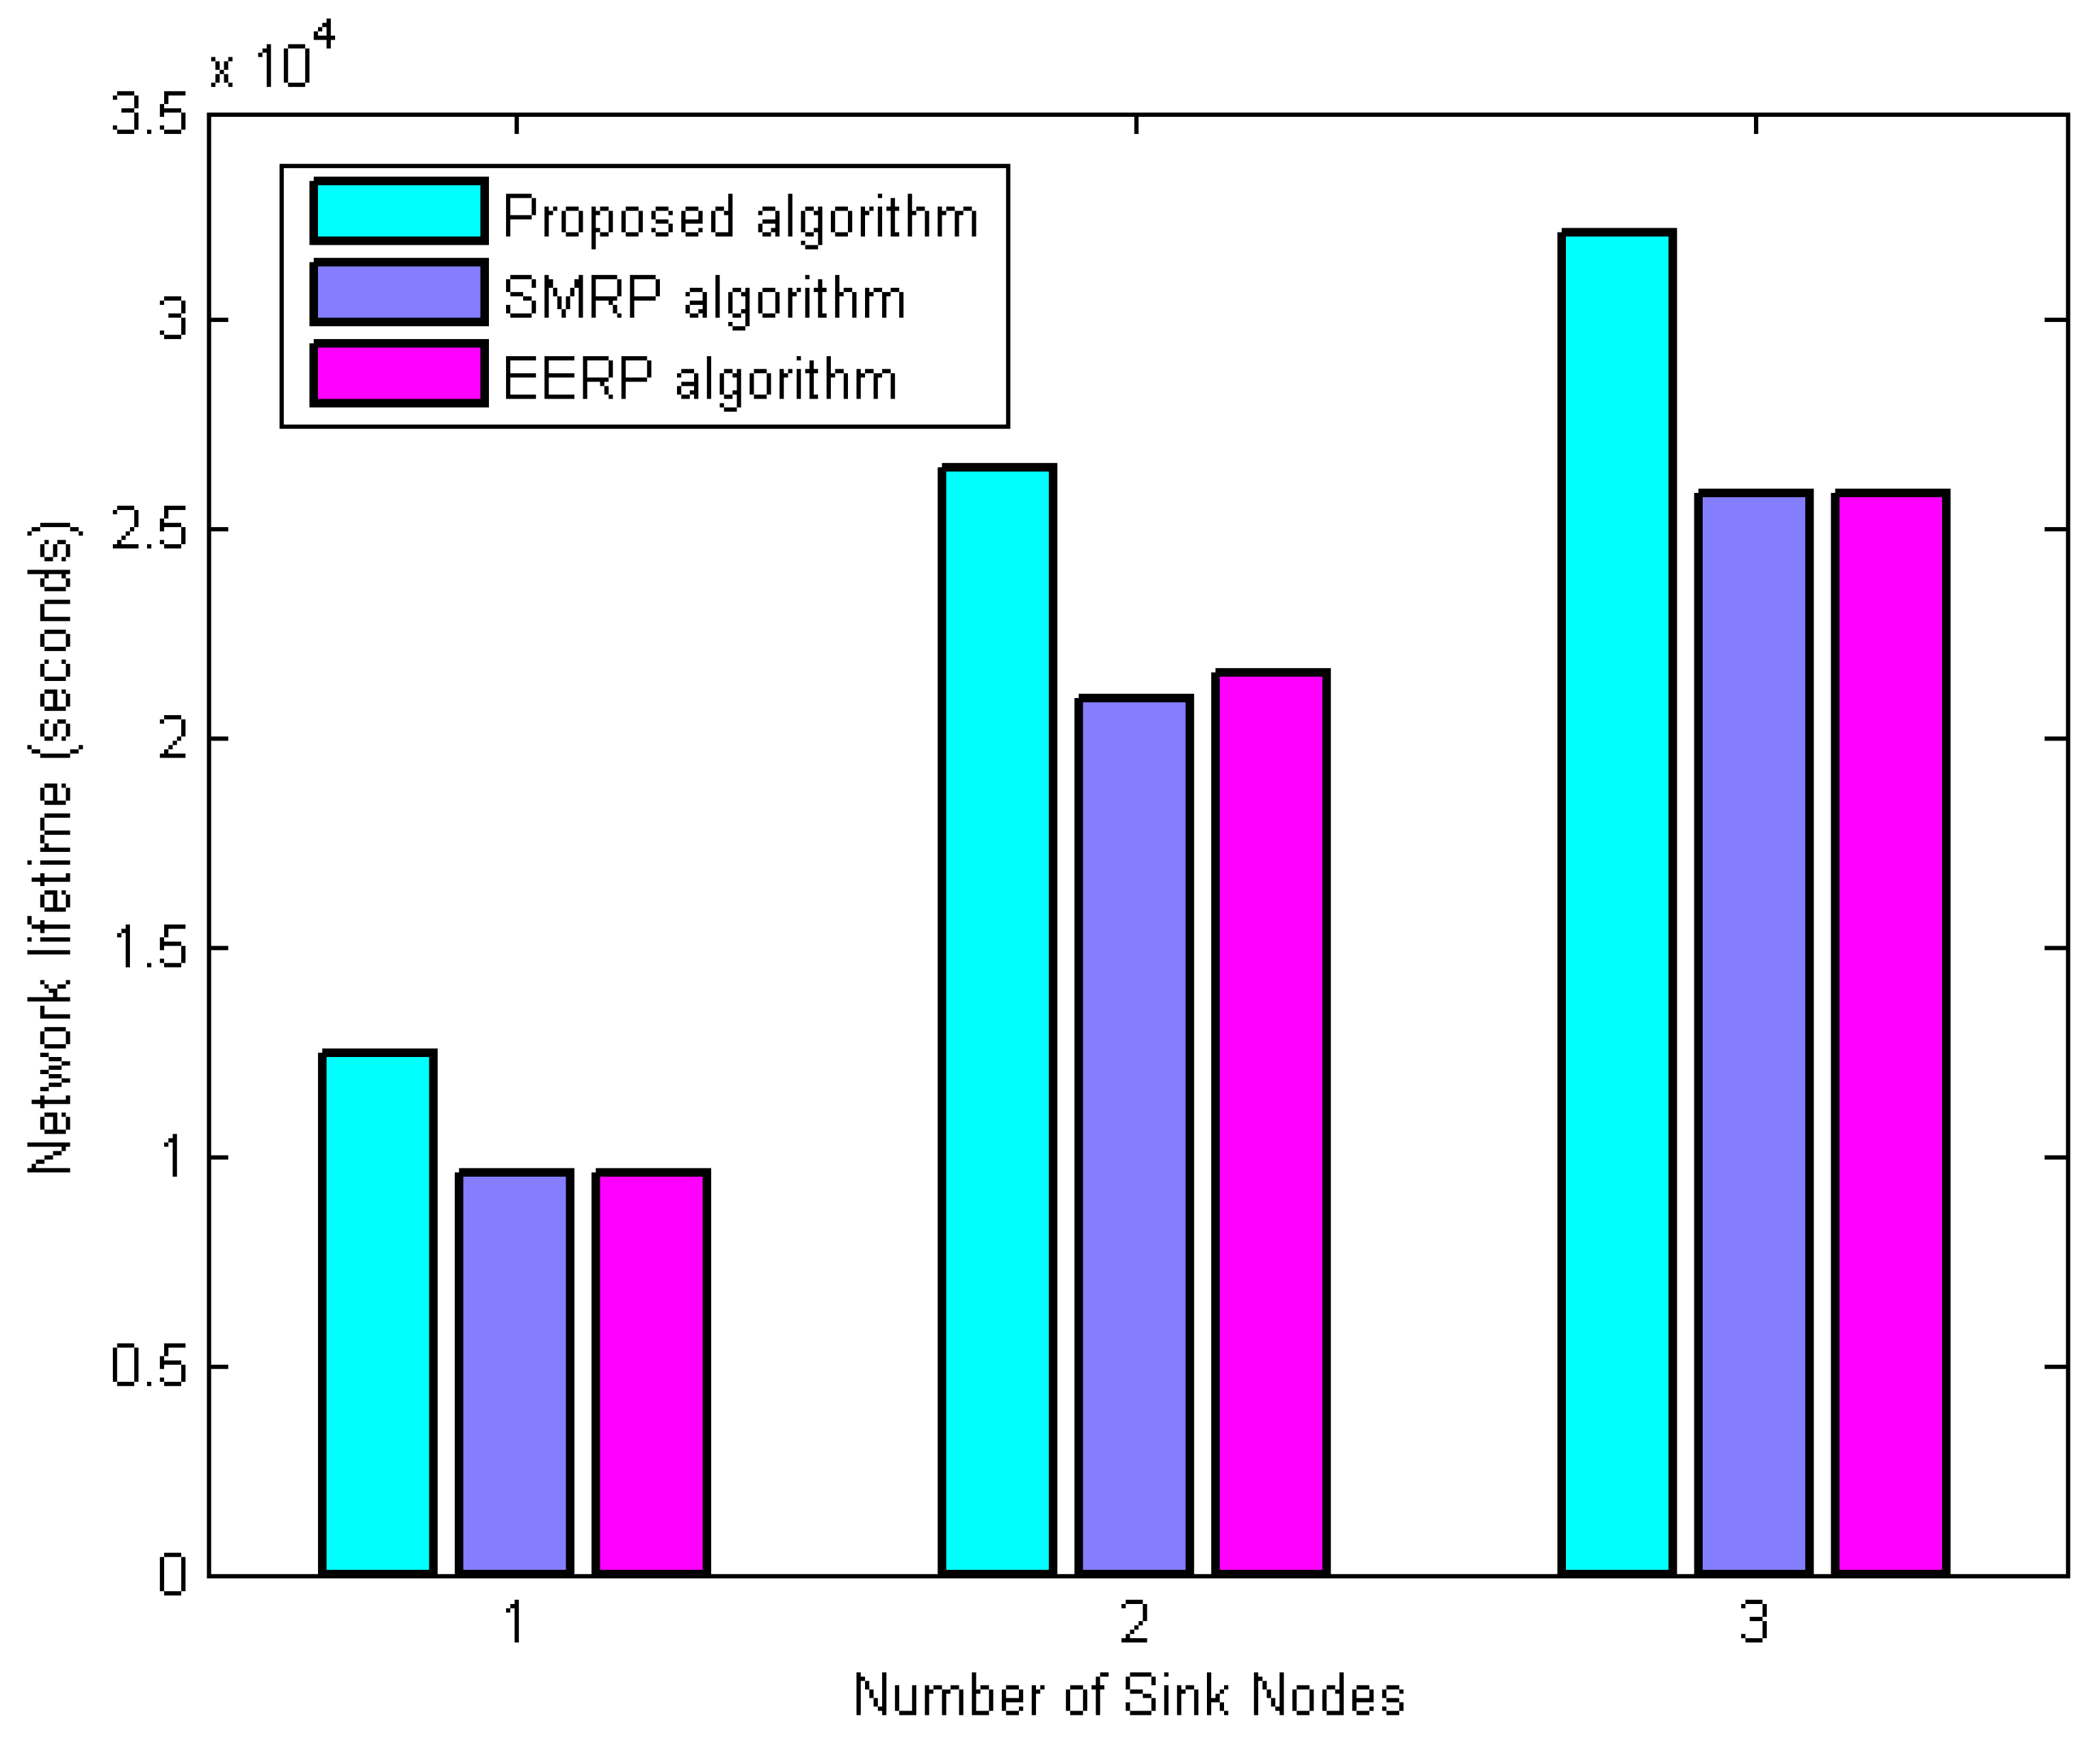
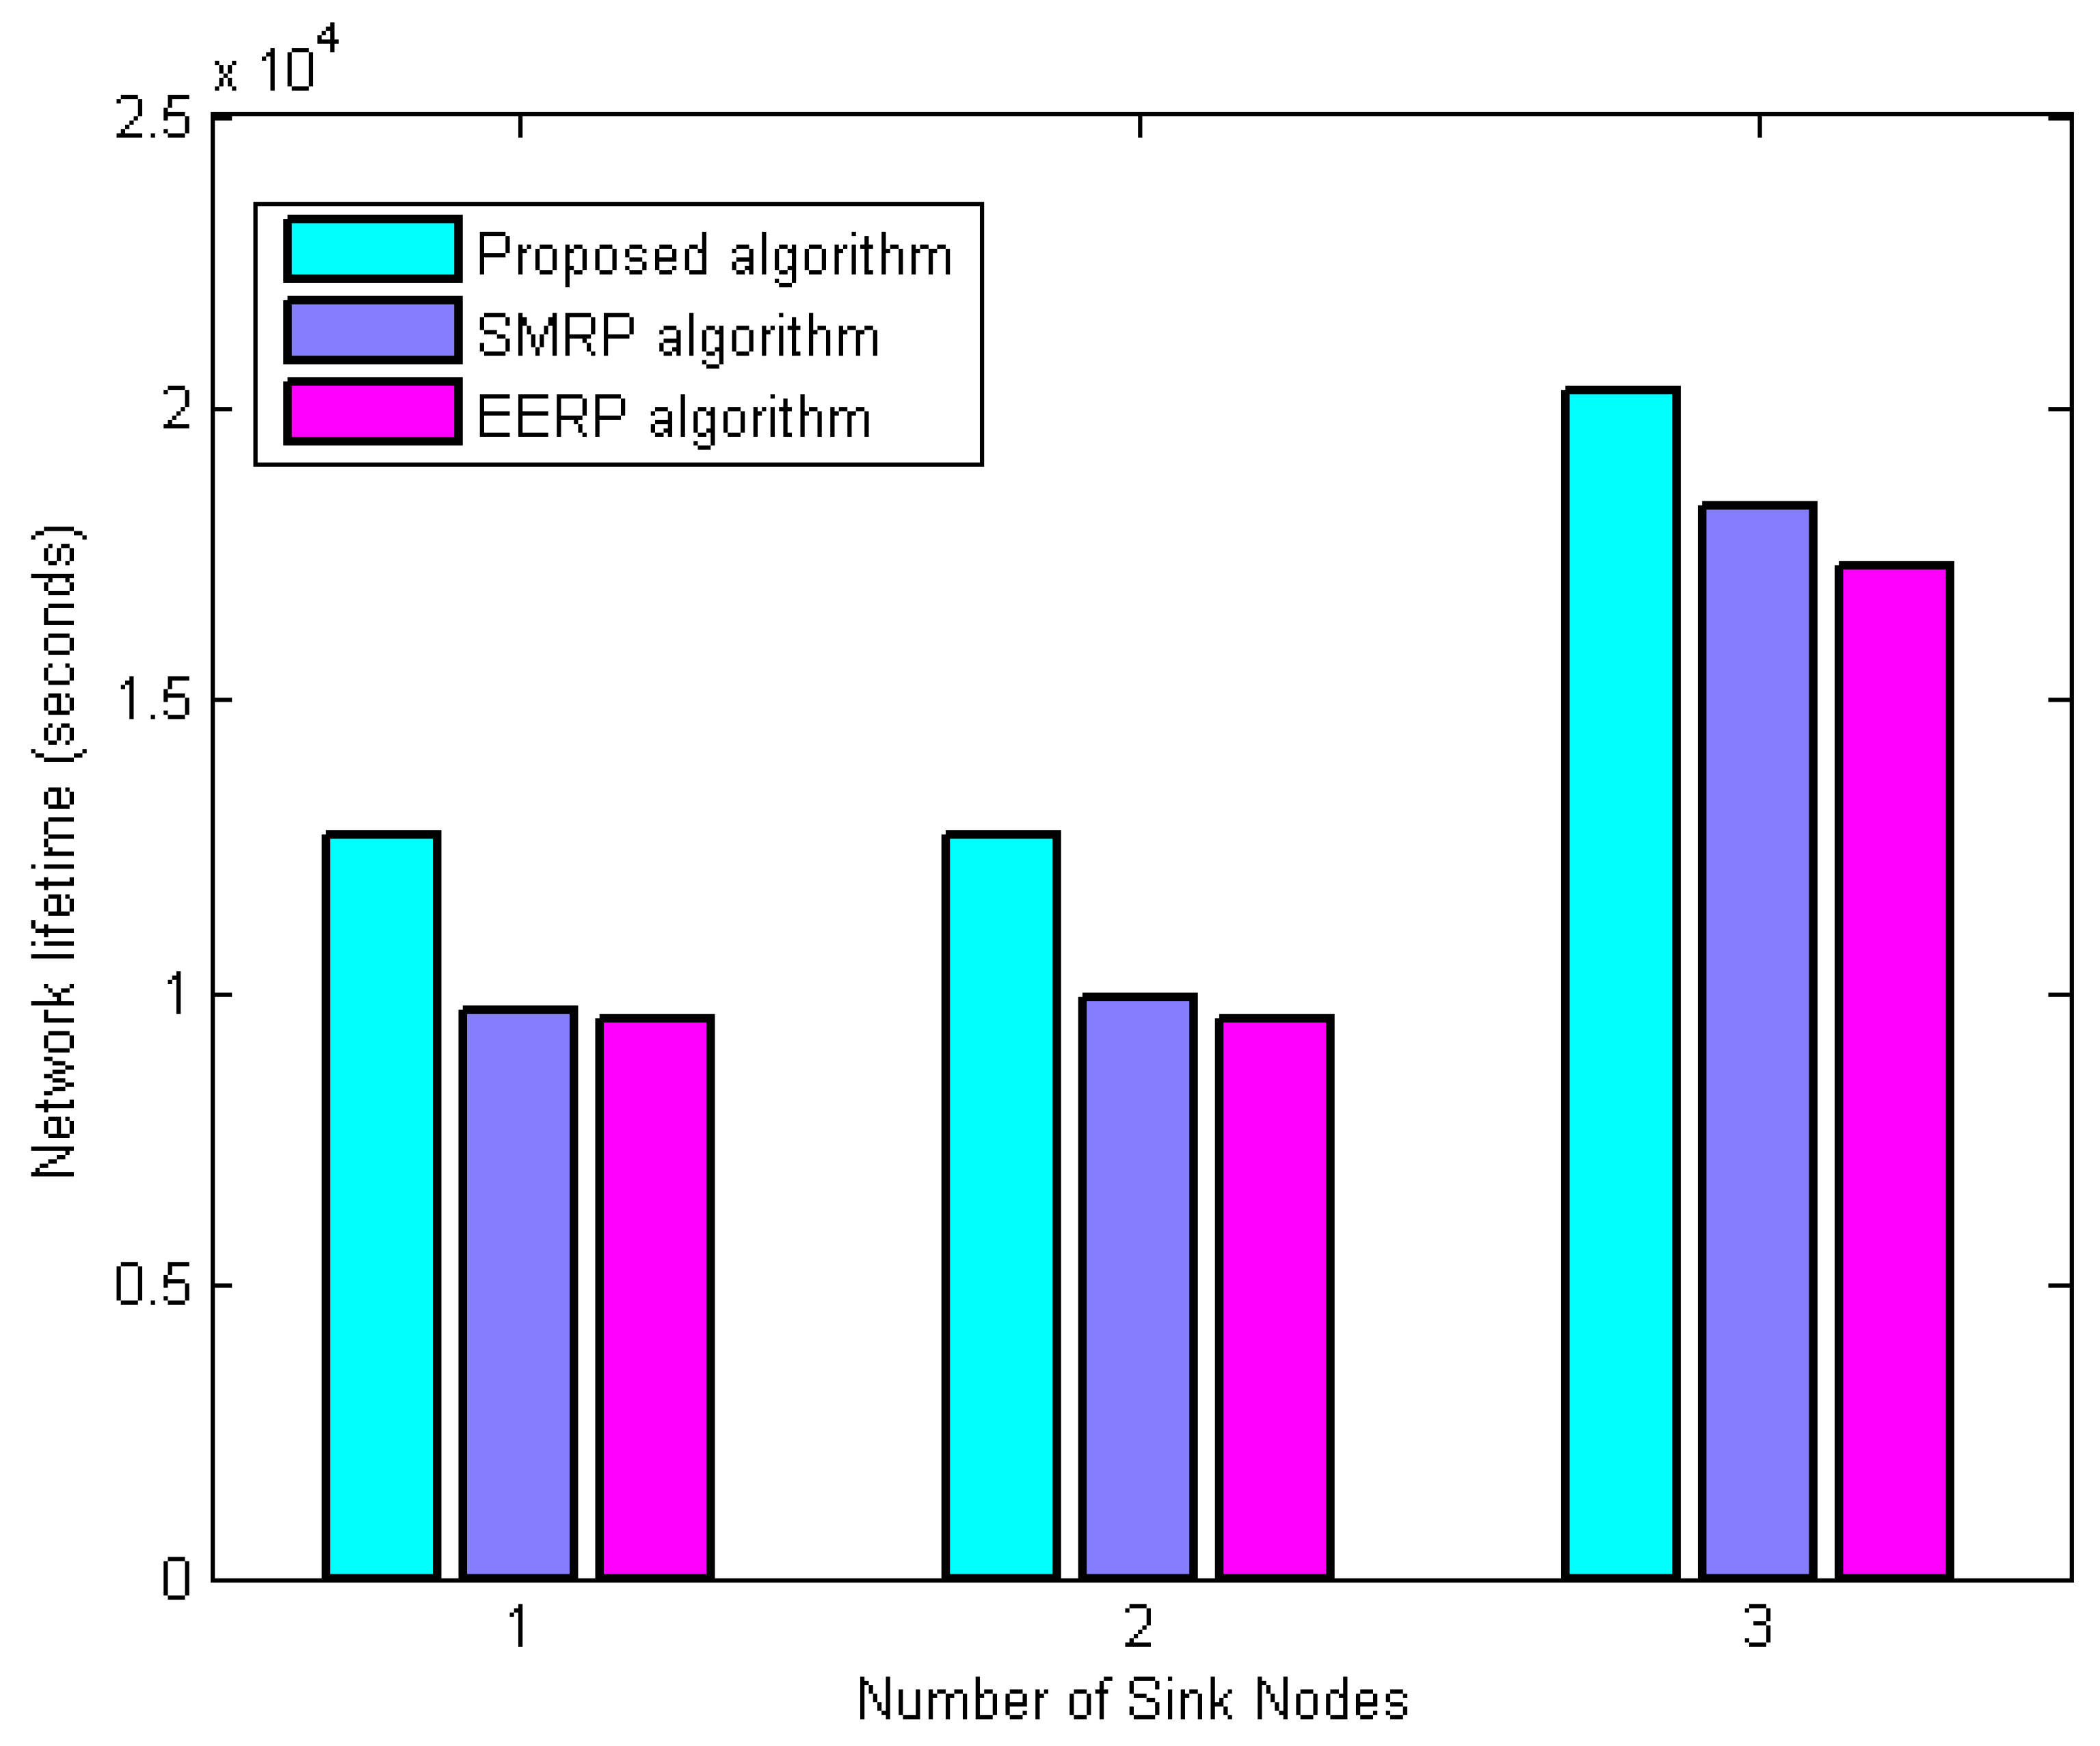
The second experiment examines the influence of sink nodes on network lifetime in scenario 1. This experiment’s network sink nodes range from one to three. Three packets per second is the normal traffic rate. Figure 13 depicts network lifetime vs. sink node number. More sink nodes enhance network lifetime, as shown in the figure. Two factors cause such results. First, adding additional sink nodes gives sensor nodes more options for routing data messages, reducing energy holes, and balancing network energy consumption. Second, additional sink nodes during network deployment reduce sensor-to-sink distance. Thus, more energy may be preserved. The proposed algorithm improves network lifetime compared to others, resulting in improved energy balance. This validates the proposed nodes’ load metric and sinks load metric. SMRP and EERP do not avoid lossy links, causing packet loss. The following experiment shows that adding additional sink nodes improves network lifetime. More sinks in WSNs improve network performance but raise construction costs.
 2.
Network lifetime evaluation under the second scenario
In this set of experiments, the network lifetime is studied under the second scenario concerning the average traffic rate and the number of sink nodes.
The first experiment studies network lifetime under the second scenario. In this experiment, traffic averages three to 11 packets per second while fixing the number of sink nodes in the network to three nodes. Figure 14 displays the second scenario’s network lifetime vs. average traffic rate. The figure indicates that the proposed approach increases network lifetime with increasing traffic volume. In addition to the reasons mentioned above, which made the proposed approach outperforms the other algorithms in the first scenario, the rest of the reasons for such improvement can be justified as follows. As the environmental conditions in this scenario are assumed to be outside the normal range, the routing paths are vulnerable to environmental factors. This increases the number of paths cut off for environmental reasons, and thus data transmission will become more and more concentrated. This further aggravates the energy imbalance of the network. Compared with SMRP, the proposed algorithm can achieve effective energy balance across the network in a harsh environment. At the same time, the proposed approach effectively bypasses the danger zones and discovers safer paths for data transmission through its modified environmental impact metric. On the other hand, in the case of EERP, its routing paths would inevitably cross the danger zones as the environmental impact on the routing performance is not taken into consideration, making the routing paths be cut off due to environmental reasons, causing more energy wastage as a result of retransmission of lost packets. Therefore, EERP algorithm has the worst performance compared with the others.
The second experiment of this set studies the network lifetime while varying the number of sink nodes under the second scenario. This experiment was conducted by increasing the number of sink nodes in the network from one to three and maintaining the average traffic rate λ at three packets per second. Figure 15 shows the variation of network lifetime with respect to a different number of sink nodes. The figure shows that introducing more sink nodes in the network increases the network lifetime. This is because deploying more sink nodes in the network can effectively alleviate the energy–hole problem, which helps to balance network energy consumption. However, it can also be seen from the figure that the proposed algorithm improves the network lifetime compared to the other algorithms, even with an increase in the number of sink nodes. Compared to the SMRP and EERP algorithms, the proposed approach can better use its energy-balance feature due to its new proposed metrics, namely the nodes’ energy consumption load metric and the sink load metric. It reveals the first reason behind such results. The second reason is that the proposed environment-aware routing as SMRP algorithm can avoid danger zones, and thus the routing paths are much less likely to be cut off due to environmental reasons. This explains the reason why the EERP gives the worst results, as it does not consider environmental impact. Finally, the SMRP and EERP do not take into consideration the link quality to make the routing decisions, which leads to packet loss and, thus, more energy consumption due to the retransmission of lost packets.

6.3.4. Average End-to-End Delay Evaluation

A further series of experiments are carried out in this part to evaluate the suggested technique in terms of end-to-end latency. Comparisons are made between the proposed method and SMRP [15] and EERP [23] for the above scenarios under different traffic rates and a number of sink nodes.
 1.
Average end-to-end delay evaluation under the first scenario
This set of simulation experiments examines end-to-end delay at varying traffic rates and sink node numbers for the first scenario.
First simulation experiment analyses end-to-end delay with average traffic rate. This experiment varied traffic from three to 11 packets per second using three sink nodes. Traffic volume affects end-to-end delay (Figure 16). The proposed routing method has the lowest end-to-end delay compared to SMRP and EERP because it picks the forwarding node that can transmit data packets within their deadlines based on relaying speed. It also picks forwarding nodes with a more stable connection to prevent packet loss and resend, reducing delivery delay.
In the case of SMRP and EERP routing algorithms, packets cannot bypass the lossy links, which results in an increase in the end-to-end latency due to the retransmission of lost packets. In addition, they do not support real-time communications, leading to late delivery of data.
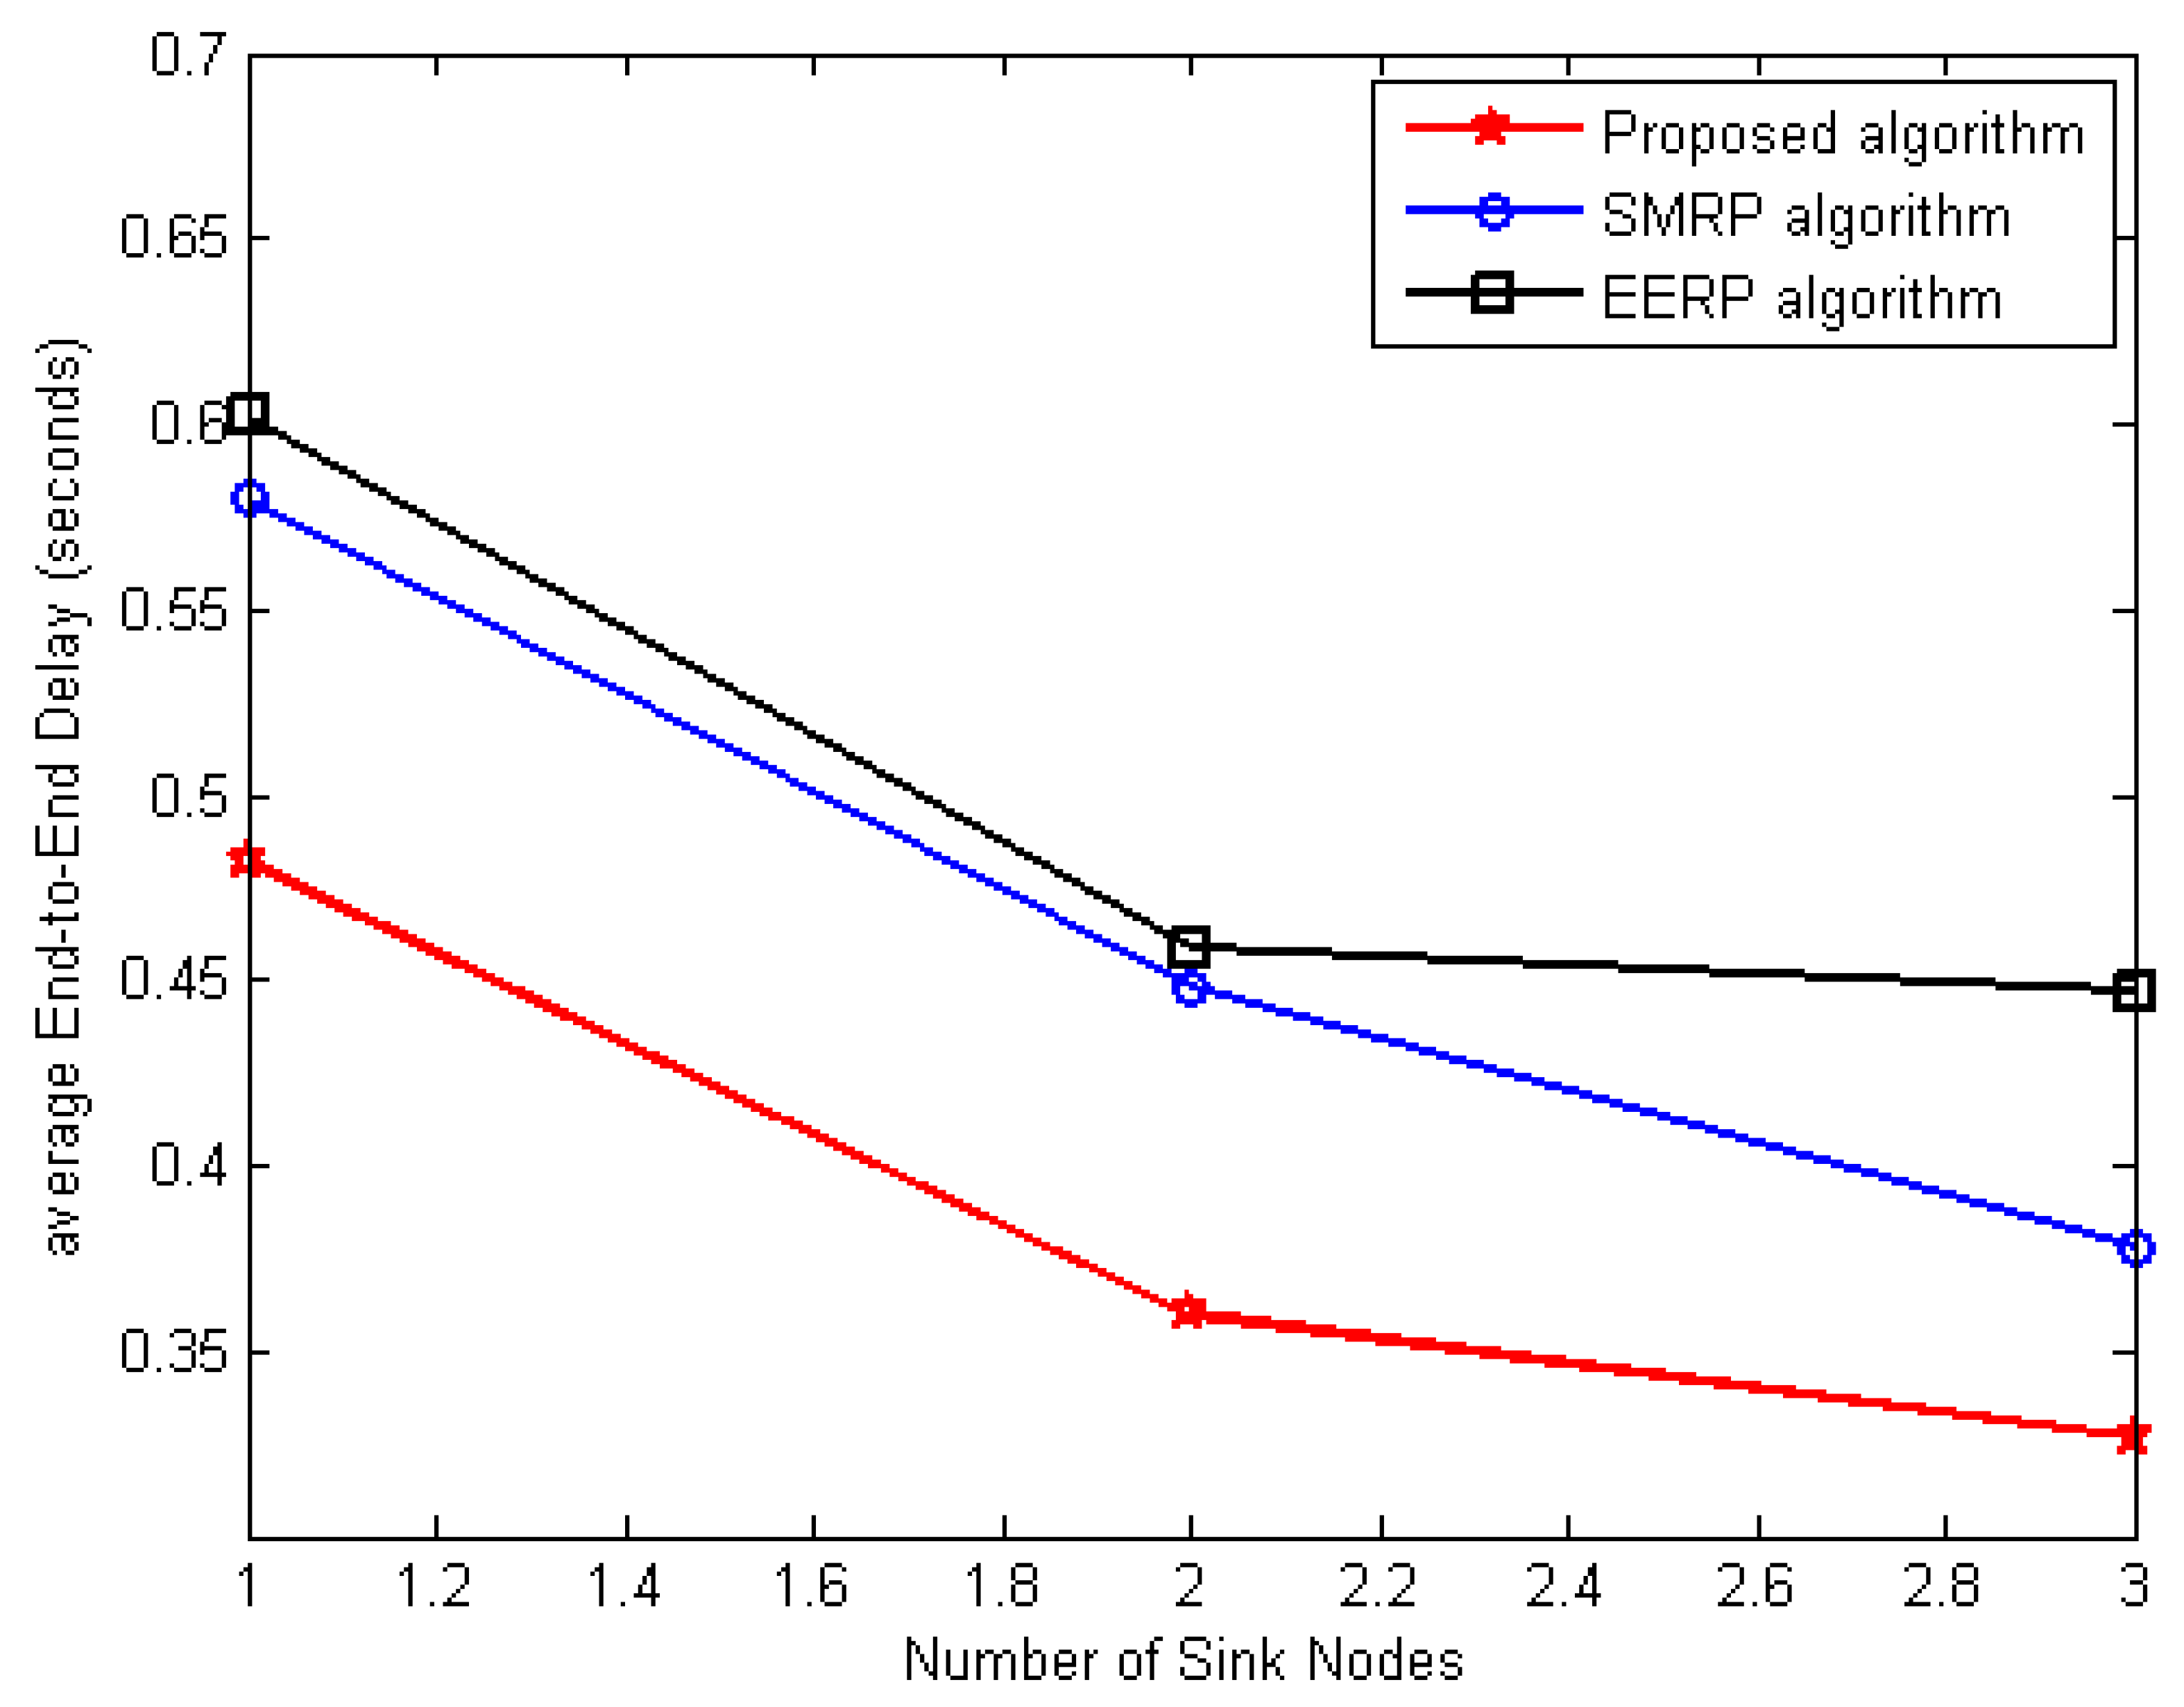
The second experiment examines end-to-end delay with varied numbers of sink nodes. To test this variation, the number of sink nodes in the network varies from one to three, while traffic is fixed at three packets per second. Figure 17 depicts end-to-end delay variation for the first case with varying sink nodes. End-to-end delay reduces as sink nodes increase, as indicated in the figure. The delivery delay reduces as the average distance to sink nodes decreases. The proposed algorithm has the lowest end-to-end delay. The algorithm picks relaying nodes depending on speed, enhancing real-time data delivery. Improves packet delivery across unstable networks, reducing packet loss and retransmission delays.
SMRP and EERP do not include packet loss due to wireless connections’ dynamic nature. This increases packet loss, which delays delivery due to retransmission. They do not improve real-time data transmission.
 2.
Average end-to-end delay evaluation under the second scenario
This simulation experiment shows how end-to-end latency changes with traffic rate and sinks nodes in the second scenario. The first experiment examines how end-to-end latency increases with the traffic rate in the second scenario. This simulation experiment varied the average traffic rate from three to 11 packets per second while maintaining three sink nodes. Figure 18 shows end-to-end latency vs. traffic volume. This figure demonstrates that the proposed approach reduces end-to-end latency. The proposed approach outperformed other algorithms in the first scenario, which is reasonable. The proposed approach tries to create a data path less likely to be cut off due to environmental factors than those estimated by SMRP, leading to more reliable links and less delivery delay. EERP has the greatest end-to-end latency since it ignores external environment impact on routing performance.
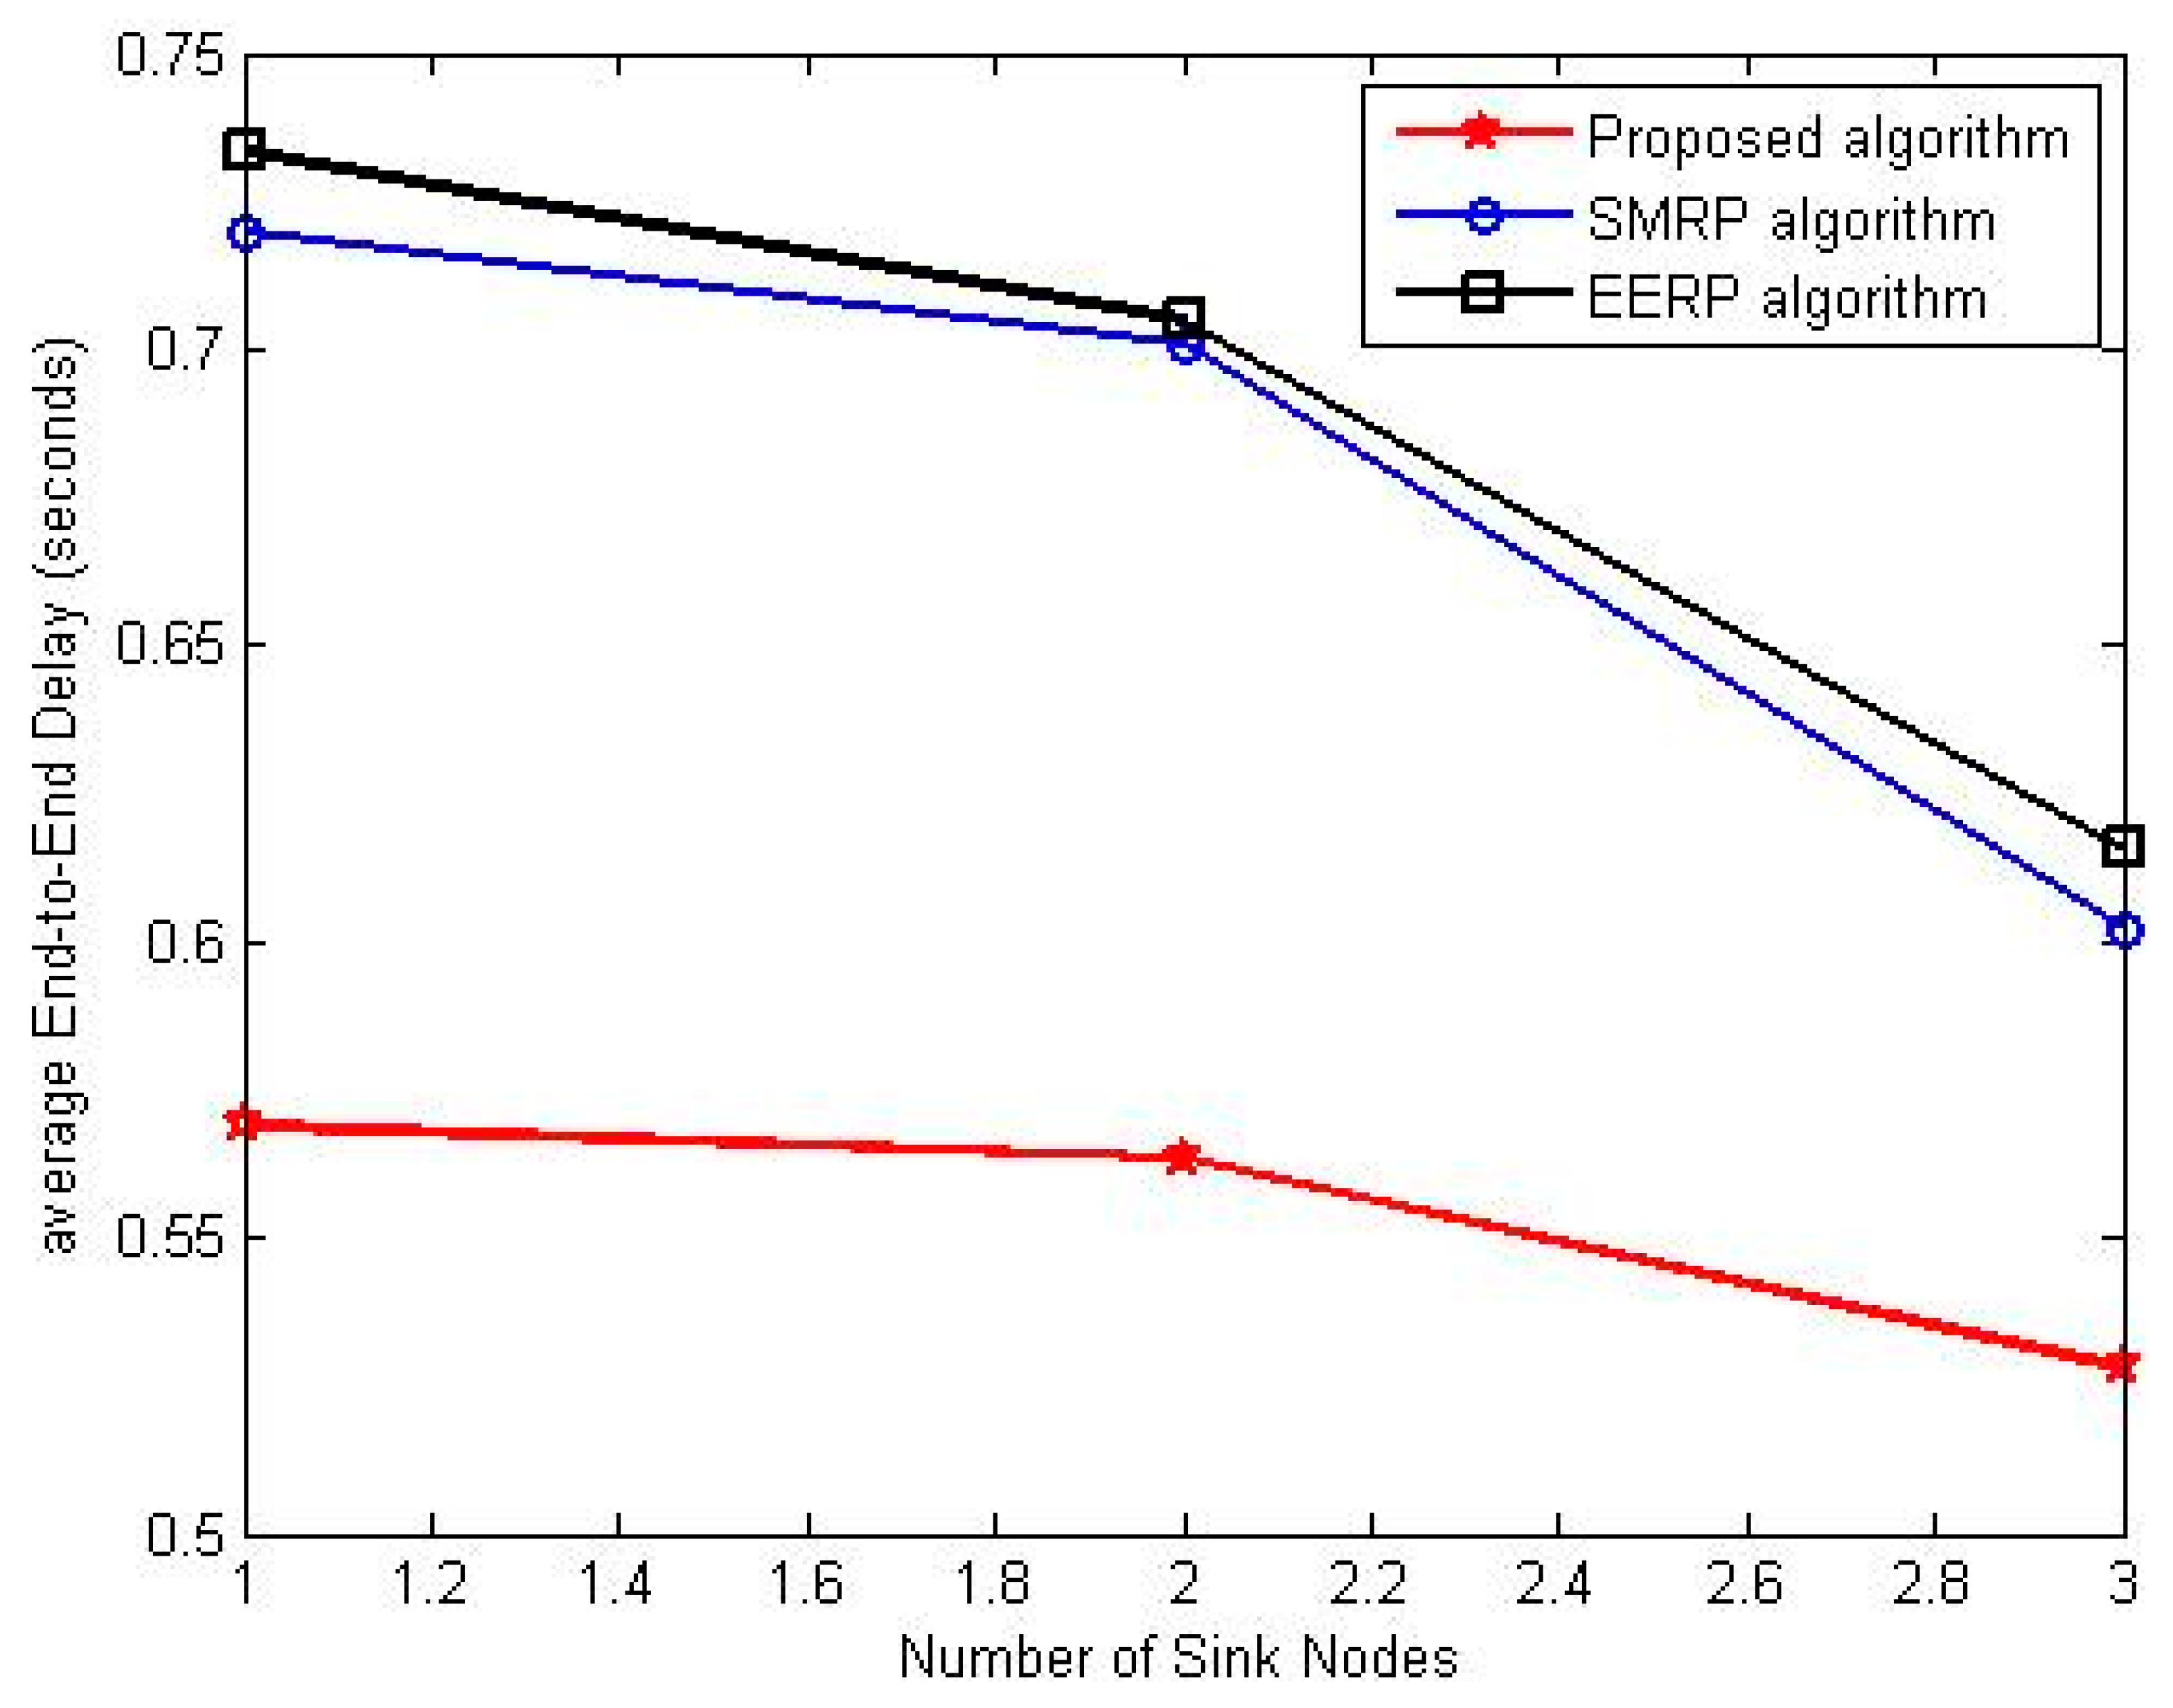
The second experiment examines end-to-end delay variation with various sink nodes in the second scenario. The experiment deploys one to three sink nodes while keeping the average traffic rate at three packets per second. Figure 19 depicts end-to-end delay variation with a varied number of sink nodes. With additional sink nodes, end-to-end latency decreases because data packets travel a shorter distance, reducing delivery time. The proposed algorithm has the least end-to-end delay. In addition to the reasons described above, the routing paths in the proposed method are less likely to be cut off due to environmental factors than those computed using SMRP. Environmental factors easily cut off EERP’s routing paths since it does not consider how to circumvent danger zones, causing packet loss and delivery delays. This causes EERP’s excessive end-to-end delay.

6.3.5. Energy Balance Evaluation

A further series of experiments are carried out in this part with the purpose of evaluating the suggested technique in terms of energy balance, EIF. The proposed approach is compared to SMRP [15] and EERP [23] for the scenarios mentioned earlier. During running time, The EIF was calculated to demonstrate the effectiveness of the proposed algorithm in achieving energy balance. The average traffic rate is set to three packets per second, and the deadline is set at 700 ms. In addition, the number of sink nodes in the network is fixed at three nodes.
 1.
Energy balance evaluation under the first scenario
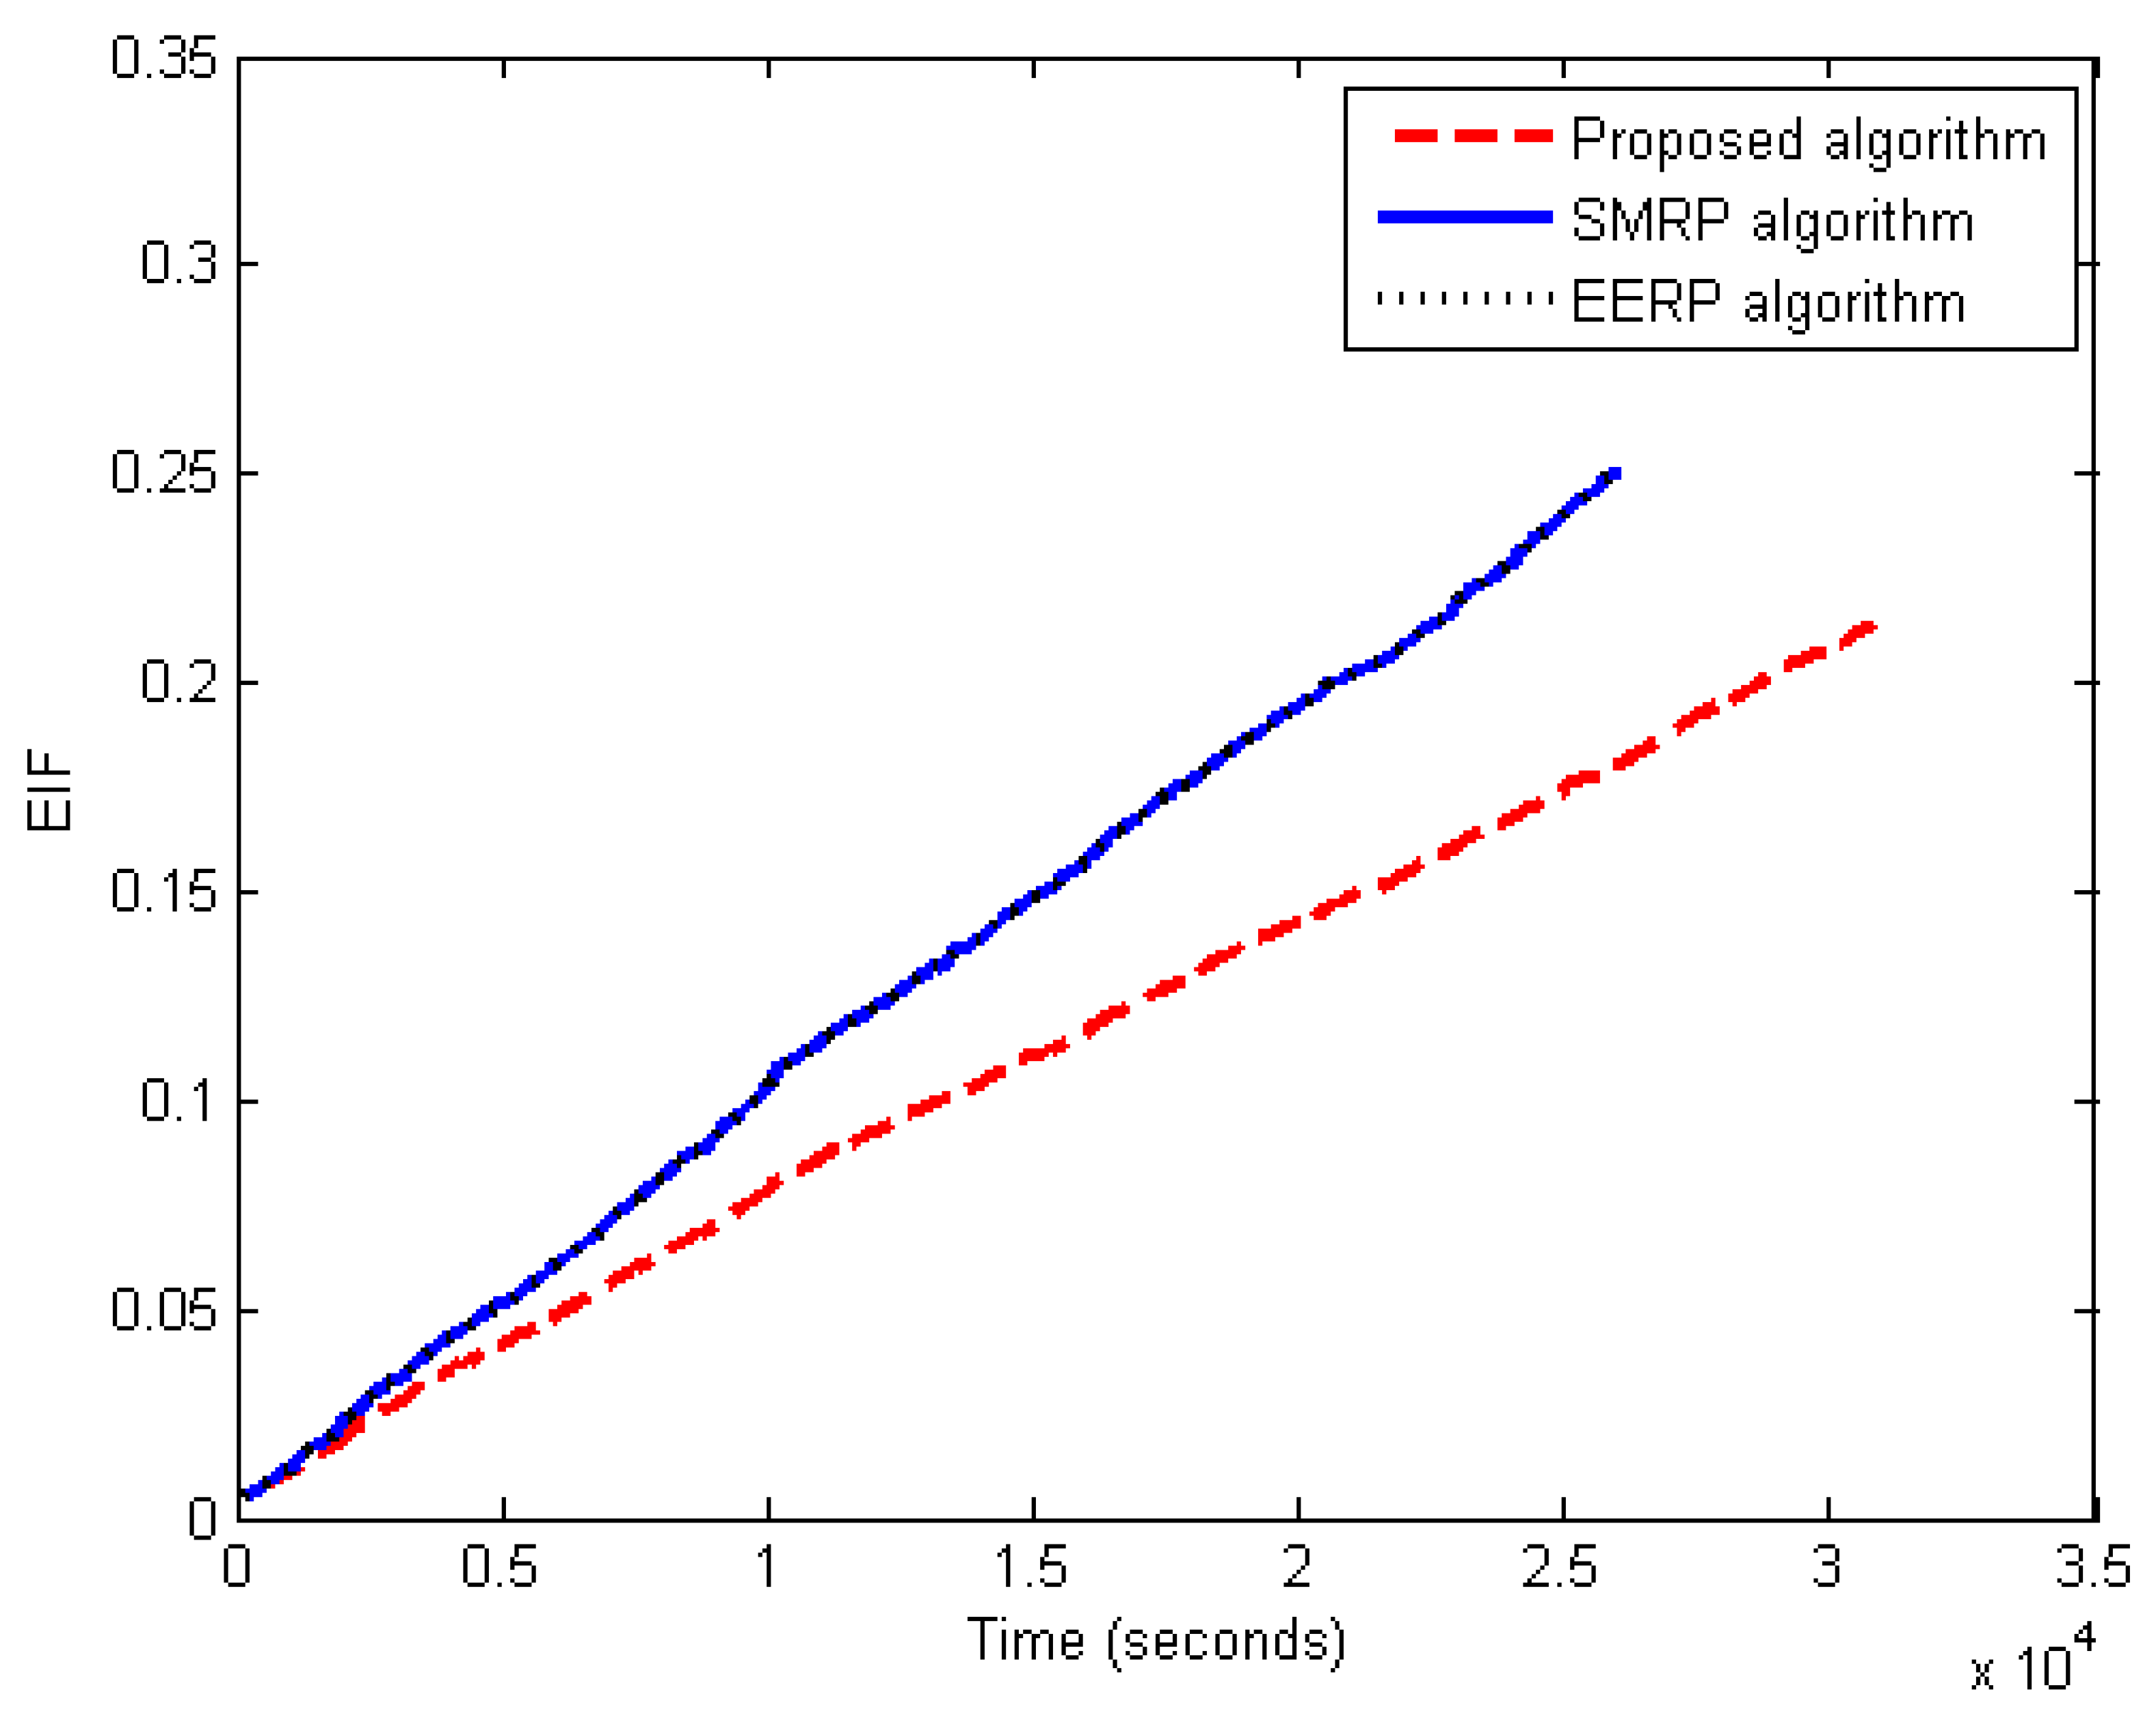
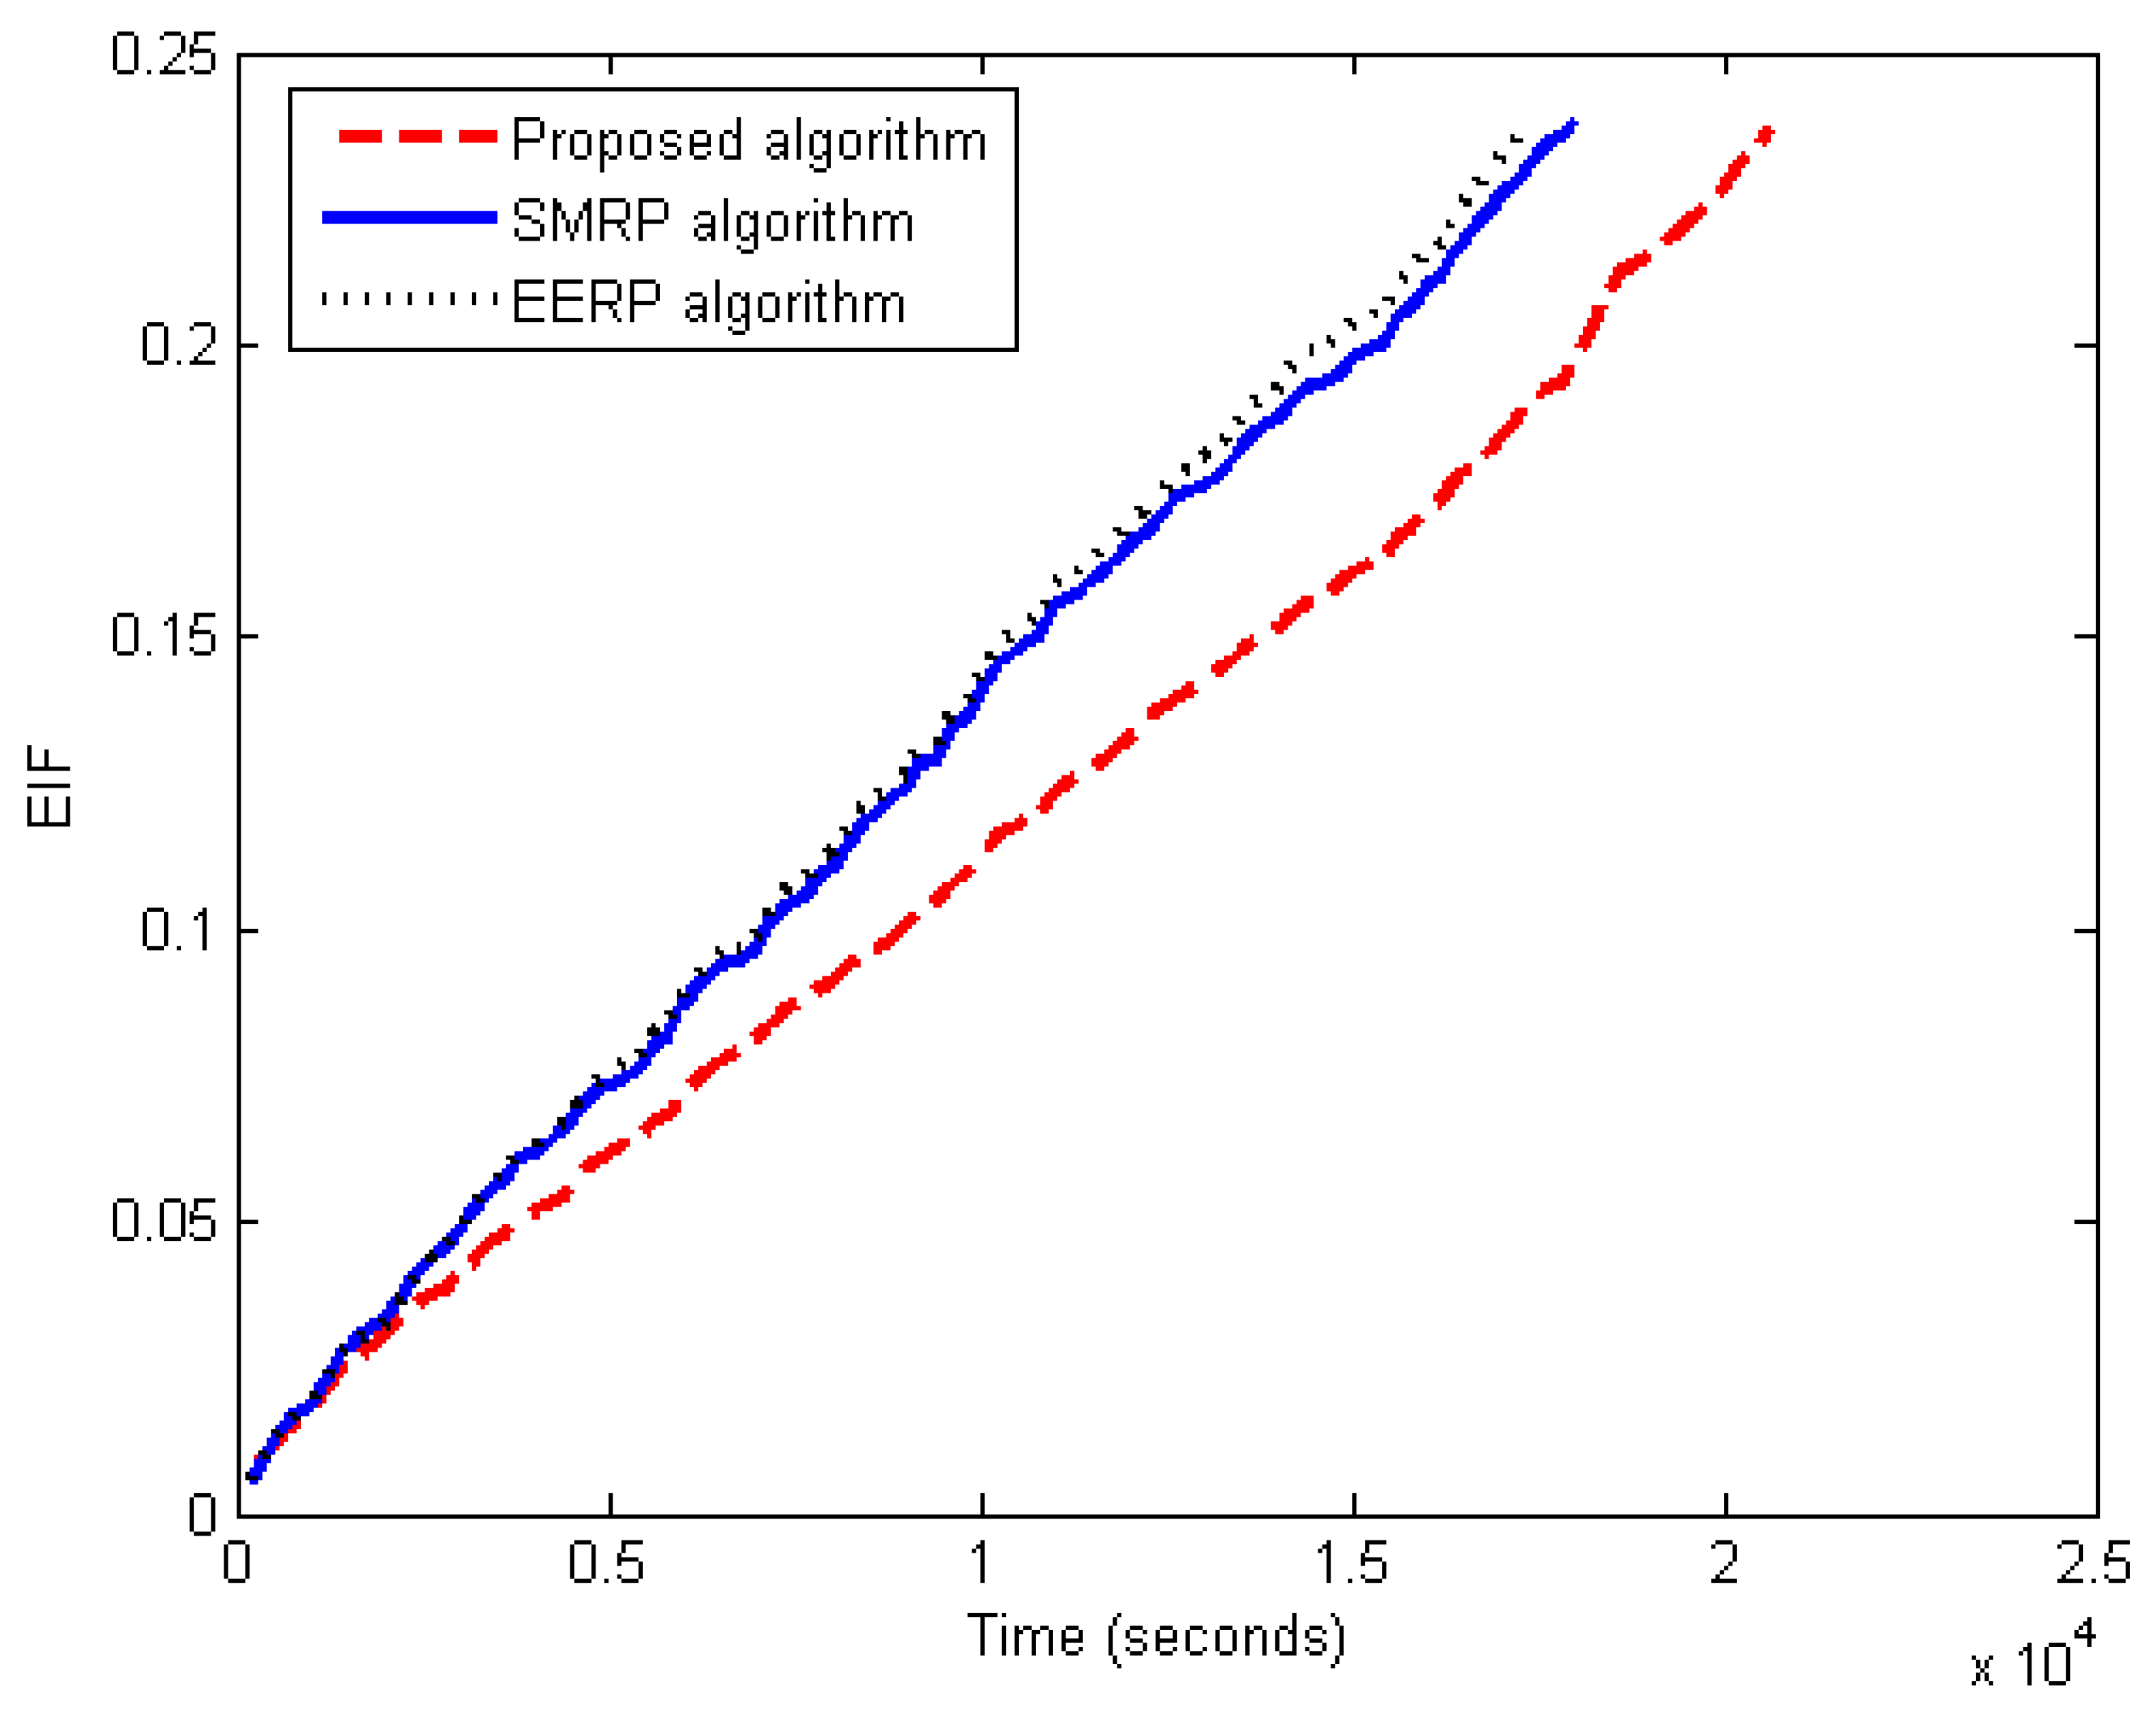
This simulation aims to study the first scenario’s EIF over time. Figure 20 shows the first scenario’s EIF over time. EIF grows with runtime, as shown in the figure. In a random topology, some sink nodes are deployed in regions with several sensor nodes. Some sensor nodes are only bound to certain sink nodes, resulting in an unbalanced distribution of sensor nodes. This problem affects the network’s energy variance. It explains why EIF grows over time.
Figure 20 shows that the proposed algorithm has the lowest EIF. The proposed algorithm’s node energy is closer to the average than existing methods. The EIF shows that the proposed approach can effectively balance residual energy among sensor nodes. This also confirms the proposed nodes’ load metric and sink load metric. SMRP and EERP routing algorithms relay data packets to balance energy consumption. According to the EIF, residual energy cannot balance energy consumption. This further confirms the proposed nodes’ energy consumption and sink load metrics for improved energy balance. The proposed technique is superior to SMRP and EERP. Hence, SMRP and EERP have the same EIF performance.
 2.
Energy balance evaluation under the second scenario
This experiment studies the EIF variation over runtime for the second scenario. Figure 21 shows the variation of EIF over simulation time for the second scenario. As shown in the figure, the EIF increases with increasing the simulation time for the same reasons described before. As in this scenario, the environmental data are assumed to be outside the normal range, and a number of routing paths are much more likely to be cut off due to environmental reasons. Therefore, the data transmission becomes more and more concentrated, further aggravating the network’s energy imbalance. This explains why the resulting EIF for the second scenario is worth more than that under the first scenario. However, it is clear that the proposed algorithm achieves the minimum EIF compared with the others. This is evidence that the proposed algorithm provides a more effective energy balance than SMRP and EERP routing algorithms.

6.3.6. Complexity Evaluation

This experiment evaluates the overall complexity of the proposed algorithm in terms of processing time required in comparison to SMRP [15] and EERP [23] routing algorithms. Figure 22 shows the overall complexity in terms of processing time required. The figure shows that the proposed algorithm requires a longer processing time than SMRP and EERP. Therefore, the complexity of the proposed algorithm is higher than that of the other algorithms. That’s to say, the proposed algorithm needs more computational energy. However, in WSNs, energy consumption in communication has been recognized as the main source of energy consumption, and it costs much more than computation energy consumption. However, this disadvantage in complexity cannot compensate the good performance in network PDR, network lifetime, delivery delay, energy balance, and packet miss ratio.

7. Conclusions

This paper introduced a new routing technique for WSNs with multiple sinks. The proposed routing approach is energy-aware, real-time, and environmentally conscious, taking into account load balancing, environmental data, network quality, latency, hop count, and sink load metric. The environmental factors are modeled so the routing algorithm can avoid highly dangerous areas. The method was compared to two newly released algorithms, SMRP and EERP, and several equations were modified, as well as more realistic factors that should be considered throughout the routing process. The proposed algorithm has a higher time complexity compared to comparison algorithms, which is a disadvantage. However, there is a trade-off between performance and temporal complexity. In the future, we will aim to expand our proposed routing algorithm to mobile multi-sink WSNs.

Author Contributions

Conceptualization, F.H.E.-F. and R.A.R.; methodology, F.H.E.-F. and R.A.R.; software, F.H.E.-F.; validation, F.H.E.-F., R.A.R., Y.A., M.K., J.S.A. and A.A.; formal analysis, F.H.E.-F. and R.A.R.; investigation, F.H.E.-F. and R.A.R.; resources, F.H.E.-F., R.A.R., M.K., Y.A., J.S.A. and A.A.; data curation, F.H.E.-F. and R.A.R.; writing—original draft preparation, F.H.E.-F. and R.A.R.; writing—review and editing, F.H.E.-F., R.A.R., Y.A., M.K., J.S.A. and A.A.; visualization, F.H.E.-F. and R.A.R.; supervision, R.A.R.; project administration, R.A.R.; funding acquisition, M.K., J.S.A. and Y.A.; All authors have read and agreed to the published version of the manuscript.

Funding

This research was funded by the Scientific Research Deanship at the University of Ha’il, Saudi Arabia through project number RG-21103.

Data Availability Statement

Not applicable.

Conflicts of Interest

The authors declare no conflict of interest.

References

  1. Ilyas, M.; Mahgoub, I. Handbook of Sensor Networks; CRC Press: London, UK, 2005; pp. 117–140. [Google Scholar]
  2. Krishnan, M.; Jung, Y.M.; Yun, S. An Improved Clustering with Particle meta Optimization-Based Mobile Sink for Wireless Sensor Networks. In Proceedings of the 2nd International Conference on Trends in Electronics and Informatics, Tirunelveli, India, 11–12 May 2018. [Google Scholar]
  3. Pottie, G.; Kaiser, W. Wireless Integrated Network Sensors. Commun. ACM 2000, 43, 51–58. [Google Scholar] [CrossRef]
  4. Ghaffari, A. An Energy Efficient Routing Protocol for Wireless Sensor Networks using A-star Algorithm. J. Appl. Res. Technol. 2014, 12, 815–822. [Google Scholar] [CrossRef] [Green Version]
  5. Mukherjee, S.; Amin, R.; Biswas, G.P. Design of Routing Protocol for Multi-Sink Based Wireless Sensor Networks. J. Wirel. Netw. 2019, 25, 4331–4347. [Google Scholar] [CrossRef]
  6. Singh, A.; Nagaraju, A. Low Latency and Energy Efficient Routing-Aware Network Coding-Based Data Transmission in Multi-Hop and Multi-Sink WSN. Ad Hoc Netw. J. 2020, 107, 1–19. [Google Scholar] [CrossRef]
  7. El-Fouly, F.H.; Ramadan, R.A. E3AF: Energy Efficient Environment-Aware Fusion Based Reliable Routing in Wireless Sensor Networks. IEEE Access 2020, 8, 112145–112159. [Google Scholar] [CrossRef]
  8. El-Fouly, F.H.; Ramadan, R.A. Real-Time Energy-Efficient Reliable Traffic Aware Routing for Industrial Wireless Sensor Networks. IEEE Access 2020, 8, 58130–58145. [Google Scholar] [CrossRef]
  9. Habib, M. Energy-Efficient algorithm for reliable routing of wireless sensor networks. IEEE Trans. Ind. Electron. 2019, 66, 5567–5575. [Google Scholar]
  10. Zhang, W.; Liu, Y.; Han, G.; Feng, Y.; Zhao, Y. An Energy Efficient and QoS Aware Routing Algorithm Based on Data Classification for Industrial Wireless Sensor Networks. IEEE Access 2018, 6, 46495–46504. [Google Scholar] [CrossRef]
  11. Tavallaie, O.; Naji, H.R.; Sabaei, M.; Arastouie, N. RTEA: Real-Time and Energy Aware Routing for Industrial Wireless Sensor Networks. Wireless Pers. Commun. 2017, 95, 4601–4621. [Google Scholar] [CrossRef]
  12. Xu, C.; Cao, L.; Zhang, G.A.; Gu, J.Y. Overview of multiple sink routing protocols in wireless sensor networks. Appl. Res. Comput. 2010, 27, 816–823. [Google Scholar]
  13. Chen, S.; Huang, Q.; Zhang, Y.; Li, X. Double Sink Energy Hole Avoidance Strategy for Wireless Sensor Network. EURASIP J. Wirel. Commun. Netw. 2020, 226, 226. [Google Scholar] [CrossRef]
  14. Onwuegbuzie, I.U.; Razak, S.A.; Al-Dhaqm, A. Multi-Sink Load-Balancing Mechanism for Wireless Sensor Networks. In Proceedings of the IEEE International Conference on Computing (ICOC), Online, 10 May 2021; pp. 140–145. [Google Scholar]
  15. Fu, X.; Yang, Y.; Postolache, O. Sustainable Multipath Routing Protocol for Multi-Sink Wireless Sensor Networks in Harsh Environments. IEEE Trans. Sustain. Comput. 2021, 6, 168–181. [Google Scholar] [CrossRef]
  16. Awang, A. Multi-sink Routing using Path loss in Multihop Wireless Sensor Networks. In Proceedings of the Asia-Pacific Conference on Communications (APCC 2011), Kota Kinabalu, Malaysia, 2–5 October 2011. [Google Scholar]
  17. Wang, J.; Yin, Y.; Zhang, J.; Lee, S.; Sherratt, R.S. Mobility based energy efficient and multi-sink algorithms for consumer home networks. IEEE Trans. Consum. Electron. 2013, 59, 77–84. [Google Scholar] [CrossRef]
  18. Fu, X.; Fortino, G.; Pace, P.; Aloi, G.; Li, W. Environment-fusion multipath routing protocol for wireless sensor networks. Inf. Fusion 2020, 53, 4–19. [Google Scholar] [CrossRef]
  19. McCune, R.; Madey, G. Control of Artifial Swarms with DDDAS. Procedia Comput. Sci. 2014, 29, 1171–1181. [Google Scholar] [CrossRef] [Green Version]
  20. Nayyar, A.; Singh, R. Ant Colony Optimization (ACO) based Routing Protocols for Wireless Sensor Networks: A survey. Int. J. Adv. Comput. Sci. Appl. 2017, 8, 148–155. [Google Scholar]
  21. Liu, Z.; Xu, J.; Wang, W.; Zhang, Y.; Li, X. Probabilistic Routing Algorithm Based on Naive Bayesian Classification Model in Multi-sink Sensor Networks. J. Comput. Inf. Syst. 2013, 9, 9943–9951. [Google Scholar]
  22. Cao, L.; Xu, C.; Shao, W. Multiple Sink Dynamic estimation Geographic Routing in Wireless Sensor Networks. In Proceedings of the International Conference on Cyber-Enabled Distributed Computing and Knowledge Discovery (CyberC), Huangshan, China, 10–12 October 2010. [Google Scholar]
  23. Rajanna, M.; Murthy, G.S.; Varaprasad, G. Energy efficient routing protocol for multisink wireless sensor networks. In Applied Computational Technologies. ICCET 2022. Smart Innovation, Systems and Technologies; Springer: Berlin/Heidelberg, Germany, 2022. [Google Scholar]
  24. Jiang, H.; Sun, R. Energy optimized routing algorithm in multi-sink wireless sensor networks. Appl. Math. Inf. Sci. 2014, 8, 349–354. [Google Scholar] [CrossRef]
  25. Mottola, L.; Picco, G.P. Muster: Adaptive energy-aware multisink routing in wireless sensor networks. IEEE Trans. Mob. Comput. 2010, 10, 1694–1709. [Google Scholar] [CrossRef] [Green Version]
  26. Tan, D.D.; Kim, D.S. Dynamic traffic-aware routing algorithm for multi-sink wireless sensor networks. Wirel. Netw. 2013, 20, 1239–1250. [Google Scholar] [CrossRef]
  27. Le, L.; Felea, V. Latency and network lifetime trade-off in geographic multicast routing for multi-sink wireless sensor networks. In Proceedings of the International Conference on Mobile, Secure, and Programmable Networking, Paris, France, 18–20 June 2018; Springer: Berlin/Heidelberg, Germany, 2018; pp. 294–310. [Google Scholar]
  28. Safa, H.; Moussa, M.; Artail, H. An energy efficient genetic algorithm based approach for sensor-to-sink binding in multi-sink wireless sensor networks. Wirel. Netw. 2014, 20, 177–196. [Google Scholar] [CrossRef]
  29. El-Fouly, F.H.; Ramadan, R.A.; Mahmoud, M.I.; Dessouky, M.I. Abd El-Sami “REBTAM: Reliable Traffic Aware Energy Balance Data Reporting Algorithm for Object Tracking in Multi-Sink Wireless Sensor Networks. Int. J. Wirel. Netw. 2018, 24, 735–753. [Google Scholar] [CrossRef]
  30. Daas, M.S.; Chikhi, S.; Bourennane, E.-B. A dynamic Multi-Sink Routing Protocol for Static and Mobile Self-Organizing Wireless Networks: A Routing Protocol for Internet of Things. Ad Hoc Netw. 2021, 117, 102495. [Google Scholar] [CrossRef]
  31. Cheng, L.; Niu, J.; Cao, J.; Das, S.K.; Gu, Y. QoS aware geographic opportunistic routing in wireless sensor networks. IEEE Trans. Parallel Distrib. Syst. 2014, 25, 1864–1875. [Google Scholar] [CrossRef]
  32. He, T.; Stankovic, J.A.; Lu, C.; Abdelzaher, T. SPEED: A stateless protocol for real-time communication in sensor networks. In Proceedings of the International Conference on Distributed Computing Systems, Providence, RI, USA, 19–22 May 2003; pp. 46–55. [Google Scholar]
  33. Liu, A.; Ren, J.; Li, X.; Chen, Z.; Shen, X.S. Design principles and improvement of cost function based energy aware routing algorithms for wireless sensor networks. Comput. Netw. 2012, 5, 1951–1967. [Google Scholar] [CrossRef]
  34. Li, Y.; Chen, C.S.; Song, Y.Q.; Wang, Z.; Sun, Y. Enhancing real-time delivery in wireless sensor networks with two-hop information. IEEE Trans. Ind. Inform. 2009, 5, 113–122. [Google Scholar] [CrossRef]
Figure 1. Single factor environmental impact metric curve function.
Applsci 13 00605 g001
Figure 2. Influence of increasing average traffic rate on packets delivery ratio under the first scenario.
Applsci 13 00605 g002
Figure 3. Influence of increasing the number of sink nodes on packets delivery ratio under the first scenario.
Applsci 13 00605 g003
Figure 4. Increasing average traffic rate effect on packets delivery ratio under the second scenario.
Applsci 13 00605 g004
Figure 5. Increasing the number of sink nodes effect on packet delivery ratio under the second scenario.
Applsci 13 00605 g005
Figure 6. Influence of increasing average traffic rate on deadline miss ratio under the first scenario.
Applsci 13 00605 g006
Figure 7. Influence of increasing number of sink nodes on deadline miss ratio under the first scenario.
Applsci 13 00605 g007
Figure 8. Influence of increasing deadline on deadline miss ratio under the first scenario.
Applsci 13 00605 g008
Figure 9. Influence of increasing average traffic rate on deadline miss ratio under the second scenario.
Applsci 13 00605 g009
Figure 10. Influence of increasing number of sink nodes on deadline miss ratio under the second scenario.
Applsci 13 00605 g010
Figure 11. Influence of increasing deadline on deadline miss ratio under the second scenario.
Applsci 13 00605 g011
Figure 12. Influence of increasing average traffic rate on network lifetime under the first scenario.
Applsci 13 00605 g012
Figure 13. Influence of increasing the number of sink nodes on network lifetime under the first scenario.
Applsci 13 00605 g013
Figure 14. Influence of increasing average traffic rate on network lifetime under the second scenario.
Applsci 13 00605 g014
Figure 15. Influence of increasing the number of sink nodes on network lifetime under the second scenario.
Applsci 13 00605 g015
Figure 16. Influence of increasing average traffic rate on average end-to-end delay for the first scenario.
Applsci 13 00605 g016
Figure 17. Influence of increasing number of sink nodes on average end-to-end delay for the first scenario.
Applsci 13 00605 g017
Figure 18. Influence of average traffic rate on average end-to-end delay for the second scenario.
Applsci 13 00605 g018
Figure 19. Influence of increasing number of sink nodes on average end-to-end delay for the second scenario.
Applsci 13 00605 g019
Figure 20. Energy Imbalance Factor (EIF) vs. the running time under the first scenario.
Applsci 13 00605 g020
Figure 21. Energy Imbalance Factor (EIF) vs. the running time under the second scenario.
Applsci 13 00605 g021
Figure 22. Overall complexity in terms of the required processing time.
Applsci 13 00605 g022
Table 1. The problems model notations.
Given Parameters
NotationDescription
VThe monitored field’s sensor nodes.
S t Is the set of source nodes at time t, t T .
TThe time horizon.
ZAll zones
S N t Is the set of sink nodes deployed in the monitored field at time t, t T .
F S N t Final set of sink nodes that have an environmental impact metric larger than a threshold Value in the monitored field at time t, t T ,   F S N t S N t .
M s t Set of all messages collected from the source node s at time t, s S t ,   S t V ,   and   t T . sS
Z E D i f Zone i’s environmental data for factor f.
E I i f Zone i’s single environmental factor f impact metric.
M E I i Zone i’s multiple environmental impact metric.
N E I i Zone i’s neighboring environmental impact metric
F E I i Zone i’s final environmental impact metric.
E I M x i ( t ) The sink/sensor node x final environmental impact metric in zone i at time t, ij.
E I t h The environmental impact threshold.
K i j The coefficient of attenuation between zones i and j.
E D i j Euclidean Distance (ED) between the center of zone i and j, ij.
E D ( x , s i ) ( t ) The Euclidean distance (ED) between the sensor node x and sink node si at time t, ij.
IDLThe initial deadline defined by the application at each source node.
deadlineEach hop’s packet deadline.
P y s i The set of all candidate paths between any pair (y, si), ∀sS
D s s i s The desired message delivery speed from source s to sink
si.  s S t ,   s i S N t ,   t T
P R R x y Link’s (x,y), packet reception ratio, i, jL, and ij.
P L R x y The packet loss ratio for the link (x,y), i, jL, and ij.
D x y Link (x,y) delay. i, jL, and ij.
R E x ( t ) Node x’s residual energy at time t, iSR. iSR.
I E x Sensor node x, initial energy, x V iSR. iSR.
H E x y Transmission energy from x to y in a single hop, ( i , j ) L
E C L y ( t ) Energy load function for each sensor node y at time t, y N E B x ,   N E B x V ,   t T
N L y ( t ) Each sensor node x load at time t, y N E B x ,   N E B x V ,   t T
T M y ( t ) Sensor node y, total number of messages, y V ,   t T , i S R { s i n k }
S L M s i ( t ) The sink load metric of each sink node si, s i S N t ,   t T
D h M s i s The distance hop metric between sink node si and each source node s, ∀s∈S
m h c x s i The minimum hop count from any sensor node x to each sink node si, x V ,   s i S N t ,   t T . i, NEBiSR
S N E s i sink node si, neighbor set, s i S N t . i, NEBiSR
C N E N x sensor node x, neighbor set, x , C N E N x V .
F N E N x The final neighbor set of sensor node x, x , F N E N x V .
Indicator Parameter
α ( y , s i ) p 1 if sensor node y is on path p to the chosen sink node si and 0 otherwise, y F N E N x , p P y s i , F N E N x V , and   t T .
Decision Variables
ξ x y s m 1 if sensor node x utilizes the neighbor node y to relay message m of the source node s and 0 otherwise, m M s t ,   s S t ,   x , y , S t V ,   and   t T
ω x y s m 1 if the sensor node x utilizes neighbor node y to relay message m of the source node s and 0, otherwise, m M s t ,   s S t ,   x , y , S t V ,   and   t T
r s i 1 if the sink node si has a final environmental metric greater than the threshold value and 0, otherwise, s i S N t ,   and   t T .
E n 1 if the difference between the environmental metric value of sink node si in zone i and sink node n in zone j is less than zero and 0, otherwise, s i F S N t ,   n F S N t { s i } ,   F S N t SN t ,   i , j   Z   and   t T .
I s i 1 if the sink node si has the maximum environmental metric value compared to that of other sink nodes and 0, otherwise, s i F S N t ,   F S N t   S N t ,   and   t T .
ε f 1 if the computed difference between the sink load value of sink node si and sink node f is less than zero and 0, otherwise, s i F S N t ,   f F S N t s i ,   F S N t S N t ,   and   t T
m s i 1 if the sink node si has the minimum sink load metric value compared to that of other sink nodes and 0, otherwise, s i F S N t , F S N t   S N t ,   and   t T .
ψ s i s 1 if the source node s selects the sink node si as an optimal sink and 0, otherwise, s S t , s i F S N t , F S N t   S N t ,   and   t T .
h k s If the distance hop metric difference between sink nodes si and node k is less than zero, return the value will be 1; 0 otherwise.
d s i s 1 if the sink node si has the minimum v distance hop metric value compared to that of other sink nodes and 0, otherwise, s i F S N t ,   s S t ,   k F S N t { s i } ,   and   t T .
c y 1 if the neighbor node y has relaying delay less than or equal to the desired delay and 0, otherwise, y C N E N x ,   C N E N x V .
o y 1 the sink node can be reached by neighbor node y and 0, otherwise, y F N E N x ,   F N E N x C N E N x ,   C N E N x V .
d e y 1 if the neighbor node y has the minimum relaying delay value compared to that of other neighbor nodes and 0, otherwise, y F N E N x ,   F N E N x C N E N x ,   C N E N x V .
a l 1 if the difference between the relaying delay value of neighbor nodes l and y is less than zero and 0, otherwise, y F N E N x ,   l F N E N x { y } ,   F N E N x V .
e y 1 if neighbour node y has maximum energy load function value compared to that of other neighbor nodes, 0 otherwise., y F N E N x ,   F N E N x C N E N x ,   C N E N x V .
b υ 1 if the difference between nodes y and v’s energy load function values is less than zero, 0 otherwise, y F N E N x ,   υ F N E N x { y } ,   F N E N x V .
v n 1 if the difference between neighbour nodes y and n’s environmental metric values is smaller than zero; 0 otherwise, y F N E N x ,   n F N E N x { y } ,   F N E N x V .
N y 1 if the neighbor node y has the maximum environmental metric value compared to that of other neighbor nodes and 0, otherwise, y F N E N x ,   F N E N x C N E N x ,   C N E N x V .
Disclaimer/Publisher’s Note: The statements, opinions and data contained in all publications are solely those of the individual author(s) and contributor(s) and not of MDPI and/or the editor(s). MDPI and/or the editor(s) disclaim responsibility for any injury to people or property resulting from any ideas, methods, instructions or products referred to in the content.