Article

Numerical Identification of Material Model Parameters of UHPFRC Slab under Blast Loading

Faculty of Military Technology, University of Defence in Brno, Kounicova 65, 602 00 Brno, Czech Republic
*
Author to whom correspondence should be addressed.
Appl. Sci. 2023, 13(1), 70; https://doi.org/10.3390/app13010070
Submission received: 1 November 2022 / Revised: 15 December 2022 / Accepted: 16 December 2022 / Published: 21 December 2022

Abstract

:
The reliability of numerical simulations of the structural response of nonhomogeneous materials to high velocity loadings is highly dependent on the used material model and parameters. For nonhomogeneous materials, such as fibres, reinforced concrete is widely used for the Winfrith model, but the question of appropriate material parameters for Ultra-High Performance Fibre Reinforcement Concrete (UHPFRC) under high velocity loadings is still open. The article deals with possible method of inverse identification of material parameters of a UHPFRC slab under blast loading for a Winfrith material model. Possible application is in the field of numerical simulation of protective or critical infrastructure response to blast loading. Experimental measurement of the time–deflection curve through laser scanning using the triangulation method gave us input data for an inverse identification phase conducted in Optislang software. Obtained material parameters from a given range are optimized for blast loading and their Pearson’s correlation coefficient provides us information about their significance for simulation.

1. Introduction and Review

New materials, such as Ultra-High Performance Concrete (UHPC), allow us to design new protective structures that can mitigate the impact of a blast [1,2,3]. By appropriately changing the production technology and individual components of concrete as a composite material, its physical, mechanical and other properties can be substantially changed [4,5,6,7].
The need to describe the behaviour of the material under a more complex way of loading [8], such as blast loading using numerical analysis, requires identification of the values of a greater number of material parameters. Identification of these parameters requires the usage of demanding numerical optimization methods. The existence and use of many material models and approaches in blast assessment [9,10], as described in this chapter, also indicates that finding a suitable model or the necessary input parameters, which could provide general solutions, is still an open task. A state of the art numerical modelling of concrete material response under dynamic loading, together with experimental measurements of concrete composites, is introduced in next lines.
The blast effects and behaviour of the concrete specimens and structures under blast loading using the Winfrith material model are introduced in [11,12,13,14,15,16]. Maazoun et al. [11] conclude that using Winfrith material model has good numerical prediction capabilities. A major conclusion from the numerical investigation in [12] relates to the fact of tensile strength of the reinforced concrete being the main factor of the ability of the concrete to resist the blast loading. The results of the campaign in [13] indicate that externally bonded polymer reinforcement causes lower mid span deflection and limits the damage levels to the slabs. Duc-kien and Seung-Eock [14] sum up that slender columns demonstrate both local and global damage, while more bulky columns demonstrate local damage only. Duc-Kien et al. [15] employ Multivariate Linear Regression (MLR) and Multilayer Perceptron for Regression (MLP-R) to generate the fitting models. Jayasinghe et al. [16] investigate the behaviour of a reinforced concrete pile under the buried explosion loading in saturated sand with its pores fully filled with water.
The numerical modelling of the penetration and behaviour of the concrete specimens and structures under this type of loading using the Winfrith material model is investigated in subsequent papers [17,18,19]. The results of the numerical modelling and the damage to the aircraft engine are compared in [17], with the conclusion of a high degree of their correlation. Duc-Kien et al. [18] study the panels with different reinforcing rebar topology and the causes of their penetration resistance. The paper [19] presents experimental penetration tests, corresponding numerical simulations and discussion of the current codes used for missile impact modelling. Winfrith material model is also used for modelling dynamic beaviour of the ressponce structures under seismic loading as shown in [20]. Results in this paper indicate, that the dynamic response of the sctructural elements subjected to seismic loading can be modelled using Winfrith model with sufficient accuracy.
Due to increased accessibility and usage of fibre reinforced concrete, this class of concrete is being extensively tested with blast loading and numerically modelled, as shown in [21,22,23,24,25,26,27,28,29,30]. Jong et al. [21] concludes that a strong holding matrix and the synergetic effect of combined fibres poses sufficient protection capabilities against detonation. The model using 117 experimental and 300 synthetic datasets achieved a favourable predictive performance for blast loaded reinforced concrete elements [22]. The prediction capabilities of the simple dynamic material model as shown in the paper [23] can be considered reliable and has sufficient accuracy for the damage of RC slabs under close explosive loading. Lei Mao et al. [24] provide the results of LS-Dyna simulation, showing that the modelling capabilities of the failure aspect correspond well with the experimental testing but show insufficient damage modelling accuracy. Based on the displacement of the UHPFRC slabs, the paper [25] concludes that damage prediction can be improved by modelling the fibre explicitly. The results of the paper [26], conducting validation with ABAQUS/Explicit and with experimental data, indicate the four times higher impulse resistance of the UHPFRC specimens compared to the normal concrete ones. Zhenhuan Xu et al. [27] studied the blast resistance of the UHPC specimens after exposure to elevated temperatures as one of impact effects. Nabodyuti and Nanthagopalan [28] reviewed state-of-the-art UHPC resistance against blast and impact from several aspects, e.g., fibre influence, dynamic characterization or impact and penetration. Numerical three-invariant model (KCC model) parameter calibration and parameter generation methods are proposed in [29] for predicting the response of concrete elements to shock loading. Luccioni et al. [30] studied, both experimentally and numerically, the effects of volume, topology and shape of fibres in HSC matrix specimens’ behaviour under blast loading. The results in [30] indicate the significant increase in blast resistance in the form of reduced cracks, spalling and deflection of the concrete specimens with steel fibres.
The effects of blast and penetration as prevailing sources of material and structural damage to the elements of protective structures and infrastructure are investigated in [31,32,33,34,35,36,37,38,39,40,41,42,43,44,45,46]. Concrete structural elements are experimentally tested to the dynamic loading and subsequently modelled using a variety of material models implemented into the software environment of hydrocodes. Both during the testing and modelling, a large volume of datasets is obtained and further analysed. In [31,32], the deflection was selected as a parameter that is used to assess the behaviour of concrete elements under blast load while considering scaling as a factor influencing the results [31,33]. Among other parameters that are frequently examined because they alter the behaviour of concrete specimens is the thickness of panels [34]. Another factor that is closely observed is the spalling [35], especially when using RC for protective structures, as the spalls could have a negative secondary impact on the sheltered personnel. Concrete as a composite material offers almost endless possibilities in adding different components into the concrete mixture and thus influencing its properties. In [36], the polyurea is added to increase blast resistance of the specimens. During the modelling phase, the focus is on the different parameters to make the process more reliable and accurate [37,38]. Large attention is dedicated to the material models themselves with the aim of improving their material properties and structural behaviour under blast loading [39,40,41]. The comparison of material models and their behaviour using the program ABAQUS/Explicit and the hydrocode AUTODYN is investigated in [42]. Jianguo Ning et al. [43] are focused on the simulation of the fragment creation of concrete slabs and their comparison with data from experiments. Anas et al. [44] extensively review the field of transient dynamics of concrete under blast load from several point of views, whilst the paper [45] closely investigates parameters such as thickness of the specimen and weight of the charge. In this paper, the Winfrith concrete material model is employed, but other models are also used and tested [46] to achieve the highest possible level of accuracy in the numerical simulation to precisely predict the behaviour of the concrete elements under blast load.
As the aim of this work is the numerical calibration of the concrete material model according to the experimental results of blast loading of the Ultra-High Performance Fibre Reinforced Concrete (UHPFRC) slab, the state-of-the-art review of research dealing with experimental and numerical assessments of the concrete structural elements under blast loading using constitutive concrete material models implemented into the software environment LS-Dyna [38,39], has shown the necessity of carrying out material testing of used concrete composite [44,45,46,47,48,49,50,51,52,53,54], the experimental measurements of response of the specimen under blast loading [29,31,40] and the connection of the material model parameters obtained from the inverse identification with the creation of the computational model [27,40,45]. Results presented in this paper, together with work of the authors, aim to enable and improve the assessment of the response of blast loaded structures and structural elements used for building protective [33] and UHPFRC structures of critical infrastructure, as well as other civilian and industrial objects that can be intentionally targeted [16].

2. Tested Specimens

The slabs and specimens for the basic mechanical test were made of UHPFRC (Ultra-High Performance Fibre Reinforced Concrete) with a 1% volume ratio of reinforcement with Dramix fibres and a 1% volume share of Fibrex fibres. The mechanical characteristics of Dramix OL fibres 13/.20 (Ø 0.2 mm, l = 13 mm) are as follows: tensile strength of 2750 MPa and Young’s modulus of 200 GPa, while for Fibrex A1 fibres (0.4 × 0.6 × 25 mm) the tensile strength reaches 350 MPa and Young’s modulus value is 200 GPa.
Six test slabs with dimensions of 500 mm × 500 mm × 60 mm were manufactured and treated in accordance with EN 12390-1,2 [47,48]. These slabs were used to perform the main experiment described in Chapter 3.
Six test cubes of concrete with dimensions of 150 mm × 150 mm × 150 mm were used to verify the compressive strength of the concrete meeting the EN 12390-3 standard [49]. To determine the increase in concrete strength, a compression strength test was performed on samples at 1, 3, 7 and 28 days old.
The results of the cube strength tests are presented in Table 1 and Table 2. The average value of the cube strength of 28-day-old concrete reaches 149 MPa. This value corresponds with the value of cubic strength of similar composition and grade concrete manufactured and used in previous authors’ work [50].
To determine the tensile strength of concrete from the three-point bending test according to the standard EN 12390-5 [51], 12 beams with dimensions of 100 mm × 100 mm × 400 mm were produced and treated in accordance with standard EN 12390-1 [47].
Table 3 shows the results of the bending test with the resulting average value of tensile strength 8.85 Mpa calculated from the measured values according to the relation [51]:
f c = F · l d 1 · d 2 2  
where f c (Mpa) is tensile strength, F (N) is the maximum load, l (mm) is the distance between the support rollers and d1 (mm) and d2 (mm) are the dimensions of the cross section of the body.
In Figure 1 it is possible to see three-point bending test results from samples T3.1–T3.3.

3. Experimental Measurement

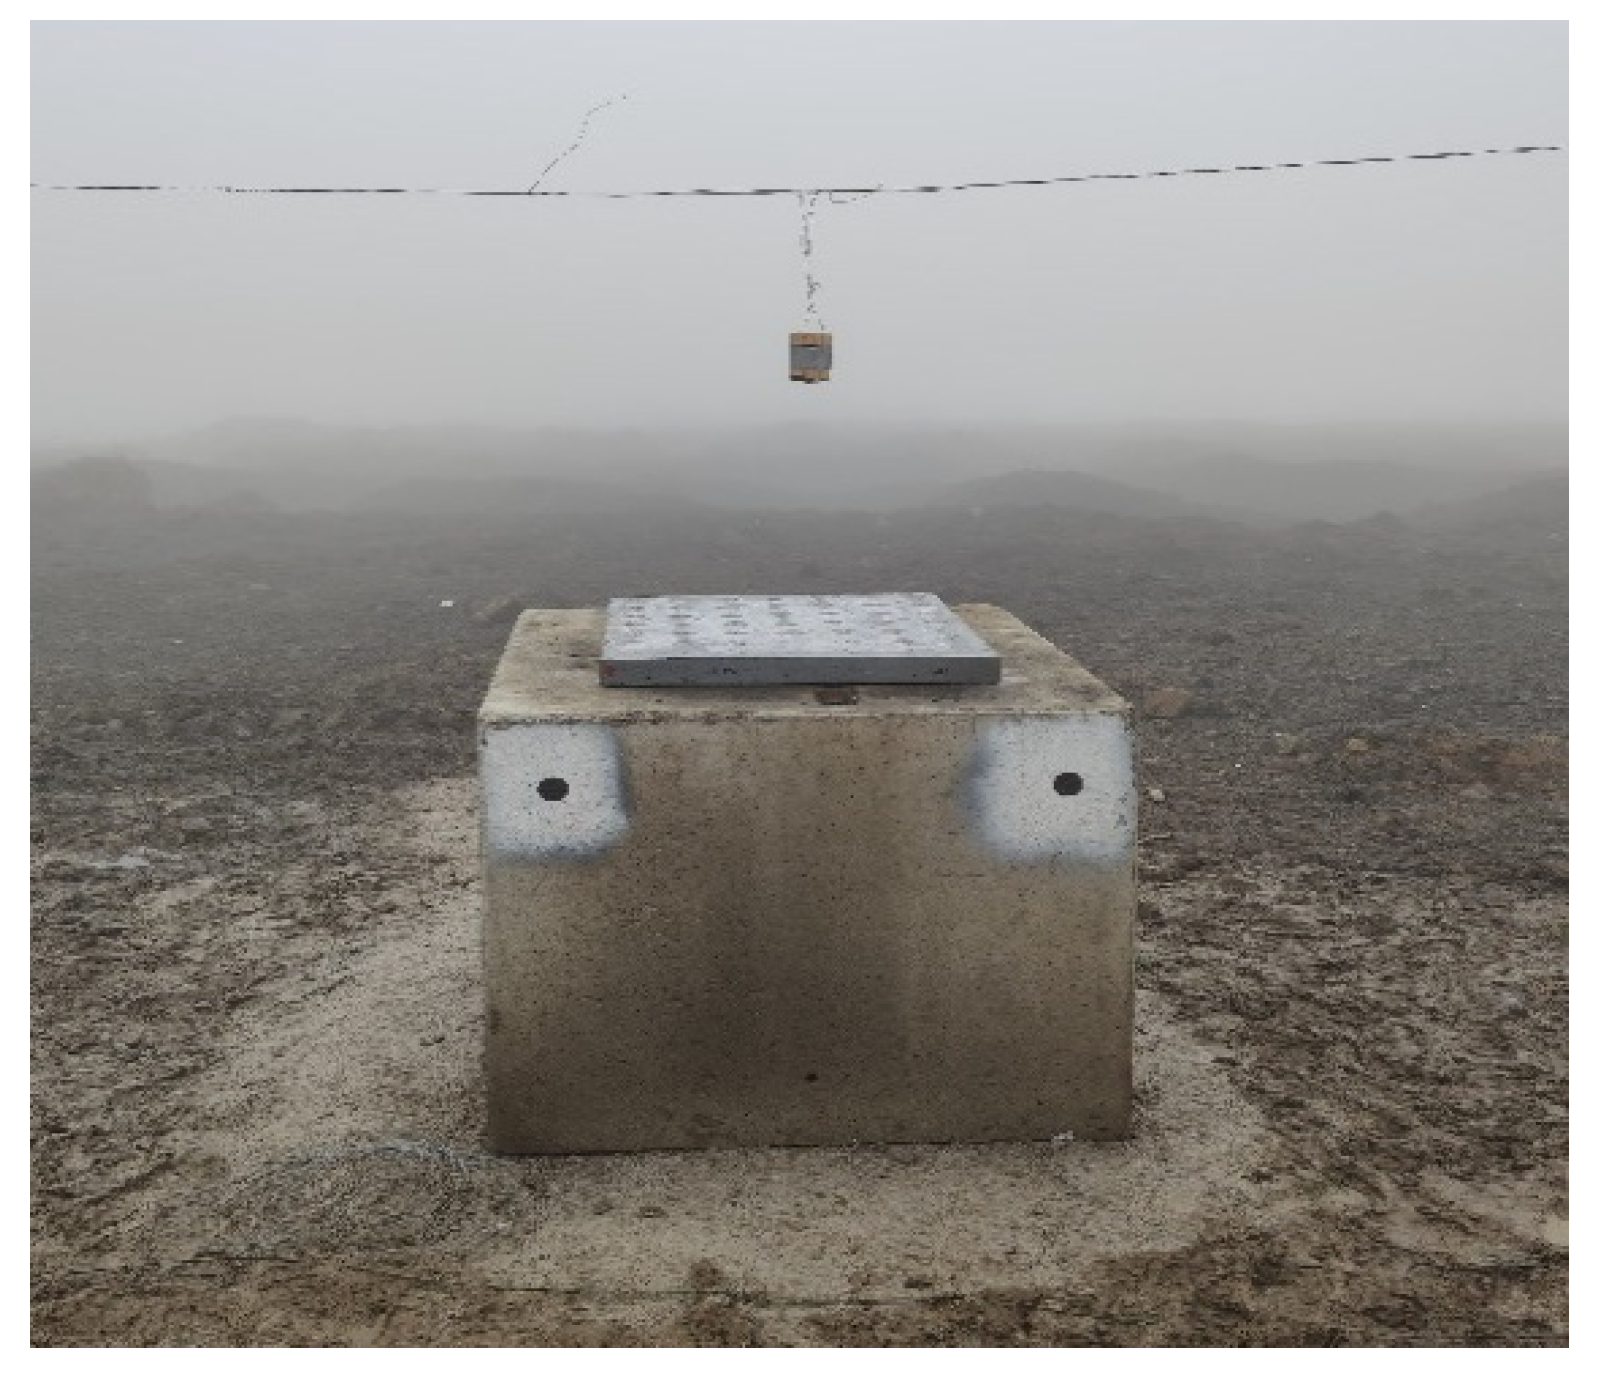
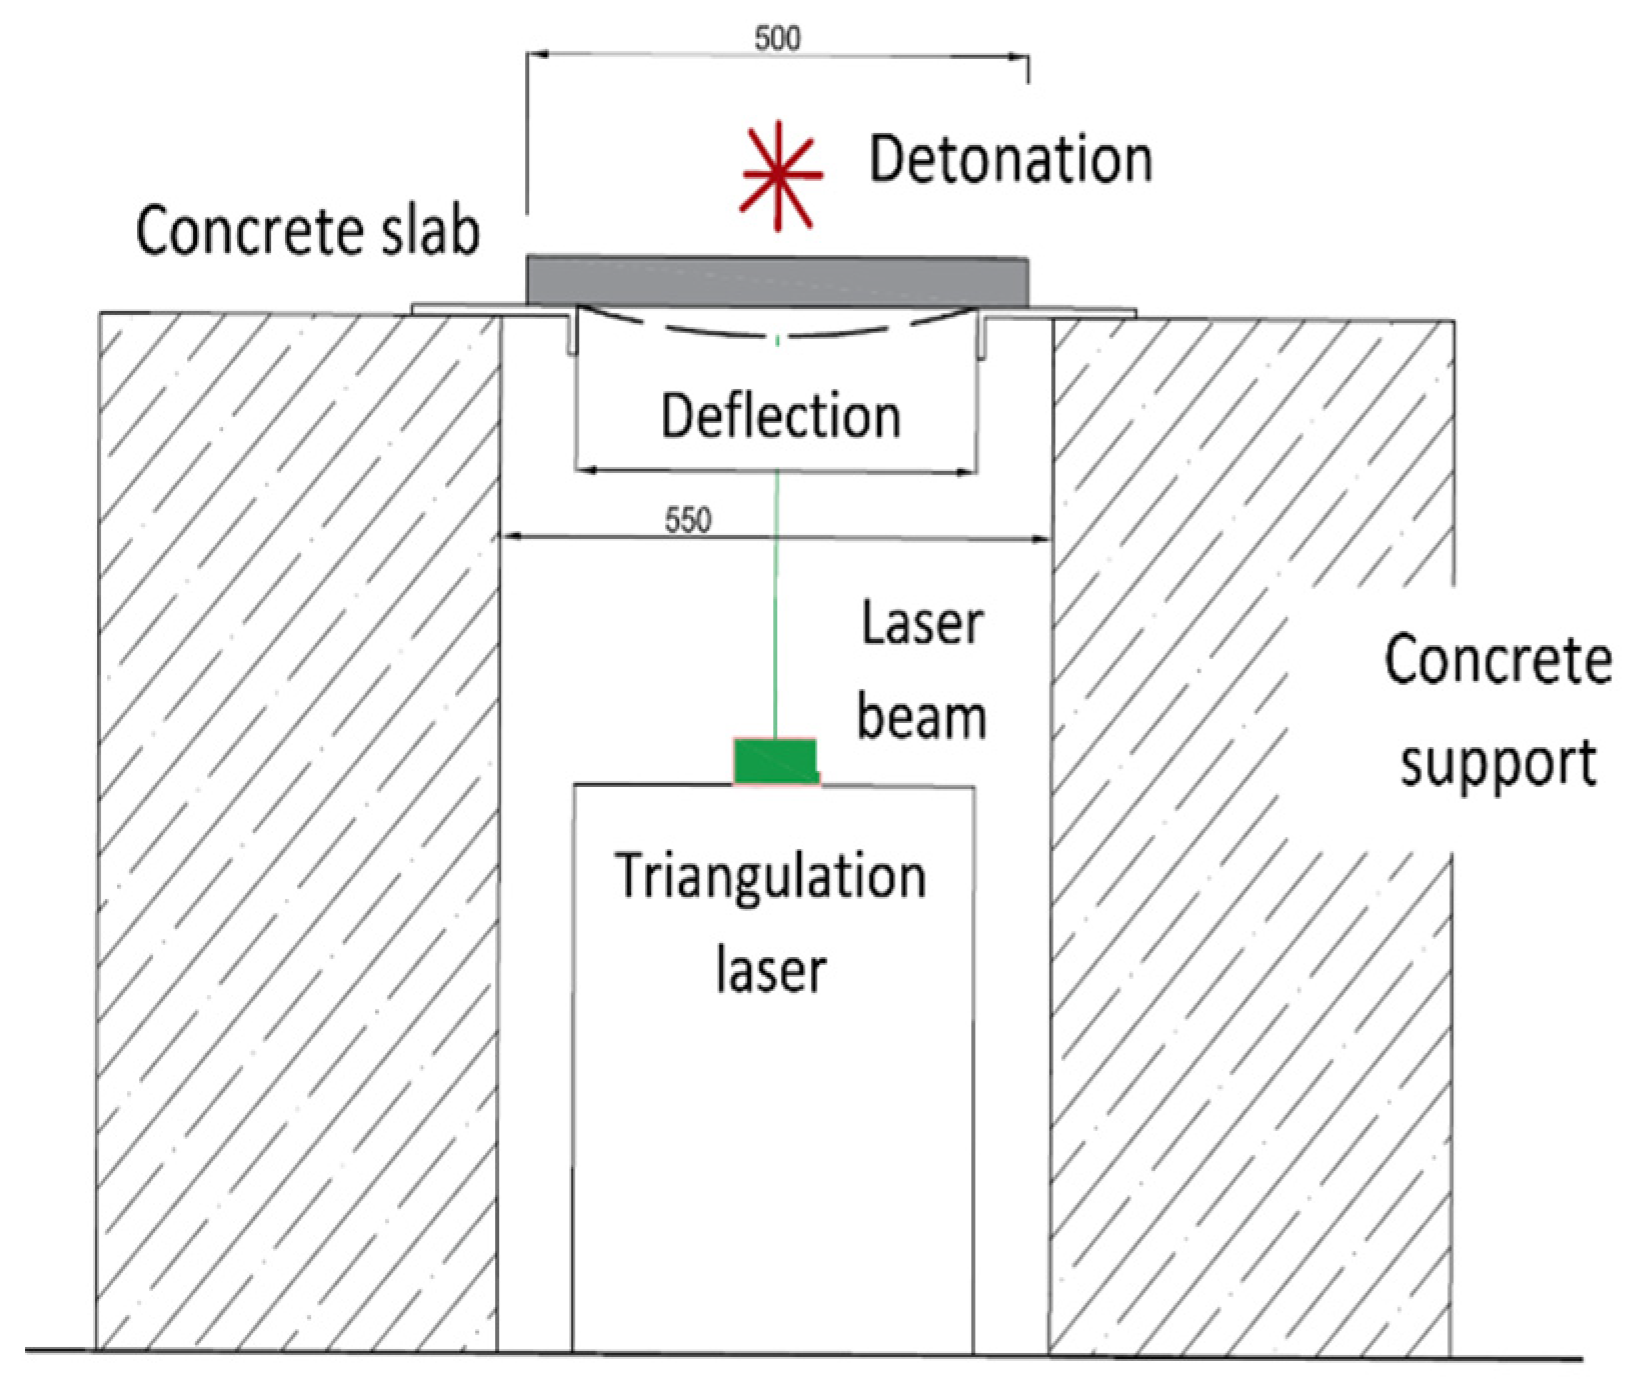
Experimental measurement was an essential part of solving the task. The outputs of experimental measurements served as a basis for which we tried to approximate the outputs of simulations and computational model. A reinforced concrete slab with dimensions of 500 mm × 500 mm × 60 mm was chosen as the tested design element, which, after being freely placed on a stand, was loaded with a shock wave generated by explosives (Figure 2 and Figure 3). The deflection of the plate caused by the loading of the blast wave after the initiation of the charge was recorded at the central point in the middle of the underside of the plate. For that, an optoNCDT 2300 sensor, measuring the distance on the principle of laser triangulation with a sampling frequency of 49 kHz, was used. Full detailed description of the experiment can be found in [52].
Due to significant resource demands of tests, six trial and error experiments were performed to find out the right mass of explosive and its standoff distance for conclusive maximal deflection of the specimen without penetration, crack, spalling or other effects indicating the damage of the specimen. In Table 4, the parametric setup together with the maximal deflection’s values can be seen.
For validation of the measured data, a review of similar experiments from the available papers was performed. As can be seen in Table 5, the deflection of 5.1 mm of a small concrete fibre reinforced slab from experiment no. 6 from this paper fit within the range of deflections as mentioned by other authors, especially the work [28], where slabs of similar dimensions and material were loaded with similar explosive mass and standoff distance. These results are supported with analytical assessment of the deflection presented in [53].
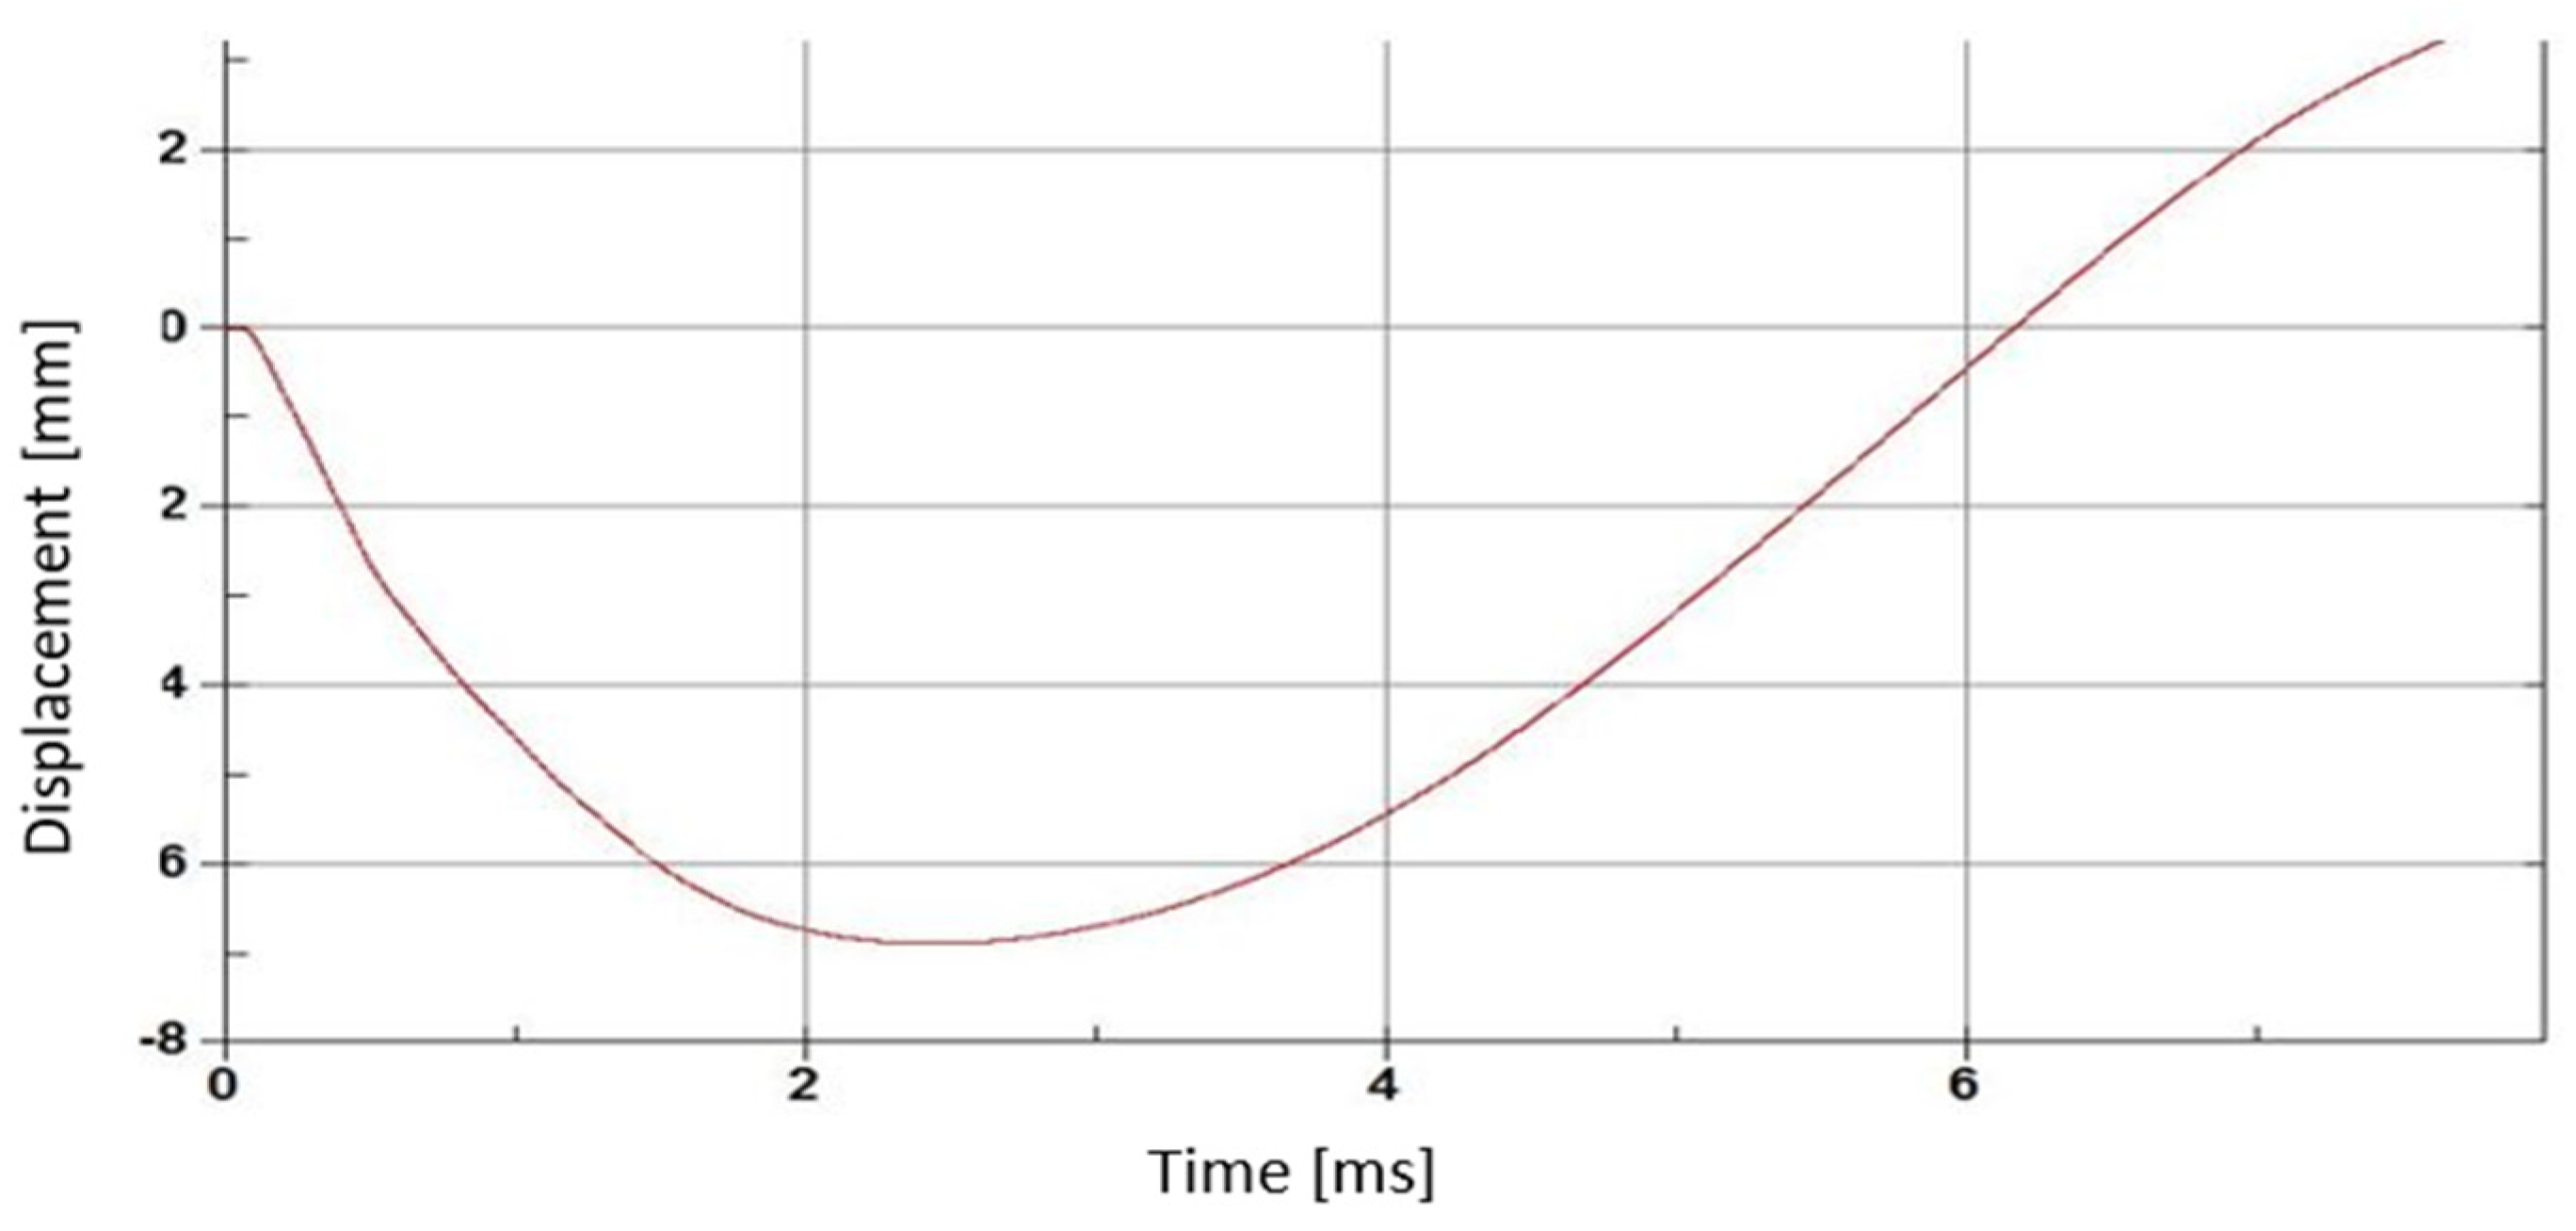
The measured value resulting from experimental measurement no. 6 (Table 4) consists of a time–deflection curve. This full curve, which was used due to its maximal deflection in the last chapter of this paper, the inverse identification phase of this paper, can be seen in Figure 4.

4. Material Model of Simulation

With the development of concrete and concrete composites, there was an effort to capture their response to loading through numerical simulations. An overview of material models of concrete implemented in the software environment of solvers based on the finite element method provides a broad basis for solving problems of fast dynamics. With the development of software, more complex models were gradually added to the material model libraries due to the inadequacy of the existing models, which were created as an initiative of academic circles or private companies solving very specific problems.
In terms of the number of implemented models suitable for concrete modelling, the LS-Dyna program environment stands out [54]. Due to the explicit integration scheme of the equation of motion used by the solver, LS-Dyna is a suitable software for simulating fast events, such as explosions, impacts or penetrations [55]. By extending it with an implicit solver, the software can also be used in combined tasks, where both static and dynamic loads occur [56]. The following pages provide an overview of the Winfrith material model used in the simulation and inverse identification in this paper. This model is suitable for solving tasks with a significant share of dynamic events, both for reasons of its complexity and range of parameters, as well as the ability to capture the loading method together with its low computational time demands due to its ability of smeared reinforced definition [57].
The Winfrith material model is a non-linear material model intended for modelling plain and reinforced concrete. The Winfrith concrete model is defined as a model of split cracks (pseudo cracks) and split reinforcement. The behaviour of concrete is described within the model through the Ottosen yield criterion, whose mathematical expression is as follows in Equations (2)–(4) (more can be found in [57,58,59]):
F ( I 1 , J 2 , c o s 3 θ ) = a J 2 ( f c ) 2 + λ J 2 f c + b I 1 f c 1 ,
where:
c o s 3 θ = 3 3 2 J 3 J 2 1.5 ,
and:
λ = k 1 c o s [ 1 3 c o s 1 ( k 2 c o s ( 3 θ ) ) ]   for   c o s 3 θ 0 ,
λ = k 1 c o s [ π 3 1 3 c o s 1 ( k 2 c o s ( 3 θ ) ) ]   for   c o s 3 θ 0 ,
while:
α 0 ;   λ 0 ;   k 1 0 ;   0 k 2 1 ,  
where I 1 is the first invariant of the stress tensor, J 2 is the second invariant of the deviatoric part of the stress tensor, J 3 is the third invariant of the deviatoric part of the stress tensor, θ is the angular coordinate, f c is the strength of concrete in uniaxial compression, f t is the strength of concrete in uniaxial tension, and the parameters α , b , k 1 and k 2 are functions of the ratio of concrete strength in uniaxial tension to the strength of concrete in uniaxial compression ( f t / f c ) and are determined from tests in uniaxial compression and tension and from tests in biaxial and triaxial compression.

5. Computational Model

The aim of this phase was to create a computational model and carry out a numerical simulation that in essence imitates experiment no. 6 (Table 4), i.e., the blast loading of the concrete slab by the charge of 225 g TNT at 200 mm from the test specimen of dimension 500 mm × 500 mm × 60 mm made from UHPFRC.
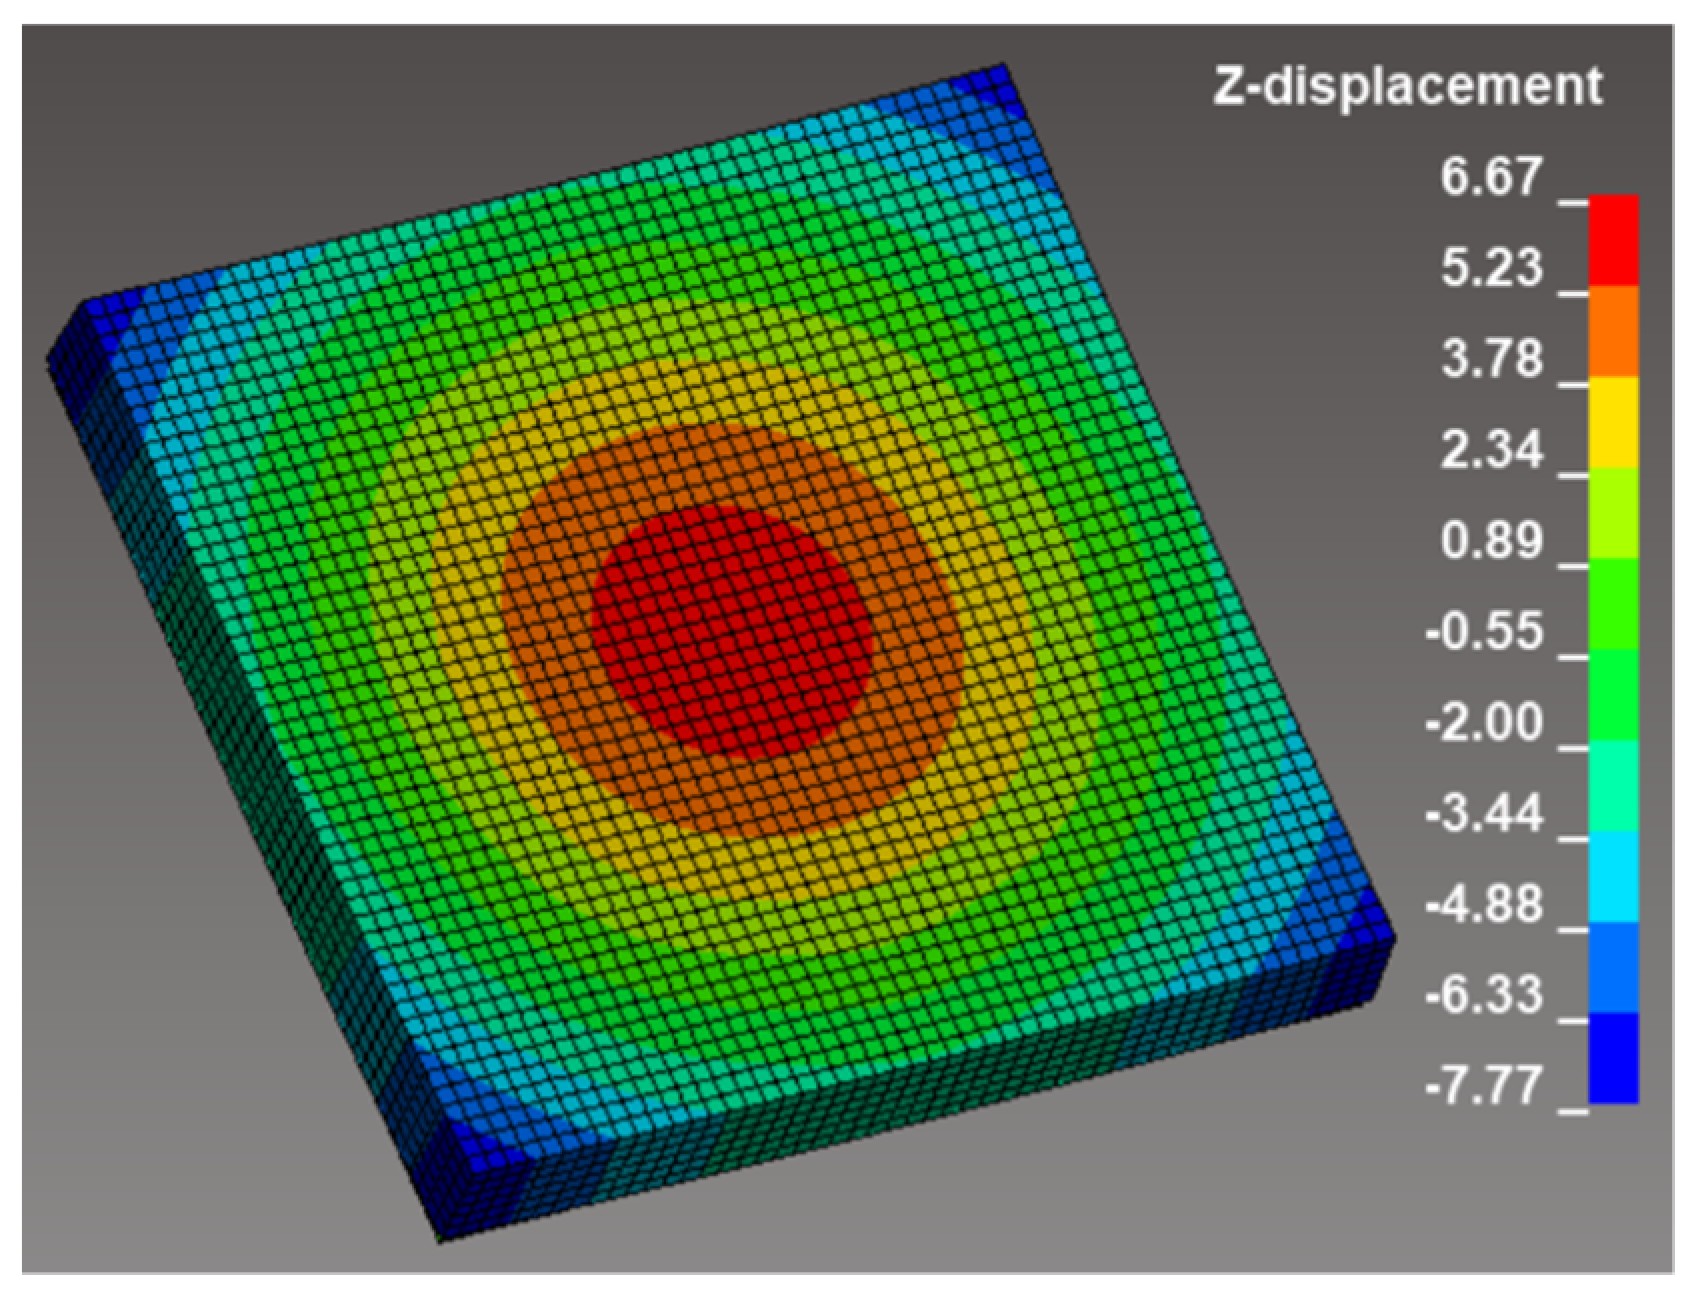
From the geometric model of the concrete slab, finite element mesh was created. For the discretization of the model, Lagrangian solid elements (eight node hexahedron solid elements with one integration point) of the 10 mm edge length with an aspect ratio of unity were used with the Winfrith constitutive material model assigned (Figure 5). The 2% fibre reinforcement volume ratio in the concrete was modelled using the smeared reinforcement method implemented into the used Winfrith concrete material model. The idealized discretized model of the test bed was created from 10 mm shell elements (Belytschko–Tsay one point integration shell element) without degrees of freedom with rigid material model assigned. To simplify the boundary conditions, it was assumed that the friction between the surfaces of the test plate is so great that it does not allow the plate to move in the horizontal direction during the pressure wave load, nor its rotation.
To simulate the explosion itself, the approach of explicit modelling of air and explosive was used using Multi Material ALE (Arbitrary Lagrange Eulerian, one integration point element) formulation of hexahedron 10 mm edge length elements, with an aspect ratio of unity with a second order advection scheme for material transport. This element formulation allows air and explosive materials to share the same elements as the air-filled domain to provide space into which explosive materials of higher density may be transported as the simulation progress. This formulation allows materials to flow through the ALE mesh, while material boundaries or interfaces do not coincide with the mesh lines and the material interfaces are internally reconstructed at each time step based on the volume fractions of the materials within the elements [56].
In the initialization phase, the entire ALE computational domain was filled with air. Air was defined with the null material model that allows linear polynomial equation of state (EOS) to be used without computing deviatoric stress. Setting the gamma law EOS and material model parameters according to Table 6 approximates air as an ideal gas at 0.101 MPa pressure [60]. More about this model, equations and used parameter values can be found in [61,62].
Where C4 and C5 are constants of linear polynomial EOS, E0 is initial internal energy per unit reference volume, V0 is initial relative volume and ρ is the density of the air.
After the calculation has started, defined ALE volume fraction was filled with the explosive. TNT explosive was defined with High Explosive Burn Material with the Jones–Wilkins–Lee equation of state (JWL EOS), where JWL EOS is describing relationships between relative volume, internal energy per volume and blast pressure of detonation products. Chemical energy released during the time interval is stored in these burnt products of the explosive and are assumed to behave as a homogeneous gas undergoing adiabatic thermodynamic process defined by JWL EOS. The High Explosive Burn Material model controls an explosive’s detonation behaviour. In this material type, burn fractions direct a chemical energy release during detonation, and explosive pressure in an element is obtained from the JWL EOS pressure by scaling it by this fraction. Table 7 show the parameters’ values as set in the simulation [62]. More about the theory, material model and EOS characteristics, corresponding equations and used parameter values can be found in [62,63,64].
Where A, B, R1, R2 and ω are constant parameters of the EOS related to the explosive material, E0 is detonation energy per unit volume, V0 is initial relative volume, ρ is mass density of TNT explosive, and D is its detonation velocity and Pcj Chapman–Jouguet pressure.
The coupling mechanism for modelling Fluid–Structure Interaction (FSI), i.e., interactions between a fixed structure representing a concrete slab defined by Lagrange type elements and ALE material represented by air and explosive was specified using the Constrain Lagrange in Solid card [55] with a penalty-based coupling algorithm employed allowing solid Lagrangian elements to be eroded due to material failure criteria. This coupling mechanism served to generate forces on a Lagrangian surface that resisted penetration of the ALE material through the Lagrangian part.
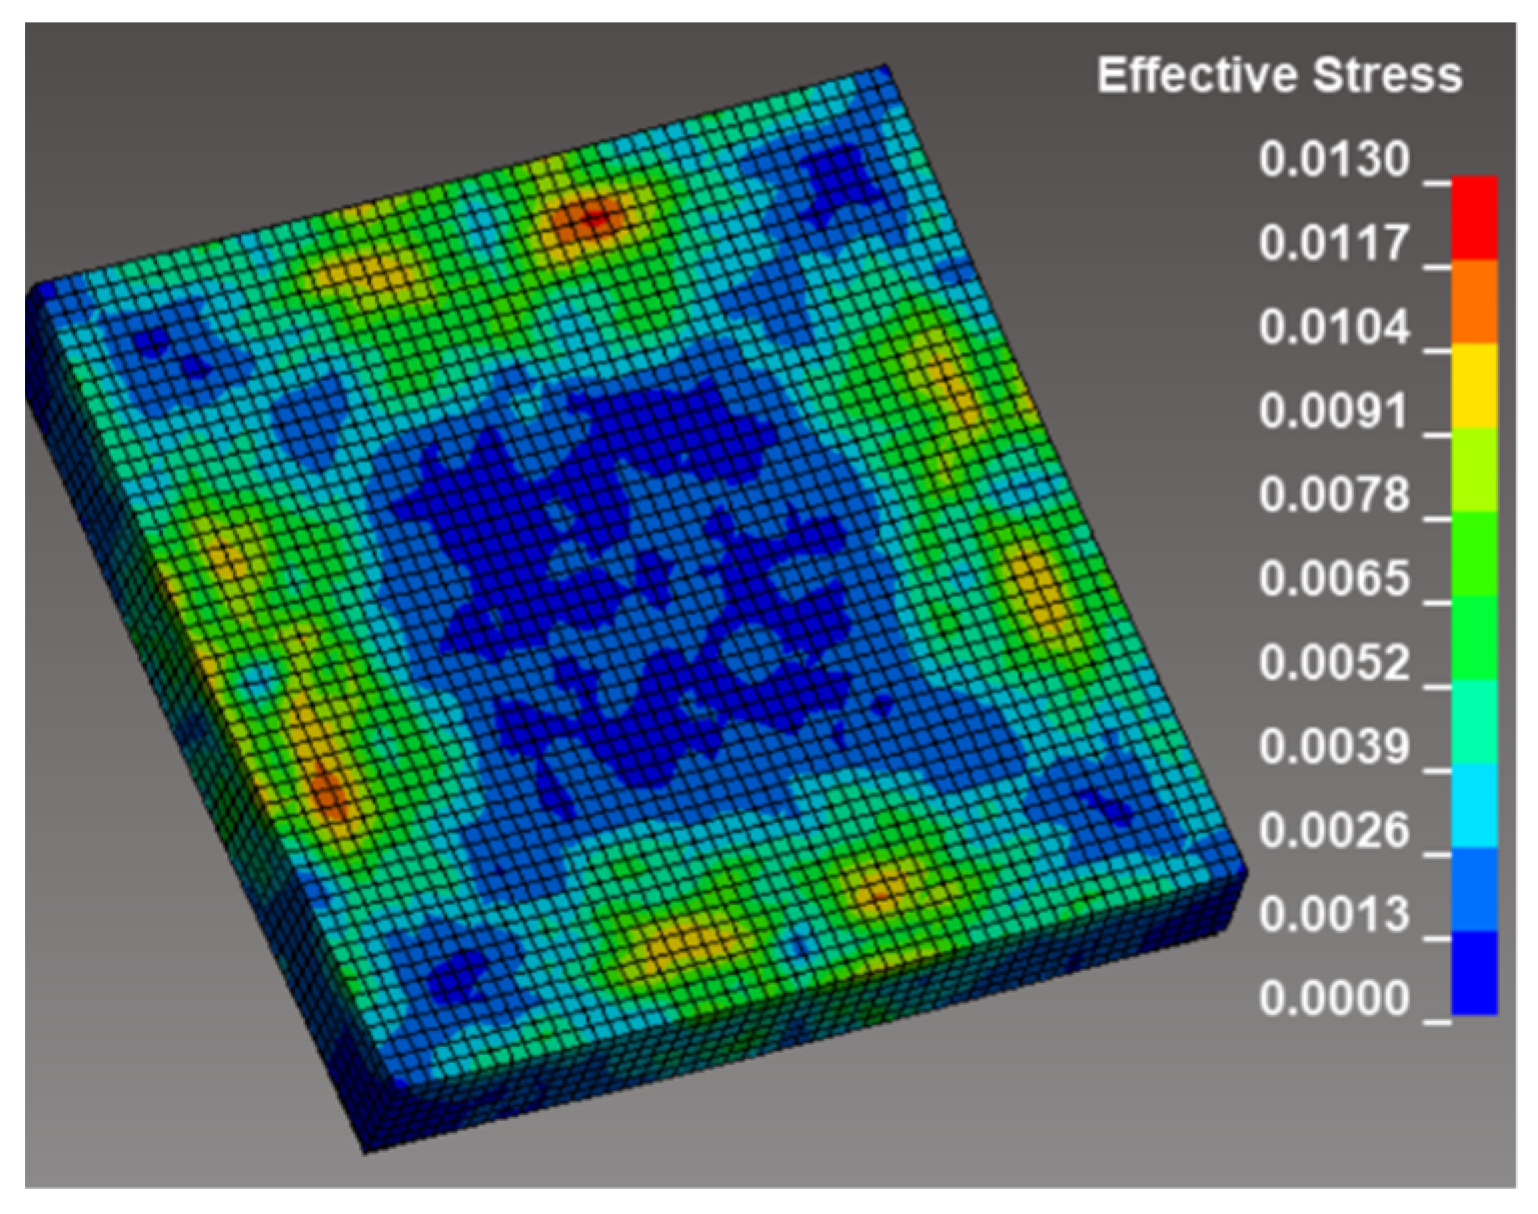
After the finish of the simulation in its 8 ms time instance, the time–deflection curve and its maximum value was created as a result of the simulation (Figure 5, Figure 6 and Figure 7). The computational model can be also found more closely described in [52,65].
The output of the simulation is shown in Figure 7 in the form of the time–deflection curve of the slab measured in its centre surface point, which was subsequently used in the next inverse optimization phase. In Table 8 an initial vector of parameters’ values used for creation and verification of the computational model can be seen. Constant parameters, i.e., the parameters of which values were not changing during the whole optimisation process were represented by the concrete density ρ = 2550 kg.m−3 and the material characteristics of the steel fibre reinforcement, i.e., the values of Young’s modulus and tensile strength for each fibre type as mentioned in Chapter 2.

6. Inverse Identification

A one-step inverse identification method was used to find the values of concrete material parameters for use in simulations of fast dynamic events. The design vector of the Winfrith concrete material model in the LS-Dyna software environment, which is composed of six input parameters, can be written in the form:
X = { E , η , f c , f t , G f , s i z e } ,
where X is the design vector, E (GPa) is the tangent modulus, η (-) is Poisson’s number, fc (GPa) is the compressive strength, ft (GPa) is the tensile strength, Gf (kN/mm) is the fracture energy and size (mm) is the aggregate size.
These parameters enter the simulation as variables, the other parameters of the material model were entered as constants, i.e., the density of the concrete and Young’s modulus and yield strength of the fibre reinforcement (Chapter 5). Based on this, the values of the deflections obtained by simulation (Figure 7) at time instants can be written as a function of the design vector:
y i s = f { X } ,
where y i s (mm) is the value of plate deflection over time.
The goal of inverse parameter identification can subsequently be defined as minimizing the value of the objective function. The objective function is defined as the square root of the mean of the squares of the deviations of the deflection values obtained experimentally and by means of simulation, i.e.,:
O = i = 1 n ( y i s y i e ) 2 n ,
where O (mm) is the objective function and y i s (mm) and y i e (mm) are the deflection values obtained by simulation, respectively, by the experiment at the same time points and n is the number of values.
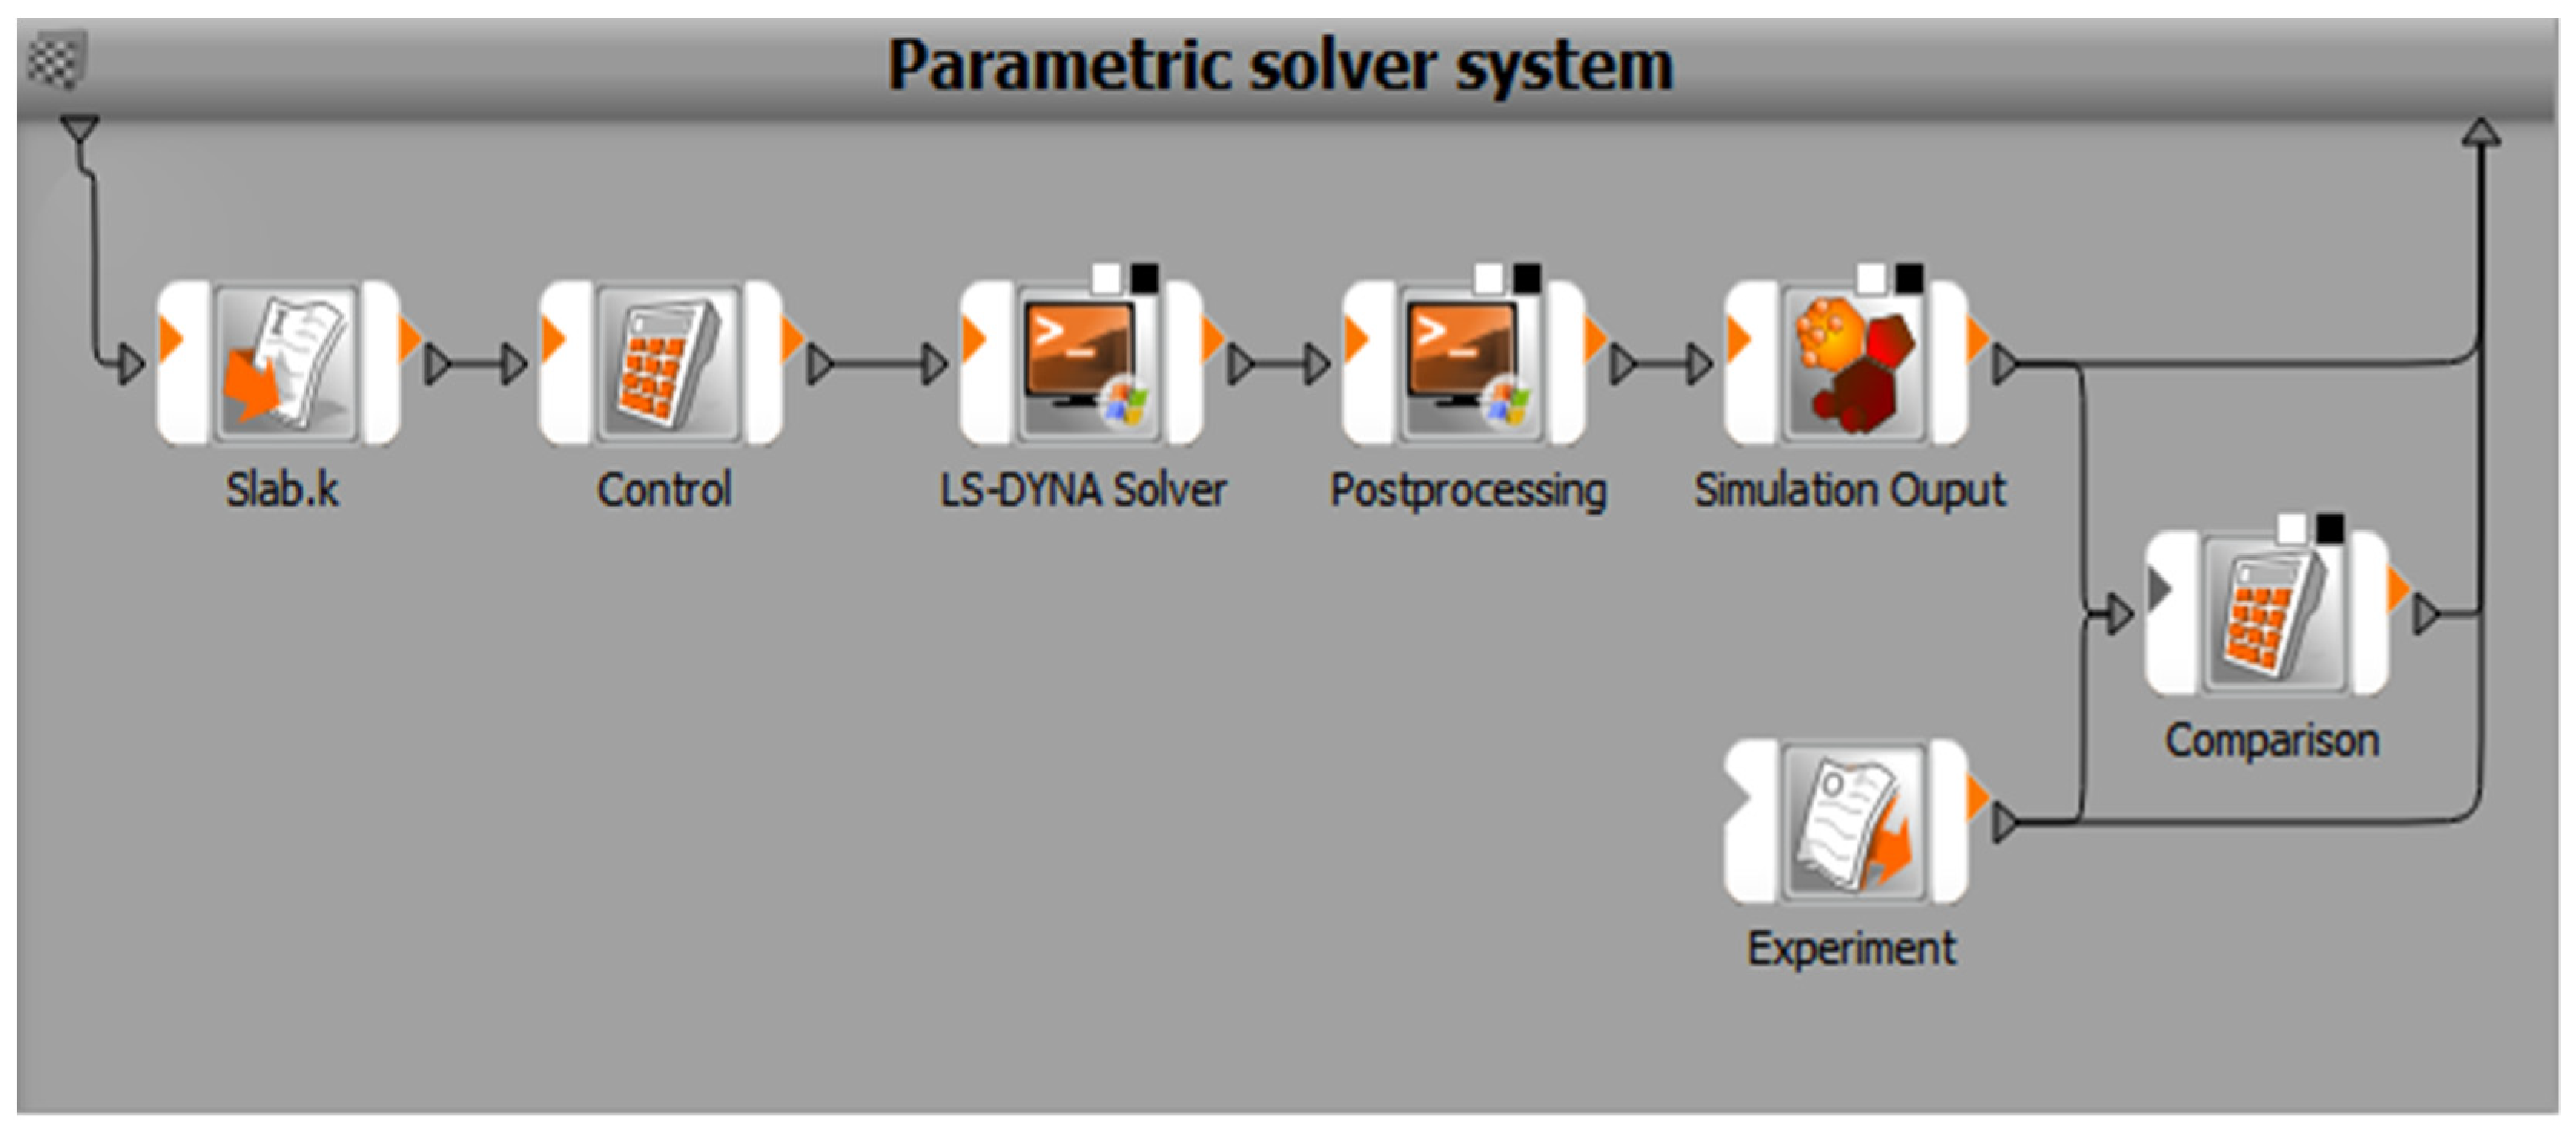
An optimization chain for sensitivity analysis was created for this purpose in the Optislang program environment (Figure 8, more in depth theory and design of optimisation process can be found in [66]). In this chain, a set of vectors of input parameters of the material model were generated using the Advanced Latin Hypercube stochastic (ALH) method [67].
The first component named “Slab.k” is used to enter the input parameters that were to be optimized. From the text input file of the LS-Dyna solver, the position and values of six of these input parameters of the concrete material model were found: modulus of elasticity, Poisson’s number, tensile and compressive strength, fracture energy and aggregate fraction size.
Their ranges were set in the main menu, as shown in Table 9, based on which 800 design vectors were generated using the ALH stochastic method, covering the entire design space of input parameters [67].
In the “LS-Dyna Solver” component itself, a simulation was run sequentially for these 800 different design parameter vectors.
Using the “Simulation Output” component, the resulting deflection curve was obtained. Subsequently, in the “Comparison” component, the value of the objective function O was calculated according to Equation (9) from two input files, the reference curve, obtained by the experiment and from the output file from simulation for each design vector (Figure 9).
Table 10 shows the parameter values of the three design vectors with the lowest objective function obtained by sensitivity analysis from 800 design vectors, as well as the value of the objective function O. The parameter values of design vector No. 337 (aggregate size, fracture energy, Poisson’s number, modulus of elasticity, compressive strength, tensile strength) therefore represent a good candidate for use in simulations of fast dynamic events using the Winfrith concrete material model in the LS-Dyna software environment.
Results of the sensitivity analysis representing the degree of response of the output parameter to the input parameters can be quantified using the Pearson’s correlation coefficient [68,69]. This coefficient for population represents the standardized covariance between two random variables, while when applied to a sample is defined as:
r x y   i = 1 n ( x i x ¯ ) ( y i y ¯ ) i = 1 n ( x i x ¯ ) 2 i = 1 n ( y i y ¯ ) 2
where r x y is Pearson’s correlation coefficient for the sample, n is sample size, x i , y i are the individual sample points indexed with i and x ¯ = 1 n i = 1 n ( x i ) is the sample mean (analogously for y ).
The resulting values of Pearson’s correlation coefficient r x y shown in Table 11 show a high, medium and low degree of dependence of the output parameter–objective function O on three input parameters’ fracture energy, tensile strength and tangent modulus, respectively [68,69]. These values of correlation coefficients r x y indicate [67,70] that these parameters are closely related to the physical essence of the investigated problem, i.e., bending of the body as a result of loading shock wave.
Where r x y   < s i z e , O > is Pearson’s correlation coefficient for aggregate size and Objective function O (analogously for fracture energy Gf, Poisson’s number η , tangent modulus E, compressive strength fc and tensile strength ft).
On the other hand, parameters, such as aggregate size, Poisson’s ratio and compressive strength, affect the deflection to a lesser extent and their values can be chosen as constants in the future when solving optimization problems of a similar nature due to the reduction of the computing time demands.

7. Conclusions

Usability of work can be divided into two parts. The first is the measurement method itself. With the use of a laser triangulation sensor, it is possible to measure the change in the positional and shape characteristics of the elements loaded by the explosion with great accuracy and without affecting the experiment by the measuring device. In the experiments, it is also necessary to capture the complex behaviour of the material under the assumed design conditions as best as possible, which is fulfilled in the proposed experiment, since the deflection of the reinforced concrete slab is a measurement of the dynamic deflection caused by an impulse load.
The second part of the work focuses on obtaining material characteristics and parameter values of material models for numerical simulations. In contrast to static mechanical tests, it is possible to obtain information about parameters from the obtained data in the form of time deflection, which are manifested only under specific conditions and method of loading. By inverse parameter identification, essential parameters can be selected, and their values can then be determined using optimization methods. In this way, material model parameters can be used in further simulations, where the conditions and method of loading correspond to the conditions of their identification.
The use of the output parameter values obtained in this way intended for usage in simulations of a larger scale will be carried out before the experiment itself to assess the initial design or will replace the experiment. Experiments carried out by the Department of Engineering Technologies can serve as an example, such as experiments assessing the resistance of various high-quality concretes and concrete composites, as well as the assessment of entire elements and assemblies with dimensions of order of several meters serve to name ones. Experiments to obtain material parameter values exclusively in these cases will not be possible to carry out or the complexity of the experimental measurements will focus on obtaining other characteristics of assessing other effects. The amount of explosive also often does not allow for the use of sensitive electronic devices and equipment for obtaining values of material parameters. Numerical simulations using appropriately chosen material models and using the methods described above to find the values of their parameters provide wide possibilities and certainty in predicting and designing the response of concrete structures to blast loads.

Author Contributions

Conceptualization, B.D. and P.M.; methodology, B.D. and J.Š.; software, B.D. and Z.H.; validation, P.M., J.Š. and E.Z.; formal analysis P.M. and B.D.; investigation, P.D. and B.D.; resources, P.D. and E.Z.; data curation, Z.H., J.Š., P.M., E.Z. and B.D.; writing—original draft preparation, B.D., E.Z., P.M. and J.Š.; writing—review and editing, E.Z., J.Š., P.M. and P.D.; visualization, B.D. and Z.H.; supervision, P.M.; project administration, B.D. All authors have read and agreed to the published version of the manuscript.

Funding

This research received no external funding.

Acknowledgments

The presented work has been prepared with the support of the Ministry of Defence of the Czech Republic, Partial Project for Institutional Development, AIRoPs-Conduct of airspace operations.

Conflicts of Interest

The authors declare no conflict of interest.

References

  1. Coughlin, A.M.; Musselman, E.S.; Schokker, A.J.; Linzell, D.G. Behavior of portable fiber reinforced concrete vehicle barriers subject to blasts from contact charges. Int. J. Impact Eng. 2010, 37, 521–529. [Google Scholar] [CrossRef]
  2. Drdlová, I.M.; Buchar, J.; Krátký, I.J.; Rídký, I.R. Blast resistance characteristics of concrete with different types of fibre reinforcement. Struct. Concr. 2015, 16, 508–517. [Google Scholar] [CrossRef]
  3. Ramadoss, P.; Nagaman, K. Impact, characteristics of high-performance steel fiber reinforced concrete under repeated dynamic loading. Int. J. Civ. Eng. 2014, 12, 513–520. [Google Scholar]
  4. Yazici, H.; Deniz, E.; Baradan, B. The effect of autoclave pressure, temperature and duration time on mechanical properties of reactive powder concrete. Construct. Build. Mater. 2013, 42, 53–63. [Google Scholar] [CrossRef]
  5. Verma, M.; Prem, P.R.; Rajasankar, J.; Bharatkumar, B.H. On low-energy impact response of ultra-high-performance concrete (UHPC) panels. Mater. Des. 2016, 92, 853–865. [Google Scholar] [CrossRef]
  6. Wu, Z.; Khayat, K.H.; Shi, C. How do fiber shape and matrix composition affect fiber pullout behavior and flexural properties of UHPC? Cem. Concr. Compos. 2018, 90, 193–201. [Google Scholar] [CrossRef] [Green Version]
  7. Liu, J.; Wu, C.; Su, Y.; Li, J.; Shao, R.; Chen, G.; Liu, Z. Experimental and numerical studies of ultra-high performance concrete targets against high-velocity projectile impacts. Eng. Struct. 2018, 173, 166–179. [Google Scholar] [CrossRef]
  8. Yang, S.; Kong, X.; Wu, H.; Fang, Q.; Xiang, H. Constitutive modelling of UHPCC material under impact and blast loadings. Int. J. Impact Eng. 2021, 153, 103860. [Google Scholar] [CrossRef]
  9. Castedo, R.; Segarra, P.; Alañon, A.; Lopez, L.; Santos, A.; Sanchidrian, J. Air blast resistance of full-scale slabs with different compositions: Numerical modeling and field validation. Int. J. Impact Eng. 2015, 86, 145–156. [Google Scholar] [CrossRef]
  10. Li, J.; Hao, H. Numerical study of concrete spall damage to blast loads. Int. J. Impact Eng. 2014, 68, 41–55. [Google Scholar] [CrossRef]
  11. Maazoun, A.; Matthys, S.; Atoui, O.; Belkassem, B.; Lecompte, D. Finite element modelling of RC slabs retrofitted with CFRP strips under blast loading. Eng. Struct. 2021, 252, 113597. [Google Scholar] [CrossRef]
  12. Morales-Alonso, G.; Cendón, D.A.; Galvez, F.; Erice, B.; Sánchez-Gálvez, V. Blast Response Analysis of Reinforced Concrete Slabs: Experimental Procedure and Numerical Simulation. J. Appl. Mech. 2011, 78, 051010. [Google Scholar] [CrossRef]
  13. Maazoun, A.; Matthys, S.; Belkassem, B.; Lecompte, D.; Vantomme, J. Blast response of retrofitted reinforced concrete hollow core slabs under a close distance explosion. Eng. Struct. 2019, 191, 447–459. [Google Scholar] [CrossRef]
  14. Thai, D.-K.; Kim, S.-E. Numerical investigation of the damage of RC members subjected to blast loading. Eng. Fail. Anal. 2018, 92, 350–367. [Google Scholar] [CrossRef]
  15. Thai, D.-K.; Nguyen, D.-L.; Pham, T.-H.; Doan, Q.H. Prediction of residual strength of FRC columns under blast loading using the FEM method and regression approach. Constr. Build. Mater. 2021, 276, 122253. [Google Scholar] [CrossRef]
  16. Jayasinghe, L.; Thambiratnam, D.; Perera, N.; Jayasooriya, J. Blast response of reinforced concrete pile using fully coupled computer simulation techniques. Comput. Struct. 2014, 135, 40–49. [Google Scholar] [CrossRef]
  17. Sadiq, M.; Yun, Z.X.; Rong, P. Simulation analysis of impact tests of steel plate reinforced concrete and reinforced concrete slabs against aircraft impact and its validation with experimental results. Nucl. Eng. Des. 2014, 273, 653–667. [Google Scholar] [CrossRef]
  18. Thai, D.-K.; Nguyen, D.-L.; Kim, S.-E. Numerical investigation on local damage of proposed RC panels under impact loading. Nucl. Eng. Des. 2019, 341, 377–389. [Google Scholar] [CrossRef]
  19. Orbovic, N.; Sagals, G.; Blahoianu, A. Influence of transverse reinforcement on perforation resistance of reinforced concrete slabs under hard missile impact. Nucl. Eng. Des. 2015, 295, 716–729. [Google Scholar] [CrossRef]
  20. Domizio, M.; Ambrosini, D.; Curadelli, O. Nonlinear dynamic numerical analysis of a RC frame subjected to seismic loading. Eng. Struct. 2017, 138, 410–424. [Google Scholar] [CrossRef]
  21. Jong, K.; Jaehyeon, L.; Jung, J.W.; Dongyeop, H. Testing the anti-explosion protection of HPFRCC for ready-mixed concrete system based on fiber selection and resistance to live explosives. Case Stud. Constr. Mater. 2022, 17. [Google Scholar] [CrossRef]
  22. Almustafa, M.K.; Nehdi, M.L. Machine learning prediction of structural response of steel fiber-reinforced concrete beams subjected to far-field blast loading. Cem. Concr. Compos. 2022, 126, 104378. [Google Scholar] [CrossRef]
  23. Zhou, X.; Kuznetsov, V.; Hao, H.; Waschl, J. Numerical prediction of concrete slab response to blast loading. Int. J. Impact Eng. 2008, 35, 1186–1200. [Google Scholar] [CrossRef]
  24. Mao, L.; Barnett, S.; Tyas, A.; Warren, J.; Schleyer, G.; Zaini, S. Response of small scale ultra high performance fibre reinforced concrete slabs to blast loading. Constr. Build. Mater. 2015, 93, 822–830. [Google Scholar] [CrossRef]
  25. Mao, L.; Barnett, S.; Begg, D.; Schleyer, G.; Wight, G. Numerical simulation of ultra high performance fibre reinforced concrete panel subjected to blast loading. Int. J. Impact Eng. 2014, 64, 91–100. [Google Scholar] [CrossRef] [Green Version]
  26. Astarlioglu, S.; Krauthammer, T. Response of normal-strength and ultra-high-performance fiber-reinforced concrete columns to idealized blast loads. Eng. Struct. 2014, 61, 1–12. [Google Scholar] [CrossRef]
  27. Xu, Z.; Li, J.; Qian, H.; Wu, C. Blast resistance of hybrid steel and polypropylene fibre reinforced ultra-high performance concrete after exposure to elevated temperatures. Compos. Struct. 2022, 294. [Google Scholar] [CrossRef]
  28. Das, N.; Nanthagopalan, P. State-of-the-art review on ultra high performance concrete—Ballistic and blast perspective. Cem. Concr. Compos. 2022, 127, 104383. [Google Scholar] [CrossRef]
  29. Su, Q.; Wu, H.; Fang, Q. Calibration of KCC model for UHPC under impact and blast loadings. Cem. Concr. Compos. 2022, 127. [Google Scholar] [CrossRef]
  30. Luccioni, B.; Isla, F.; Codina, R.; Ambrosini, D.; Zerbino, R.; Giaccio, G.; Torrijos, M. Experimental and numerical analysis of blast response of High Strength Fiber Reinforced Concrete slabs. Eng. Struct. 2018, 175, 113–122. [Google Scholar] [CrossRef] [Green Version]
  31. Zhang, D.; Yao, S.; Lu, F.; Chen, X.; Lin, G.; Wang, W.; Lin, Y. Experimental study on scaling of RC beams under close-in blast loading. Eng. Fail. Anal. 2013, 33, 497–504. [Google Scholar] [CrossRef]
  32. Wu, J.; Zhou, Y.; Zhang, R.; Liu, C.; Zhang, Z. Numerical simulation of reinforced concrete slab subjected to blast loading and the structural damage assessment. Eng. Fail. Anal. 2020, 118, 104926. [Google Scholar] [CrossRef]
  33. Wang, W.; Zhang, D.; Lu, F.; Wang, S.-C.; Tang, F. Experimental study on scaling the explosion resistance of a one-way square reinforced concrete slab under a close-in blast loading. Int. J. Impact Eng. 2012, 49, 158–164. [Google Scholar] [CrossRef]
  34. Shishegaran, A.; Khalili, M.R.; Karami, B.; Rabczuk, T.; Shishegaran, A. Computational predictions for estimating the maximum deflection of reinforced concrete panels subjected to the blast load. Int. J. Impact Eng. 2020, 139, 103527. [Google Scholar] [CrossRef]
  35. Tu, H.; Fung, T.C.; Tan, K.H.; Riedel, W. An analytical model to predict spalling and breaching of concrete plates under contact detonation. Int. J. Impact Eng. 2022, 160, 104075. [Google Scholar] [CrossRef]
  36. Wu, J.; Liu, Z.; Yu, J.; Xu, S. Experimental and numerical investigation of normal reinforced concrete panel strengthened with polyurea under near-field explosion. J. Build. Eng. 2022, 46, 103763. [Google Scholar] [CrossRef]
  37. Lu, Y.; Xu, K. Modelling of dynamic behaviour of concrete materials under blast loading. Int. J. Solids Struct. 2004, 41, 131–143. [Google Scholar] [CrossRef]
  38. Johnson, J.; Xu, M.; Jacques, E. Predicting the self-centering behavior of hybrid FRP-steel reinforced concrete beams under blast loading. Eng. Struct. 2021, 247, 113117. [Google Scholar] [CrossRef]
  39. Grisaro, H.Y. Effect of combined blast and fragmentation load on the dynamic response of reinforced concrete structures. Eng. Struct. 2021, 248, 113244. [Google Scholar] [CrossRef]
  40. Gomathi, K.A.; Rajagopal, A.; Prakash, S.S. Predicting the failure mechanism of RC slabs under combined blast and impact loading. Theor. Appl. Fract. Mech. 2022, 119. [Google Scholar] [CrossRef]
  41. Lee, M.; Kwak, H.-G. Numerical simulations of blast responses for SFRC slabs using an orthotropic model. Eng. Struct. 2021, 238, 112150. [Google Scholar] [CrossRef]
  42. Luccioni, B.M.; Luege, M. Concrete pavement slab under blast loads. Int. J. Impact Eng. 2006, 32, 1248–1266. [Google Scholar] [CrossRef]
  43. Ning, J.; Yang, S.; Ma, T.; Xu, X. Fragment behavior of concrete slab subjected to blast loading. Eng. Fail. Anal. 2022, 138. [Google Scholar] [CrossRef]
  44. Anas, S.; Alam, M.; Umair, M. Experimental and numerical investigations on performance of reinforced concrete slabs under explosive-induced air-blast loading: A state-of-the-art review. Structures 2021, 31, 428–461. [Google Scholar] [CrossRef]
  45. Zhao, C.; Ye, X.; He, K.; Gautam, A. Numerical study and theoretical analysis on blast resistance of fabricated concrete slab. J. Build. Eng. 2020, 32, 101760. [Google Scholar] [CrossRef]
  46. Kumar, V.; Kartik, K.; Iqbal, M. Experimental and numerical investigation of reinforced concrete slabs under blast loading. Eng. Struct. 2020, 206, 110125. [Google Scholar] [CrossRef]
  47. European Standard EN 12390-1; Testing Hardened Concrete—Part 1: Shape, Dimensions and Other Requirements for Specimens and Moulds. CEN: Brussels, Belgium, 2021.
  48. European Standard EN 12390-2; Testing Hardened Concrete—Part 2: Making and Curing Specimens for Strength Tests. CEN: Brussels, Belgium, 2019.
  49. European Standard EN 12390-3; Testing Hardened Concrete—Part 3: Compressive Strength of Test Specimens. CEN: Brussels, Belgium, 2019.
  50. Zezulová, E.; Hasilová, K.; Dvořák, P.; Dubec, B.; Komárková, T.; Štoller, J. Experimental Campaign to Verify the Suitability of Ultrasound Testing Method for Steel Fiber Reinforced Concrete Fortification Structures. Appl. Sci. 2021, 11, 8759. [Google Scholar] [CrossRef]
  51. European Standard EN 12390-5; Testing Hardened Concrete—Part 5: Flexural Strength of Test Specimens. CEN: Brussels, Belgium, 2019.
  52. Dubec, B.; Manas, P.; Stoller, J.; Stonis, P. Experimental and Numerical Assessment of Fibre Reinforced Concrete Slab under Blast Load. In Proceedings of the 2019 International Conference on Military Technologies (ICMT), Brno, Czech Republic, 30–31 May 2019. [Google Scholar] [CrossRef]
  53. Dubec, B.; Manas, P.; Stoller, J. Analytical approach in assessment of deflection of thick concrete plates. In Proceedings of the 2021 International Conference on Military Technologies (ICMT), Brno, Czech Republic, 8–11 June 2021; pp. 1–4. [Google Scholar] [CrossRef]
  54. Livermore Software Technology Corporation. LS-Dyna Keyword User’s Manual, Volume II, Material Models, 10/18/16 (r:7991); Livermore Software Technology Corporation: Livemore, CA, USA, 2015. [Google Scholar]
  55. Livermore Software Technology Corporation. LS-Dyna, Theory Manual; Livemore Software Technology Corporation: Livemore, CA, USA, 2015. [Google Scholar]
  56. Livermore Software Technology Corporation. LS-Dyna, Keyword User’s Manual, Volume I, 10/18/16 (r:7991); Livermore Software Technology Corporation: Livemore, CA, USA, 2014. [Google Scholar]
  57. Schwer, L. Modeling Rebar: The forgotten sister in reinforced concrete modeling. In Proceedings of the 13th-International-LS-Dyna-Conference, Wien, Austria, 8–10 June 2014. [Google Scholar]
  58. Kral, P.; Husek, M. Concrete in Uniaxial and Triaxial Compression—Experimental and Numerical Analysis in Interaction with Material Parameter Optimization. Conference paper. In Proceedings of the Juniorstav 2017, Brno, Czech Republic, 26 January 2017; pp. 1–6, ISBN 987-80-214-5462-0. [Google Scholar]
  59. Hokes, F.; Kral, P.; Krnavek, O.; Husek, M. Improved Sensitivity Analysis in the Inverse Identification of the Parameters of a Nonlinear Material Model. Procedia Eng. 2017, 172, 347–354. [Google Scholar] [CrossRef]
  60. Atoui, O.; Kechagiadakis, G.; Moumen, A.; Maazoun, A.; Belkassem, B.; Pyl, L.; Lecompte, D. An Explosive Driven Shock Tube-Based Laboratory Scale Test for Combined Blast and Fragment Impact Loading. Appl. Sci. 2022, 12, 6854. [Google Scholar] [CrossRef]
  61. Trevino, T. Applications of Arbitrary Lagrangian Eulerian (ALE) Analysis Approach to Underwater and Air Explosion Problems; Naval Postgraduate School: Monterey, CA, USA, 2000. [Google Scholar]
  62. Zukas, J.A.; Walter, W. Explosive Effects and Applications (Shock Wave and High Pressure Phenomena); Springer: London, UK, 2002; ISBN 978-0387955582. [Google Scholar]
  63. Trajkovski, J.; Kunc, R.; Perenda, J.; Prebil, I. Minimum mesh design criteria for blast wave development and structural response—MMALE method. Lat. Am. J. Solids Struct. 2014, 11, 1999–2017. [Google Scholar] [CrossRef] [Green Version]
  64. Koli, S.; Chellapandi, P.; Rao, L.B.; Sawant, A. Study on JWL equation of state for the numerical simulation of near-field and far-field effects in underwater explosion scenario. Eng. Sci. Technol. Int. J. 2020, 23, 758–768. [Google Scholar] [CrossRef]
  65. Dubec, B. Concrete Material Model Parameters for Simulation of Transient Dynamics. Dissertation Thesis, University of Defence, Brno, Czech Republic, 2022. [Google Scholar]
  66. OptiSLang. Methods for Multi-Disciplinary Optimization and Robustness Analysis; Dynardo: Weimar, Germany, 2014. [Google Scholar]
  67. Most, T.; Will, J. Sensitivity analysis using the Metamodel of Optimal Prognosis. In Proceedings of the Weimar Optimization and Stochastic Days 8.0, Weimar, Germany, 24–25 November 2011. [Google Scholar]
  68. Evans, J.D. Straightforward Statistics for the Behavioral Sciences; Thomson Brooks/Cole Publishing Co.: Pacific Grove, CA, USA, 1996. [Google Scholar]
  69. Cohen, J. Statistical Power Analysis for the Behavioral Sciences, 2nd ed.; Lawrence Erlbaum Associates: Hillsdale, NJ, USA, 1988; ISBN 978-0-8058-0283-2. [Google Scholar]
  70. Kala, F.H.A.J. Selecting the objective function during the inverse identification of the parameters of a material model of concrete. Frat. Ed. Integrita Strutt. 2017, 39, 7–16. [Google Scholar]
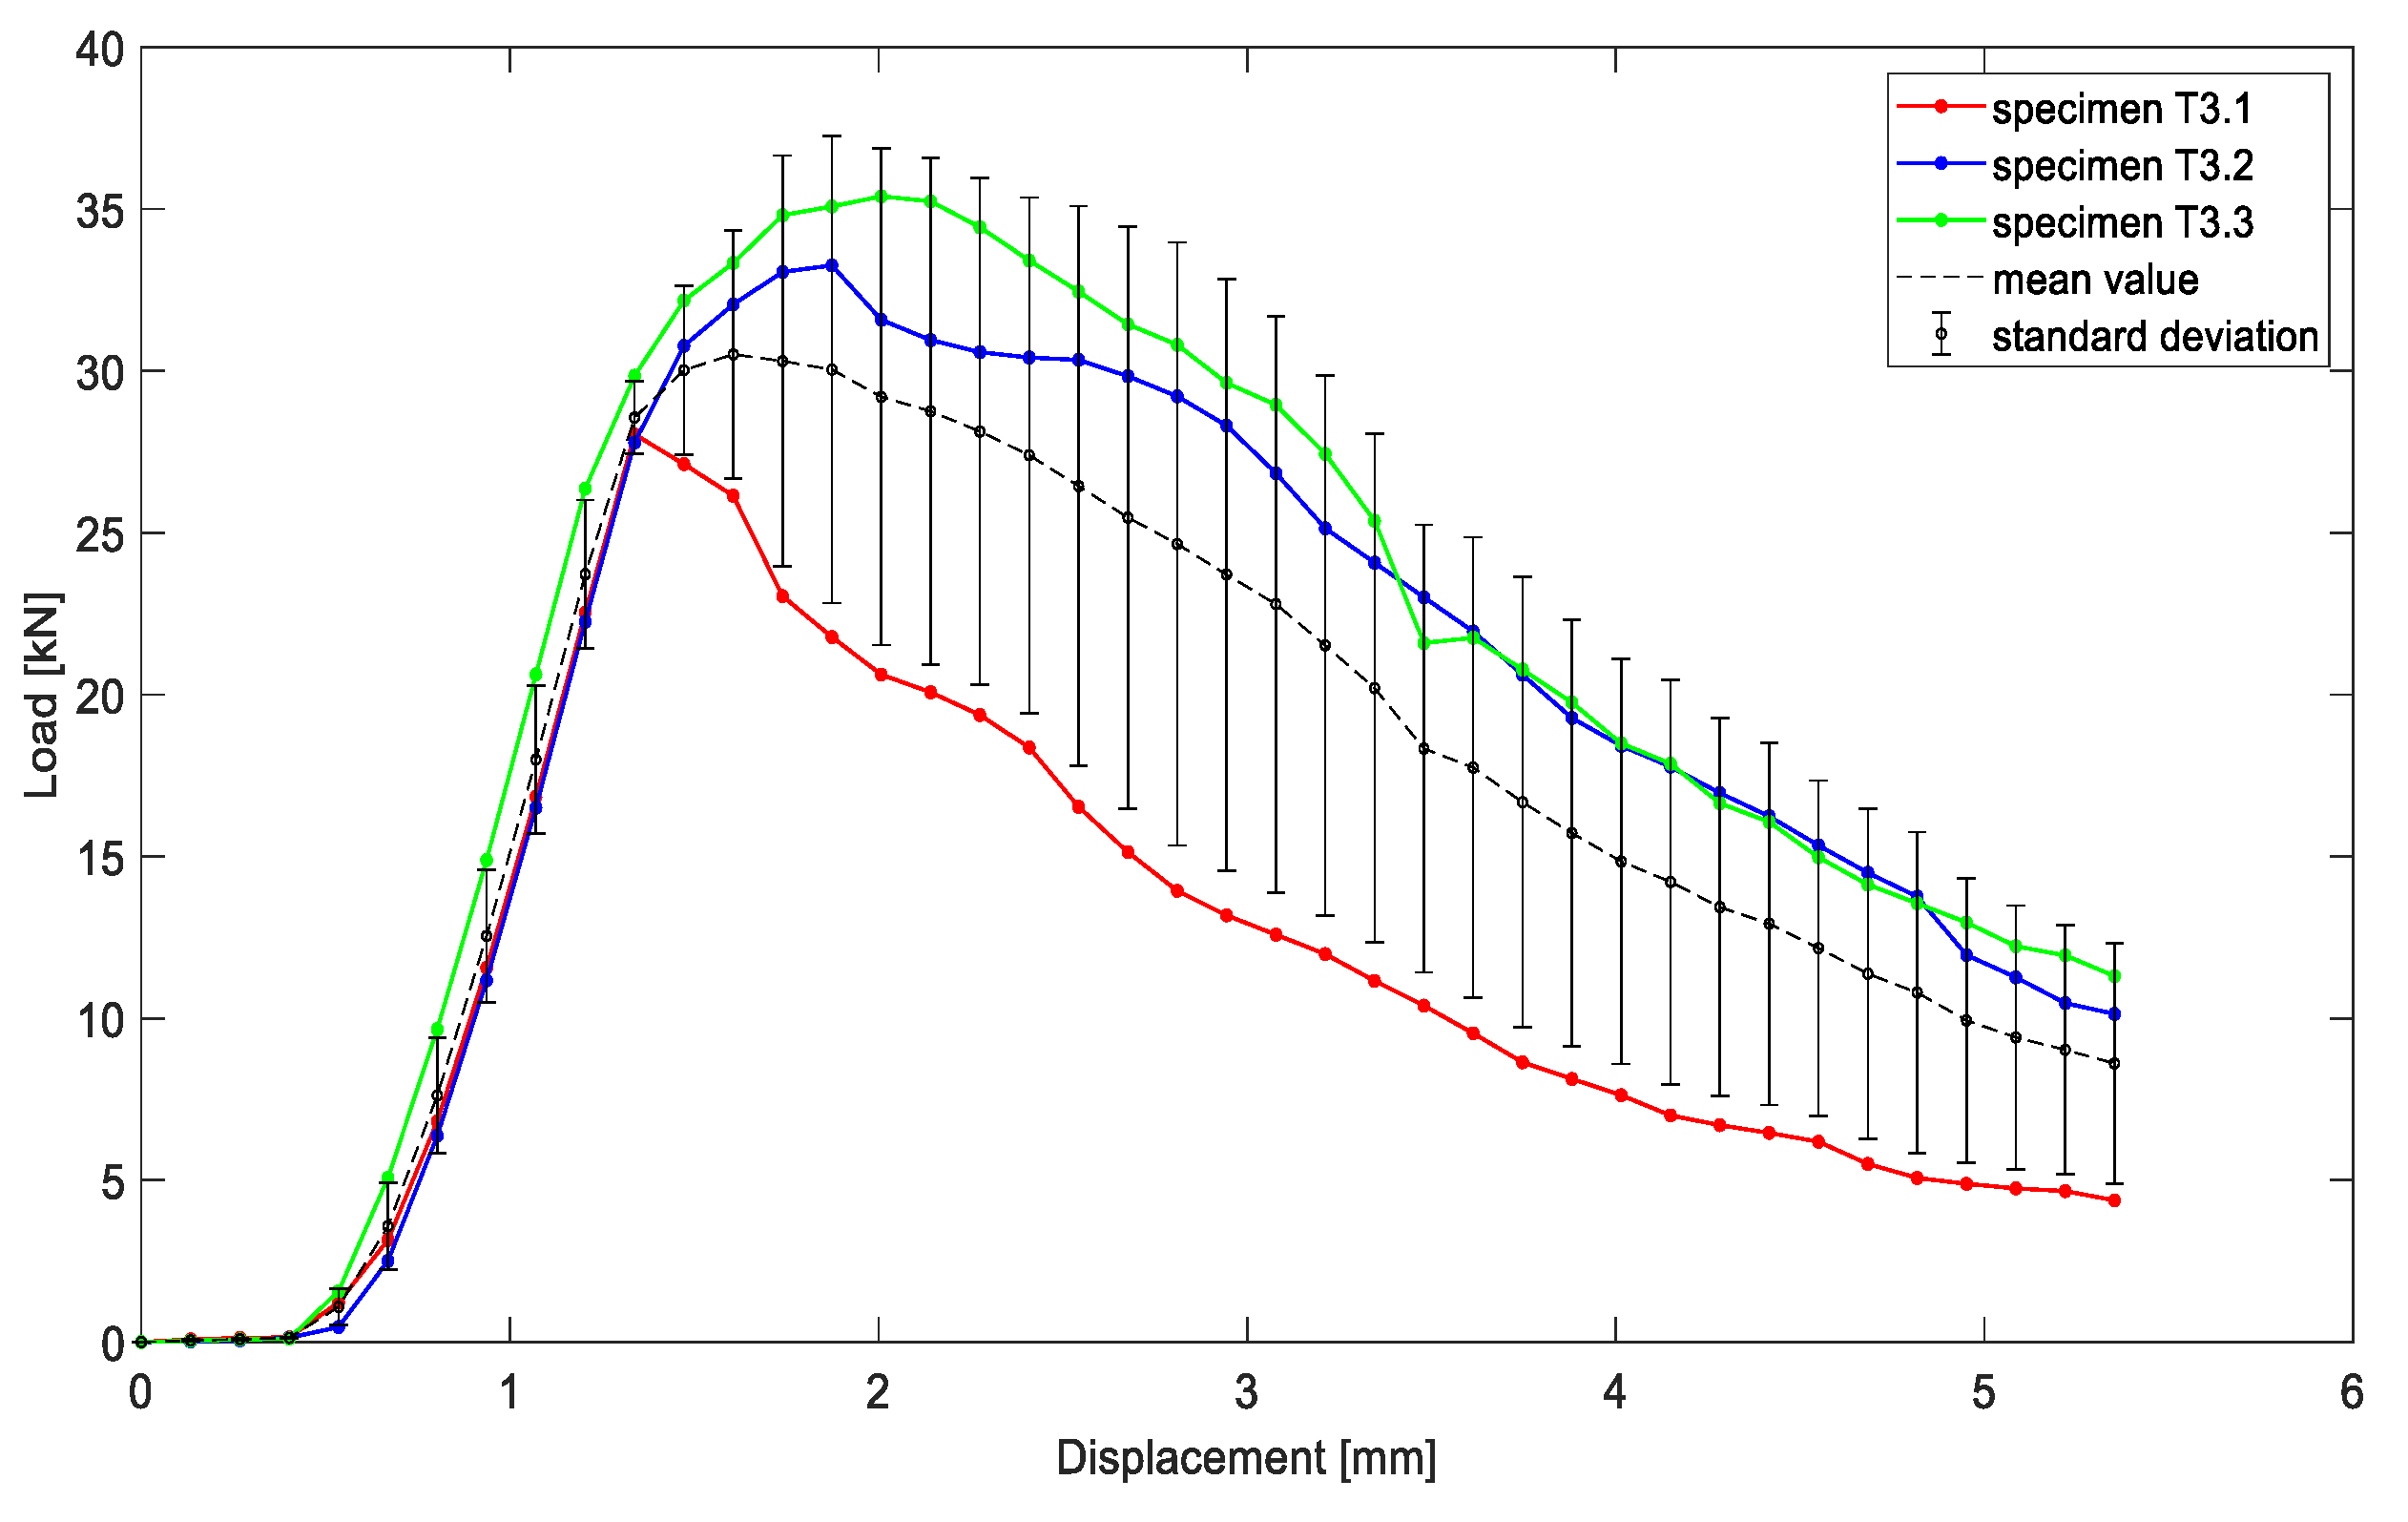
Figure 1. Three-point bending test results of the 28-day-old samples from the batch T3.1–T3.3.
Applsci 13 00070 g001
Figure 2. Overview of the experiment–blast loading of the concrete slab.
Applsci 13 00070 g002
Figure 3. Experimental setup [52].
Applsci 13 00070 g003
Figure 4. Time-displacement curve of the concrete specimen obtained during the experiment using an optoNCDT 2300 laser sensor.
Applsci 13 00070 g004
Figure 5. Modelling of the blast load of the concrete slab-displacement (mm) plot of the specimen in 3 ms time instant.
Applsci 13 00070 g005
Figure 6. Modelling of the blast load of the concrete slab-stress (GPa) plot of the specimen in 3 ms time instant.
Applsci 13 00070 g006
Figure 7. Time-displacement curve of the concrete slab under blast loading–simulation.
Applsci 13 00070 g007
Figure 8. Optimization chain of the material model parameter in the software environment Optislang.
Applsci 13 00070 g008
Figure 9. Comparison of the deflection curves obtained by simulation (red and grey) with the experimentally obtained curve (green colour).
Applsci 13 00070 g009
Table 1. Properties and dimensions of UHPFRC samples of batches P1–P3 and P4.1–P4.3.
Dimensions
Spec.LengthWidthHeightWeight
No.(mm)(mm)(mm)(kg)
P1149.0150.0150.09.193
P2148.0150.0150.08.930
P3146.0150.0150.09.014
P4.1148.0150.0150.08.818
P4.2130.8150.0150.07.805
P4.3150.0150.0150.09.042
Table 2. Results of UHPFRC cube strength tests on samples of batches P1–P3 and P4.1–P4.3.
Spec.DensityAgeForceCubic Strength
No.(kg/m3)(days)(kN)(MPa)
P12742152023.3
P2268232300103.6
P3274472580117.8
P4.12648283020136.0
P4.22652283020153.9
P4.32661283560157.2
Table 3. Flexural test results of UHPFRC on samples of batches T1.1–T1.3, T2.1–T2.3 and T3.1–T3.
Dimensions Tensile
Spec.HeightWidthLengthWeightDensityAgeForceStrength
No.(mm)(mm)(mm)(kg)(kg/m3)(days)(kN)(MPa)
T1.1101.2100.240010.5025902825.847.64
T1.2101.0100.440010.4925872827.828.20
T1.3101.0100.440010.4925872826.537.82
T2.1100.7100.440010.5826172829.428.70
T2.2100.999.540010.2425482829.448.84
T2.3101.6100.240010.4125532830.829.05
T3.1100.099.940010.3925982828.928.68
T3.2100.0100.540010.4926102833.369.92
T3.398.1100.140010.3926432835.5410.84
Table 4. Experimental parametric setup with concrete specimen deflection.
Test Number123456
TNT mass (g)7575200200225225
Distance (mm)5050300200250200
Displacement (mm)2.252.203.204.664.505.10
Table 5. Comparison of experimental measured deflection of concrete slabs under explosive load.
SourceThis Paper[10][23][24][24][30][30][32][33]
Chapter, figure, tableTable 4Chapter 2.2Chapter 5, Figure 6Chapter 2, Table 2Chapter 2, Table 2Chapter 2.1, Table 1 and Table 7Chapter 2, Table 1, Table 2 and Table 7Figure 2, Table 3 and Table 5Table 1 and Table 2
Specimen/ test name6 2-16-12
L30-80
2
L60-40
IB
Dimensions [mm]500 × 500 × 601250 × 1250 × 501300 × 1000 × 100660 × 660 × 25660 × 660 × 25550 × 550 × 50550 × 550 × 501000 × 1000 × 40750 × 750 × 30
MaterialUHPFRCRC (bars)SFRCUHPFRCUHPFRCHSFRCHSFRCRC (bars)RC (bars)
Fibre dosage [%]2.0 2.06.0
(hybrid)
1.00.5
Standoff distance [mm]200.0500.0100.0500.0500.0242.5242.5400.0300.0
ExplosiveTNTTNTCompBPE4PE4TNTTNTTNTTNT
Explosive mass [g]225640500200200244244200190
Displac. or deflection [mm]5.119.09.02.2
(at 1/4 span)
1.6
(at 1/4 span)
2.05.010.026.0
Table 6. Parameters of linear polynomial EOS and null material model for air.
Linear Polynomial EOSNull Material
C4 (-)C5 (-)E0 (J/m3)V0 (-)ρ (kg/m3)
0.40.4253.4 × 10311.225
Table 7. Parameters of JWL EOS and High Explosive Burn Material model of TNT.
Jones–Wilkins–Lee Equation of StateHigh Explosive Burn Material
A
(GPa)
B
(GPa)
R1
(-)
R2
(-)
ω
(-)
E0
(J/m3)
V0
(-)
ρ
(kg/m3)
D
(m/s)
Pcj
(GPa)
3.7123.2314.150.950.37 × 10911590693021
Table 8. Initial seed vector of input parameters’ values of the Winfrith material model used in the simulation.
Parameter’s Name
(Unit)
Aggregate Size
(mm)
Fracture
Energy
(kN/mm)
Poisson
Ratio
(-)
Tangent Modulus
(GPa)
Compressive Strength
(GPa)
Tensile Strength
(GPa)
Parameter’s value5.00.0010.2350.060.006
Table 9. Range of values of concrete parameters used in the optimizations.
Parameter’s Name
(Unit)
Aggregate
Size
(mm)
Fracture
Energy
(kN/mm)
Poisson
Ratio
(-)
Tangent
Modulus
(GPa)
Compressive
Strength
(GPa)
Tensile
Strength
(GPa)
Range0.25–100.001–0.020.12–0.315–500.03–0.120.004–0.012
Table 10. Resulting design values of concrete parameters.
Vector
Number
Aggregate Size
(mm)
Fracture
Energy
(kN/mm)
Poisson
Ratio
(-)
Tangent
Modulus
(GPa)
Compressive Strength
(GPa)
Tensile Strength
(GPa)
O
(mm)
3379.62830.00160.159044.89250.06590.00700.840
1419.67700.00140.134742.14750.07090.00831.023
2467.83670.00220.212847.36750.05000.00601.144
Table 11. Pearson’s correlation coefficient r x y values for individual input parameters and output parameter O (the objective function).
Correlation
Coefficient
r x y
(size,O)
r x y
( G f ,O)
r x y
η ,O)
r x y
E ,O)
r x y
( f c ,O)
r x y
( f t ,O)
Value−0.050.60.070.390.060.54
Disclaimer/Publisher’s Note: The statements, opinions and data contained in all publications are solely those of the individual author(s) and contributor(s) and not of MDPI and/or the editor(s). MDPI and/or the editor(s) disclaim responsibility for any injury to people or property resulting from any ideas, methods, instructions or products referred to in the content.