Article

A Semi-Empirical Model for Sound Absorption by Perforated Plate Covered Open Cell Foam and Improvements from Optimising the Perforated Plate Parameters

1
School of Mechanical Engineering, Xi’an Jiaotong University, Xi’an 710049, China
2
State Key Laboratory for Strength and Vibration of Mechanical Structures, School of Aerospace, Xi’an Jiaotong University, Xi’an 710049, China
3
School of Mechanical Engineering, Ningxia University, Yinchuan 750021, China
4
School of Mechanical Engineering and State Key Lab of Digital Manufacturing Equipment and Technology, Huazhong University of Science and Technology, Wuhan 430074, China
*
Author to whom correspondence should be addressed.
Appl. Sci. 2023, 13(1), 78; https://doi.org/10.3390/app13010078
Submission received: 15 November 2022 / Revised: 15 December 2022 / Accepted: 18 December 2022 / Published: 21 December 2022

Abstract

:

Featured Application

Sound absorption calculation of composite structure and its optimal design application, when the total volume or total weight of sound-absorbing materials is strictly limited.

Abstract

Composite structures can be designed with specific parameters for efficient sound absorption in specific frequency bands; however, determining the optimal parameters and topology to maximize sound absorption is a computationally challenging task. In this work, a semi-empirical model is constructed to predict the sound absorption performance of composite structures consisting of open-cell foam and perforated plates. The calculated results of the semi-empirical model are in good agreement with the experimental results carried out in the B and K tube impedance measurement system. The parameters such as perforation ratio, plate thickness, air gap, etc., of the composite structure within limited thickness were optimized by using a genetic algorithm (GA) to improve the sound absorption coefficient at a lower frequency band. The calculation and experimental results show that when the thickness is fixed, the peak sound absorption frequency can be reduced by 400 Hz; on the contrary, with the goal of broadening the sound absorption frequency band, the optimized composite structure can widen the sound absorption frequency band by 55.38%. The results of this work have potential engineering applications for the calculation of the sound absorption of porous materials and perforated plate composite structures and their optimal design, particularly when the total volume or total weight of the sound-absorbing material is strictly limited.

1. Introduction

In the field of acoustics, the perforated plated (PP) has been widely used in practical applications due to its capability of low frequency noise control near its resonance frequency. The theoretical investigation of acoustical properties such as sound absorption micro-perforated plate or PP-based sound-absorbers involves empirical models, micro-perforated theory, equivalent fluid models [1,2,3,4], etc. Maa proposed the structure of the micro-perforated plate sound-absorber and established the basic principle of the sound absorption of the micro-perforated plate sound-absorber [5,6]; Kang et al. studied the feasibility of using transparent micro-perforated plate sound-absorbers in ventilation systems [7]; Lu et al., according to the intake noise behaviors of an automobile engine under accelerating working conditions, proposed a compact micro-perforated panel muffler with a serial-parallel coupling mode for silencing [8]; Mana et al. have considered a finite flexible perforated panel set in a differently perforated rigid baffle [9]. Although the composite PP broadens the sound absorption frequency band, the sound absorption frequency band is still very narrow compared with traditional porous material, and with the increase in the number of composite layers, the sound absorption effect will also be significantly weakened [10,11,12,13].
Porous materials are structural materials with superior functionalities and properties such as energy absorption, vibration and noise attenuation, light weight, high stiffness and intensity. They have attracted significant attention both in scientific research and engineering application [14,15,16]. However, the manufacturing process of porous materials is complex [17,18,19,20,21,22,23], the design parameters (porosity, thickness, etc.) are difficult to control, and the porous material easily contaminated [24,25,26,27]. The PP in the composite structure can protect the porous material from contamination and damage, to a certain extent, thereby improving the service life of the composite structure. The composite structure has more advantages in low frequency and broadband sound absorption than just composite PP. Although scholars have conducted some work on the theory of this type of composite structure [1,2,12], the relevant parameters of the porous materials in the proposed model are still difficult to obtain. The whole model has a narrow scope of application and can only be used for specific porous materials. The semi-empirical model can quickly obtain the acoustic resistance of porous materials through experiments and has a wide range of applications.
The composite structure parameters need to be optimized to improve the sound absorption performance at the lower-frequency and wider-band [28,29,30]. Kim et al. presented an analysis and optimization method to improve sound absorption at 100–1600 Hz [28]. Meng et al. proposed an optimization design to find the optimal distribution of geometric parameters in graded semi-open metal [22,30]. Different porous materials have different calculation models, and the same model has a small scope of application [31,32]. These scholars pointed out that the change of PP parameters will cause the change of the sound absorption of the composite structure; they did not optimize the parameters of PP to improve the sound absorption performance of low frequency [33,34,35,36]. A genetic algorithm takes the coding of decision variables as the operation object, the fitness as the search information, uses the search information of multiple points, and adopts the probability search technology, so that it can optimize the calculation results of the multi-parameter model [37]. The scholars apply it to the topology optimization of porous materials to maximize the sound absorption performance [38]. The open-cell foam has a high porosity (92~98%); the sound absorption performance is poor in the low frequency, and so on. In order to improve the sound absorption performance of open-cell foam, it is urgent to establish the sound absorption model of the open-cell foam copper (OFC) and PP composite structure, and to find a method for optimizing the sound absorption performance of the composite structure.
Combining the properties of open-cell foams, we constructed a semi-empirical model to predict the sound absorption performance of composite structures based on the sound absorption principle of perforated panels. The sound absorption performance of the composite structures composed of OFCs with different thicknesses was tested using Brüel and Kjær (B and K) impedance tubes to verify the accuracy of the semi-empirical model. Secondly, the genetic algorithm (GA) is used to optimize the parameters of the composite structure (i.e., perforation ratio, hole diameter, plate thickness, air gap) to enable the composite structure with limited thickness to achieve high-efficiency sound absorption (α > 0.5) in a specific frequency band. It should be note that the parameters of porous materials are not considered in our optimization. Finally, we have fabricated the designed composite structures and experimentally measured the acoustic performance. The experimental results match well with that of the calculation.

2. The Sound Absorption Model of the Composite Structure

The schematic diagrams of the composite structure are shown in Figure 1. The composite structure includes a PP layer, an air gap, and an OFC sound-absorbing material. The sound absorption coefficients of a PP layer backed by air gap can be calculated using Maa’s theory. The characteristic impedance and complex wave number of the OFC are measured by the B and K impedance tube, which is adopted to measure the characteristic impedance and complex wave number of the OFC using the four-microphone transfer function method. According to the measured results, the exponential function is used for curve fitting the characteristic impedance and the complex wave number of the OFC. The characteristic impedance of the composite sound-absorber structure is given, and the normal sound absorption coefficient is calculated.
There are many physical phenomena involved in the process of the acoustic energy dissipation of composite structures. The physical phenomena involved in the structure of the composite sound-absorber are shown in Figure 2. The impact of the PP on the sound wave in the incoming hole primarily includes surface viscous, distorted flow and inner viscous, as can be seen in Figure 2a. In this paper, the normal surface impedance of the PP supported by the rear cavity is considered. First, the surface impedance of a single perforation is predicted. Air has a surface viscous effect on the surface of the PP around the holes. Distorted flow is caused by part of the viscous boundary layer, including the viscous effect around the edge of the viscous boundary layer on the panel surface caused by the distortion of the acoustic flow, and the influence caused by the non-uniform flow on the panel surface. As the surface roughness is different due to different PP materials, processing, etc., it generally needs to be corrected. Inner viscous refers to the viscous effect of the inner wall surface of the perforation. The sound mass load, the sound radiation from the perforation and the sound flow on the panel surface will affect each other. It is generally believed that the thickness of the air in the perforation is greater than the perforation depth, which increases the mass of the vibrating air. In order to better describe the movement of the air mass block, the end correction lengths can be used to describe the inertial effect caused by the increased air mass. As shown in Figure 2b, the impact of the reflected sound flow when the sound flow passes through the perforation and enters the porous materials is also considered as a part of the acoustic impedance of the PP. The linear radiation impedance at the perforated end of the OFC side is also related to the characteristic impedance, complex wave number and porosity of the porous material.
According to the physical phenomenon of acoustic energy dissipation in the composite structure, the total impedance of the composite structure is divided into five parts. Where R s is the acoustic impedance generated by the friction between air and PP surface, which is caused by surface viscous (viscous interactions (or effects) at the surface of the perforated plate); Z p is the impedance generated by the air in the hole, which is caused by the inner viscous; Z a e is the radiation impedance of the front end (left side of PP), which is mainly caused by the distorted flow when the sound flow flows into the hole; Z p e is the radiation impedance at the tail end (on the right side of PP), and this side is the OFC, which is mainly caused by the distorted flow of acoustic flow reflected from the OFC in the inflow hole; Z p s is the characteristic impedance of the OFC.
The acoustic absorption of PP layer backed by an air gap can be calculated using Maa’s theory [5]. The Z p can be obtained by the following formula [5]:
Z p = 32 η L p p d p p 2 1 + x 2 32 + i ω ρ 0 L p p ( 1 + 2 18 + x 2 ) ,
with
x = d p p 2 ρ 0 ω η ,
where ρ 0 is the density of air, ω = 2 π f is the angular frequency, η is the dynamic viscosity of air, d p p is the diameter of the orifice, L p p is the thickness, and x is the perforate constant.
The acoustic impedance can be obtained by the following formula [4]:
R s = 1 2 2 ω ρ 0 η .
The Z a e can be obtained by the following formula [1]:
Z a e = i ω ρ 0 ε e ,
with
ε e = 0.48 π r p p 2 ( 1 1.14 ϕ p p ) ,
where ε e is the length of end correction.
The Z p e can be obtained by the following formula [1]:
Z p e = i ω ρ ε e ,
with
ρ = ϕ p s Z p s k p s / ω ,
where ρ is the equivalent complex density of the OFC. ϕ p s is the porosity of the OFC.
The Z p s and k p s of the OFC are obtained by analyzing the experimental data measured by the B and K impedance tube. There are three main reasons for this: first, the measurement of the acoustic characteristic parameters (tortuosity factor, porosity, characteristic length, etc.) is time-consuming and labor-intensive for the OFC; second, different porous materials require different calculation models, and the same model has a small scope of application; third, combined with the four-microphone transfer function method, the impedance tube is used to measure the impedance and complex wave number of a certain sound-absorbing material. The process is fast and convenient, and the measurement results are accurate.
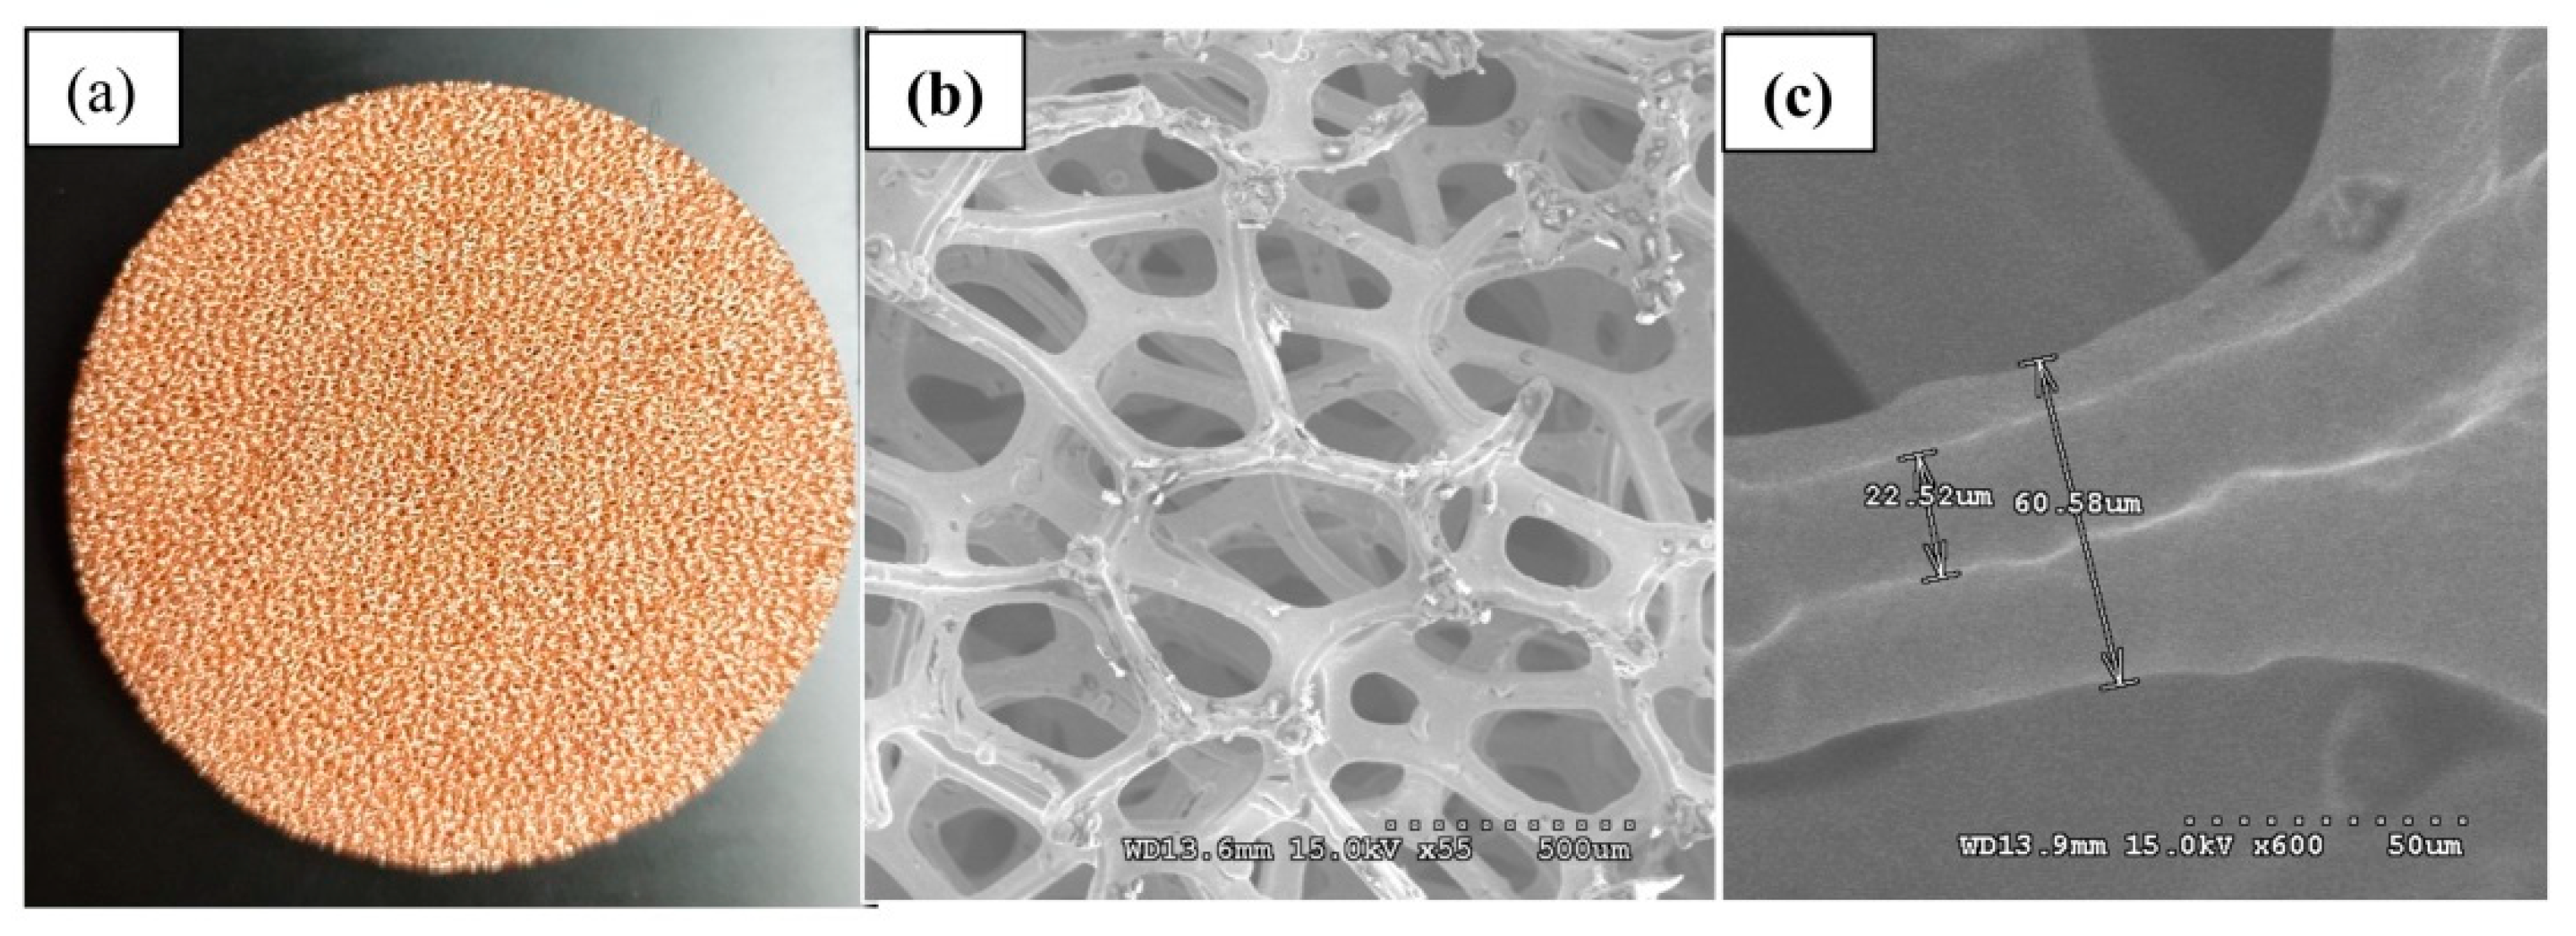
Figure 3 shows the surface of the OFC specimen. The OFC is manufactured by electrode position. The pore size of the OFC is approximately 0.27 mm, and the porosity of the OFC is approximately 95%. In this study, three different thicknesses of the OFC were selected. The structural parameters of the OPC test specimens are listed in Table 1.
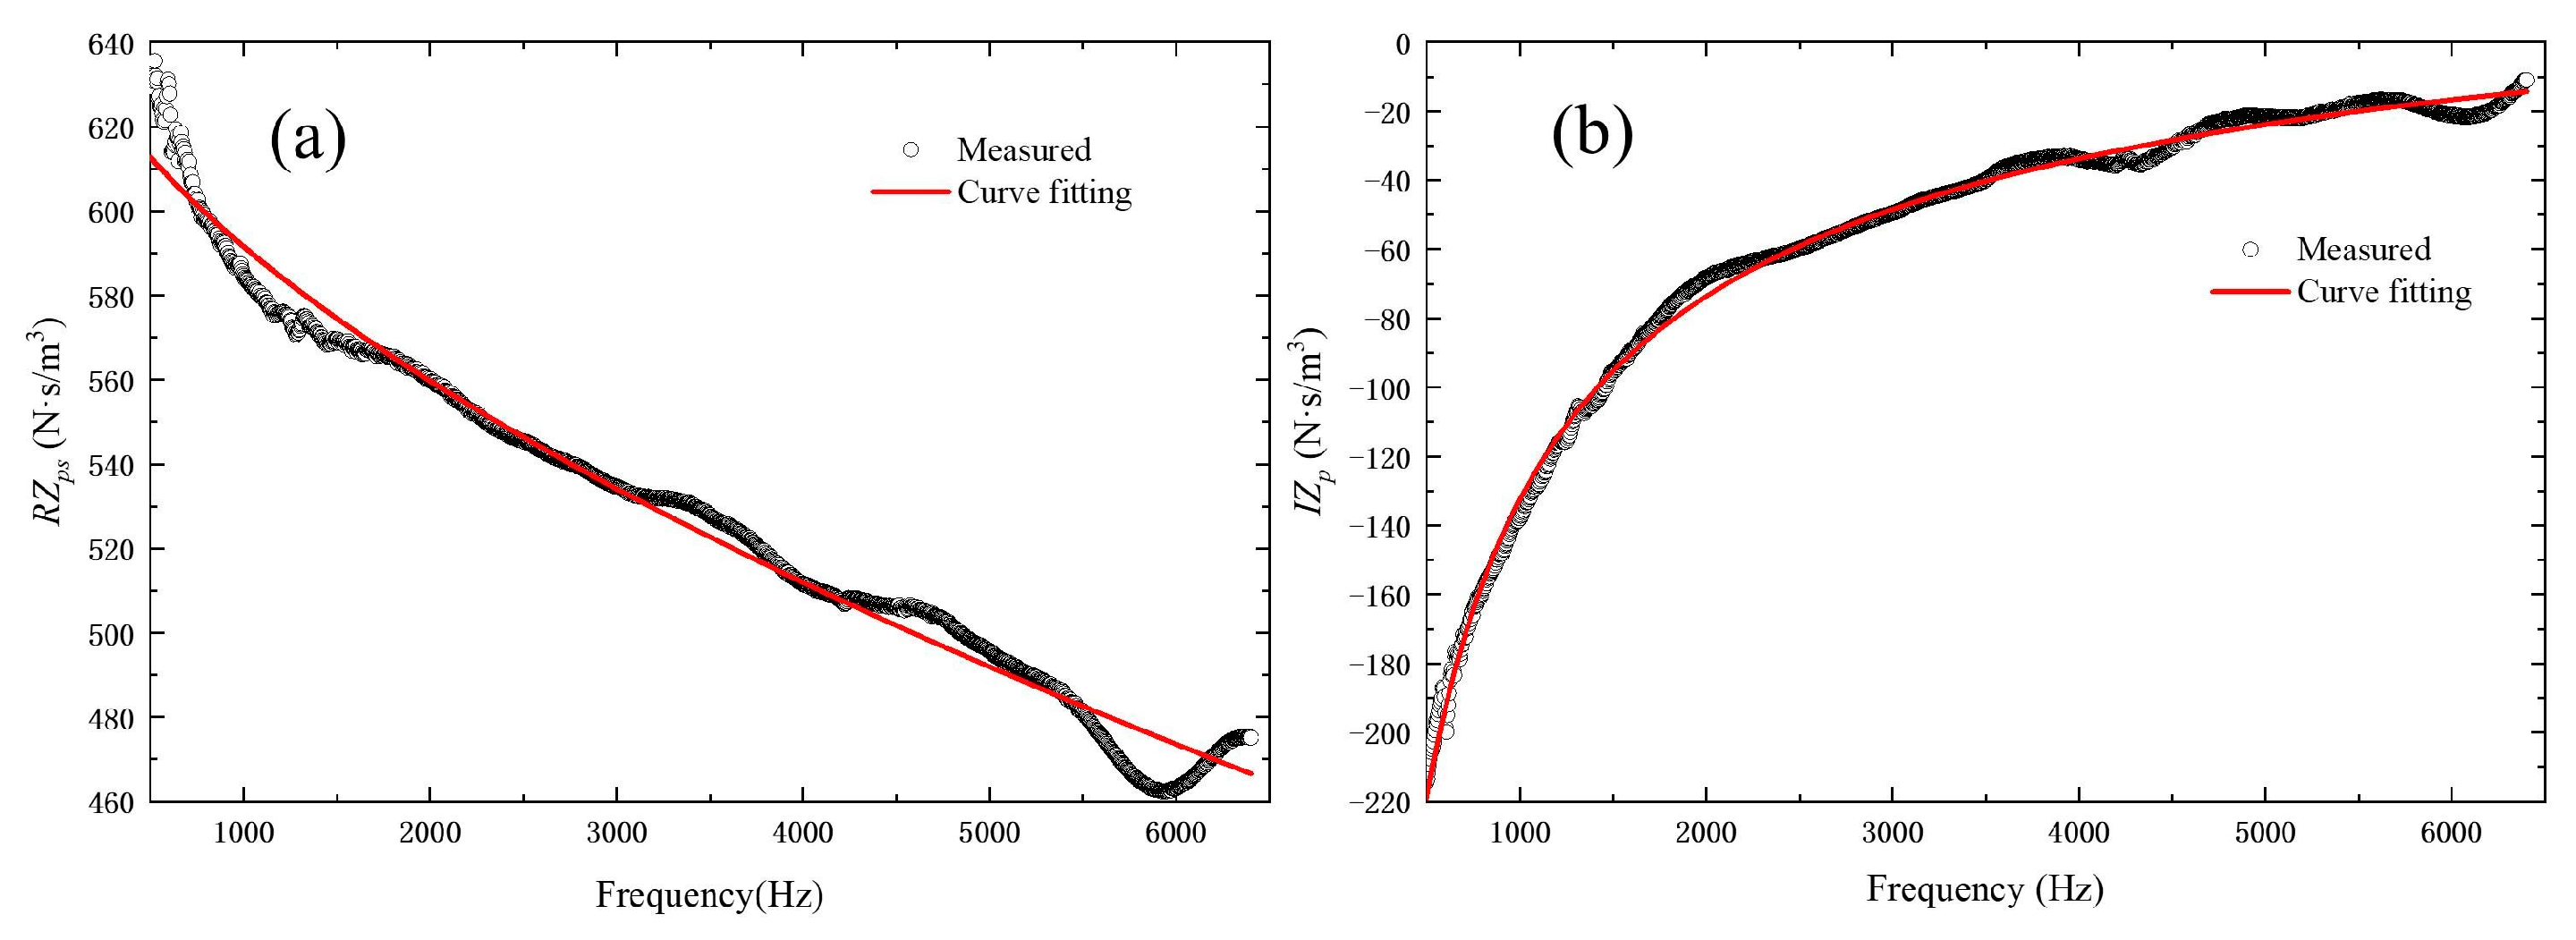
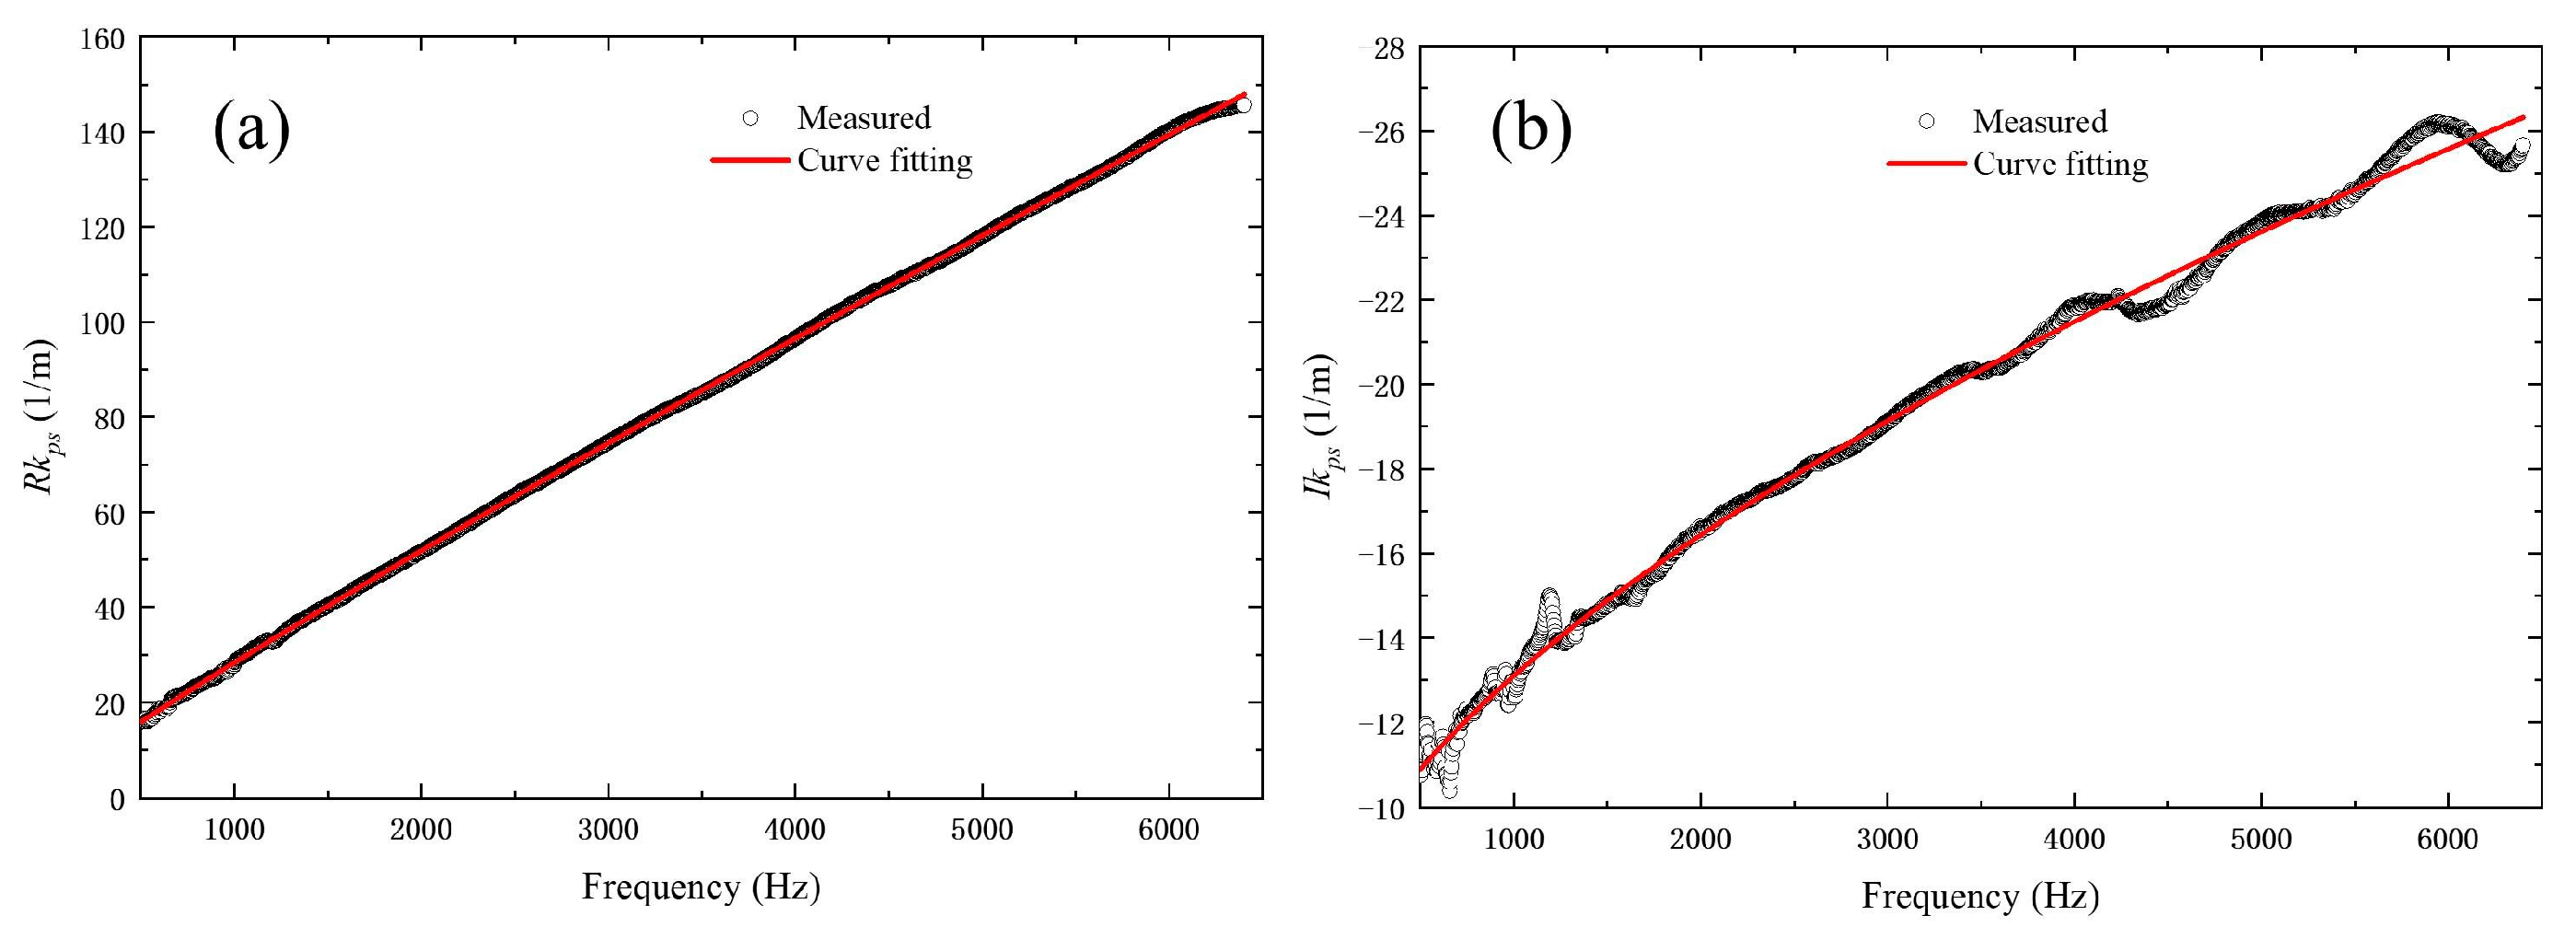
Take OFC2 as an example, according to the measured results, the exponential function is used for curve fitting the characteristic impedance and the complex wave number of OFC2 in Figure 4 and Figure 5.
The purpose of the curve fitting is to eliminate certain test errors. In addition, the test results can be better coupled with the PP theory. The utility of the model is expanded, and the later optimization is prepared. Similarly, the curve fitting results of OFC1 and OFC3 are listed in Table 2. The propagation constants and characteristic impedance fitting expressions of OFC1, OFC2 and OFC3 are different, because the thickness of the three test pieces is different, and OFC2 and OFC3 are stacked by several single-layer OFCs, so their internal structures will also change, such as the tortuosity factor.
The characteristic impedance of the OFC is given:
Z p s = R Z p s + I Z p s .
The complex wave number of the OFC is given:
k p s = R k p s + I k p s .
Obtaining the impedance of the PP and the impedance of the open cell foam copper, the characteristic impedance of the composite sound-absorber structure is given:
Z s = ( Z p + 4 R s + 2 Z a e + Z p e ) ϕ p p + Z p s .
where R s is the acoustic impedance generated by the friction between the air and PP surface, which is caused by surface viscous. Ingard pointed out that the value predicted by this formula is too small compared to the testing result, and Allard proposed that 2Rs will give better prediction results [1]. Considering the viscous friction loss at the surfaces on both sides of the PP, 4Rs is used in Equation (10). Z p is the impedance generated by the air in the hole, which is caused by the inner viscous; Z a e is the radiation impedance of the front end (left side of PP), which is mainly caused by the distorted flow when the sound flow flows into the hole. Considering that there is air on both sides of the PP, the air layer in the composite structure is always a parameter to be considered, whether it is the verification process of the semi-empirical model or the process of optimizing the calculation, and 2 Z a e is used in Equation (10); Z p e is the radiation impedance of the perforation end on the side of the OFC. Considering that the mechanical properties of the composite sound-absorbing structure are not too bad, the air layer in the composite structure is less than or equal to 1 mm, and the porosity of the OFC is relatively large, at approximately 95%. Therefore, the reflection of the sound wave after contact with the porous material is not considered. It is considered that the sound waves are an incident in the OFC, and the coefficient of Z p e is 1 in Equation (10); Z p s is the characteristic impedance of the OFC, and it is a value that is fitted after actual measurement. The curve fitting function has limited versatility, as it is only applicable to given sample materials, but it might be applicable to open cell foam materials with similar microstructure.
The normalized specific surface acoustic impedance z s is
z s = Z s c ρ 0 = r + i ω m .
The calculation formula of sound absorption coefficient is as follows:
α = 4 r ( 1 + r ) 2 + ( ω m cot ( 2 π y ) ) 2
with
y = f ( L p s + L g ) / c ,
where f is frequency, L g is thickness of air gap, L p s is thickness of the OFC, and c is the sound speed.

3. Experimental Validation and Discussions

3.1. The PP Specimen Preparation

Figure 6 shows the PP and the prepared test specimens fabricated by using Three-dimensional technology. The PP was printed with a fine layer resolution of 0.1 mm. The PP sample was designed with thickness L p p = 1 mm, sample diameter 29 mm, and hole diameter d p p = 2 mm. The selection of these structural parameters can better provide reasonable resistance, and the use of the appropriate perforation ratio range will also be conducive to further research. It should be noted that it was printed with hole spacing b p p = 5 mm for the PP1. The printed specimen is rigorously measured and selected in order to comply with the design requirements. The measured parameters of the PP1 are listed in Table 3.
Figure 6e shows the B and K impedance tube for measuring the sound absorption coefficient of the composite structure. Based on the principle of the transfer function, the double microphone method is used for the sound absorption experiment measurement. The ambient temperature of the laboratory is 20.1 °C, the relative humidity is 45%, the sound velocity in the air is 343.65 m/s, and the air density is 1.2 kg/m3. The inner diameter of the impedance tube is 29 mm, and the acoustic characteristics are measured in the frequency range of 500–6400 Hz.

3.2. Results and Discussions

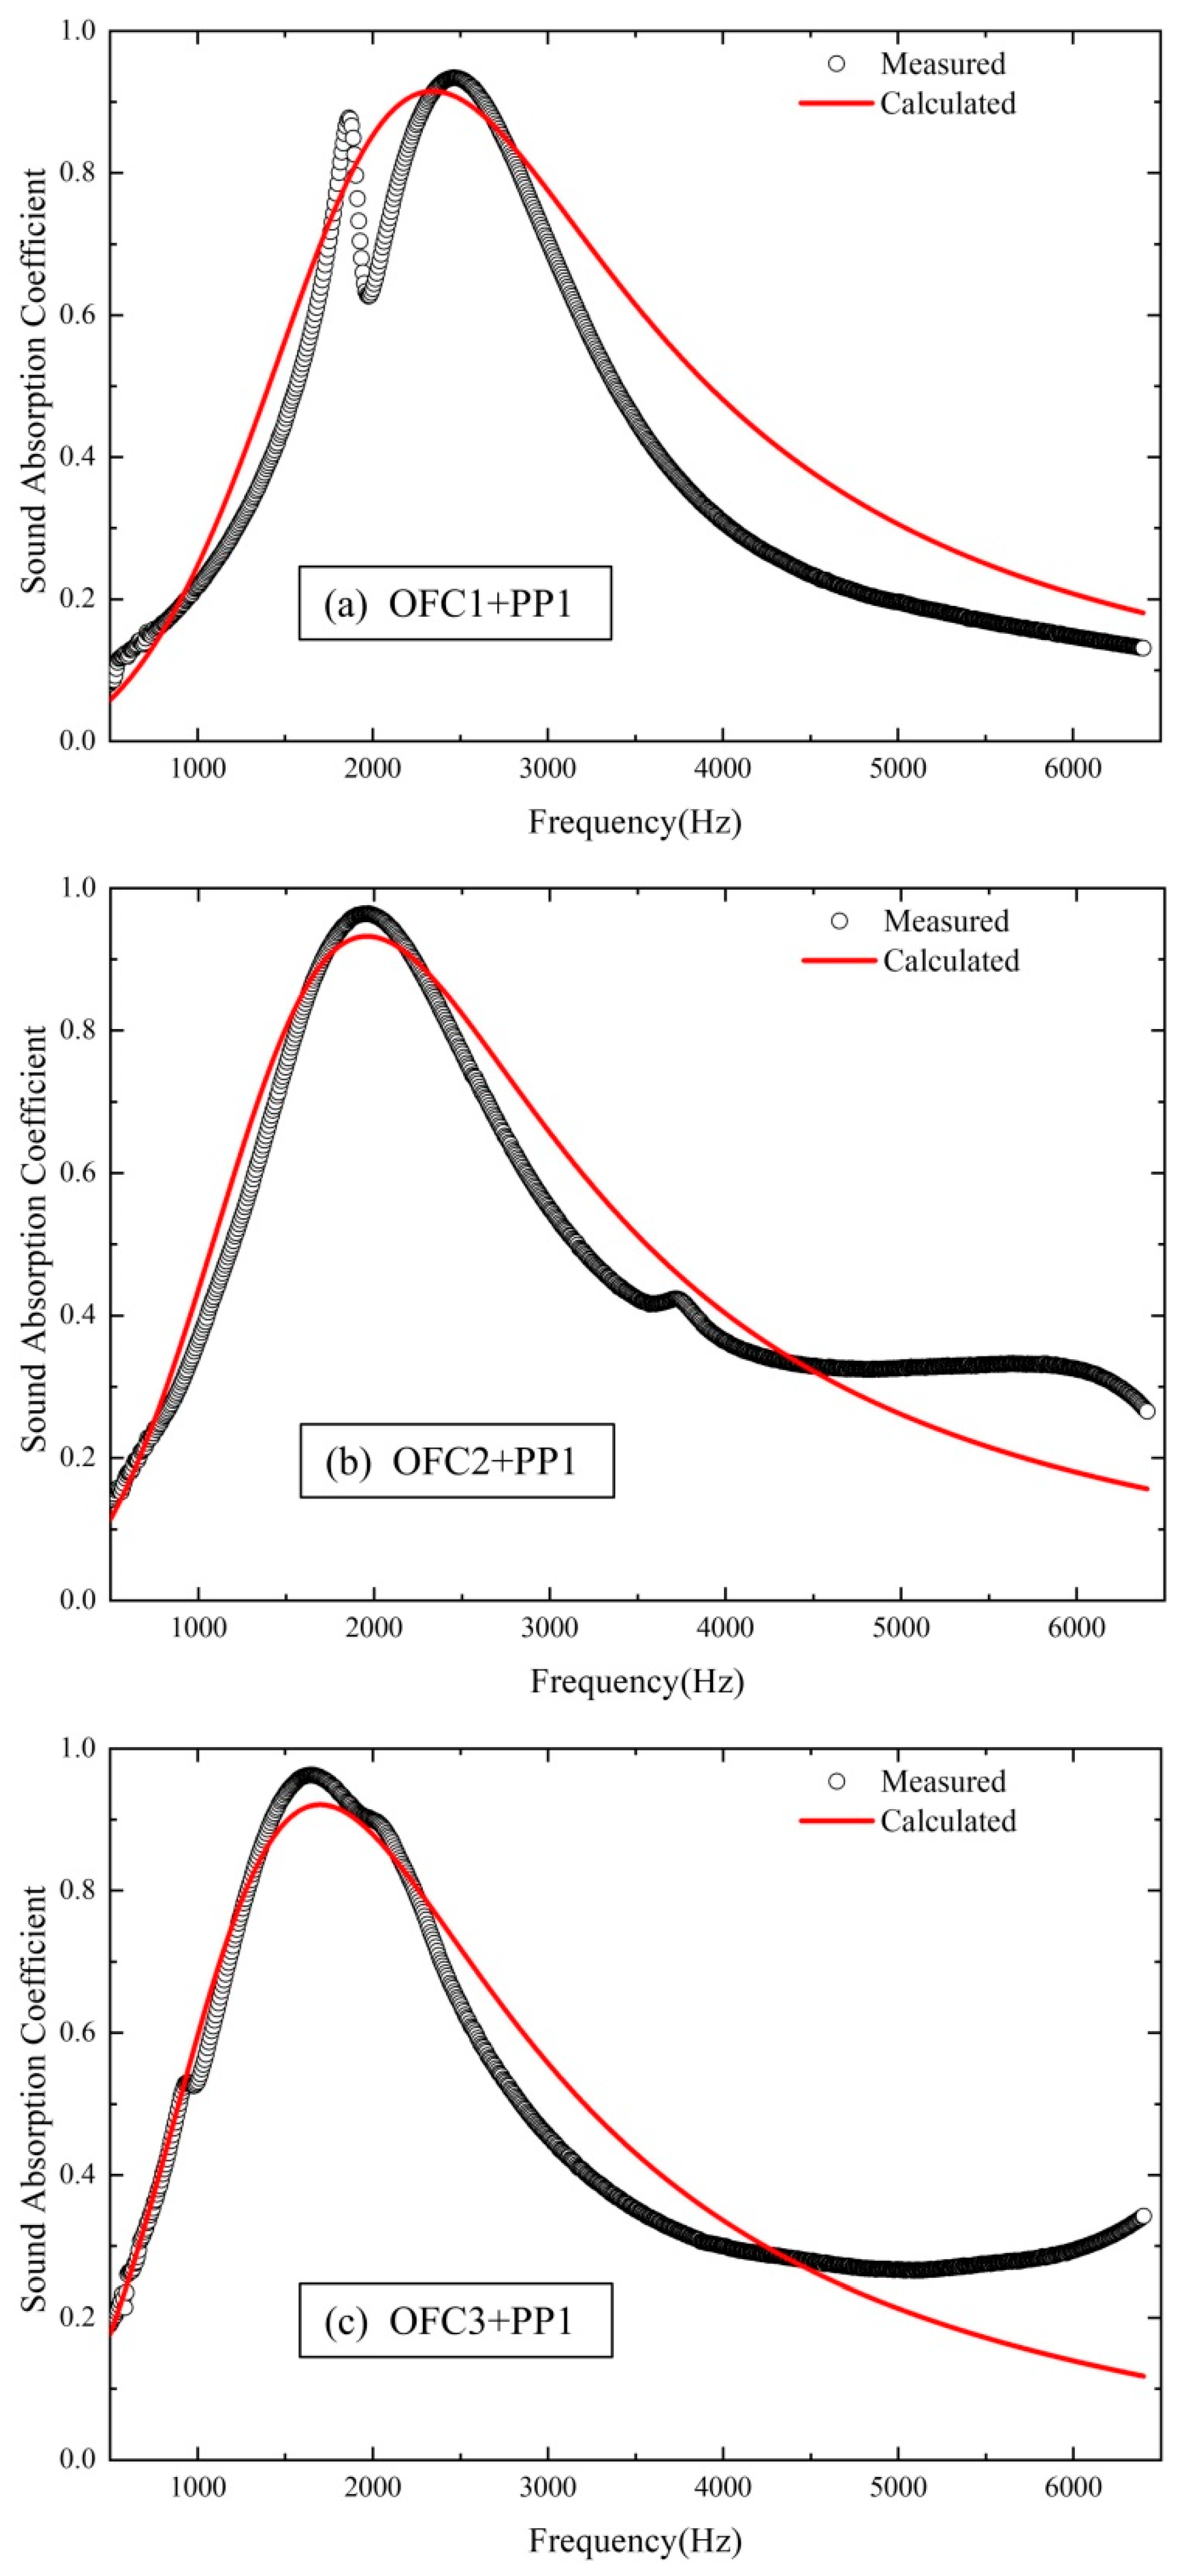
Figure 7 shows the sound absorption measurement and prediction curves of the composite sound absorption structure ( L g = 0.6 mm). The sound absorption coefficient diagram obtained by the semi-empirical model is in good agreement with the measured results. The maximum value of the sound absorption coefficient moves to the low frequency direction, where the foamed copper material is thickened. This is because the right-end of the PP hole is not open, but the porosity of the OFC is very high, reaching 0.95, which can be considered as both ends of the hole being open. When the air in the hole is used as the sound mass and the fluid in the air gap between the PP and the OFC is used as the sound spring, there will be mass and spring resonance. When the stiffness of the air gap offsets the mass, the peak value of the sound absorption coefficient will appear. The increase in the OFC thickness will effectively reduce the stiffness of the air gap, so that the absorption peak moves to a lower frequency. As a result of the damping characteristics of the OFC itself, it will increase the dissipation of sound energy and increase the bandwidth of the peak sound absorption coefficient. It is worth noting that the absorption spectrum of OFC will show resonance corresponding to the frequency, the thickness of which is equal to one-fourth of the wavelength of the wave propagating in the layer. Due to the increase in the effective thickness, the frequency will be reduced by adding a perforated cover layer and a small air space above the hard back foam layer. In this study, the perforated covering layer and small air space are controlled, and only the thickness is changed, which further explains the reason for the low frequency shift to the peak frequency. The maximum sound absorption coefficient appears near 2500 Hz for the OFC1 + PP1. The peak absorption coefficient predicted by the semi-empirical model is in good agreement with the measured data of the corresponding frequency. The calculated value of the sound absorption band is slightly wider than the measured value of the sound absorption band. Moreover, the measurement shows another absorption peak (1900 Hz) of the composite structure, depicted in Figure 7a. One reason is that OFC is very thin, similar to the PP, so it can resonate. Another reason is the resonance of the porous foam layer frame. The maximum sound absorption coefficient appears near 2000 Hz and 1800 Hz for the OFC2 + PP1 and OFC3 + PP1, respectively, as shown in Figure 7b,c. In short, the semi-empirical model is validated for the prediction of the sound absorption of composite structure.

4. Lower-Frequency Absorptivity Optimization of the Composite Structure

The frequency of the noise generated by many mechanical devices is concentrated at 800 Hz to 2500 Hz, and the quality and thickness of the sound-absorbing materials are limited by specific environments and conditions. We used OFC3 as the lining material of the composite structure. The overall thickness of the composite structure serves as the basic constraint. The parameters of the composite structure are optimized by the genetic algorithm, in order to improve the sound absorption performance of the composite structure in a specific low frequency band (800~2500 Hz). The integral value of the sound absorption coefficient of the composite structure in a certain frequency band is set to the objective function. The porosity of the perforated plate ( ϕ p p ), the thickness of the perforated plate ( L p p ), the aperture of the perforated plate ( d p p ), and the thickness of the intermediate air gap ( L g ) are optimized. The objective function can be written as:
o b j : m a x [ 800 2500 α ( ϕ p p ,   L p p ,   d p p ,   L g ) d f ] .
In practical applications, considering that the composite sound-absorbing structure should satisfy the certain stiffness, the air gap should not exceed 1 mm. Considering the difficulty and cost of processing the perforated plate, the thickness of the PP should not exceed 2.5 mm. The perforation rate constraint of the PP is directly applied in this study. The aperture of the perforated plate determines the processing efficiency and processing cost during processing. Therefore, the minimum aperture is 1 mm. The size of the test piece itself limits the aperture of the perforated plate, and the aperture of the perforated plate is too large, which may result in the loss of characteristics of the perforated plate. The constraints are:
s . t . { L p p + L g + L p s 20   mm 0.01 ϕ p p 0.2 1   mm d p p 3   mm 1   mm L p p 3   mm 0.5   mm L g 1   mm .
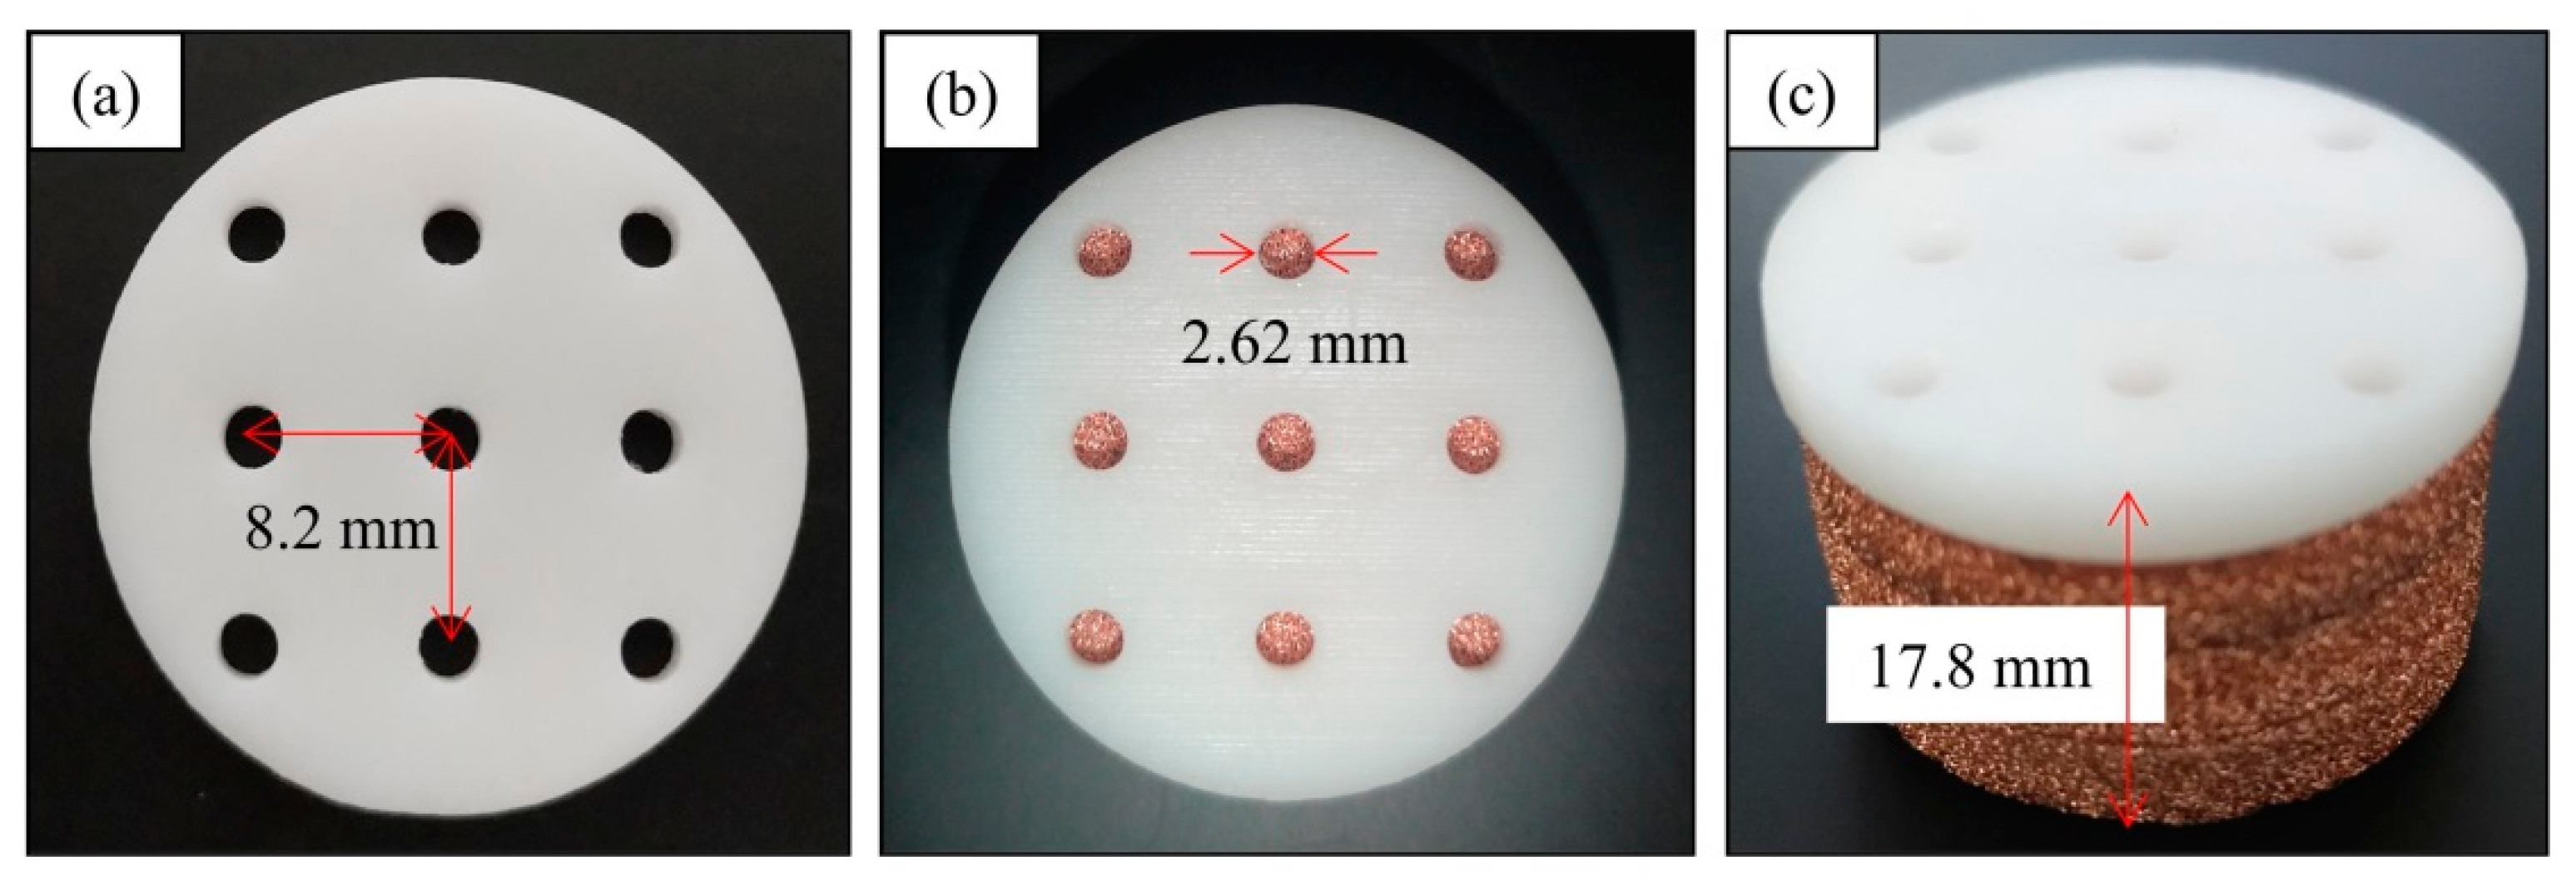
The optimized structure parameters are as follows: ϕ p p = 7.26%, L p p = 2.6, d p p = 2.6 mm, L g = 0.99 mm. The optimized PP2 was fabricated using a 3D printer, as shown in Figure 8. The PP2 specimen was accurately and perfectly formed using stereo lithography. The measured structural parameters of PP2 are listed in Table 4.
Figure 9 shows the measured and calculated results of the sound absorption coefficient of the optimized composite structure. The sound absorption coefficient curve obtained by the semi-empirical model is in good agreement with the measured results. The results show that the porosity of the perforated plate, the thickness of the perforated plate, the pore size of the perforated plate, and the thickness of the intermediate air layer have significant effects on the sound absorption performance of the entire composite structure. The maximum sound absorption coefficient appears near 1750 Hz for the OFC3 + PP1, and the maximum sound absorption coefficient appears near 1350 Hz for the OFC3 + PP2. The sound absorption peak of the optimized composite structure is shifted to the low frequency direction by 400 Hz, and the OFC3 + PP2 achieves the target of the sound absorption peak in the lower frequency band. In addition, although the overall sound absorption effect is improved in the optimized frequency range, the sound absorption effect in the higher frequency band is reduced, primarily because the optimized composite structure can be more closely matched with the acoustic impedance of the target frequency band. On the contrary, without changing the composite structure’s lining material (OFC), if the goal is to broaden the sound absorption frequency band, the composite structure with limited thickness can also achieve high-efficiency sound absorption (α > 0.5) in a wider frequency band (800~3500 Hz) through optimization. The measured results show that OFC3 + PP1 has achieved high-efficiency sound absorption in a wide frequency range of 800 to 2820 Hz, which is 720 Hz wider than the sound absorption frequency band of OFC3 + PP2, with an increase of approximately 720 / (2100 − 800) = 55.38%.

5. Conclusions

The semi-empirical model was constructed to predict the sound absorption performance of the composite structure. The theoretical calculation results are in good agreement with the measured results. The predicted and measured results show that the increase in the OFC thickness can effectively improve the sound absorption performance of the composite structure in the lower frequency band. The maximum value of the sound absorption coefficient moves to the low frequency direction.
Next, the GA is used to optimize the parameters of the composite structure. The sound absorption peak of the optimized composite structure is shifted to the low frequency direction by 400 Hz, and OFC3 + PP2 achieves the target of the sound absorption peak in the lower frequency band. On the contrary, without changing the composite structural lining material (OFC), the measured results show that OFC3 + PP1 achieves high-efficiency sound absorption in a wider frequency range, which is approximately 55.38% higher than the sound absorption bandwidth of OFC3 + PP2. When the total volume or total weight of the sound-absorbing material is strictly limited, the research work has certain guiding significance for the optimization design of the composite structure.

Author Contributions

Conceptualization, J.Z. (Junzhe Zhang), T.C., B.Z. and J.Z. (Jian Zhu); validation, J.Z. (Junzhe Zhang), T.C. and J.Z. (Jian Zhu); investigation, J.Z. (Junzhe Zhang) and J.Z. (Jian Zhu); resources, T.C. and J.Z. (Jian Zhu); writing—review and editing, J.Z. (Junzhe Zhang), T.C., B.Z. and J.Z. (Jian Zhu). All authors have read and agreed to the published version of the manuscript.

Funding

This research was funded by the Project of National Natural Science Foundation of China (Grants No. 12002258 and 51675402) and the China Postdoctoral Science Foundation (No. 2022M712540).

Institutional Review Board Statement

Not applicable.

Informed Consent Statement

Not applicable.

Data Availability Statement

Not applicable.

Conflicts of Interest

The authors declare no conflict of interest.

References

  1. Atalla, N.; Sgard, F. Modeling of perforated plates and screens using rigid frame porous models. J. Sound Vib. 2007, 303, 195–208. [Google Scholar] [CrossRef]
  2. Peng, F. Sound absorption of a porous material with a perforated facing at high sound pressure levels. J. Sound Vib. 2018, 425, 1–20. [Google Scholar] [CrossRef]
  3. Dannemann, M.; Kucher, M.; Kunze, E.; Modler, N.; Knobloch, K.; Enghardt, L.; Sarradj, E.; Höschler, K. Experimental Study of Advanced Helmholtz Resonator Liners with Increased Acoustic Performance by Utilising Material Damping Effects. Appl. Sci. 2018, 8, 1923. [Google Scholar] [CrossRef] [Green Version]
  4. Rayleigh, L. Theory of Sound II; Macmillan: London, UK, 1929. [Google Scholar]
  5. Maa, D.Y. Theory and design of Micro-perforated panel sound-absorbing constructions. Sci. Sin. 1975, 18, 55–71. [Google Scholar]
  6. Maa, D.Y. Potential of microperforated panel absorber. J. Acoust. Soc. Am. 1998, 104, 2861–2866. [Google Scholar] [CrossRef]
  7. Kang, J.; Brocklesby, M.W. Feasibility of applying micro-perforated absorbers in acoustic window systems. Appl. Acoust. 2005, 66, 669–689. [Google Scholar] [CrossRef]
  8. Lu, C.H.; Chen, W. Pilot study on compact wideband micro-perforated muffler with a serialparallel coupling mode. Appl. Acoust. 2019, 148, 141–150. [Google Scholar] [CrossRef]
  9. Mana, A.A.; Sonti, V.R. Sound radiation from a perforated panel set in a baffle with a different perforation ratio. J. Sound Vib. 2016, 372, 317–341. [Google Scholar] [CrossRef]
  10. Qian, Y.J.; Zhang, J.; Sun, N.; Kong, D.Y.; Zhang, X.X. Pilot study on wideband sound absorber obtained by adopting a serial-parallel coupling manner. Appl. Acoust. 2017, 124, 48–51. [Google Scholar] [CrossRef]
  11. Yairi, M.; Sakagami, K.; Takebayashi, K.; Masayuki, M. Excess sound absorption at normal incidence by two microperforated panel absorbers with different impedance. Acoust. Sci. Technol. 2011, 32, 194–200. [Google Scholar] [CrossRef] [Green Version]
  12. Kim, H.-S.; Ma, P.-S.; Kim, B.-K.; Kim, S.-R.; Lee, S.-H. Low-frequency sound absorption of elastic micro-perforated plates in a parallel arrangement. J. Sound Vib. 2019, 460, 114884. [Google Scholar] [CrossRef]
  13. Wang, J.G.; Rubini, P.; Qin, Q. A Porous Media Model for the Numerical Simulation of Acoustic Attenuation by Perforated Liners in the Presence of Grazing Flows. Appl. Sci. 2021, 11, 4677. [Google Scholar] [CrossRef]
  14. Lee, Y.Y.; Lee, E.W.M.; Ng, C.F. Sound absorption of a finite flexible micro-perforated panel backed by an air cavity. J. Sound Vib. 2005, 287, 227–243. [Google Scholar] [CrossRef]
  15. Laly, Z.; Atalla, N.; Meslioui, S.-A. Acoustical modeling of micro-perforated panel at high sound pressure levels using equivalent fluid approach. J. Sound Vib. 2018, 427, 134–158. [Google Scholar] [CrossRef]
  16. Duponta, T.; Leclairea, P.; Pannetonb, R.; Umnova, O. A microstructure material design for low frequency sound absorption. Appl. Acoust. 2018, 136, 86–93. [Google Scholar]
  17. Zhang, B.; Zhu, J. Static and dynamic airflow resistance properties of porous metals. In Proceedings of the ICSV20, Bangkok, Thailand, 7–11 July 2013. [Google Scholar]
  18. Cobo, P.; Espinosa, F.M. Proposal of cheap microperforated panel absorbers manufactured by infiltration. Appl. Acoust. 2013, 74, 1069–1075. [Google Scholar] [CrossRef]
  19. Yang, D.; Wang, X.; Zhu, M. The impact of the neck material on the sound absorption performance of Helmholtz resonators. J. Sound Vib. 2014, 333, 6843–6857. [Google Scholar] [CrossRef]
  20. Ruiz, H.; Cobo, P.; Dupont, T.; Martin, B.; Leclaire, P. Acoustic properties of plates with unevenly distributed macroperforations backed by woven meshes. J. Acoust. Soc. Am. 2012, 132, 3138–3147. [Google Scholar] [CrossRef] [Green Version]
  21. Liu, Z.Q.; Zhan, J.X.; Fard, M.; Davy, J.L. Acoustic properties of multilayer sound absorbers with a 3D printed micro-perforated panel. Appl. Acoust. 2017, 121, 25–32. [Google Scholar] [CrossRef]
  22. Meng, H.; Ren, S.W.; Xin, F.X.; Lu, T.J. Sound absorption coefficient optimization of gradient sintered metal fiber felts. Sci. China Technol. Sci. 2016, 59, 699–708. [Google Scholar] [CrossRef]
  23. Zhu, J.L.; Sun, J.; Tang, H.P.; Wang, J.Z.; Ao, Q.B.; Bao, T.F.; Song, W.D. Gradient-structural optimization of metal fiber porous materials for sound absorption. Powder Technol. 2016, 301, 1235–1241. [Google Scholar] [CrossRef]
  24. Zhang, B.; Chen, T.N.; Zhao, Y.Y.; Zhang, W.Y.; Zhu, J. Numerical and analytical solutions for sound propagation and absorption in porous media at high sound pressure levels. J. Acoust. Soc. Am. 2012, 132, 1436–1449. [Google Scholar] [CrossRef] [PubMed]
  25. Mareze, P.H.; Brandão, E.; Fonseca, W.D.; Silva, O.M.; Lenzi, A. Modeling of acoustic porous material absorber using rigid multiple micro-ducts network. J. Sound Vib. 2019, 443, 376–396. [Google Scholar] [CrossRef]
  26. Otaru, A.J. Enhancing the sound absorption performance of porous metals using tomography images. Appl. Acoust. 2019, 143, 183–189. [Google Scholar] [CrossRef]
  27. Zhang, B.; Chen, T.N. Calculation of sound absorption characteristics of porous sintered fiber metal. Appl. Acoust. 2009, 70, 337–346. [Google Scholar]
  28. Kim, K.H.; Yoon, G.H. Absorption performance optimization of perforated plate using multiple-sized holes and a porous separating partition. Appl. Acoust. 2017, 120, 21–33. [Google Scholar] [CrossRef]
  29. Li, D.K.; Chang, D.Q.; Liu, B.L. Enhanced low- to mid-frequency sound absorption using parallel-arranged perforated plates with extended tubes and porous material. Appl. Acoust. 2017, 127, 316–323. [Google Scholar] [CrossRef]
  30. Meng, H.; Xin, F.X.; Lu, T.J. Sound Absorption Optimization of Graded Semi-Open Cellular Metals by Adopting the Genetic Algorithm Method. J. Vib. Acoust. 2014, 136, 061007. [Google Scholar] [CrossRef]
  31. Delany, M.E.; Bazley, E.N. Acoustical properties of fibrous absorbent materials. Appl. Acoust. 1970, 3, 105–116. [Google Scholar] [CrossRef]
  32. Chung, J.Y.; Blaser, D.A. Transfer function method of measuring in-duct acoustic properties, II. Experiment. J. Acoust. Soc. Am. 1980, 68, 914–921. [Google Scholar] [CrossRef]
  33. Bai, P.F.; Shen, X.M.; Zhang, X.N.; Yang, X.C.; Yin, Q.; Liu, A.X. Influences of compression ratios on sound absorption performance of porous nickel–iron alloy. Metals 2018, 8, 539. [Google Scholar] [CrossRef] [Green Version]
  34. Soltani, P.; Azimian, M.; Wiegmann, A.; Zarrebini, M. Experimental and computational analysis of sound absorption behavior in needled nonwovens. J. Sound. Vib. 2018, 426, 1–18. [Google Scholar] [CrossRef]
  35. Zhai, W.; Yu, X.; Song, X.; Ang, L.Y.L.; Cui, F.S.; Lee, H.P. Microstructure-based experimental and numerical investigations on the sound absorption property of open-cell metallic foams manufactured by a template replication technique. Mater. Design. 2018, 137, 108–116. [Google Scholar] [CrossRef]
  36. Xu, Y.C.; Wu, J.H.; Cai, Y.Q. Study on dynamic effective parameters of bilayer perforated thin-plate acoustic metamaterials. Mod. Phys. Lett. B 2021, 35, 2150048. [Google Scholar] [CrossRef]
  37. Putra, V.G.V.; Irwan; Wijayono, A.; Mohamad, J.; Yusuf, Y. A novel theoretical modeling for predicting the sound absorption of woven fabrics using modification of sound wave equation and genetic algorithm. Autex. Res. J. 2022, 22, 108–122. [Google Scholar] [CrossRef]
  38. Ramamoorthy, V.T.; Özcan, E.; Parkes, A.J.; Sreekumar, A.; Jaouen, L.; Bécot, F.-X. Comparison of heuristics and metaheuristics for topology optimisation in acoustic porous materials. J. Acoust. Soc. Am. 2021, 150, 3164–3175. [Google Scholar] [CrossRef]
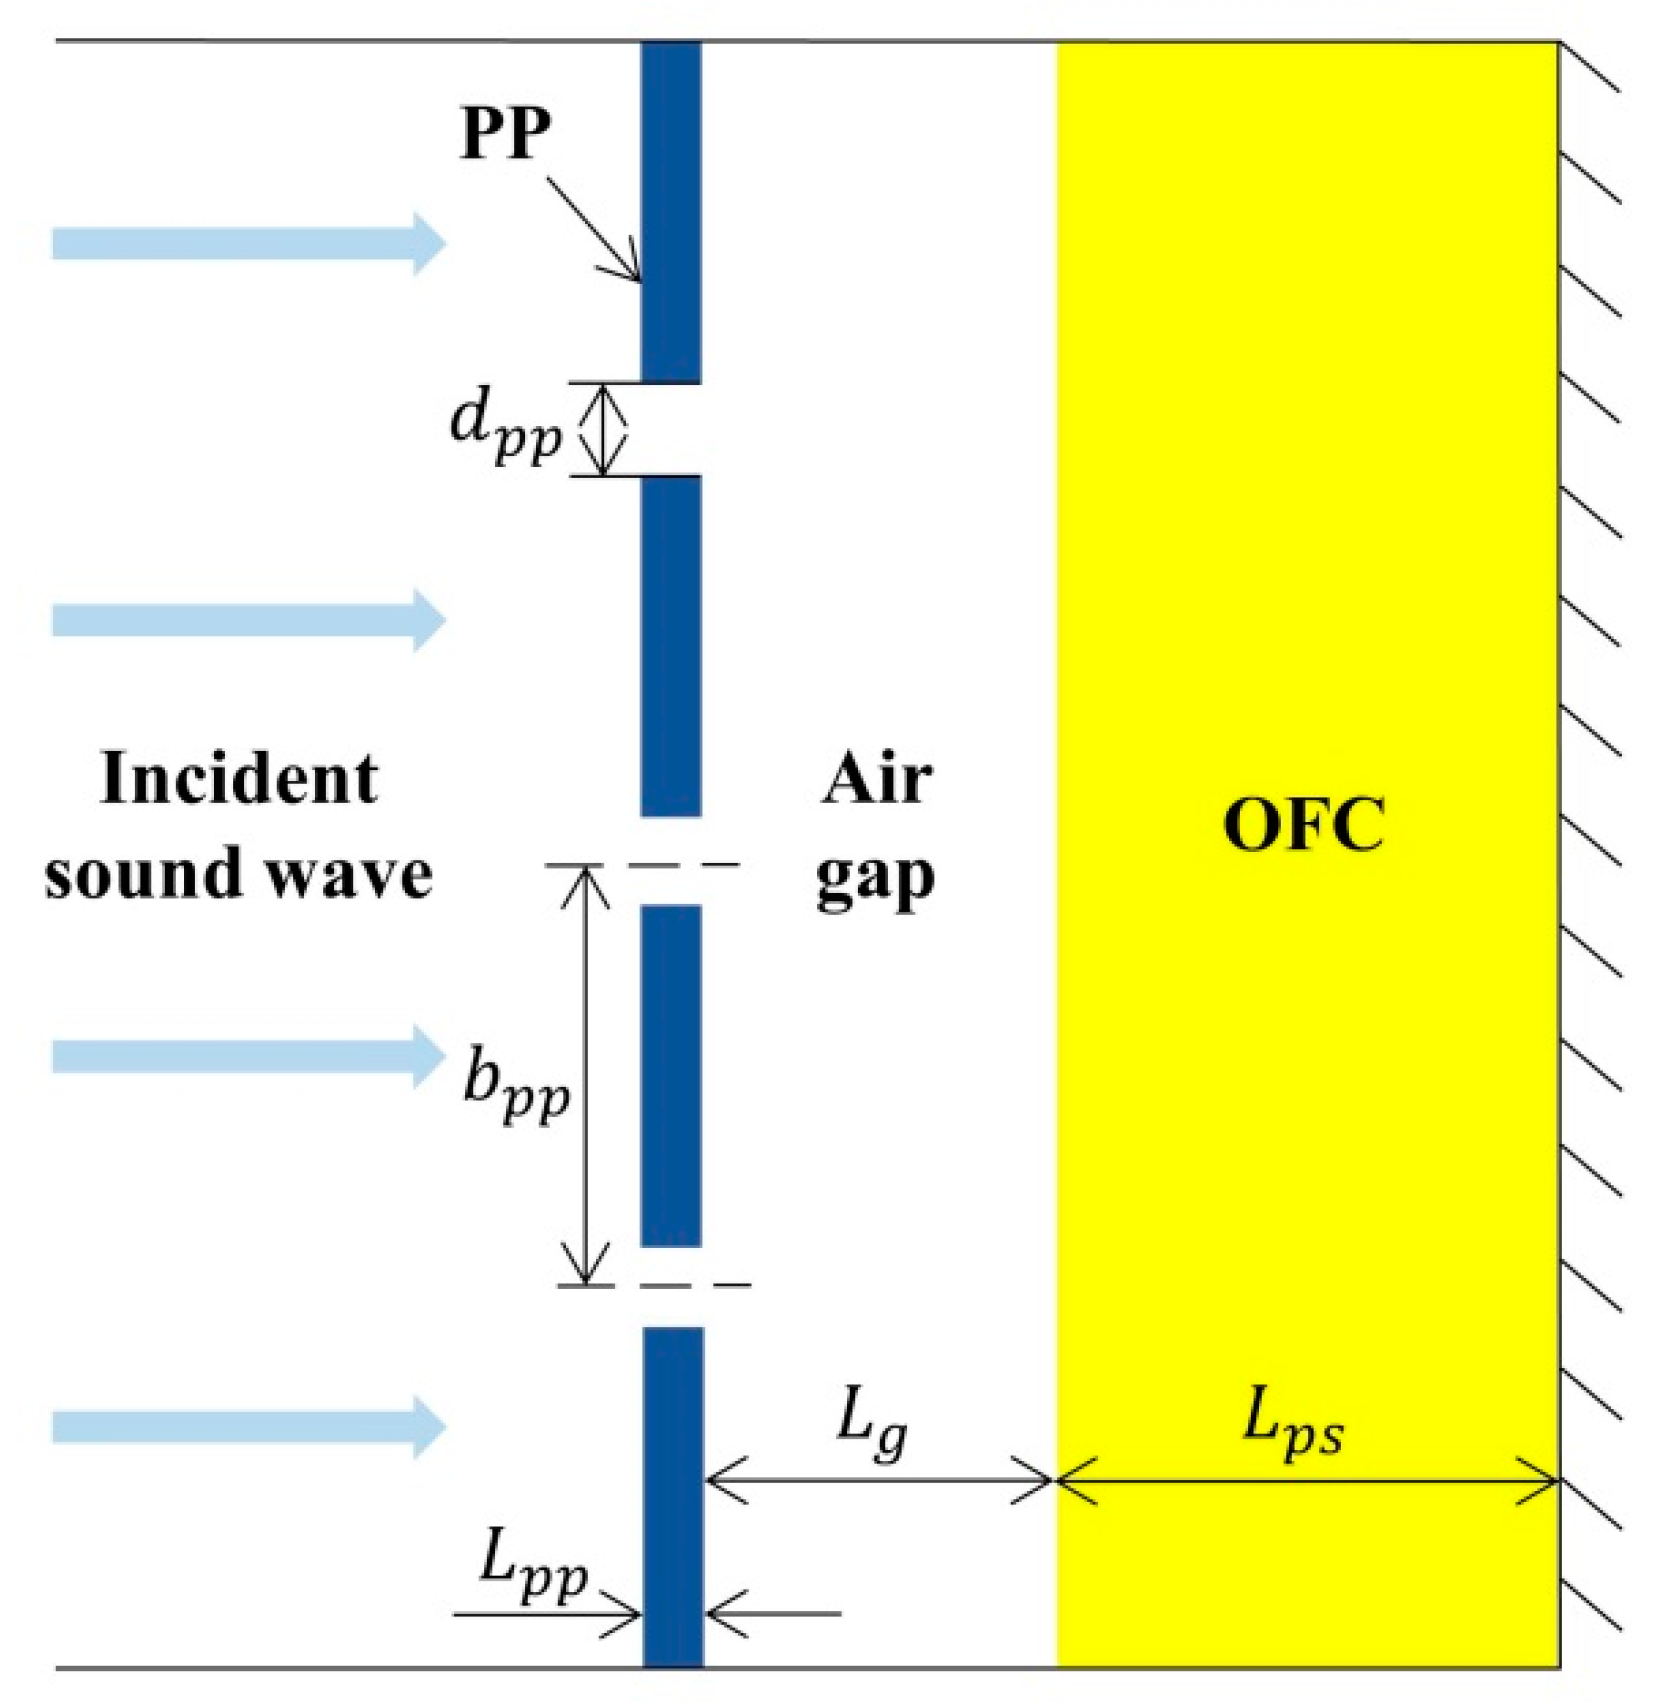
Figure 1. Schematic diagrams of composite sound-absorber structure.
Applsci 13 00078 g001
Figure 2. Physical phenomena involved in the composite sound-absorber structure: (a) the PP; (b) the composite sound-absorber structure.
Applsci 13 00078 g002
Figure 3. The surface of the OFC specimen: (a) Photograph of the OFC specimen; (b,c) SEM images of the OFC specimen.
Applsci 13 00078 g003
Figure 4. Measured results and curve fitting results of the characteristic impedance of OFC2: (a) Real part of measured results and curve fitting results of the characteristic impedance ( R Z p s = 1.11 × f 0.5859 + 655.1 ); (b) Imaginary part of measured results and curve fitting results of the characteristic impedance ( I Z p s = i × ( 8794 × f 0.5609 + 50.17 ) ).
Applsci 13 00078 g004
Figure 5. Measured results and curve fitting results of the complex wave number of OFC2: (a) Real part of measured results and curve fitting results of the complex wave number ( R k p s = 0.04482 × f 0.9229 + 1.991 ); (b) Imaginary part of measured results and curve fitting results of the complex wave number ( I k p s = i × ( 0.1032 × f 0.5992 6.626 ) ).
Applsci 13 00078 g005
Figure 6. The prepared test specimens and the impedance tube: (a) 3D printed PP sample; (b) PP1 + OFC2; (c) test specimen mounted in the impedance tube; (d) the placement order of PP1 + OFC2; (e) the B and K impedance tube.
Applsci 13 00078 g006
Figure 7. Comparison of the calculated and measured sound absorption coefficients: (a) composite structure composed of OFC1 and PP1; (b) composite structure composed of OFC2 and PP1; (c) composite structure composed of OFC3 and PP1.
Applsci 13 00078 g007
Figure 8. The optimized composite structure: (a) 3D printed PP2 sample; (b) Top view; (c) Side view.
Applsci 13 00078 g008
Figure 9. The sound absorption coefficient curve of the optimized composite structure.
Applsci 13 00078 g009
Table 1. The measured parameters for OFC test specimens.
Sample Number Porosity   ϕ p s   ( % ) Thickness   L p s   ( mm ) Specimen   Diameter   D p s   ( mm )
OFC194.94.9828.36
OFC295.19.9328.42
OFC394.814.2228.26
Table 2. The curve fitting results of OFC1 and OFC3.
NumberOFC1OFC3
R Z p s 0.21 × f 0.7758 + 675.5 0.1642 × f 0.8312 + 660.7
I Z p s i × ( 7151 × f 0.5314 + 59.78 ) i × ( 3711 × f 0.3745 + 142.7 )
R k p s 0.06653 × f 0.8892 + 0.3678 0.08001 × f 0.8576 1.045
I k p s i × ( 0.6315 × f 0.414 3.63 ) i × ( 13.85 × f 0.1331 + 21.52 )
Table 3. The measured parameters for PP1 test specimen.
Sample Number Perforation   Ratio ,   ϕ p p   ( % ) Hole   Diameter ,   d p p   ( mm ) Hole   Spacing ,   b p p   ( mm ) Plate   Thickness ,   L p p   ( mm ) Specimen   Diameter ,   D p p   ( mm )
PP16.182.025.11.0228.58
Table 4. The measured structural parameters for PP2 test specimen.
Sample Number Perforation   Ratio ,   ϕ p p   ( % ) Hole   Diameter ,   d p p   ( mm ) Hole   Spacing ,   b p p   ( mm ) Plate   Thickness ,   L p p   ( mm ) Specimen   Diameter ,   D p p   ( mm )
PP27.352.628.22.5728.62
Disclaimer/Publisher’s Note: The statements, opinions and data contained in all publications are solely those of the individual author(s) and contributor(s) and not of MDPI and/or the editor(s). MDPI and/or the editor(s) disclaim responsibility for any injury to people or property resulting from any ideas, methods, instructions or products referred to in the content.