Article

Assessment of Compressive and Flexural Properties and Stacking Strength of Expanded Polystyrene Boxes: Experimental and Simulation Study

1
Faculty of Industrial Engineering, Mechanical Engineering and Computer Science, University of Iceland, Hjardarhagi 2-6, IS-107 Reykjavik, Iceland
2
Faculty of Food Science and Nutrition, University of Iceland, Aragata 14, IS-102 Reykjavik, Iceland
3
Matis ohf., Vinlandsleid 12, IS-113 Reykjavik, Iceland
4
Sæplast Iceland ehf., Gunnarsbraut 12, IS-620 Dalvik, Iceland
*
Author to whom correspondence should be addressed.
Appl. Sci. 2023, 13(10), 5852; https://doi.org/10.3390/app13105852
Submission received: 10 March 2023 / Revised: 25 April 2023 / Accepted: 7 May 2023 / Published: 9 May 2023

Abstract

:
Expanded polystyrene (EPS) boxes are used for the packaging of perishable and vulnerable goods during transportation; for instance, fresh fish fillets. It is important to minimize the weight and cost of the packaging materials while maximizing strength to avoid damage to the packaging and the product itself. EPS boxes have to withstand considerable loading, which arises due to rough handling and stacking during transport. This work focused on the compressive and flexural properties and stacking strength of 3 kg capacity EPS boxes with densities of 22 and 23 kg/m 3 , by combining experiments and simulation. Material properties were obtained from the compression test, and the behavior of EPS boxes under stacking load was investigated through both experiments and finite element simulations. The influences of density and different sample preparation methods on material properties and stacking strength were investigated. The results indicated that, with the density increasing by 1 kg/m 3 , the initial modulus rises 10–15% and the compressive strength increases by 7–8% in the compression test, while in the flexure test, the rupture stress increases by 3–7%. Additionally, an increase of around 2% was observed for the specimens cut with a hot wire compared to those cut with a table saw. However, because the failure mechanism for a box as a whole differs from that of small units in the compression and flexure tests, density has less of an impact on stacking strength. Finally, a good agreement was obtained between the simulation and stacking strength test results.

1. Introduction

Expanded polystyrene (EPS) is a lightweight and closed-cell rigid plastic foam made from polystyrene (PS) beads. Its good thermal insulation properties with sufficient stiffness and strength under compression [1] make it an ideal material for transporting perishable foodstuffs, e.g., fresh fish, that are susceptible to temperature fluctuation [2] in the food industry. The subject of this study was a 3-kg capacity EPS box for transporting fresh fish fillets. A certain structural strength of the box is essential for holding the load of the shipment goods during transportation and decreases the probability of damage that occasionally happens during movement. Therefore, in industrial practice, manufacturers tend to use excessive raw materials to ensure structural strength. In order to minimize environmental impact, it is possible to maintain original strength while consuming less material by introducing lightweight designs using the finite element method (FEM).
FEM is a popular modern method in structural analysis and optimization. By developing a numerical model with acceptable accuracy, the predictions made from the model iterate fast and are trustworthy. Applying optimal designs in manufacturing at the first opportunity is advantageous for companies. In the FEM analysis, crucial parameters of commonly-used materials can be pulled out directly from the engineering database. However, the parameters of a material such as EPS are usually not predefined and should be derived from mechanical properties, either from the literature or through experiments. The work conducted in this study is a prelude to the structural optimization of EPS boxes.
The mechanical properties of EPS have been studied widely in the field of civil engineering regarding uni-axial and triaxial compressive properties [3,4,5,6,7] and breaking load/flexural properties [7,8,9] via quasi-static experiments. Compared to compressive properties, which directly link to the structural optimal design of EPS, flexural properties are more of an indicator of fusion between polystyrene beads [8]. Aside from quasi-static structural characteristics, dynamic structural behaviors have also been studied. For instance, EPS can be put inside helmets to absorb energy, thus protecting the human head; its dynamic compressive properties, shear strength, and behavior under impact have been investigated [10,11,12,13]. However, studies focused on the structural strength and other mechanical properties of EPS in the field of fresh fish packaging are very few.
Certain characteristics of EPS are universal, regardless of varied applications. For instance, the compressive properties of EPS are influenced by material density, strain rate, and temperature [1,
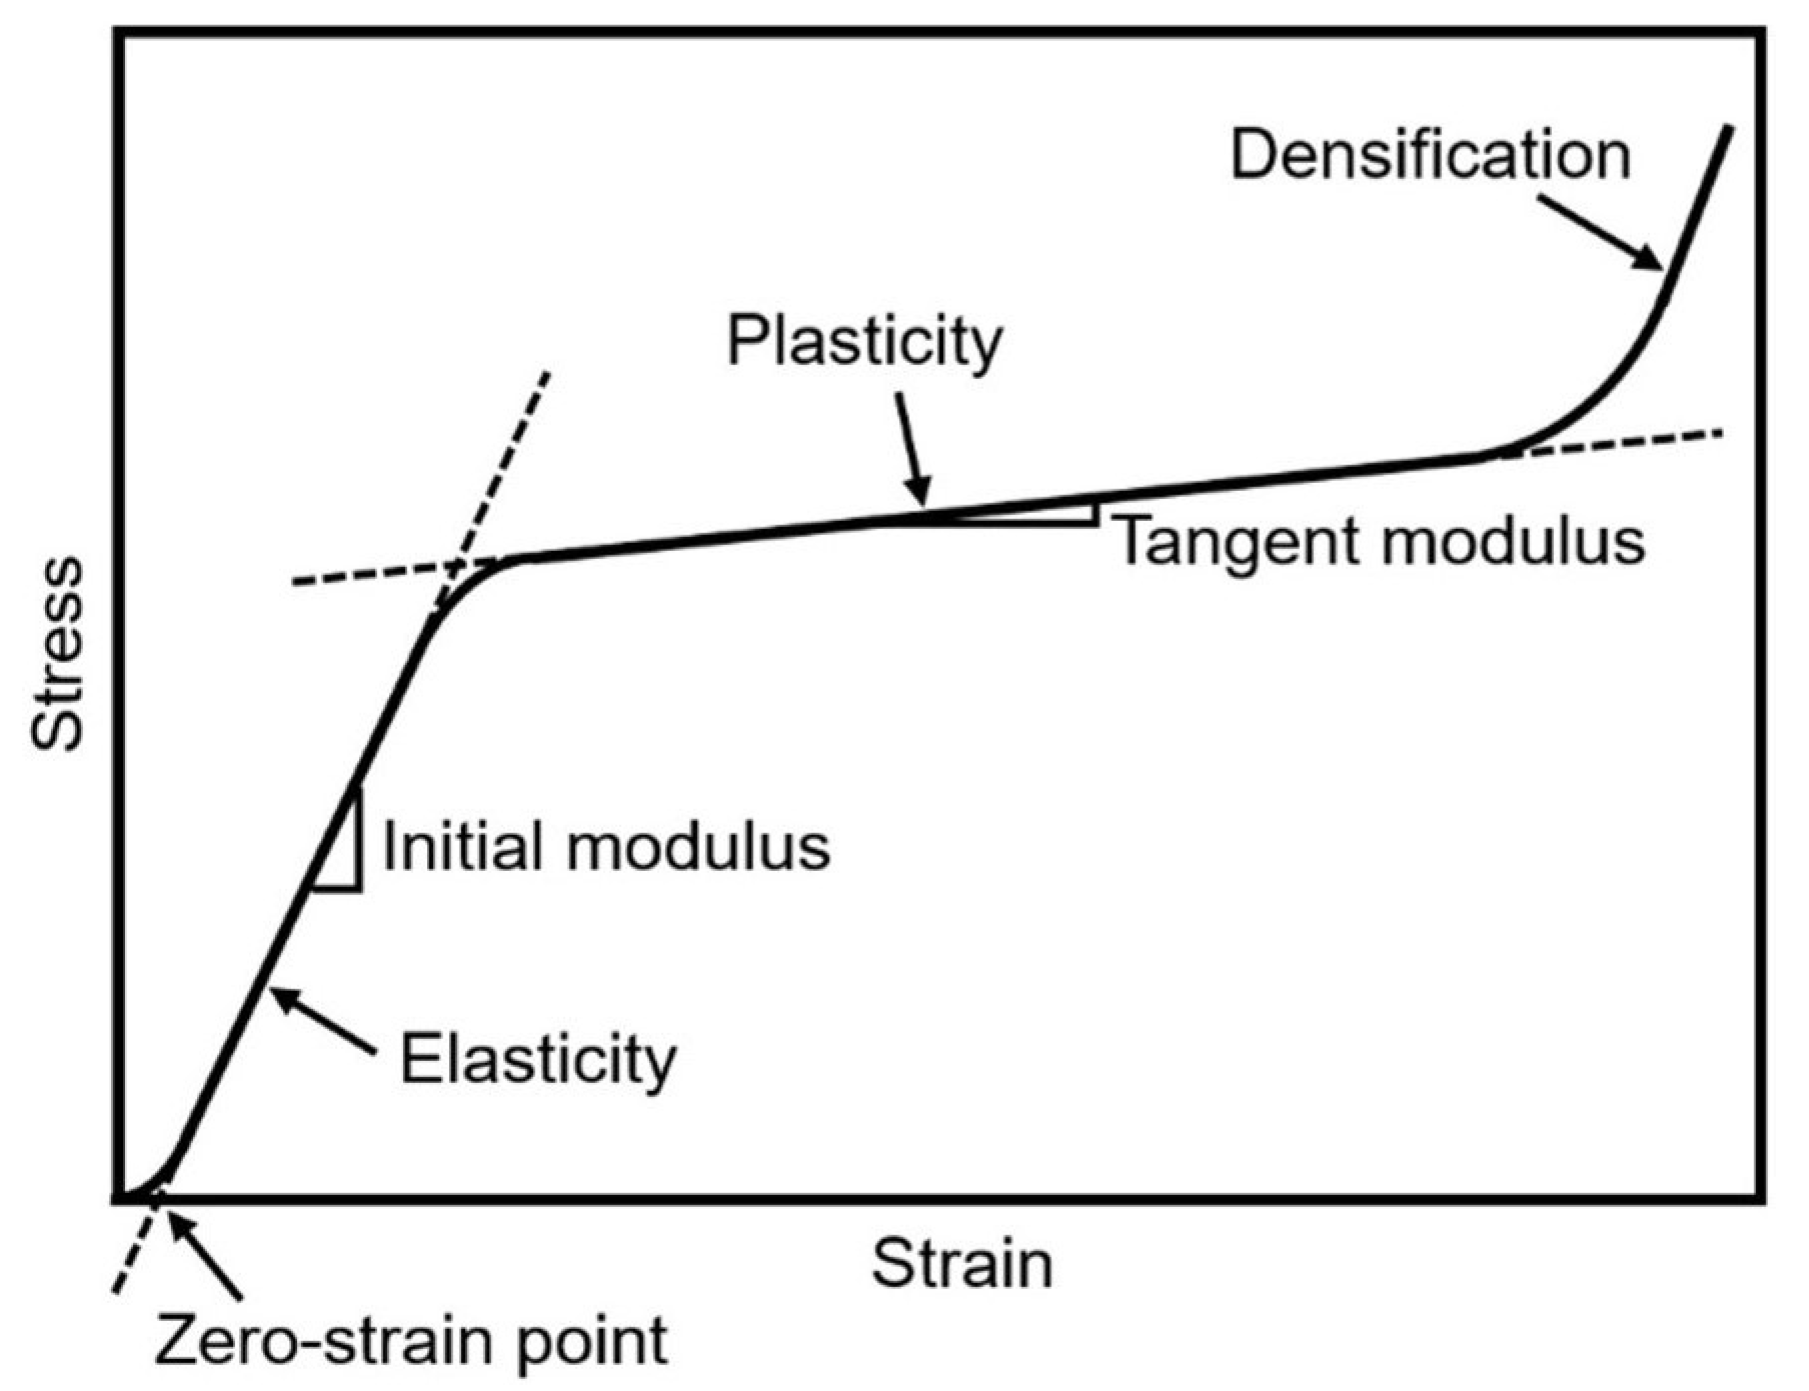
4]. The typical behavior of EPS under compression is shown in Figure 1. At the beginning stage, the material is elastic and satisfies Hooke’s law; the slope of this part is referred to as the initial modulus in this paper. A toe region usually appears before elasticity, therefore, the ASTM standard specified a method named toe compensation to correct this [14], and the modified zero-strain point is shown in Figure 1. This method was also applied in the other tests whenever a toe region emerged in this study. Then, due to bending or buckling of the closed cell walls, the initial elasticity recedes and enters a plateau zone, where plasticity takes place, and the tangent modulus is herein described. At the last stage, when most of the energy dissipates through air breakout from the closed cells and the cellular structure collapses, the material becomes more dense, and this stage is called densification. In this study, elasticity and plasticity were investigated, and initial moduli and tangent moduli were obtained, but no characteristics of densification were studied.
Multiple researchers have developed correlations relating the initial modulus or the tangent modulus to density and strain rate [15,16] and through regression analysis [4,17]. In addition to that method, Akis [18] introduced artificial neural networks to predict the initial modulus and the compressive strength values at 1%, 5% and 10% strain, and both methods yield satisfactory results with a coefficient of correlation values greater than 0.901. In terms of the compressive strength correlating to density and strain rate, Vilau [19] developed four coefficients for EPS foam with densities of 11, 15, 20 and 25 kg/m 3 under low and high strain rates. Unlike the compressive properties of EPS that have been studied extensively, investigations into flexural properties are relatively scarce. It has been discovered that, with the increase in density, the flexural strength of EPS increases, the rupture happens at smaller deformation, and the stiffness of EPS also rises [7]; Vilau [19] validated this in recent studies. In another study, the initial modulus was found to be almost 350 times greater in compression than in flexure testing, meaning this material is more suitable for the case of compression [9], although this conclusion conformed poorly with other studies [1,8,20]. Aside from flexural properties, research into tensile properties is seldom conducted and the standard test method for tensile properties of EPS is not specified in ASTM D 6817: Standard Specification for Rigid Cellular Polystyrene Geofoam [21]. Wang and David [8] designed bone-shaped tensile specimens of EPS based on ASTM D 638 and found that the ultimate tensile strength of EPS rises with density. Akin to the results in the flexure test, the stiffness rises along with the increase in the density of EPS. However, ASTM D 638 was originally developed for rigid plastics with higher density and without cellular structures; for this reason, variances might be caused in the final results. ASTM has provided another standard—ASTM D1623: Standard Test Method for Tensile and Tensile Adhesion Properties of Rigid Cellular Plastics [22]—which is supposed to be more appropriate for the material. Zouzias [23] performed lengthy experiments to characterize the tensile behavior of EPS foams of densities ranging from 60–120 kg/m 3 and verified that the tensile strength also rises with the increase of strain rates and density. Apart from fundamental mechanical properties investigation, Ellouze [24] carried out a heat treatment process on EPS foams and enhanced the hardness. Nevertheless, the mechanical properties test for the treated and non-treated EPS foam followed different standards, which could impair the comparability of experimental results.
Several papers related to the topic of this investigation, specifically the 3 kg capacity EPS boxes, may offer valuable insights. In an article from Mai et al. [25], the staggered pattern of stacking up the 3 kg capacity EPS boxes was illustrated and further inspired the test for the stacking strength of the boxes. Margeirsson [26] tested the stacking strength of EPS boxes with a shipment capacity of between 3 and 25 kg and obtained the maximum stacking load from 11 types of boxes provided by Tempra (Tempra: EPS manufacturer in Hafnarfjordur, Iceland). It was found that the smallest boxes (capacity 3 kg) had relatively higher safety factors compared to larger boxes. This finding indicates that there is room for improvement on smaller boxes, which motivated this study. Helgason [27] tested the strength of EPS boxes with a capacity of 23 kg under three different load conditions and then used FEM to simulate lightweight design ideas, including changing the radius of rounding on edges, and thin either the bottom or the lid. However, there is uncertainty remaining in the lightweight design of Helgason’s study on account of the material parameters derived from the equations in the literature. In particular, Young’s modulus has considerable variance compared to obtaining it from the experiment.
In this study, compression and flexure tests were performed on specimens sampled from the EPS boxes manufactured by Tempra, as well as stacking strength and bottom strength tests on the boxes as a whole to study the behavior of 3 kg EPS boxes with densities of 22 and 23 kg/m 3 . The data obtained in the compression test were used as material parameters in a finite element model of the EPS boxes under stacking load; the simulation outcomes were then compared with the experimental results.

2. Materials and Methods

2.1. Mechanical Properties

2.1.1. Test Setups

Specimens sampled from the bottom of EPS boxes were used in the uni-axial compression and flexure tests. The test setups were prepared as per ASTM D 1621-00 [14] and ASTM C 203-05a [28], respectively. The flexure test complied with Test Method I in ASTM C 203, commonly known as the 3-point bending test. The tests were quasi-static and conducted in the plant of Tempra on a software-controlled single-column Mecmesin (Mecmesin: A provider of force, materials, and torque testing solutions in West Sussex, United Kingdom) OmniTest series force testing instrument, as shown in Figure 2a. The capacity of the instrument is 5 ± 0.5% kN, with a resolution of 1:50,000.
It comes with two sets of testing frames, one for a compression test, as shown in Figure 2b, and the other for a flexure test, as shown in Figure 2c.
The displacement rate for compression and flexure tests was set to one-tenth of the thickness of the specimen; in this case, 2.0/2.2 mm/min. In the compression test setup, the area of the cross-head and support was a 50 mm × 50 mm square aluminum alloy flat plate, and the cross-head was self-adjustable to guarantee uniformly distributed load. The flexure test was a 3-point bending setup and the diameter of supports and loading fittings was 30 mm, while the support span was set to 10 times the thickness; in this case, 200/220 mm, depending on the thickness. In the compression test, the cross-head actuated until 15% of its original thickness, while in the flexure test, the cross-head motion was stopped when the specimen ruptured.

2.1.2. Specimen Preparation and Conditioning

Specimens were sampled from boxes with nominal densities of 22 and 23 kg/m 3 provided by Tempra. The cross-sectional area of specimens used in the compression test was 50 mm × 50 mm and the thickness was 22 mm within a precision of ±3%. For the flexure test, the key was to maintain the aspect ratio of specimens; the ratio for thickness-to-width-to-length was 1:4:12. Five specimens were used in the compression test and four specimens in the flexure test. A total of 54 specimens were prepared from the bottom of EPS boxes; 30 for the compression test and 24 for the flexure test. As it was impossible to achieve the height with a minimum of 25 mm specified in ASTM D 1621, two-thirds of the specimens preserved their original thickness and were only cut on four lateral sides, marked as EPS22 and EPS23. ASTM D 1621 suggested preparing specimens with a band saw or any method involving the use of abrasives; however, in industrial practice, specimens cut with a hot wire are commonly adopted due to their convenience. The major difference between the two methods is how they affect the surface; hot-wire cutting will cut through the material by fusing the plastic in contact, hence creating surface tension, which is likely to affect testing results, while cutting with a fine table saw will not. The two cutting methods are demonstrated in Figure 3.
To further study the influence of cutting methods, one-third of the specimens were cut on all six faces and therefore consumed 1 mm from the top and bottom areas, resulting in a final thickness of 20 mm, marked as EPS22*. A summary of specimen specification is shown in Table 1. The sampling process of this test can be further improved by referring to the ASTM sampling practice.
All specimens went through conditioning in a standard laboratory atmosphere in accordance with Procedure A of ASTM D 618-13 for not less than 88 h prior to testing [29]. Saturated M g ( N O 3 ) 2 solution was placed in a transparent plastic container to create a closed space with constant humidity of 50 ± 5% [30], and a UX100-011A Temp/RH data logger from Onset (Onset: Company specialized in the data logger and monitoring solution in Bourne, USA) was placed inside to monitor if the temperature was 23 ± 2 °C. All specimens were laid on a wire screen frame that was lifted up for over 25 mm to obtain adequate air circulation on all sides. The conditioning environment could be improved by replacing the container with an automatically controlled environmental test chamber.

2.2. EPS Box Strength Tests

2.2.1. Testing Setups

The apparatus used in these quasi-static tests was an Instron 8800 4-pillar hydraulic press machine controlled by WaveMatrix software, equipped with a 20 kN/10 kN static/dynamic load cell from Instron. Plates and supports were made by hand to accommodate the dimension of the boxes and exert uniformly distributed load over contacting surfaces, while a tailored resin cap wrapped the end of the cross-head, protecting the top plate from stress concentration. The displacement rate was set to 2.5 mm/s and the cross-head moved downwards by 50 mm. Once the box ruptured and the pressing force started dropping, the cross-head motion stopped. Stacking strength test and bottom strength test setups are shown in Figure 4.

2.2.2. Testing Specimens

EPS boxes from Tempra, with a 3 kg fish fillet capacity and 6.1 L volume capacity, were used in this study. Boxes in the exact same dimensions with nominal densities of 22 and 23 kg/m 3 were tested, namely EPS-B22 and EPS-B23. In addition, in an attempt to reduce the weight of boxes with a density of 23 kg/m 3 , 4 mm were shaved off the bottom with a hot wire and included in the experiment, denoted herein as EPS-B23X. Five boxes from each category were tested. The actual weights of the boxes without lids were 0.110 kg and 0.115 kg for 22 and 23 kg/m 3 , respectively, and the volume was 0.0048 m 3 according to the 3D CAD model. Hence, the actual densities were 22.7 and 23.8 kg/m 3 , respectively; the lid was 0.05 kg and 0.002 m 3 , which gave its measured density 24.1 kg/m 3 . The details of the EPS boxes in the experiment are shown in Table 2. The geometry and dimensions of EPS boxes are shown in Figure 5.

2.3. Numerical Simulation Analysis

Creo Parametric 8.0 and Ansys 2022R1 [31] were used for 3D modeling and finite element analysis of EPS boxes under stacking load. The simulation analyzed three cases, namely Sim22, Sim23, and Sim23X, corresponding to test groups EPS-B22, EPS-B23, and EPS-B23X in the stacking strength test. Two types of materials were defined in Ansys—namely EPS 22 and EPS 23—corresponding to densities of 22 and 23 kg/m 3 . Both materials were set as isotropic elastic with bilinear kinematic hardening in terms of elastic and plastic properties. The material parameters used in the simulation, except for density and Poisson’s ratio, were derived from experimental results. The parameters are given in Table 3. Note that if the Young’s modulus and the tangent modulus were derived from literature, the values would deviate far from those of the experimental results. The 3D models were engineered in the static structural analysis component to reproduce the quasi-static stacking loading test. To shorten the time of calculation, only a quarter of the box was simulated and symmetrical boundary conditions were applied as shown in Figure 6a. Two rigid plates covered top and bottom surfaces in an imitation of evenly distributed load, and supports were modeled as individual entities.
In pre-processing, virtual topology was approached to generate high-quality mesh, as shown in Figure 6b. Small features such as rounding were stitched to the adjacent surfaces to avoid skewness caused by size mismatch. In meshing, physical preference was set to nonlinear mechanical, and quadratic elements were used. Furthermore, the hex-dominant method, body sizing, face sizing, and contact sizing were applied. The element size was 4 mm, and a total of around 40,000 elements were generated in each case. The average mesh quality was controlled above 0.85, and the mesh is shown in Figure 6c; since the plates were rigid bodies, automatically-generated mesh was only used on the contact surfaces instead of overall.
The box body and the lid were assigned as either EPS 22 or EPS 23, whilst the top and bottom plates were always structural steel with rigid behavior. There were three pairs of contact in the model—top plate and lid, lid and box body, box body, and bottom plate. To stabilize the calculation, penetration tolerance, normal stiffness, and stabilization damping factor were set up in contact pairs. The bottom plate was fixed to the ground, whilst the top plate was set as a translational joint and was moved downwards by 10 mm, imitating the setup of the experiment. In static structural analysis, a simulation may have convergence problems if the deformation is too high and the elements become highly distorted. At 10 mm displacement of the top plate, the boxes had already yielded and plastic strain occurred, which was sufficient for making comparisons with experimental results. Therefore, considering calculation efficiency and practical needs, the top plate was set to move 10 mm downwards.
Auto time stepping, large deflection, and quasi-static solution were switched on to approach faster convergence. In addition, the displacement of the top plate was divided into a number of incremental steps. The elapsed time for calculating each case was 22 h.

3. Results and Discussion

3.1. Mechanical Properties Test

3.1.1. Compression Test

Figure 7 and Table 4 show averaged curves and compressive stresses at 10% strain from the uni-axial compression test of EPS, with densities of 22 and 23 kg/m 3 . In this paper, it was universally applied that if there were two values in one cell, they represented results obtained from specimens cut with a hot wire and with a table saw, respectively. Values in parentheses always represent standard deviation based on a sample.
EPS23 exhibited a higher compressive strength and initial modulus than EPS22. Compared to EPS22, EPS23 was 8.2% stronger in compressive strength if cutting with a hot wire and 7.4% stronger if cutting with a table saw. Initial moduli were 14.9% higher and 10.3% higher for cutting with a hot wire and with a table saw, respectively. However, all test groups observed the second tangent modulus to be parallel.
Comparing EPS22 with EPS22*, the compressive strength curves were observed to overlap in the plateau region but the initial modulus increased with specimen thickness, both in cases of cutting with a hot wire and with a table saw. The initial moduli of EPS22 were 22.2% higher and 26.8% higher than EPS22* for cutting with a hot wire and with a table saw, respectively. This indicated that the thickness of specimens affected the initial modulus and did not influence tangent modulus and compressive strength.
Specimens cut with a hot wire exhibited higher compressive strength than cutting with a table saw in all test groups. For EPS23, the compressive strength of specimens cut with a hot wire was 2.6% higher and, for EPS22 and EPS22*, these values were 1.8% and 1.9%, respectively. Although the validity of the correlation below was likely to be compromised because of inadequate data source, the compressive strength increment of the specimen due to cutting with a hot wire in correlation to the density was put forward here for future reference.
Δ σ / σ × 100 % = 0.8 ρ 15.8 ,
where Δ σ refers to the increment of compressive strength σ in kPa and ρ is the density of EPS in kg/m 3 .
Based on the observation of standard deviation values and error bars from Table 4, the results of specimens cut with a hot wire were more variable than those cut with a table saw. This indicated that the methods of preparing specimens affected the compressive strength of EPS to some extent. If specimens were cut with a hot wire, the compressive strength was roughly around 2% higher than using a table saw. Apart from compressive strength, the initial moduli appeared close to each other in the two methods of preparation, and the major difference was that specimens cut with a table saw yielded earlier than those with a hot wire. Nevertheless, there appeared to be a minor influence on Young’s modulus when a different method of preparation was applied.
In previous studies, the compressive strength of EPS was most frequently tested in material property investigation. The comparison of this study’s results with experimental results reported in the literature for the last 10 years is listed in Table 5. Results from adjacent densities (19, 20, 22 and 25 kg/m 3 ) were gathered hereinafter. According to ASTM D6817, compressive resistance at 10% strain for EPS19 and EPS22 was required to be at least 110 kPa and 135 kPa, respectively. The data from the literature, including this study, generally varied around these values. That the compressive strength from this study appears to be slightly higher than the others could be a result of higher measured density.

3.1.2. Flexure Test

The results of the flexure tests are shown in Figure 7c,d and Table 4. As with the compression test, each curve represents the averaged results of each test group. In addition, the asterisks denoting the results of specimens cut with a hot wire and dots representing those cut with a table saw were plotted to display the maximum stress values of four specimens in each test group. This section also studied the influences of density, specimen size, and cutting method, as in the compression test. In ASTM C203, the stress at rupture was named modulus of rupture, which could be easily confused with the initial modulus; hence it was denoted herein as rupture stress.
The rupture stress rises with its density; EPS23 was 7.4% higher than EPS22 if specimens were cut with a hot wire and 3.6% higher if cut with a table saw. With higher density, the material appeared to be brittler, as it ruptured at a lower strain level. The initial modulus of EPS23 was 25.8% higher and 20.3% higher than EPS22 for hot-wire-cut and table-sawed specimens, respectively.
A comparison between EPS22 and EPS22* showed that the size of the specimen displayed a minor influence in rupture stress and strain at rupture. However, when cut with a hot wire, EPS22* specimens displayed stronger behavior under flexure. Specimens in this group ruptured at similar strain levels but yielded at about 15% higher stress than the others. Connected to the compression test results, one theoretical explanation was that, when cut with a hot wire, a layer of extra thin coating formed in the cutting process with PS beads fused at a high temperature. This coating possessed the high tensile strength of a PS thin film, whereas the strength increased. Considering the difference between cutting methods, apart from abnormal results in EPS22*, the cutting method inconsiderably affected the initial modulus and rupture stress when original surfaces were preserved or cut with a table saw in EPS22. The rupture stress of specimens cut with a hot wire was 2.8% higher than those with a table saw in EPS23. In the flexure test, 3-point bending was adopted in this study. Nevertheless, this was only for the modulus of rupture instead of flexural strength, on account of failure produced by a high shear stress component rather than a simple tension/flexural failure [28]. Hence, 4-point bending is recommended for investigating flexural strength in future studies.

3.2. EPS Box Strength Study

3.2.1. Stacking Strength Test

Load-deformation curves obtained from the stacking strength test and simulation results of three models corresponding to EPS boxes in test groups were plotted in a single graph, as shown in Figure 8a. Load values at 10 mm displacement from simulation and experiments were extracted, together with the maximum load values from experiments, as shown in Figure 8b and Table 6. The stacking strength of a box herein is defined as the maximum load the box withstands.
In compression and flexure tests, EPS23 exhibited higher strength than EPS22. Consequently, the stacking strength of EPS-B23 was 2.7% higher than EPS-B22 and slightly brittler. In the simulation, it was 7.9% higher. The difference in stacking strength test results was not as large as in mechanical properties tests since more factors affect the whole box’s strength. Unexpectedly, the stacking strength of EPS-B23X was 10.5% higher than EPS-B23, and the load pattern was slightly different; there was a visible rise in load after experiencing a considerable plateau region for some time, which was not observed in EPS-B23.
The simulation results were always slightly higher in comparison between simulation results and experiment results. Considering the load at 10 mm deformation, Sim22 was 0.1% higher than EPS-B22, and Sim23 was 5.8% higher than EPS-B23; the difference between Sim23X and EPS-B23X was 2.2%. Buckling was observed in both experimental and simulation results; the instability that occurred on the walls could be the principal cause of the failure of the boxes.
Equivalent stress distribution and locations of plastic strain across the body, under the same stacking load of 4.5 kN, are shown in Figure 9. Sim22 was observed to be the one with the largest equivalent stress and had the most plastic strains, while Sim23X was the smallest and least. In the contour plots of Sim22 and Sim23, there was a strained area visibly yellow here, nearly 45 degrees to the ground, while Sim23X had no such pattern. This was probably caused by rounding on the bottom edges and awaits further investigation. The equivalent stress was observed to be most evenly distributed in Sim23X, and the maximum stress on the short side wall and the long side wall were the smallest among all boxes. Compared to Sim23X, the maximum stress on the short side wall of Sim23 was 3.1% higher and 5.0% higher on the long side wall. Sim22 was the one with the highest equivalent stress; its maximum values were 0.176 MPa and 0.181 MPa on the short side wall and the long side wall, respectively; 7.3% higher and 7.7% higher than that of Sim23.
Plastic strain values are illustrated at five points in the contour plots. From left to right, take three points in the middle of the inner wall—denoted herein as Mid 1, 2, and 3—and two points on the bottom edge—denoted herein as Botm 1 and 2. The values are summarized in Table 7. Sim22 had higher plastic strain across the body; in the middle area, it nearly tripled compared to Sim23, while it was doubled compared to Sim23 on the bottom edges. This indicates that the box with a density of 22 kg/m 3 was more susceptible to external force and strained more. Even though Sim23X was 4 mm thinner on the bottom than Sim23, it had less plastic strain across the body, roughly half of Sim23 in the middle and one-quarter to one-third of Sim23 on the bottom edges. This means that reducing the wall height of the box or using smaller rounding could somehow augment the capability of withstanding stacking load.

3.2.2. Bottom Strength Test

Load versus displacement curves obtained from the bottom load test are presented in Figure 8c, and the averaged breaking loads are shown in Figure 8d with error bars. The breaking load and corresponding deformation are displayed in the last two columns of Table 6.
Non-intuitively, the bottom strength of EPS-B23 varied −10.3% compared to EPS-B22. The cause could be worse fusion in this batch of EPS boxes with a density of 23 kg/m 3 . Nonetheless, EPS-B23 was 22.6% higher in maximum breaking load than EPS-B23X. Boxes with higher maximum load also break at larger deformation, and there was no plateau region when testing bottom strength. The failure pattern in the bottom strength test was different from that in the stacking strength test; the boxes failed promptly once they reached their elastic limits without experiencing plasticity.

4. Conclusions

Specimens sampled from the bottom of EPS boxes with a capacity of 3 kg were used in the uni-axial quasi-static compression test and flexure test, and EPS boxes with densities of 22 and 23 kg/m 3 were involved. The data obtained from the compression test were used as material parameters in the following FEM analysis simulating EPS boxes under stacking; the results of the FEM analysis were then compared with the results of the stacking strength test performed in this study. In addition, as one of the constraints for the future optimal design, the bottom strength of EPS boxes was examined.
In the mechanical properties test, the compressive strength and flexure strength were primarily influenced by density. Roughly an 8% rise in compressive strength was observed in EPS23 compared to EPS22, and the initial modulus had around a 10–15% rise. However, the specimen’s size and the preparation method had a minor influence on the compression and flexure tests. Specimen size did not affect the compressive strength and tangent modulus in the compression test; there was only a 20% rise in the initial modulus of the compression test if specimens were 2 mm thicker, and it affected almost nothing in the flexure test. As for the method of preparation, around 2% higher stress was observed in the results of specimens cut with a hot wire in most test groups.
The difference was not as distinct as in the compression and flexure tests when the boxes were tested as a whole. In the stacking strength test, with density increased by 1 kg/m 3 , there was a 2.7% increase in load when breaking the box. The corresponding number was −10.3% for the bottom strength test. It is not necessarily that density affected the strength of EPS deeper in compression and flexure tests than in strength tests as a whole. The most plausible explanation is that EPS boxes with a density of 23 kg/m 3 used in whole-box tests were of inferior quality. An attempt to make the structure of the box lighter was also investigated in the stacking strength test and the bottom strength test. With 4 mm material shaved by a hot wire from the bottom, the rounding on the bottom edge was almost eliminated, whilst the walls were shorter, and this difference gave an 8.8% and 5.1% rise at 10 mm deformation in the stacking strength experiment and simulation, respectively. Meanwhile, the bottom strength decreased by 20.4% if 4 mm thick material was shaved off. This suggested that it was possible to consume less material and improve the stacking strength merely through topological modifications; however, bottom strength might be impaired. For now, the wall shortening that increased the critical force in buckling or the radius change of the foot corner could be the underlying cause of the improvement in stacking strength with the 4 mm material removed from the bottom of EPS boxes.
The simulation results of the EPS boxes were in good agreement with the experimental results, indicating that the material parameters obtained from experiments and then included in the simulation material model were capable of delivering a satisfactorily accurate prediction. As mechanical properties could be varied to a remarkable extent if derived from the literature, for the accuracy of simulation, performing mechanical properties tests for the particular EPS is highly recommended. In future work on optimal lightweight designs of the box, the numerical model developed in this study will be an important tool.
As for the method of preparing specimens, cutting with a table saw complied with the methods of specimen preparation suggested in ASTM D1621 and presented better results in conformance statistically. However, cutting with a hot wire was acceptable if the specimens’ tension and compression sides were preserved as original surfaces, especially in a flexure test. Therefore, adopting the methods depends on specific demands. Additionally, to determine the safety factor of a brittle material in FEM analysis, a tensile test may be conducted. Despite testing on a specimen sampled from an EPS box or on the box as a whole, taking EPS boxes from different batches would be better for the sampling process in the future if possible. During the movement of EPS boxes inside the cold chain, the boxes are occasionally under high impact. Therefore, energy absorption properties can be further studied. As FEM is an efficient and powerful tool in reproducing and predicting behaviors of structures, the parameters could be modified by simulating the bending of the material. An even more precise model could probably be developed for more accurate prediction.

Author Contributions

Conceptualization, Z.L., F.J. and B.M.; Data curation, Z.L.; Formal analysis, Z.L.; Funding acquisition, B.M.; Investigation, Z.L.; Methodology, Z.L., F.J. and B.M.; Project administration, S.A. and B.M.; Resources, F.J., S.A. and B.M.; Software, Z.L.; Supervision, F.J., S.A. and B.M.; Validation, Z.L.; Visualization, Z.L.; Writing—original draft, Z.L.; Writing—review & editing, Z.L., F.J. and B.M. All authors have read and agreed to the published version of the manuscript.

Funding

This research was funded by Icelandic Food Innovation Fund grant number ANR21060110.

Institutional Review Board Statement

Not applicable.

Informed Consent Statement

Not applicable.

Data Availability Statement

The data presented in this study are available on request from the corresponding author.

Acknowledgments

The mechanical properties tests and strength tests were conducted in Tempra and the University of Iceland, respectively. The authors would like to acknowledge the contributions of the company and faculty: Vilhjálmur Ívar Sigurjónsson and Egill Arnar Valsson for their assistance in experiments, and Jón F. Hjartar for his help in providing testing instruments and EPS boxes. The authors would also like to express their gratitude to the Icelandic Food Innovation Fund.

Conflicts of Interest

The authors declare no potential conflict of interest.

Abbreviations

The following abbreviations are used in this manuscript:
EPSExpanded Polystyrene
PSPolystyrene
FEMFinite Element Method

References

  1. Elragi, A.F. Selected Engineering Properties and Applications of EPS Geofoam; State University of New York College of Environmental Science and Forestry: New York, NY, USA, 2000. [Google Scholar]
  2. Margeirsson, B.; Gospavic, R.; Pálsson, H.; Arason, S.; Popov, V. Experimental and numerical modelling comparison of thermal performance of expanded polystyrene and corrugated plastic packaging for fresh fish. Int. J. Refrig. 2011, 34, 573–585. [Google Scholar] [CrossRef]
  3. Duškov, M. Materials research on EPS20 and EPS15 under representative conditions in pavement structures. Geotext. Geomembranes 1997, 15, 147–181. [Google Scholar] [CrossRef]
  4. Ossa, A.; Romo, M. Micro-and macro-mechanical study of compressive behavior of expanded polystyrene geofoam. Geosynth. Int. 2009, 16, 327–338. [Google Scholar] [CrossRef]
  5. Padade, A.H.; Mandal, J. Behavior of expanded polystyrene (EPS) geofoam under triaxial loading conditions. Electron. J. Geotech. Eng. 2012, 17, 2542–2553. [Google Scholar]
  6. Birhan, A.; Negussey, D. Effects of confinement on the stress-strain behavior of EPS geofoam. In Ground Improvement and Geosynthetics; American Society of Civil Engineers (ASCE): Reston, VA, USA, 2014; pp. 536–546. [Google Scholar] [CrossRef]
  7. Beju, Y.; Mandal, J. Expanded polystyrene (EPS) geofoam: Preliminarycharacteristic evaluation. Procedia Eng. 2017, 189, 239–246. [Google Scholar] [CrossRef]
  8. Wang, C.; Arellano, D. Are the Mechanical Properties of Recycled-Content Expanded Polystyrene (EPS) Comparable to Nonrecycled EPS Geofoam? In Proceedings of the Geo-Congress 2014: Geo-characterization and Modeling for Sustainability, Atlanta, GA, USA, 23–26 February 2014; pp. 3506–3515. [Google Scholar] [CrossRef]
  9. Arun Solomon, A.; Hemalatha, G. Characteristics of expanded polystyrene (EPS) and its impact on mechanical and thermal performance of insulated concrete form (ICF) system. Structures 2020, 23, 204–213. [Google Scholar] [CrossRef]
  10. Di Landro, L.; Sala, G.; Olivieri, D. Deformation mechanisms and energy absorption of polystyrene foams for protective helmets. Polym. Test. 2002, 21, 217–228. [Google Scholar] [CrossRef]
  11. Krundaeva, A.; De Bruyne, G.; Gagliardi, F.; Van Paepegem, W. Dynamic compressive strength and crushing properties of expanded polystyrene foam for different strain rates and different temperatures. Polym. Test. 2016, 55, 61–68. [Google Scholar] [CrossRef]
  12. Ling, C.; Ivens, J.; Cardiff, P.; Gilchrist, M.D. Deformation response of EPS foam under combined compression-shear loading. Part I: Experimental design and quasi-static tests. Int. J. Mech. Sci. 2018, 144, 480–489. [Google Scholar] [CrossRef]
  13. Ling, C.; Ivens, J.; Cardiff, P.; Gilchrist, M.D. Deformation response of EPS foam under combined compression-shear loading. Part II: High strain rate dynamic tests. Int. J. Mech. Sci. 2018, 145, 9–23. [Google Scholar] [CrossRef]
  14. ASTM D1621; Standard Test Method for Compressive Properties of Rigid Cellular Plastics. ASTM: West Conshohocken, PA, USA, 2000.
  15. Khalaj, O.; Siabil, S.M.A.G.; Tafreshi, S.N.M.; Kepka, M.; Kavalir, T.; Křížek, M.; Jeníček, Š. The experimental investigation of behaviour of expanded polystyrene (EPS). IOP Conf. Ser. Mater. Sci. Eng. 2020, 723, 012014. [Google Scholar] [CrossRef]
  16. Cronin, D.; Ouellet, S. Low density polyethylene, expanded polystyrene and expanded polypropylene: Strain rate and size effects on mechanical properties. Polym. Test. 2016, 53, 40–50. [Google Scholar] [CrossRef]
  17. Trandafir, A.C.; Erickson, B.A. Stiffness degradation and yielding of EPS geofoam under cyclic loading. J. Mater. Civ. Eng. 2012, 24, 119–124. [Google Scholar] [CrossRef]
  18. Akis, E.; Guven, G.; Lotfisadigh, B. Predictive models for mechanical properties of expanded polystyrene (EPS) geofoam using regression analysis and artificial neural networks. Neural Comput. Appl. 2022, 34, 10845–10884. [Google Scholar] [CrossRef]
  19. Vilau, C.; Dudescu, M.C. Investigation of mechanical behaviour of expanded polystyrene under compressive and bending loadings. Mater. Plast. (Mater. Plast.) 2020, 57, 199–207. [Google Scholar] [CrossRef]
  20. Horvath, J. Expanded Polystyrene (EPS) geofoam: An introduction to material behavior. Geotext. Geomembr. 1994, 13, 263–280. [Google Scholar] [CrossRef]
  21. ASTM D6817; Standard Specification for Rigid Cellular Polystyrene Geofoam. ASTM: West Conshohocken, PA, USA, 2013.
  22. ASTM D1623; Standard Test Method for Tensile and Tensile Adhesion Properties of Rigid Cellular Plastics. ASTM: West Conshohocken, PA, USA,, 2009.
  23. Zouzias, D.; De Bruyne, G.; Miralbes, R.; Ivens, J. Characterization of the Tensile Behavior of Expanded Polystyrene Foam as a Function of Density and Strain Rate. Adv. Eng. Mater. 2020, 22, 2000794. [Google Scholar] [CrossRef]
  24. Ellouze, A.; Jesson, D.; Ben Cheikh, R. The effect of thermal treatment on the properties of expanded polystyrene. Polym. Eng. Sci. 2020, 60, 2710–2723. [Google Scholar] [CrossRef]
  25. Mai, N.T.T.; Margeirsson, B.; Margeirsson, S.; Bogason, S.G.; Sigurgísladóttir, S.; Arason, S. Temperature mapping of fresh fish supply chains–air and sea transport. J. Food Process. Eng. 2012, 35, 622–656. [Google Scholar] [CrossRef]
  26. Margeirsson, B. Stacking Strength of Expanded Polystyrene Boxes with Fish Storage Capacity between 3 and 25 kg; Technical Report; University of Iceland: Reykjavik, Iceland, 2019. [Google Scholar]
  27. Helgason, S.J. Redesign of EPS Fish Boxes Using Experimental and Computational Structural Analysis. Master’s Thesis, University of Iceland, Reykjavik, Iceland, 2018. [Google Scholar]
  28. ASTM C203; Standard Test Methods for Breaking Load and Flexural Properties of Block-Type Thermal Insulations. ASTM: West Conshohocken, PA, USA, 2005.
  29. ASTM D618; Standard Practice for Conditioning Plastics for Testing. ASTM International: West Conshohocken, PA, USA, 2013.
  30. Eggert, G. Saturated salt solutions in showcases: Humidity control and pollutant absorption. Herit. Sci. 2022, 10, 1–6. [Google Scholar] [CrossRef]
  31. ANSYS Workbench 2022 R1; ANSYS Inc.: Canonsburg, PA, USA, 2022.
  32. Özer, A.T.; Akay, O. Interface shear strength characteristics of interlocked EPS-block geofoam. J. Mater. Civ. Eng. 2016, 28, 04015156. [Google Scholar] [CrossRef]
Figure 1. Typical stress–strain behavior of EPS under compression.
Applsci 13 05852 g001
Figure 2. Mechanical properties test setups for EPS. (a) Testing instrument. (b) Compression test setup. (c) Flexure test setup.
Applsci 13 05852 g002
Figure 3. Methods of preparing EPS specimens. (a) Cutting with a hot wire. (b) Cutting with a table saw.
Applsci 13 05852 g003
Figure 4. Strength test setups for EPS boxes. (a) Stacking load. (b) Bottom load. Note: in the bottom load test, the plate beneath was ring-shaped with a hole slightly larger than the top plate.
Applsci 13 05852 g004
Figure 5. Box dimensions of EPS-B22/EPS-B23. Unit: mm.
Applsci 13 05852 g005
Figure 6. Pre-processing of 3D model of EPS box. (a) Symmetry setting, the areas in red represented planes of symmetry. (b) Virtual topology. (c) Mesh results.
Applsci 13 05852 g006
Figure 7. Compression test and flexure test results of EPS. EPS22*: the thickness of specimens in this group was reduced to 20 mm instead of the original thickness of 22 mm in other groups. (a) Compression test curves. (b) Compressive strength. (c) Flexure test curves. (d) Rupture stress.
Applsci 13 05852 g007
Figure 8. Stacking strength test and bottom strength test results of EPS boxes. (a) Load-deformation curve from the stacking strength test. (b) Comparison of stacking loads. Sim: simulated stacking load at 10 mm deformation; Exp10: tested stacking load at 10 mm deformation; ExpMax: tested maximum stacking load. (c) Load-deformation curve from the bottom strength test. (d) Breaking load in the bottom strength test.
Applsci 13 05852 g008
Figure 9. Equivalent stress across the body and plastic strain distribution, from left to right: Sim22, Sim23, Sim23X. Unit: MPa and mm/mm.
Applsci 13 05852 g009
Table 1. Specimen specification for compression and flexure tests.
Test GroupComp 1Dimension (mm)Flex 2Dimension (mm)
EPS22 *5/550 × 50 × 204/480 × 240 × 20
EPS225/550 × 50 × 224/488 × 264 × 22
EPS235/550 × 50 × 224/488 × 264 × 22
* The thickness of this test group was 20 mm and all 6 faces were processed instead of only 4 lateral faces for EPS22 and EPS23. 1 Compression test. 2 Flexure test.
Table 2. Details of EPS boxes for stacking strength and bottom strength tests.
Test GroupDimension (mm)Weight (kg)Measured Density (kg/m 3 )Amount for Stacking/Bottom Strength Tests (pcs)
EPS-B22400 × 265 × 1260.11022.75/5
EPS-B23400 × 265 × 1260.11523.85/5
EPS-B23X400 × 265 × 1220.11323.85/5
Table 3. Engineering data for simulating EPS boxes under stacking.
Material NameEPS 22EPS 23
Density (kg/m 3 )2223
Young’s Modulus (MPa)4.75.2
Poisson’s Ratio 10.1260.131
Yield Strength (MPa)0.1410.152
Tangent Modulus (MPa)0.320.33
1 Derived from ν = 0.0056 ρ + 0.0024 [5], where ρ is the density of EPS in kg/m 3 .
Table 4. Results of compression test and flexure test on EPS.
Compression TestFlexure Test
Test GroupCompressive Strength (kPa)Initial Modulus (MPa)Rupture Stress (kPa)Strain at Rupture (%)
EPS22 *167, 164 (1.7, 2.8)3.8, 3.7 (0.2, 0.1)374, 342 (1.5, 4.9)7.0, 8.1 (0.7, 1.2)
EPS22168, 165 (5.7, 5.4)4.6, 4.7 (0.4, 0.3)325, 334 (5.6, 8.8)6.9, 6.7 (0.6, 1.2)
EPS23181, 177 (4.4, 2.9)5.3, 5.2 (0.4, 0.1)349, 346 (12.6, 4.6)4.9, 5.3 (0.5, 0.2)
* The thickness of this test group was 20 mm and all 6 faces were processed instead of only 4 lateral faces for EPS22 and EPS23; meaning in the flexure test, EPS22* had no original surfaces on the tension and compression side, while EPS22 and EPS23 retained the original.
Table 5. Comparison of EPS compressive strength with previous studies.
ReferenceStandardDensity (kg/m 3 )Specimen Size (mm)Compressive Strength (kPa)
Akis [18] (2022)ASTM D 162120Cubical 50 × 50 × 50126
Vilau [19] (2020)ISO 844 120, 25Cubical 50 × 50 × 25112, 138
Beju and Mandal [7] (2017)ASTM D 162120Cubical 50 × 50 × 50112
Özer and Akay [32] (2016)ASTM D 162119Cubical 50 × 50 × 50105
Birhan and Negussey [6] (2014)ASTM D 162120Cylindrical D63.5 × 127101
Wang and Arellano [8] (2014)ASTM D 162121.6Cubical 50 × 50 × 50160
This studyASTM D 162122, 23Cubical 50×50×22165, 177
1 Equivalent to ASTM D 1621.
Table 6. Results of stacking and bottom strength tests of EPS boxes.
Stacking Strength TestBottom Strength Test
Test GroupSimulation (kN)Load@10mm (kN)Maximum Load (kN)Deformation (mm)Breaking Load (kN)Deformation (mm)
EPS-B224.54.5 (0.017)4.8 (0.034)22.7 (0.8)3.1 (0.14)6.5 (0.6)
EPS-B234.94.6 (0.026)4.9 (0.036)21.6 (0.8)2.8 (0.12)5.6 (0.6)
EPS-B23X5.15.0 (0.061)5.5 (0.044)31.3 (2.0)2.2 (0.16)4.5 (0.3)
Table 7. Plastic strain values of EPS boxes from simulation results.
LocationSim22 (%)Sim23 (%)Sim23X (%)
Mid 110.33.41.6
Mid 28.603.11.7
Mid 311.74.61.5
Botm 111.99.32.1
Botm 214.97.12.5
Disclaimer/Publisher’s Note: The statements, opinions and data contained in all publications are solely those of the individual author(s) and contributor(s) and not of MDPI and/or the editor(s). MDPI and/or the editor(s) disclaim responsibility for any injury to people or property resulting from any ideas, methods, instructions or products referred to in the content.

