Abstract
Deep learning techniques for gaze estimation usually determine gaze direction directly from images of the face. These algorithms achieve good performance because face images contain more feature information than eye images. However, these image classes contain a substantial amount of redundant information that may interfere with gaze prediction and may represent a bottleneck for performance improvement. To address these issues, we model long-distance dependencies between the eyes via Strip Pooling and Multi-Criss-Cross Attention Networks (SPMCCA-Net), which consist of two newly designed network modules. One module is represented by a feature enhancement bottleneck block based on fringe pooling. By incorporating strip pooling, this residual module not only enlarges its receptive fields to capture long-distance dependence between the eyes but also increases weights on important features and reduces the interference of redundant information unrelated to gaze. The other module is a multi-criss-cross attention network. This module exploits a cross-attention mechanism to further enhance long-range dependence between the eyes by incorporating the distribution of eye-gaze features and providing more gaze cues for improving estimation accuracy. Network training relies on the multi-loss function, combined with smooth L1 loss and cross entropy loss. This approach speeds up training convergence while increasing gaze estimation precision. Extensive experiments demonstrate that SPMCCA-Net outperforms several state-of-the-art methods, achieving mean angular error values of 10.13° on the Gaze360 dataset and 6.61° on the RT-gene dataset.
1. Introduction
The goal of gaze estimation is to determine the gaze direction adopted by a person from a picture of their face or eye. With the increased development and availability of mass data and consumer technology, the demand for applications related to gaze estimation has gradually increased to include gaming, medical tools, offline retail, and distracted driving detection [1]. All these areas present the need to obtain information about the emotions, needs, behaviors, and interpersonal communication of individuals through their gazes, so as to gain insight into human cognition and behavior. The accuracy of gaze estimation has therefore come under close scrutiny as a consequence of the popularity of gaze estimation techniques. In recent years, gaze estimation methods based on deep learning [2] have established themselves as the primary methods for estimating gaze and have produced relatively good results. These approaches do not require complex hardware [3] and are robust to illumination, occlusion, and individualized differences.
Most current gaze estimation techniques based on deep learning take their input from either face or eye images, or both. Network models that utilize both eye and face images are more complicated and therefore associated with high computational complexity, which results in slower real-time speed. Methods that only accept eye or face images as input are able to infer information more quickly and therefore better satisfy the needs of real-time applications. Furthermore, adopting face images as input produces better performance and carries greater potential for development compared with using only eye images as input [4]. However, the presence of beards, hair, eyes, hats, and other supplementary features in face images can make gaze prediction difficult. Additionally, because of potential asymmetries between the eyes, gaze estimation techniques that rely on face images must consider joint features from both eyes rather than just features from each eye separately. Most existing gaze estimation techniques do not capture these long-distance dependences between the eyes, despite their potential for substantial improvement in gaze estimation accuracy. In this paper, we propose to address this issue with a novel network called SPMCCA-Net (strip pooling and multi-criss-cross attention network), which fuses a feature-enhanced bottleneck block based on the SP (strip pooling) module [5] and the MCCA (multi-criss-cross attention) module for gaze estimation from full-face images. The main goals and achievements of our research are as follows:
- To improve global-local feature representation and prevent redundant information unrelated to gaze from interfering with prediction, we designed a feature-enhanced bottleneck block based on the stripe pooling module to improve ResNet-50, thus enabling the backbone to capture long-distance dependencies between the eyes.
- To improve the ability of the model to locate and identify information about the area related to gaze and further improve the ability to capture long-distance dependencies between the eyes, we designed a multi-criss-cross attention module (MCCA) built upon the criss-cross attention framework [6] and incorporated this module into the backbone to capture contextual information via a self-attention mechanism.
- We also improve the based method at the loss function level by replacing the regression loss with smooth L1 loss [7]. This can greatly improve stability and convergence speed during model training and, to a large extent, also increase the accuracy of gaze estimation.
2. Related Work
2.1. Appearance-Based Gaze Estimation
In order to combine head-pose information with extracted eye features and learn gaze, Mnist [8] used a shallow network architecture and monocular images as input. The gaze error was then further reduced via a 13-layer convolutional neural network called GazeNet [9]. These approaches are limited by their reliance on single images as input; under these impoverished input conditions, it is extremely challenging to reduce errors in gaze estimation.
Chen and Shi proposed the Dilated-Net [10], which uses face images and binocular images as inputs. Their network relies on dilation convolution to extract high-level eye features, allowing it to capture small variations between eyes. These authors went on to propose a network for gaze estimation with dilation and decomposition (GEDDnet) [11], which combined gaze decomposition and dilation convolution for improved estimation. Since the eyes are asymmetric, Cheng et al. [12] proposed the asymmetric regression-evaluation network (ARE-Net) to extract different features from the eyes. In building on their previous work, these authors [13] further proposed a face-based asymmetric regression-evaluation network (FARE-Net) to optimize gaze estimation by incorporating differences between eyes. Based on these studies, Biswas et al. [14] proposed two networks: gaze estimation using dilated and differential layer networks (I2D-Net) and attention-based gaze estimation networks (AGE-Net). The former network eliminates features that are unrelated to estimation of the visual line of gaze via a differential layer and preserves relevant features from both eyes by extracting and recording absolute differences between left and right eye features. The latter network adds an attention branch to the feature extraction branch for both eyes, thus significantly mitigating the impact of variations in illumination, individual appearance, and head pose.
Some studies only adopted face images as feature extraction input, which demonstrates improved performance compared to approaches that only used eye images. However, face images contain redundant information [4]. Cheng et al. [15] estimated the general direction of gaze from face images and subsequently refined their estimation using eye features. In later work, these authors proposed using a transformer in gaze estimation (GazeTR) [16] and investigated the performance of the transformer by generating feature maps after passing face images through a convolutional neural network. To improve network capability for capturing global relations, they passed the feature matrix to the encoder in the transformer stage. These studies attempt to increase the effect of gaze estimation on face images through detailed information from both eyes or to increase attention to eye regions of the face through processes of self-attention; however, none of them take into account minimizing the interference from redundant information. The most recent work on gaze estimation involved L2CS-Net (L2 loss + cross-entropy loss + softmax layer network) [17]. This network was introduced to predict 3D gaze direction in unconstrained environments. For each gaze angle, the network creators applied two different losses, each of which was a linear combination of regression and classification losses. Their network model can predict fine-grained gaze in unrestricted environments using face images as input. This method, similar to the majority of those that rely on face images, does not take into account long-distance dependencies between the eyes. Due to the fact that face images contain a substantial amount of redundant information that is unrelated to gaze, these approaches are severely limited in their ability to accurately estimate gaze.
2.2. Attention Mechanism
In computer vision tasks, attentional mechanisms have been extensively adopted in various fields because they allow models to focus on useful feature information. For example, using a spatial feature-enhanced attention module to further improve the backbone network’s performance and apply it to pest and disease recognition in precision agriculture applications [18] and feature extraction and model learning enhanced by multiple dimensional information to further improve the accuracy and generalization of the model in the air pollutant prediction domain [19]. In the field of gaze estimation, attentional mechanisms have also been used to focus on feature information in eye images or in face images that is useful with the task of gaze estimation, and some research has been done. Based on the similarity in appearance between binocular features, the adaptive feature fusion network (AFF-Net) [20] performs adaptive fusion using the squeeze-and-excitation (SE) module [21]. Space-related research studies include FullFace [22] and AGE-Net [14]. Both use the spatial weighting mechanism [23,24], which assigns more importance to image regions that are connected with gaze direction. Although the former network does not incorporate inter-eye dependencies, it takes into account suppressing weights for regions unrelated to gaze. The latter network, while improving prediction performance via dilated convolutions and via the adoption of spatial attention to model remote dependencies within the network, is not effective at removing the potential interference of redundant information unrelated to gaze within the feature map.
In the field of gaze estimation, dilated convolutions are most frequently used to establish and capture long-distance dependencies between the eyes. While this technique can enhance receptive fields without introducing additional parameters, it is not effective at extracting features from small targets. Since the eyes are relatively small in face images, gaze estimation using dilated convolutions is less successful when applied directly to face images. In addition to dilated convolutions, adopting self-attention mechanisms in the network can also capture long-distance dependencies between eyes. Examples include using self-attention-augmented convolution [25] or adopting non-local modules [26]. However, adopting non-local modules produces poor real-time performance because this approach requires a lot of memory to perform complex matrix operations.
Additionally, global pooling, or pyramid pooling [27,28], can enhance the ability of CNNs to model remote dependencies by combining pooling layers with various pooling kernel sizes to extract global information. However, all the above methods operate on the feature map of the detection input through a square window. This limits their flexibility in capturing remote dependencies between the eyes in face images.
For the above reasons, we propose SPMCCA-Net based on the feature-enhanced bottleneck block (SPbottleneck) and multi-criss-cross attention module (MCCA). By introducing a long strip of pooling kernels and a cross-shaped self-attention mechanism in the network, we can capture the long-distance dependencies between the eyes in face images, greatly reduce the interference of redundant information in face images on gaze estimation, and strengthen the feature extraction ability of both eyes, which is a good solution to problems that have not been solved in previous research work.
3. Proposed SPMCCA-Net Models
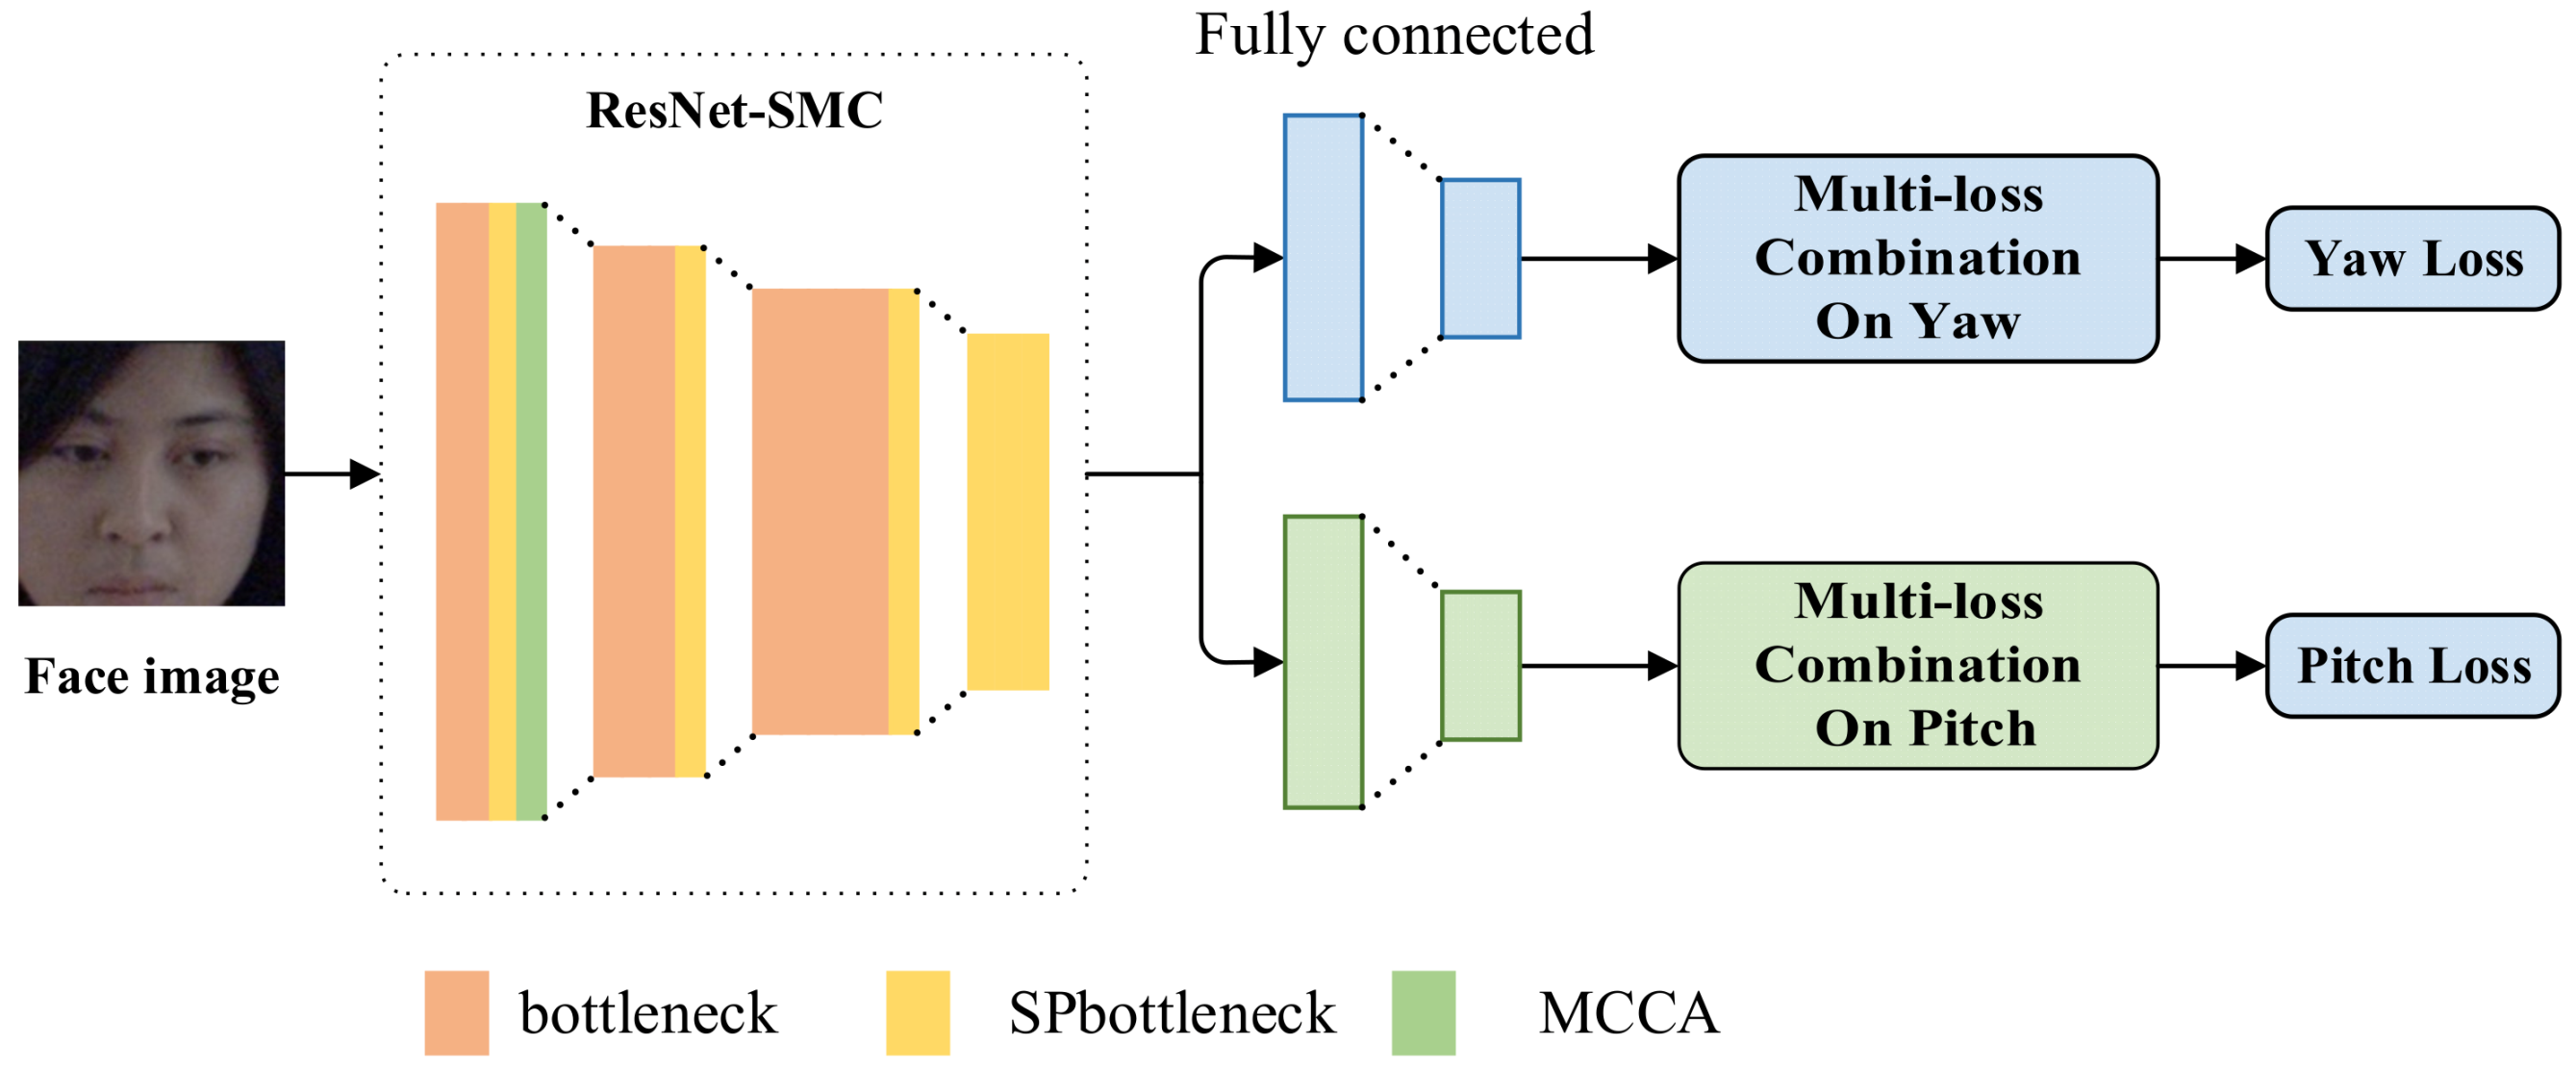
Figure 1 illustrates the architecture of the SPMCCA-Net model. The backbone network for this model is ResNet-SMC. ResNet-SMC is mainly based on the residual network [29], which incorporates both strip pooling and a multi-criss-cross attention module. The SPMCCA-Net model adopts a multi-loss combination framework and smooths L1 loss as regression loss to adaptively limit gradient variation. We regressed and predicted each gaze angle (yaw, pitch) independently through two fully connected layers, which in turn yielded a 3D gaze vector, and the total loss of each viewing angle by the multi-loss combination function is used to back propagate the network and adjust the network weights.
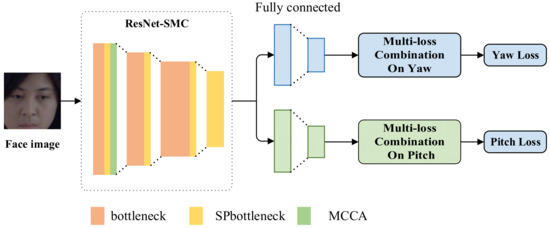
Figure 1.
SPMCCA-Net model architecture.
3.1. Improved ResNet-SMC
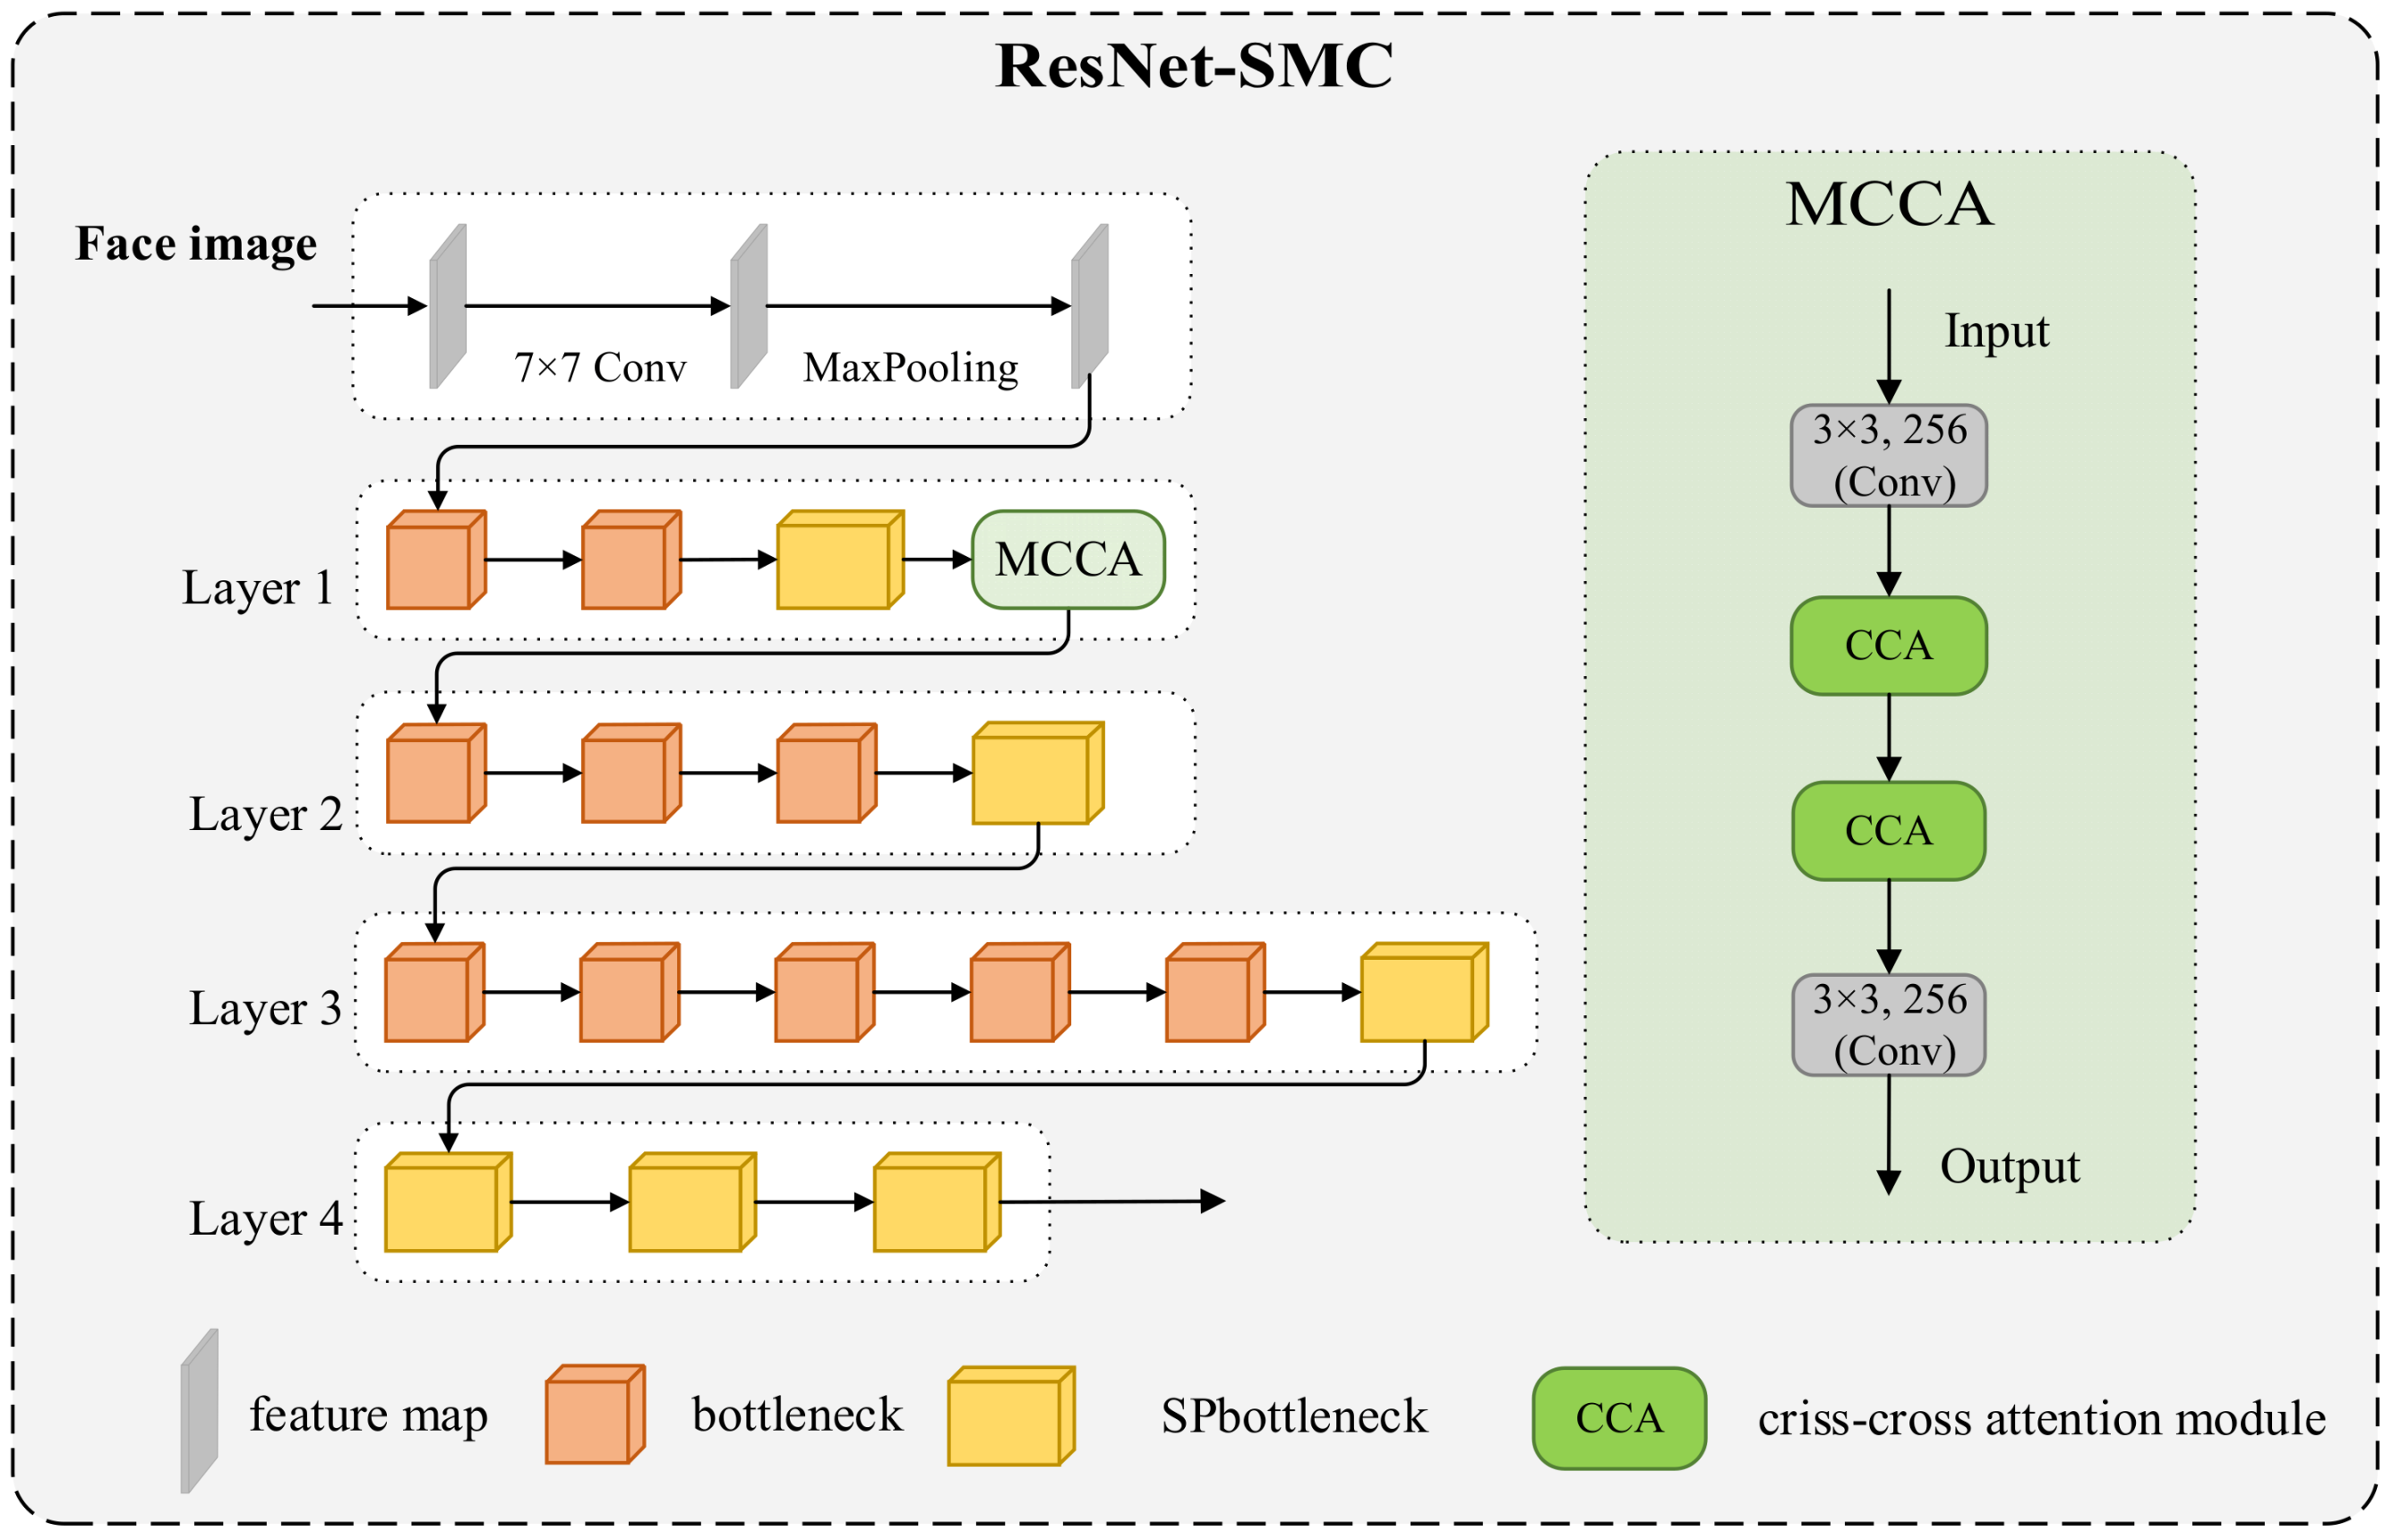
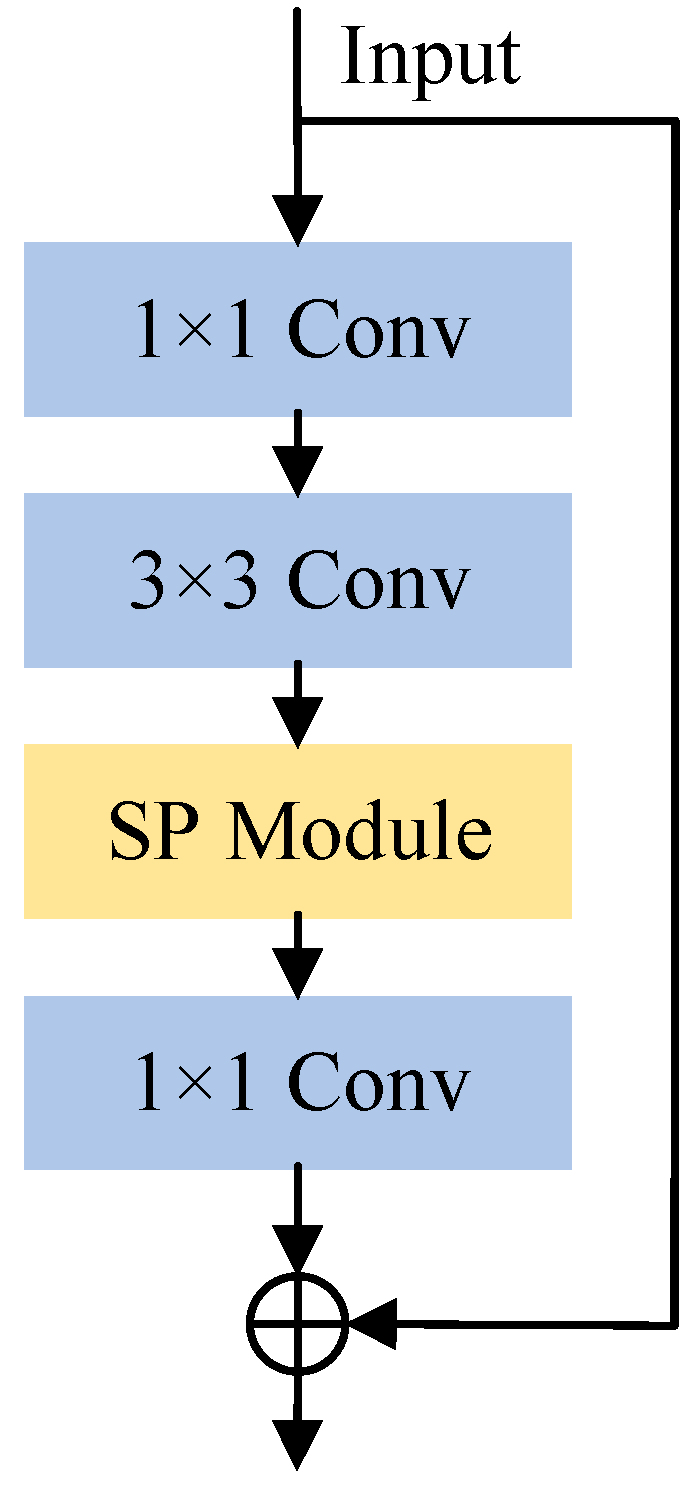
The ResNet-SMC backbone network is based on ResNet-50 [29]. The bottleneck blocks are the constituent structure of ResNet-50, which consists of three convolutional layers. The structure uses a 1 × 1 convolutional kernel to reduce the number of input channels, then a 3 × 3 convolutional kernel to learn the features, and finally a 1 × 1 convolutional kernel to increase the number of output channels. This structure reduces the computational cost without losing accuracy. In this paper, the strip pooling module is added to the bottleneck block to create a feature-enhanced bottleneck block with greater feature representation capability. The purpose of this module is to improve the receptive field of the deep neural network so that it can better capture the global information in the image. It extracts the global information by dividing the input feature map into multiple stripes and then performing a pooling operation on each stripe. This modification improves the perceptual field of the network, enabling it to capture long-distance dependencies between the eyes and reduce sight-independent information. In the backbone network, a multi-criss-cross attention module has also been added, which improves the ability of the network to capture long-distance dependencies between the eyes as well as contextual information. The network can aggregate both global and local contextual information within two modules with good capability to distinguish and recognize different feature information from face pictures, thus preventing redundant face information from interfering with the eye regions. Figure 2 shows the structure of ResNet-SMC.
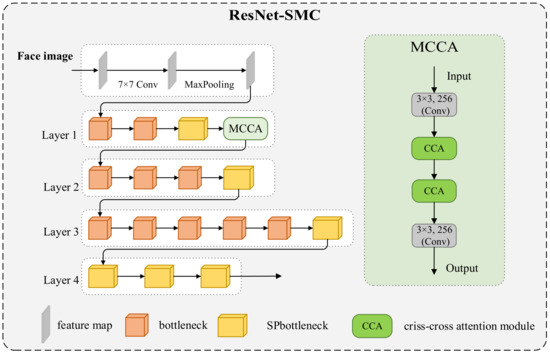
Figure 2.
The structure of ResNet-SMC.
3.2. Feature-Enhanced Bottleneck Blocks SPbottleneck
The strip pooling attention mechanism has been applied to many domains and demonstrated its powerful applications, such as the medical domain [30]. In addition, in the field of gaze estimation, since both eyes are asymmetric, the feature extraction process must take into account not only the individual changes of the eyes but also their joint feature information associated with binocular changes, requiring the model to capture the long-distance dependencies between the eyes. We thus incorporated a strip pooling module into the bottleneck block to design a novel feature-enhanced bottleneck block called SPbottleneck (bottleneck with strip pooling module), which addresses the aforementioned issue.
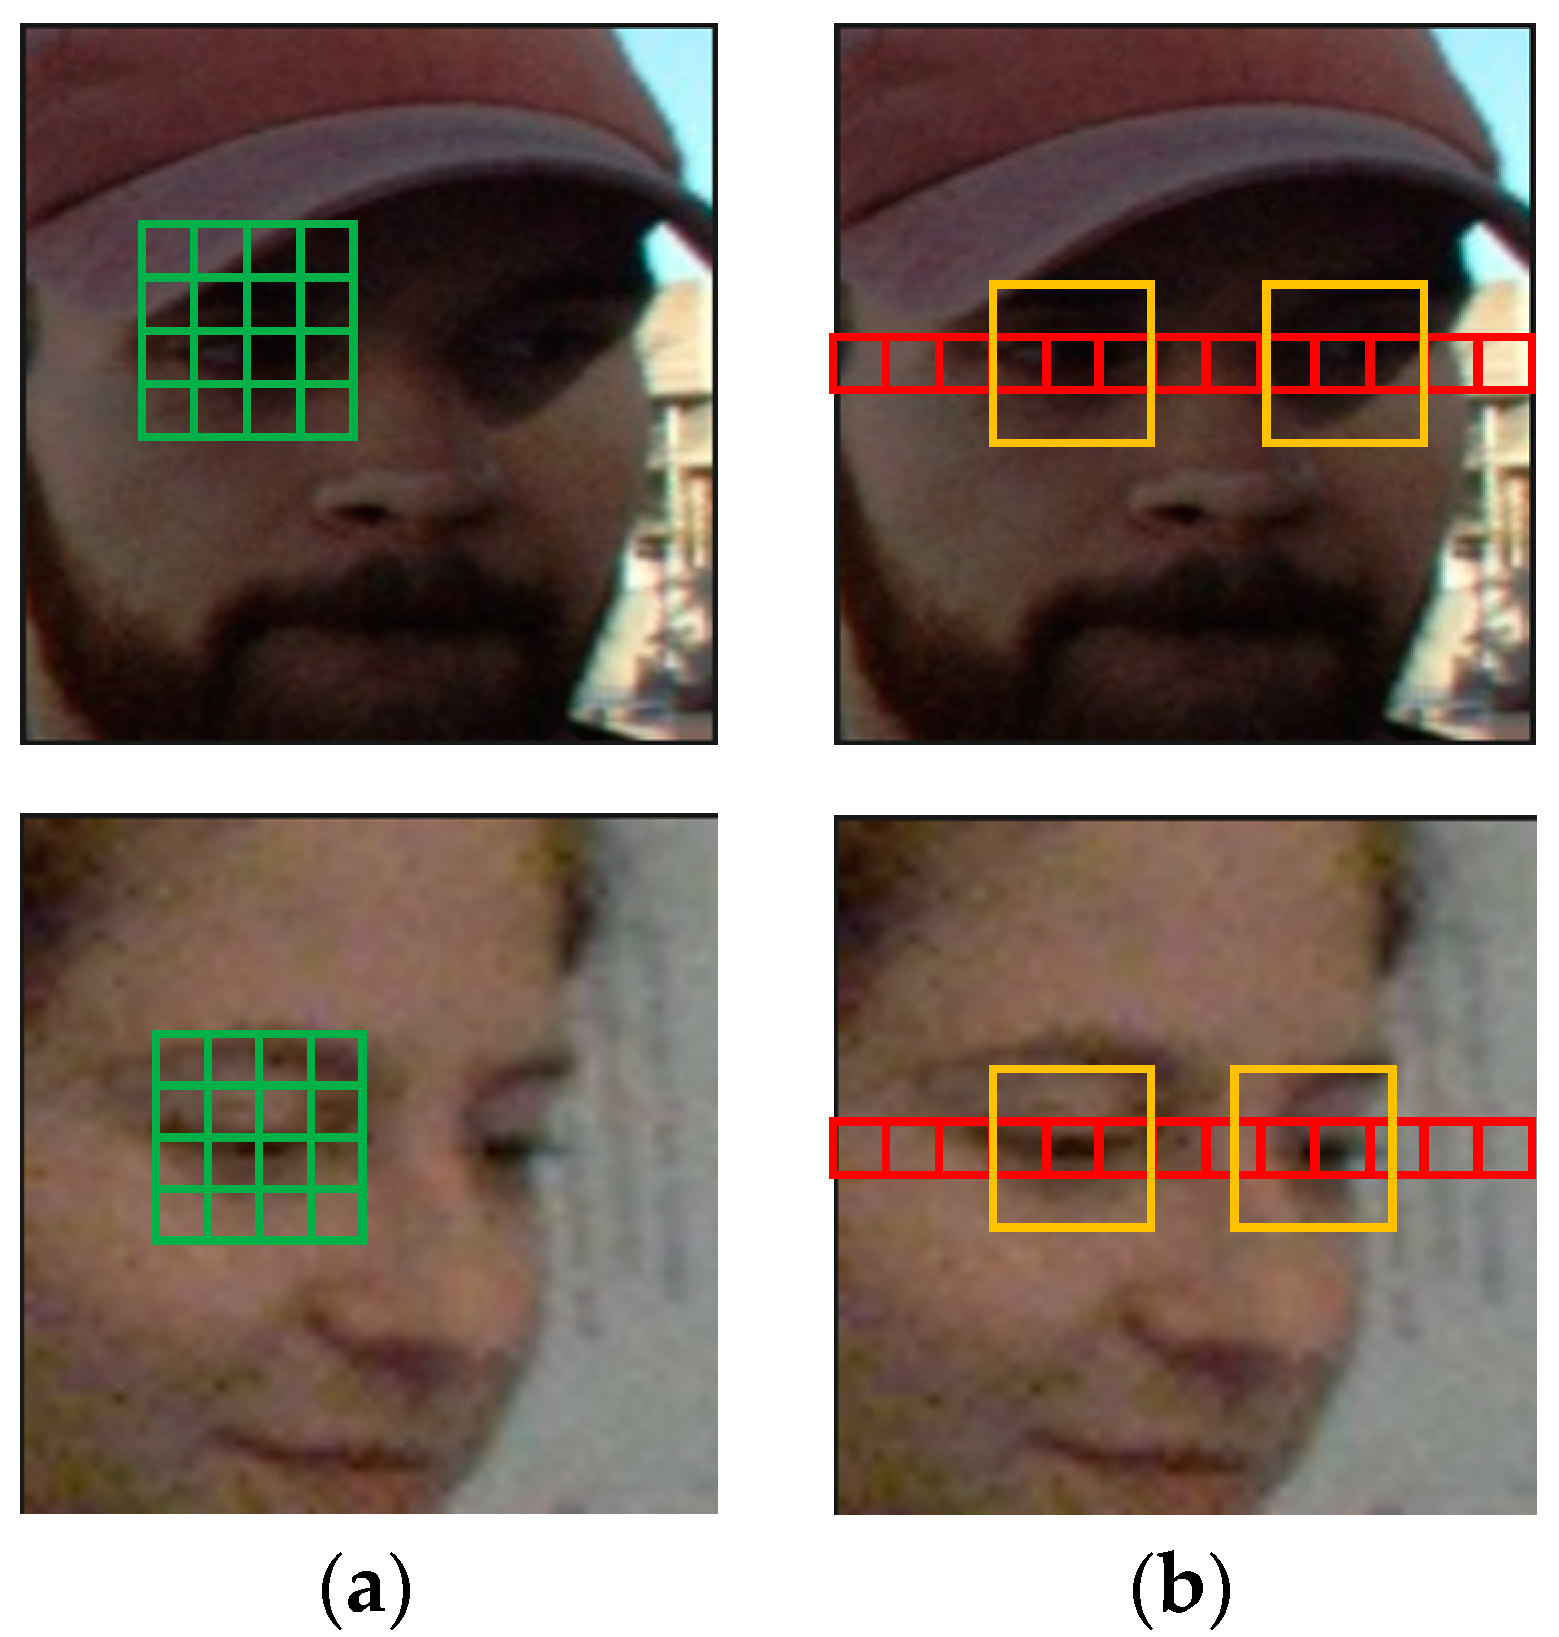
The green grid in Figure 3a depicts the effect of traditional global pooling, and the red grid in Figure 3b depicts the effect of the strip pooling module. The two modules are applied to the face image at the same time. As demonstrated by Figure 3, traditional global pooling uses a square window, which will inevitably contain interference information from regions not related to gaze, while the strip pooling module can better capture long-distance dependencies across eye regions (indicated by yellow border regions). The latter approach prevents information unrelated to gaze from interfering with gaze prediction.
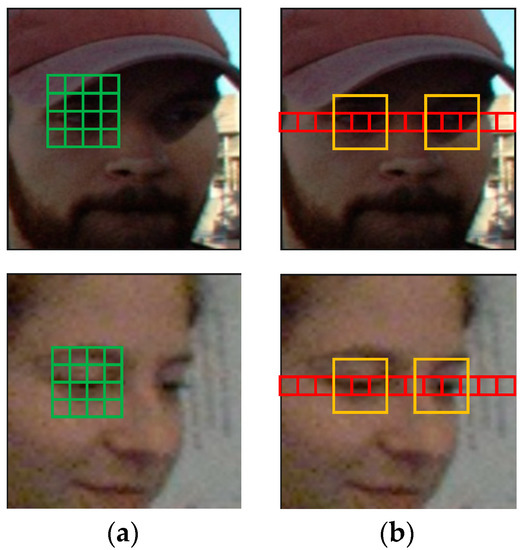
Figure 3.
The effects of traditional global pooling and strip pooling for gaze estimation. (a) the effects of traditional global pooling images; (b) the effects of strip pooling.
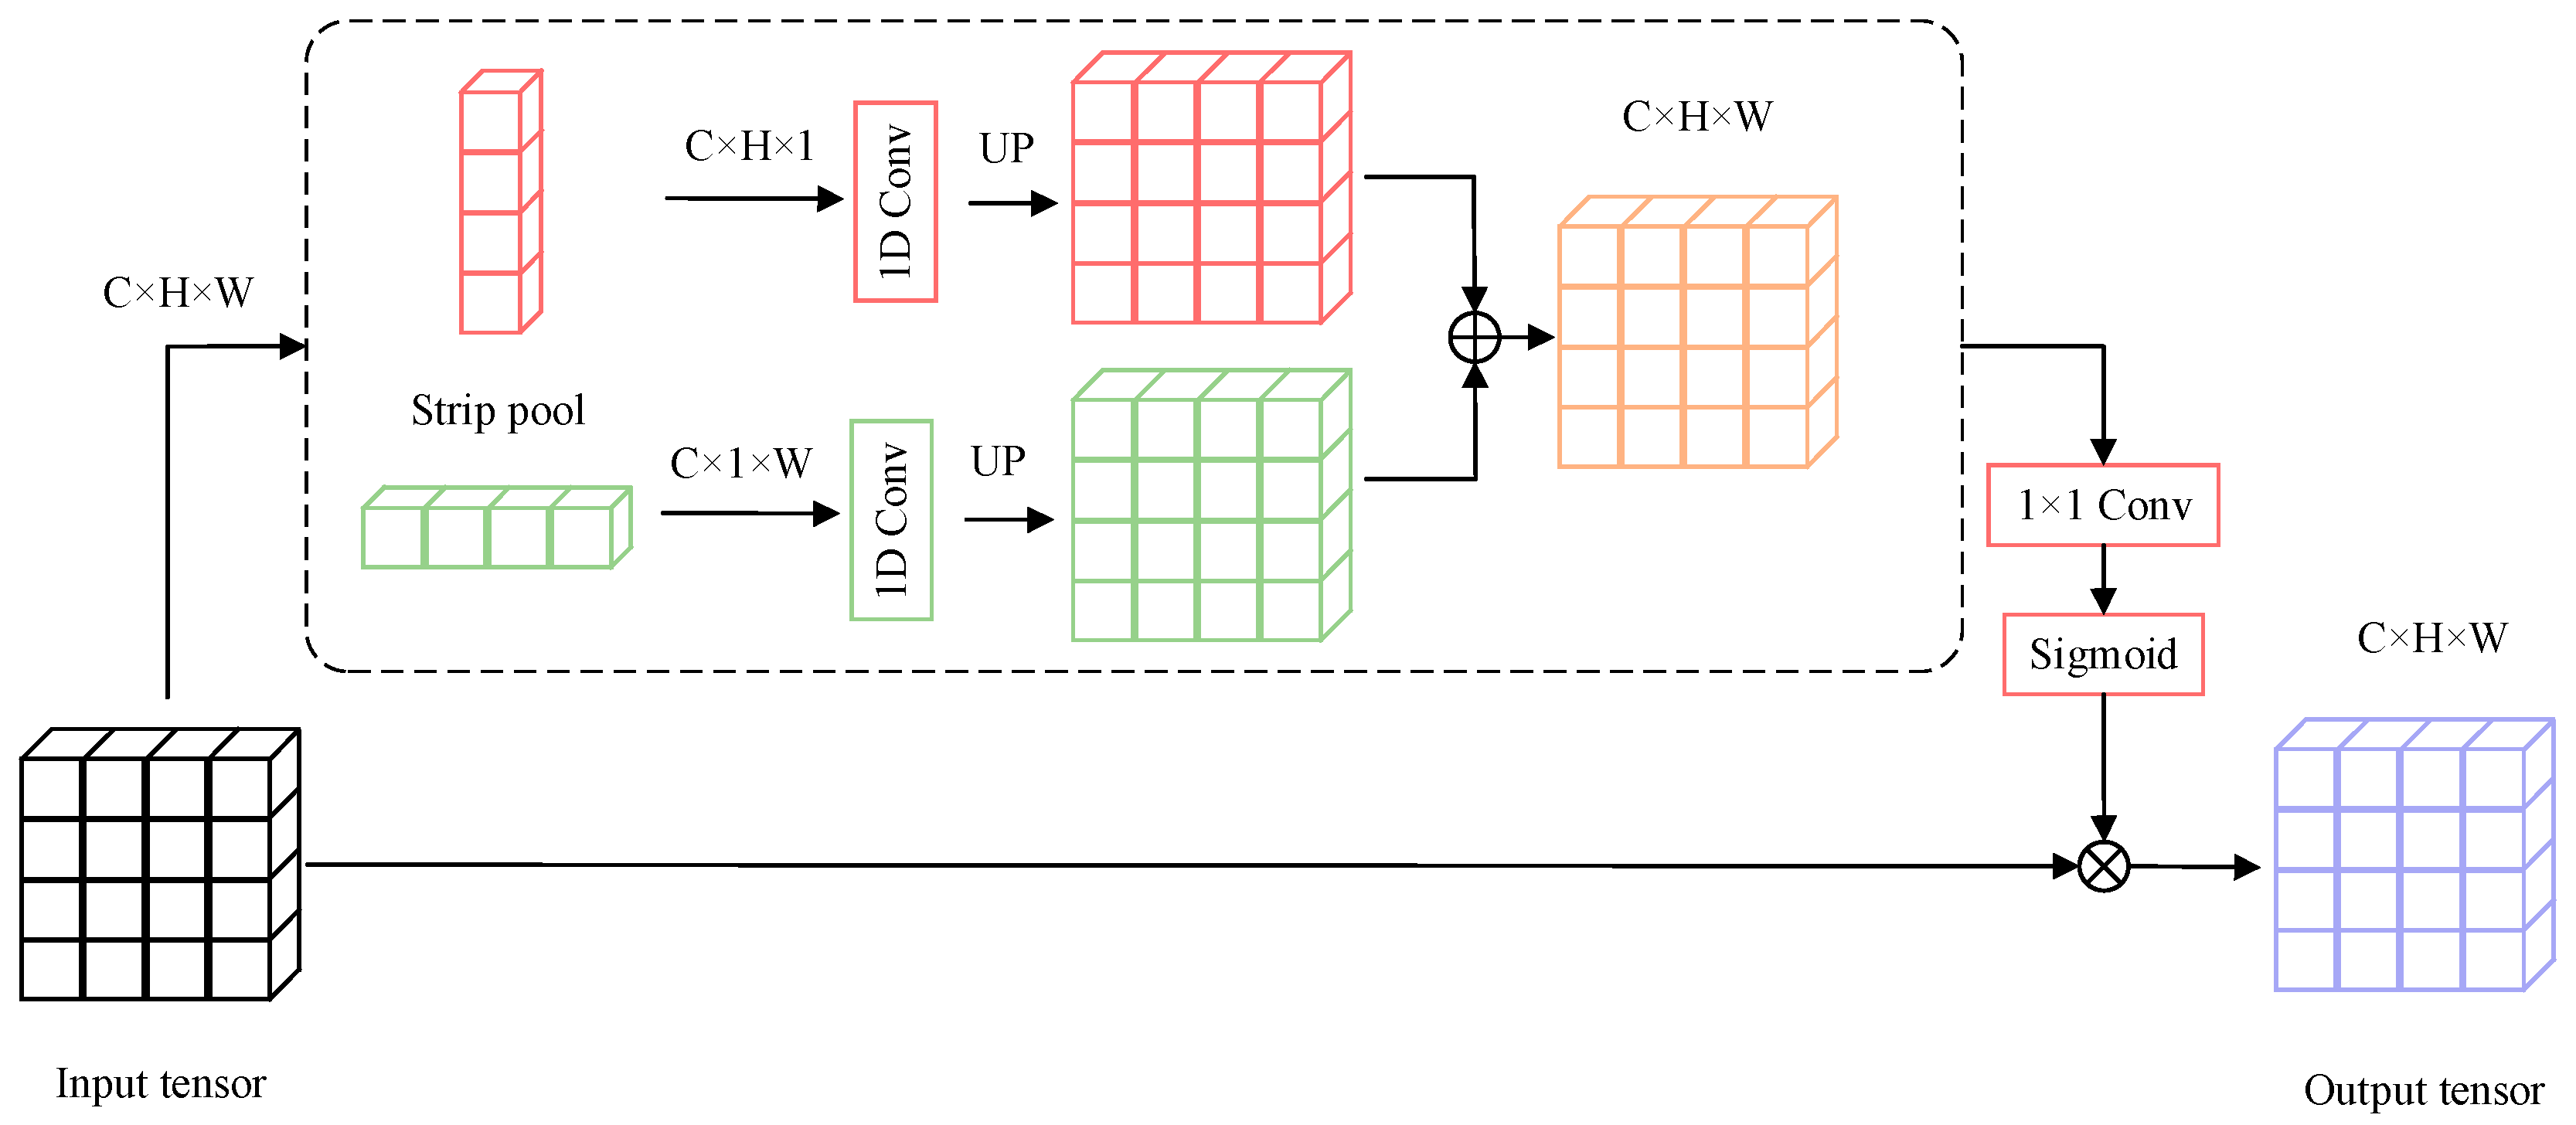
We implemented the strip pooling module in three steps: a feature map of dimensions H and W is initially provided as input; the feature map is pooled into H × 1 and 1 × W by horizontal pooling and vertical pooling, respectively; the values of elements (i,j indicate the position of specific elements within the feature map) in the pooling are averaged and returned as pooled output values. Following horizontal pooling, the output can be expressed as:
Following vertical pooling, the output can be expressed as:
The size of both feature maps is then expanded to H × W via 1D convolutions. The expanded feature maps are summed:
In the above expression, c is the number of channels. The final output Z is expressed as follows:
where denotes element-wise multiplication, σ denotes the sigmoid function, and f denotes a 1 × 1 convolution.
After the above process, each position in the output tensor is built using data from each position in the vertical and horizontal directions of the corresponding position in the input tensor, which represent all the elements in the crossover position.
By repeating the above aggregation process, long-distance spatial dependencies can be constructed from the whole-face image. Figure 4 provides details on the strip pooling module.
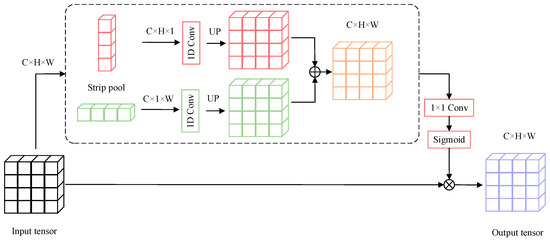
Figure 4.
The details of the Strip Pooling module.
As shown in Figure 5, the feature-enhanced bottleneck block SPbottleneck is based on the bottleneck block with an added strip pooling module after 3 × 3 convolution. Thus, SPbottleneck can encode global horizontal and vertical information about the feature map to balance its weights for feature optimization. This approach avoids unnecessary connections between distant positions so that, when the gaze changes, the weight values associated with the eye regions can be balanced under the control of joint features reflecting changes in both eyes. At the same time, fewer weight values will be assigned to regions unrelated to gaze to prevent their interference with gaze prediction. We demonstrate the success of the proposed method quite well in the experimental section through visualization effects.
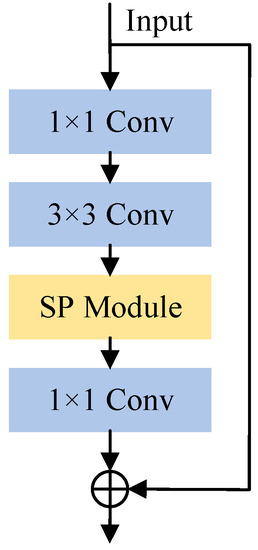
Figure 5.
Structure of the SPbottleneck.
3.3. Multi-Criss-Cross Attention
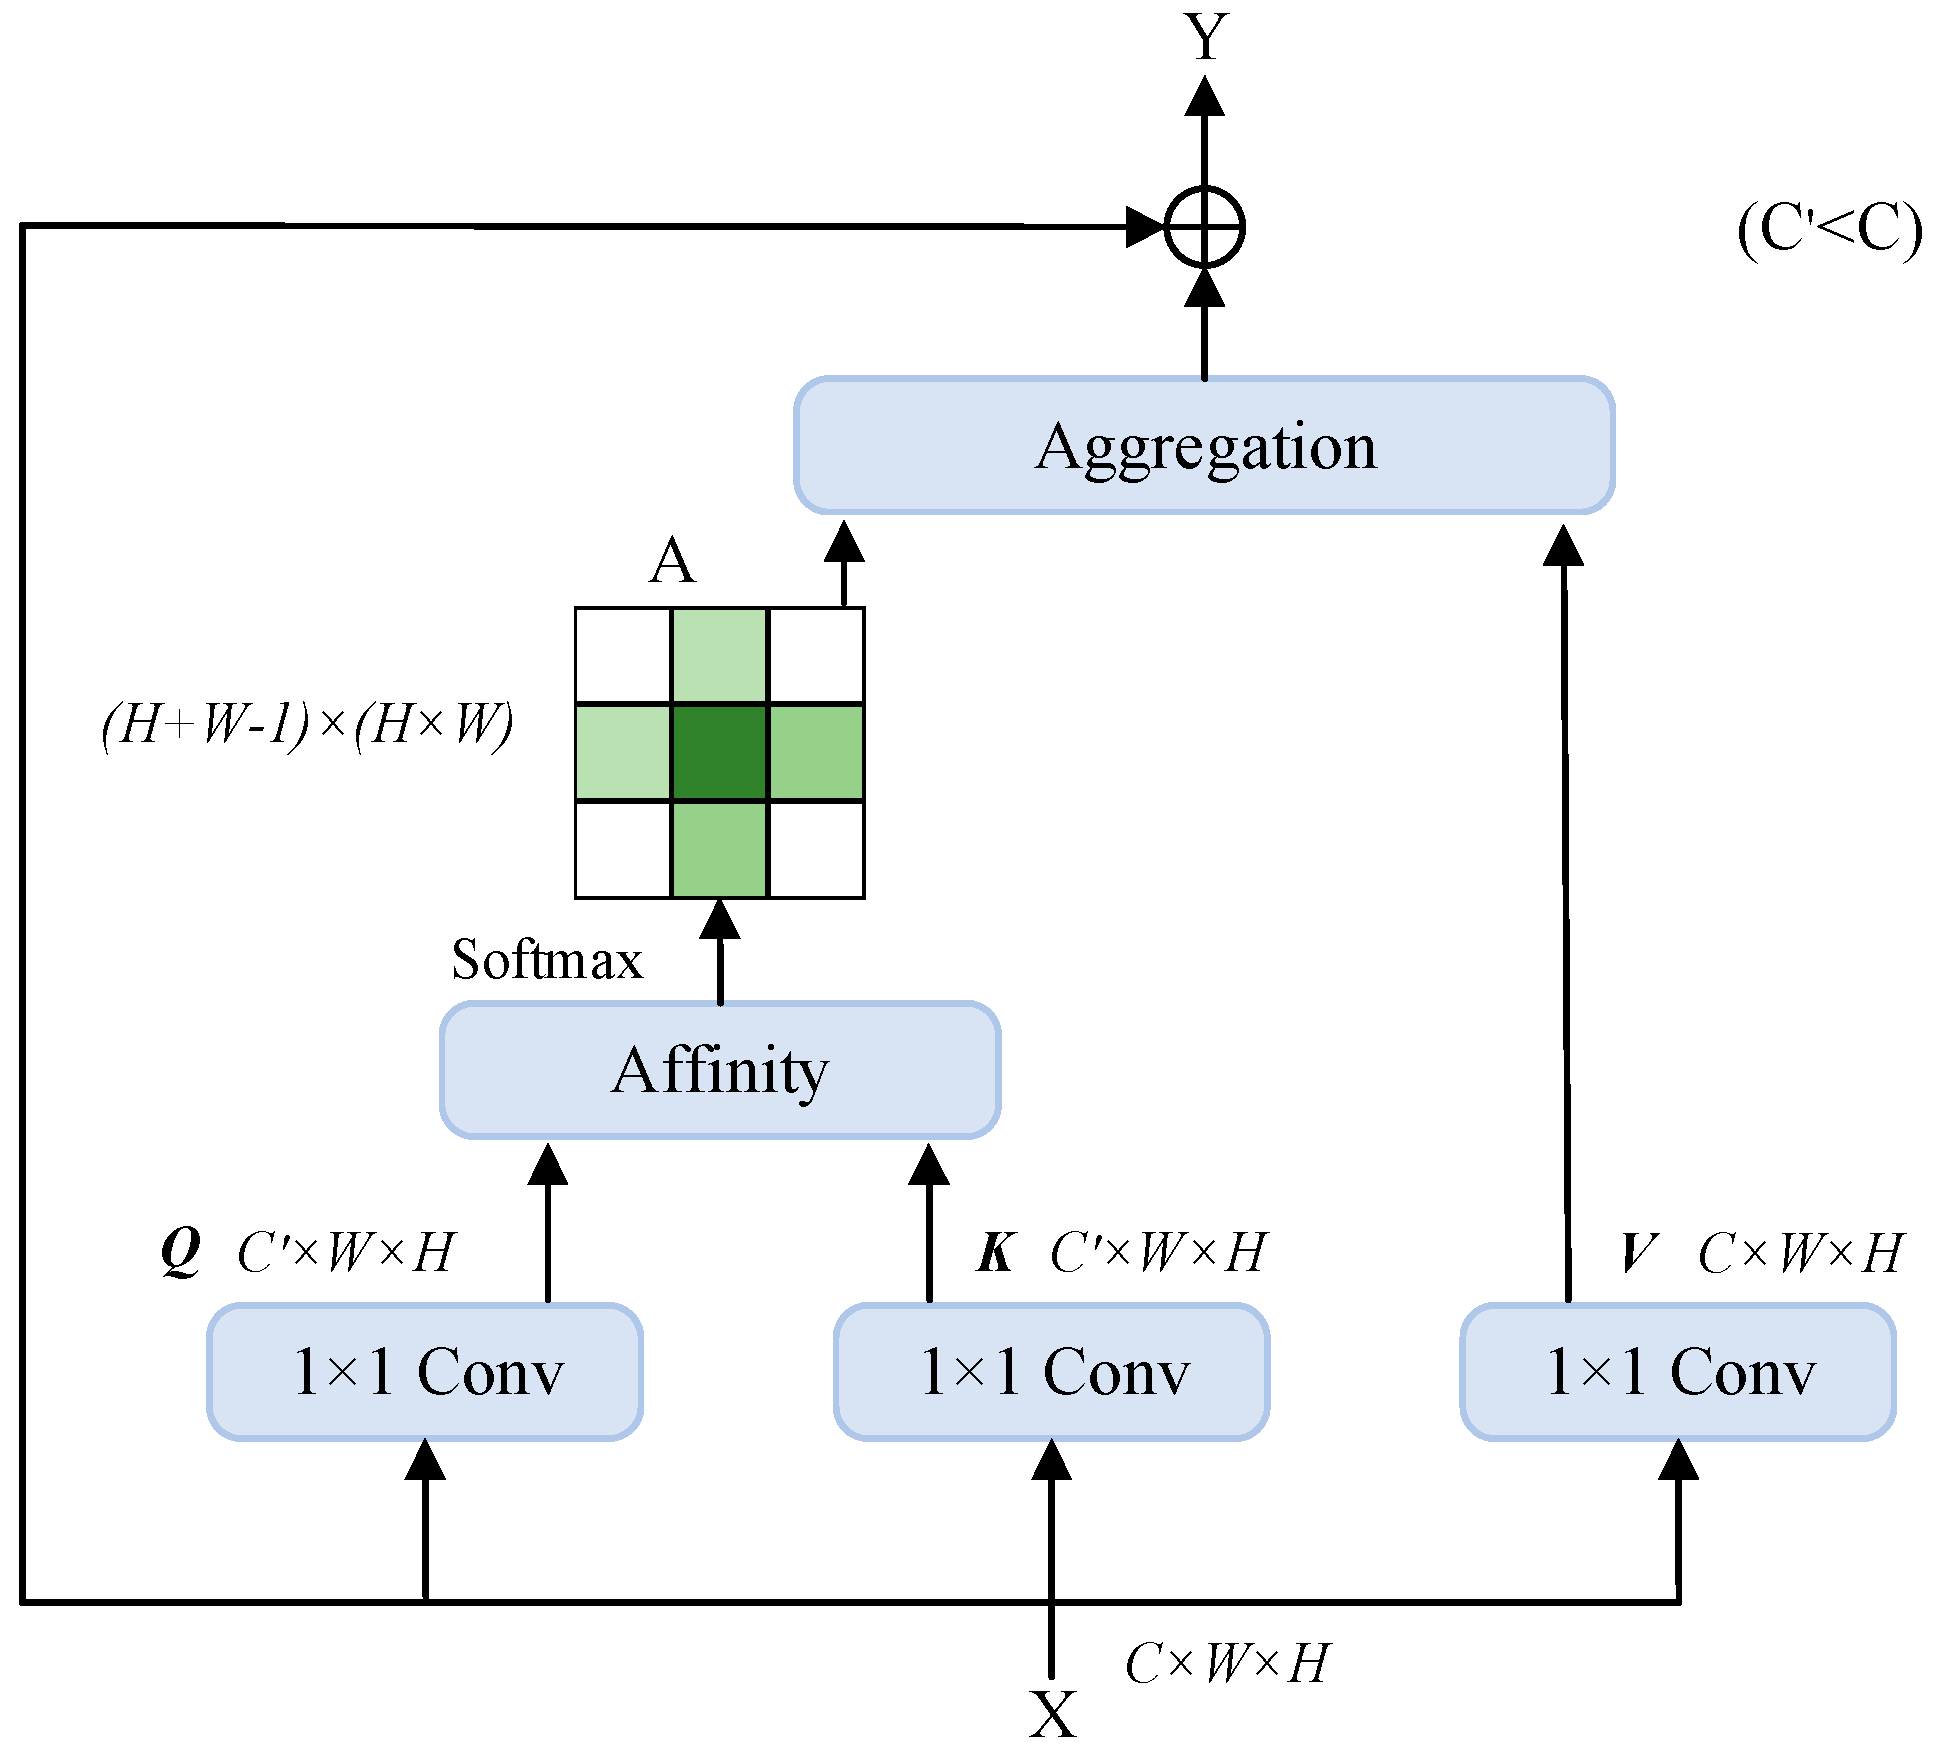
The self-attention mechanism for 2D images involves autonomous learning among feature maps to assign weights. Using the self-attention module can create global dependencies and broaden the perceptual field of the image. For the gaze estimation work using the input of face images, this is precisely what is required. However, its excessive computational complexity represents a disadvantage. As a result, this paper develops the multi-criss-cross attention module based on the criss-cross attention (CCA) module, which involves less computational complexity and a more effective criss-cross attention module. The criss-cross attention module is a deep learning module for image segmentation tasks in computer vision. In contrast to other attention modules, the criss-cross attention module generates attention maps by considering features in both row and column directions. This approach allows the model to enhance its capacity to capture contextual information, achieve similar functionality as the streak pooling module, and enhance the accuracy and robustness of gaze estimation. Figure 6 illustrates the detailed structure of the criss-cross attention (CCA) module.
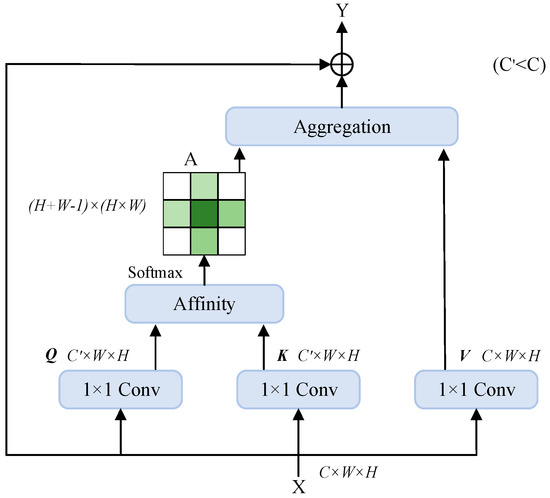
Figure 6.
Criss-Cross Attention (CCA) module structure.
The criss-cross attention module works as follows:
First, a feature map is given, and a 1 × 1 convolution operation is performed to obtain and . C′ is the number of channels, which is less than C to reduce computational effort. An affinity operation is performed on Q and K to obtain the attention map . A further 1 × 1 convolution operation is performed on X to get . Finally, an aggregation operation is performed on A and V. To obtain the feature map , the result of the aggregation operation is added to the original input X for the purpose of incorporating contextual information.
The purpose of the affinity operation is to obtain a channel vector at every position u on Q, where . At the same time, a feature vector can be obtained from every position in the identical column or row of position u on K. is the ith element of . Thus, the affinity operation is expressed as:
where is the degree of relevance between features and , and i = [1, …, H + W − 1]. To obtain attention map A, we applied a softmax layer after the affinity operation.
Similarly, and can be obtained from V after the aggregation operation to obtain contextual information. To obtain Y, feature X from the original input is added last. The aggregation operation can be expressed as:
where is a scalar value at channel i and position u in A, and is a feature vector at position u.
We designed the multi-criss-cross attention module based on the criss-cross attention mechanism. The incoming feature map must first go through one convolution for feature extraction and a subsequent dimensional transformation before being passed through the criss-cross attention module in order for each element to establish spatial position relationships with other elements on its cross-path. When compared with the non-local module, the criss-cross attention module significantly reduces computational complexity. However, because the single criss-cross attention mechanism can only capture features along the same cross-path but cannot establish inter-feature dependencies across different cross-paths, we used two consecutive cross-attention modules to obtain global contextual information. To complete the dimensional transformation, we applied a convolutional layer.
Through the above cross-shaped self-attention mechanism, we can achieve similar effects as the strip pooling module, further enhancing the ability to capture long-distance dependencies between two eyes while achieving a further enhancement of anti-interference capability for redundant information.
3.4. Robust Multi-Loss Combination Function
The multi-loss combination function incorporates cross-entropy loss and mean-squared error using each gaze direction. It can provide more supervised information than a single cross-entropy loss or mean-squared error, and these two quantities are coordinated with one another, improving training efficiency and performance. The multi-loss combination function is typically expressed as:
where denotes cross-entropy loss, denotes mean-squared error, p denotes predicted values, denotes ground-truth values, and β is the regression coefficient. We found better gaze estimation by changing the value of β.
We also found that the mean-squared error in the multi-loss combination function results in unstable and slow convergence during training, which makes the model unable to produce optimal outcomes. This occurs primarily because the inputs of the predicted and labeled values in the regression loss are respectively represented by the predicted angle values (obtained from calculating expectation values from the softmax probability distribution) and the actual angle value data, not the normalized data. For this reason, there is a large difference between predicted and labeled values, which leads to instability and slow convergence when adopting mean-squared error as the regression loss. We therefore adopted a smooth L1 loss, enabling the network to change the size of gradient values adaptively during the backpropagation process, which in turn enhances stability and convergence speed during training.
The smooth L1 loss is defined as:
Smooth L1 loss can limit the gradient in two ways: when the difference between the predicted value and the ground-truth value is too great, the gradient value will not be too large, and when the predicted value is less different from the ground-truth value, the gradient value can be sufficiently small. As a result, smooth L1 loss is more resistant to outliers, and the gradient value can be adjusted to reduce the likelihood that training will fail, somewhat increasing the precision of gaze estimation. The more robust multi-loss combination function is expressed as:
Figure 7 illustrates the framework underlying multi-loss combination.

Figure 7.
Multi-loss combination framework.
4. Experiment
4.1. Data Preprocessing
We selected two large datasets for evaluation: Gaze360 [31] and RT-Gene [32], Gaze360 was collected in unconstrained environments, providing a 360° 3D gaze range. This dataset contains approximately 129 K images for training and 26 K images for testing, collected from 238 subjects of different ages, genders, and races. In terms of the number of testers and variety, it is the largest publicly accessible dataset of its kind. RT-Gene contains approximately 92 K images from 13 subjects for training and 3 K images from 2 subjects for validating. These two datasets have a large number of images and do have a large amount of background interference information and redundant information about faces, which is different from most datasets collected in the laboratory [33].
We follow the same procedures as in the baseline approach [17] to normalize images from the two datasets and eliminate head posture as a factor. Additionally, we applied the angular segmentation operation of L2CS-Net, which splits up the continuous gaze target in each dataset. For the Gaze360 dataset, there is one library for every 4°, with 90 classes from −180° to 180°. For the RT-Gene dataset, there is one library for every 3°, with 60 classes from −90° to 90°.
4.2. Training & Results
We use the official training weights of ResNet-50 on the ImageNet dataset provided by PyTorch as the pre-training weights for this model. The proposed network takes a face image of size 448 × 448 as input, which keeps the same image resolution size as the baseline model for training and validation, and is trained with the Adam optimizer. We trained the model for 50 epochs with a learning rate of 0.00001 and a batch size of 16.
The mean angular error is the most commonly used evaluation metric in gaze estimation, which is similar to the mean absolute error by measuring the angle between the predicted gaze direction and the true gaze direction. We followed the evaluation criteria in [2,4] and chose mean angular error as the performance evaluation index. The mean angular error (◦) can be expressed as:
where the real gaze direction is and the predicted gaze direction is . A lower value of indicates better model performance (lower gaze estimation error).
In order to make a fair comparison with the baseline model, we chose to adopt 1 and 2 as the values of the regression coefficients because the L2CS-Net baseline model was trained to adopt only these two values as the regression coefficients.
Table 1 compares the SPMCCA-Net model with other available gaze estimation models on the Gaze360 dataset. We follow the evaluation criteria adopted by [31], but only in relation to the front 180° and front-facing (within 20°) postures to allow for fair comparison with all related methods, which are trained and evaluated on datasets within the 180° range. SPMCCA-Net clearly outperforms other current mainstream methods on the Gaze360 dataset. Although SPMCCA-Net does not achieve a lower mean angular error on the front 180° compared to the DAM method [34] under the field of gaze target detection, it achieves a lower mean angular error on the front facing when compared to DAM. More specifically, it produces a mean angular error reduction of 0.28° in comparison with the baseline method on front 180° and a mean angular error reduction of 0.64° in comparison with the baseline method on front 180° on front facing, which achieves gaze performance with 10.13° (mean angular error) on front 180°and 8.40° (mean angular error) on front facing when β = 2.

Table 1.
The results of comparison between the proposed model and other methods on Gaze360.
Table 2 shows the results of the comparison between the proposed model and other methods on the RT-Gene dataset. The proposed SPMCCA-Net achieves better performance with a 6.61°mean angular error when β = 2, which produces a mean angular error reduction of 0.07° in comparison with the baseline method within 40°. As an estimation task, gaze estimation has some similarities with other estimation tasks, such as the mean absolute error (MAE), root mean square error (RMSE), and mean absolute percentage error (MAPE) used in [34]. As shown in Table 3, we calculated the MSE, RMSE, and MAPE values for each gaze direction in L2CS-Net and SPMCCA-Net in Gaze360 and RT-Gene, where P denotes pitch direction and Y denotes yaw direction. We can observe that, compared with L2CS-Net, the model trained by SPMCCA-Net proposed in this paper demonstrates better performance in metrics such as mean squared error, root mean square error, and mean absolute percentage error.

Table 2.
The results of comparison between the proposed model and other methods on RT-Gene.

Table 3.
The performance measure of MAE, RMSE, and MAPE.
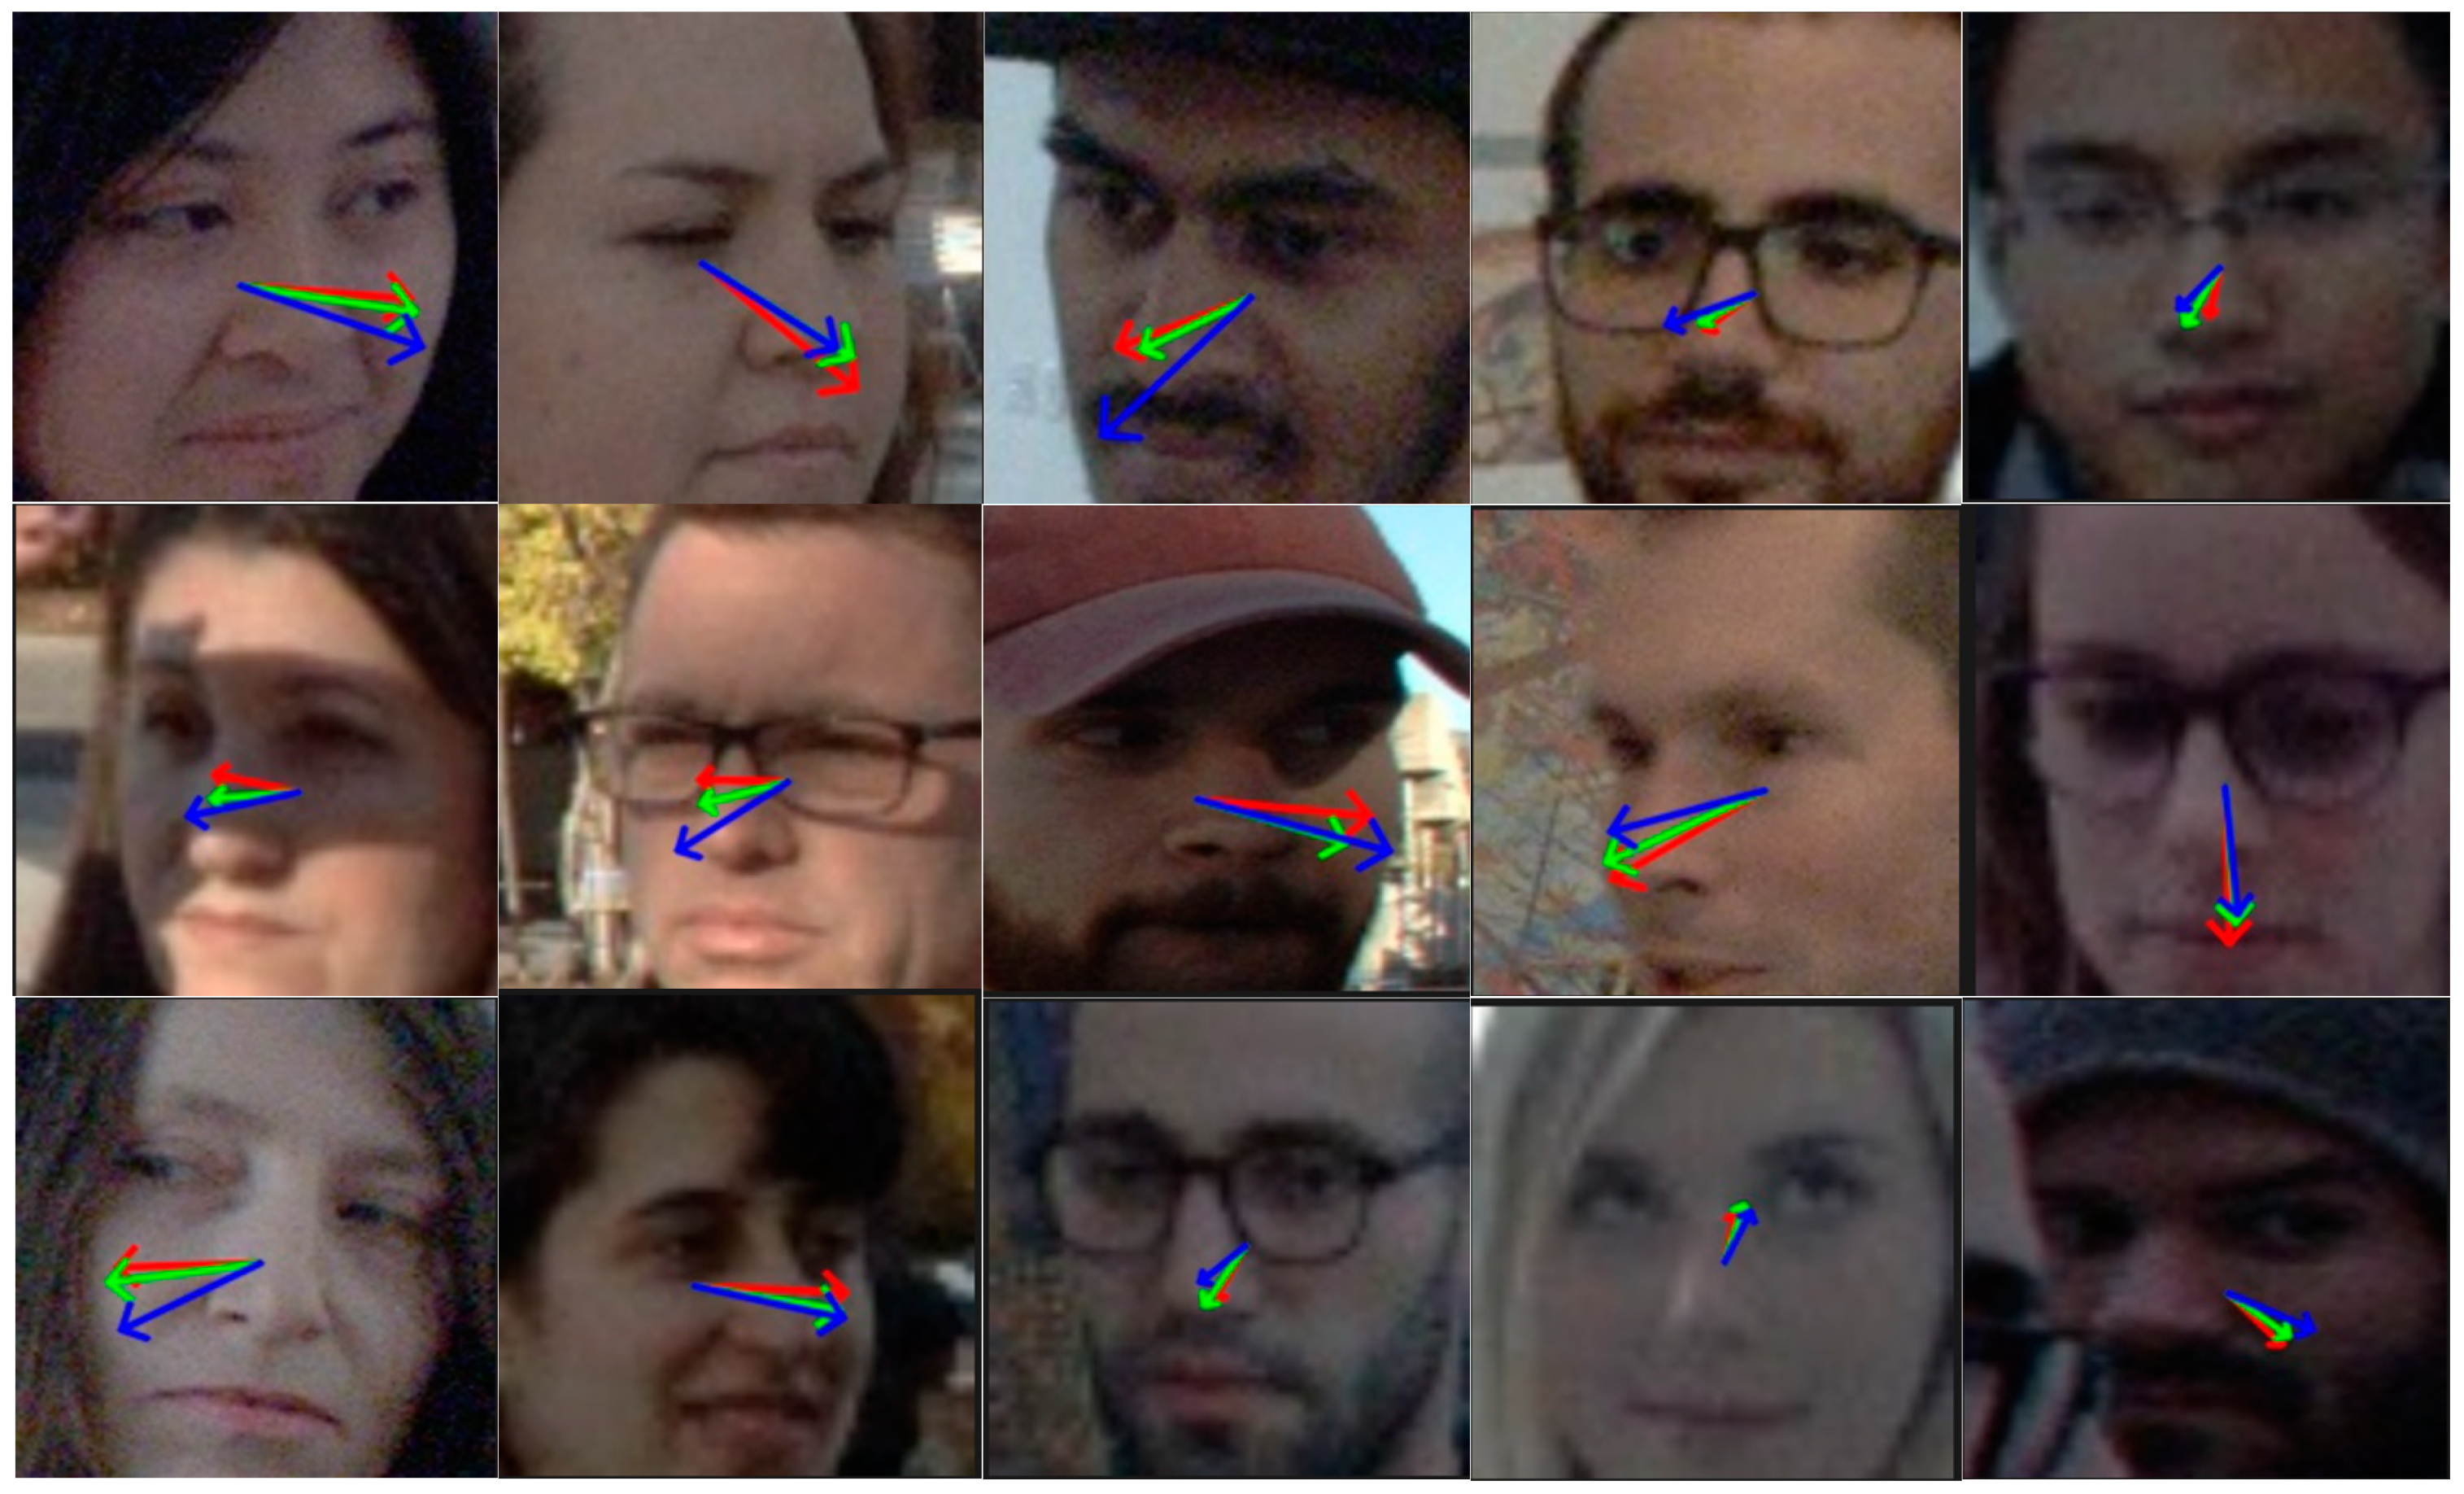
Figure 8 visualizes results from the proposed model against the baseline model on the Gaze360 dataset. The red arrows represent visualization results for the baseline method (L2CS-Net), the blue arrows represent visualization results for the ground-truth values of gaze direction, and the green arrows represent visualization results for the SPMCCA-Net proposed in this study. The visualization effect diagram shows that we can get a gaze estimation effect closer to the ground-truth values by the SPMCCA-Net, which can be successfully applied to estimate gaze for different individuals in different situations.
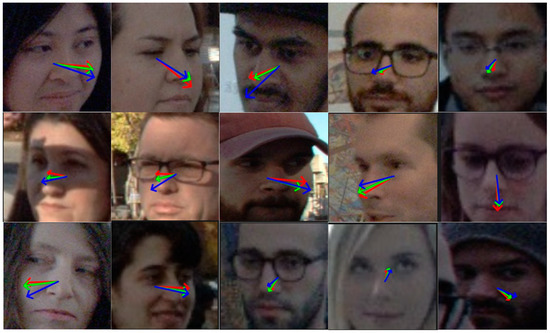
Figure 8.
Visualization of gaze estimation on the Gaze360 dataset.
4.3. Ablation Studies
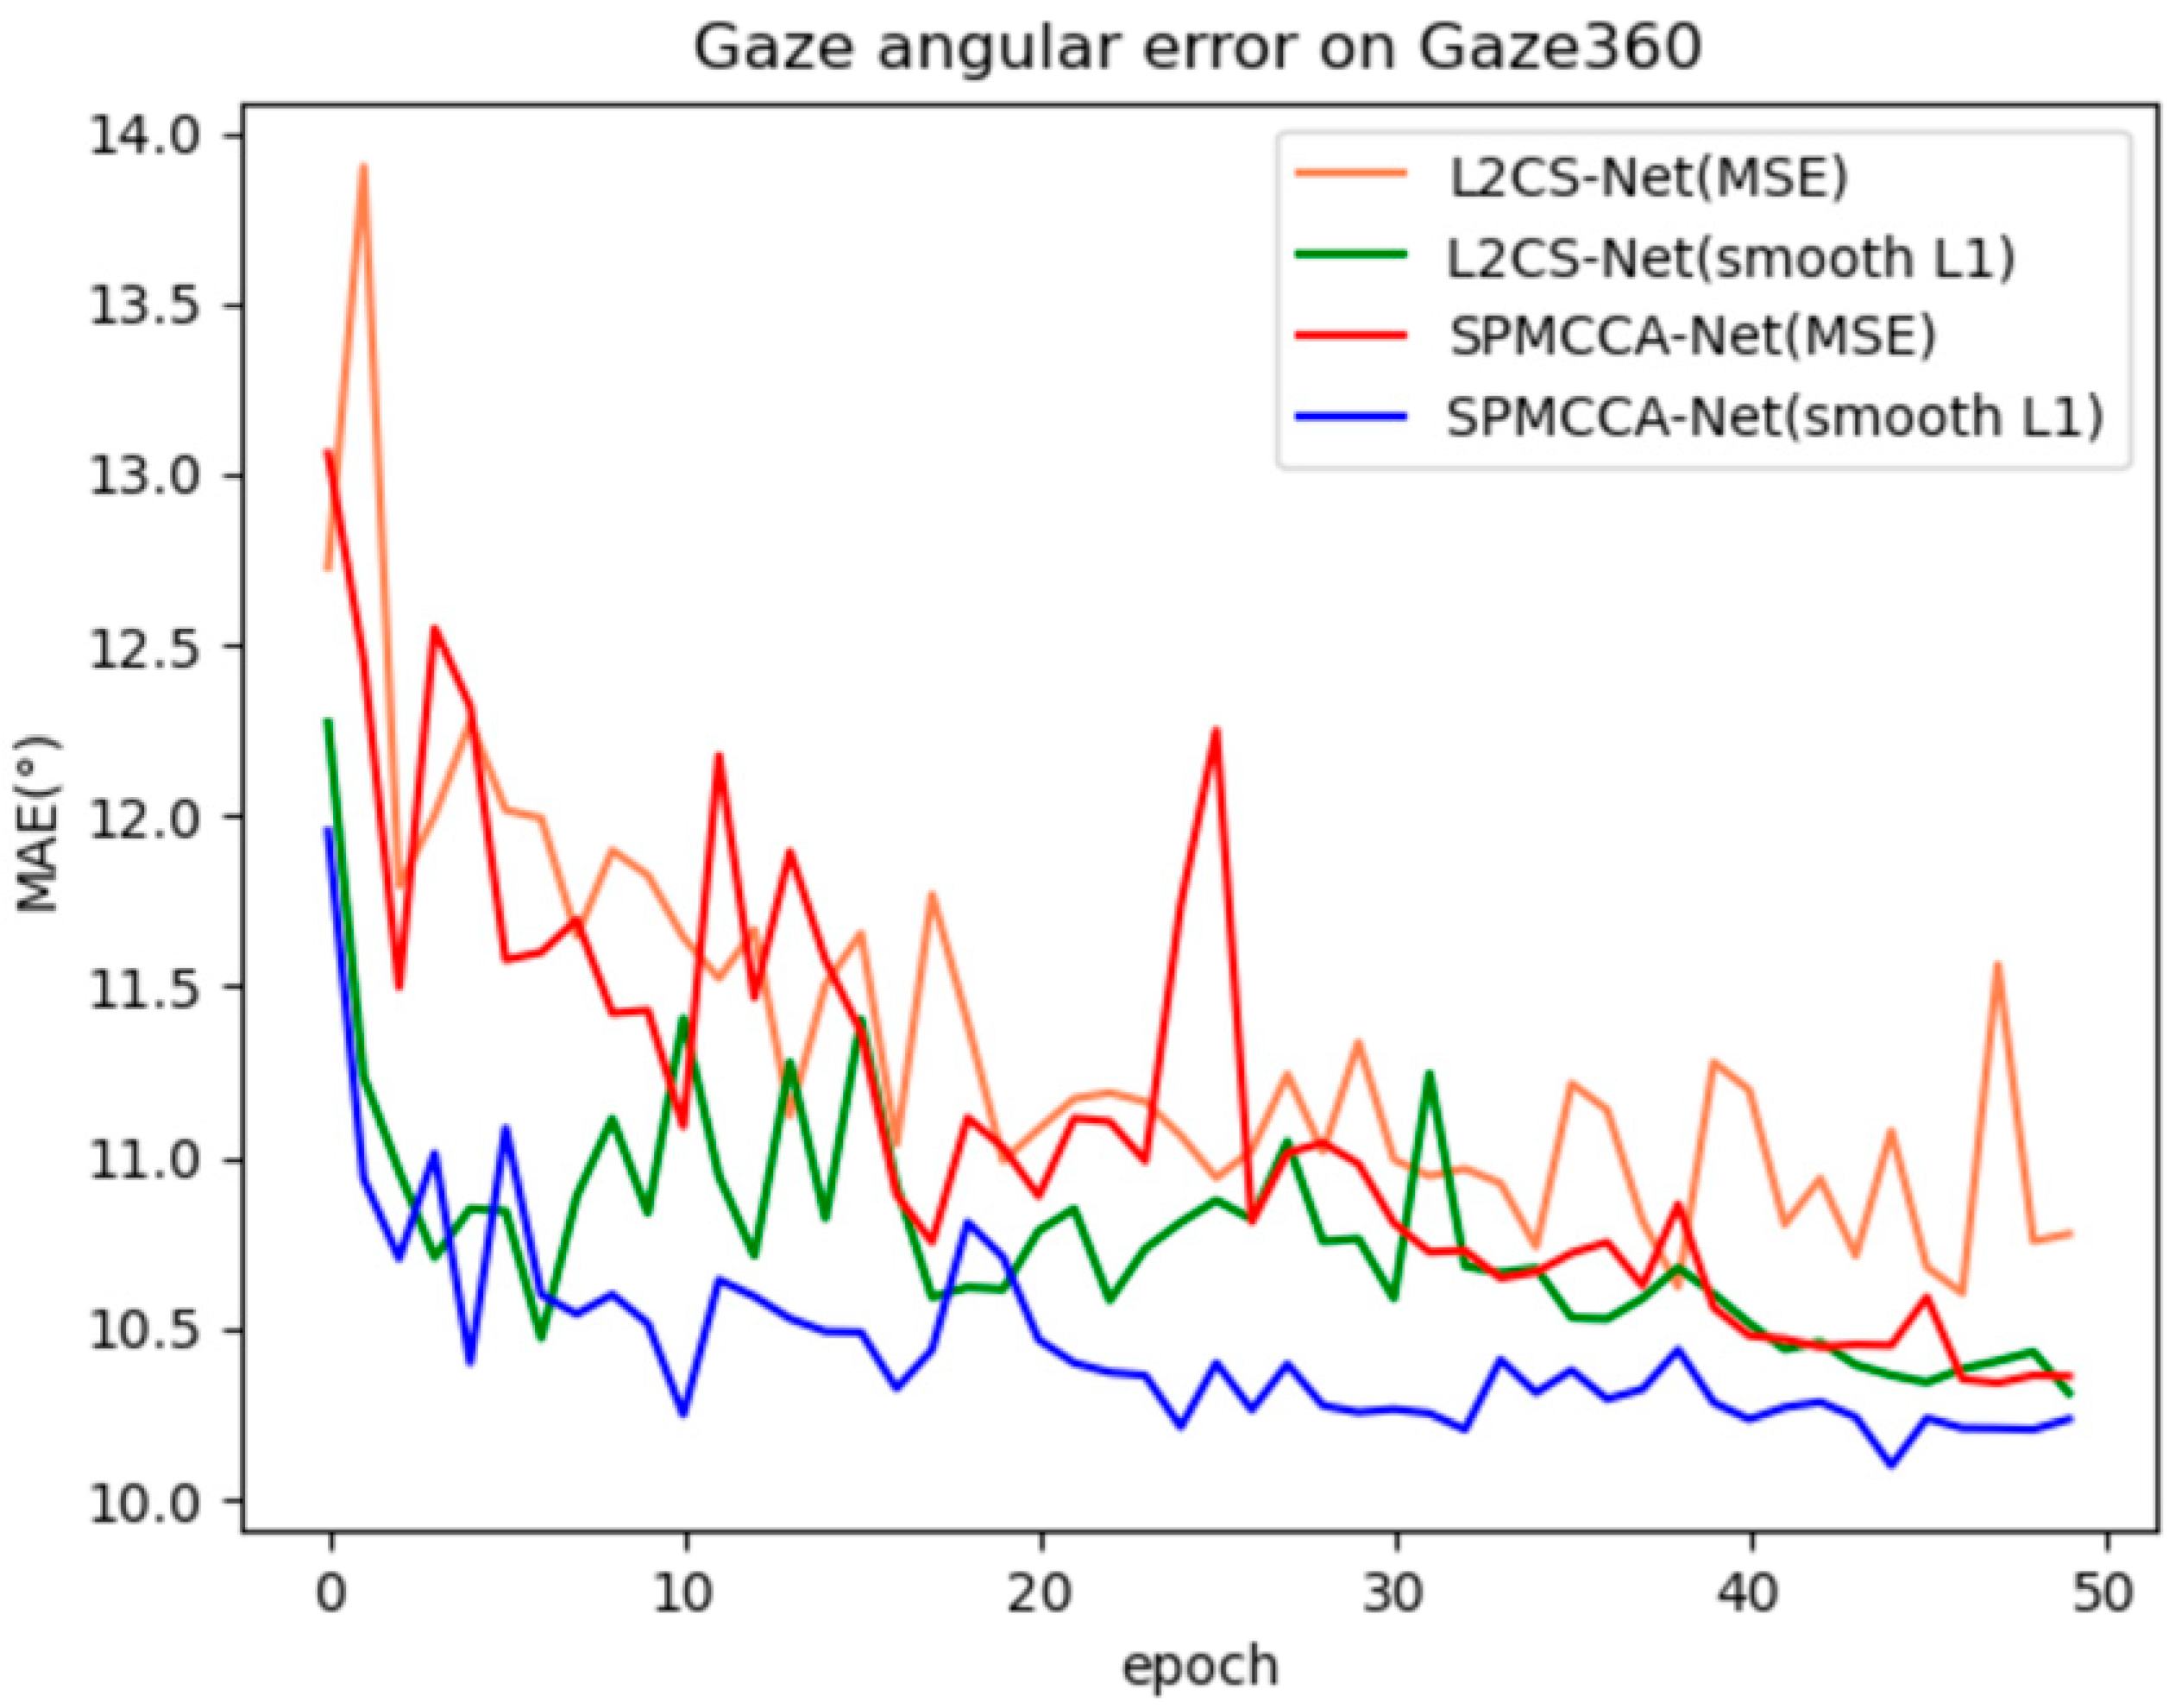
In this paper, we linearly combine cross-entropy loss and smooth L1 loss, and we use different regression coefficients to optimize the network. For a fair comparison with L2CS-Net, only regression coefficients 1 and 2 are chosen here, and we conducted ablation experiments on the performance of 2 regression losses with the Gaze360 dataset on front 180°. In Figure 9, the regression coefficients β of the regression loss for all experiments were set to 2 to facilitate a fair comparison. We found that using smooth L1 loss as a regression loss function or improving the backbone network can both improve the performance of gaze estimation. Moreover, for both L2CS-Net and SPMCCA-Net, using smooth L1 loss as a regression loss function significantly improves the stability and convergence speed of the models during training.
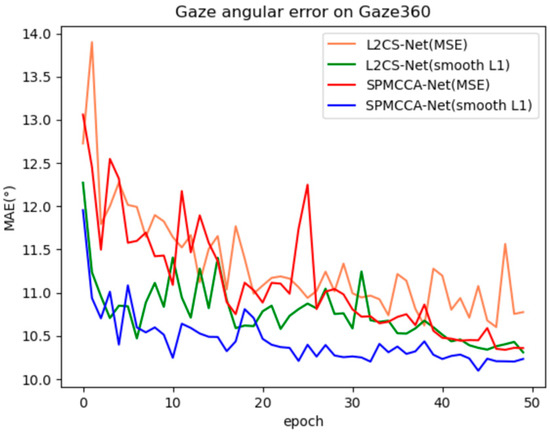
Figure 9.
Training convergence graph of L2CS-Net and SPMCCR-Net on Gaze360.
As shown in Table 4, we validated the proposed method and the baseline method for gaze estimation using face images with resolutions of 448 × 448, 224 × 224, and 112 × 112 on Gaze360 and RT-Gene, and fixed the regression coefficient β to 2. It can be observed that the proposed SPMCCA-Net in this paper can effectively reduce the mean angular error compared to the baseline model, regardless of the resolution used. Additionally, the mean processing time of our proposed method is about 1.45 s for a 448 × 448 image, 0.24 s for a 224 × 224 image, and reduced to about 0.08 s for a 112 × 112 image, which allows us to make effective practical applications.

Table 4.
Ablation analysis of different input image resolutions.
We also validated the two modules on the Gaze360 dataset through ablation experiments to compare their impact on the network (smooth L1 loss is adopted in both regression loss sections).
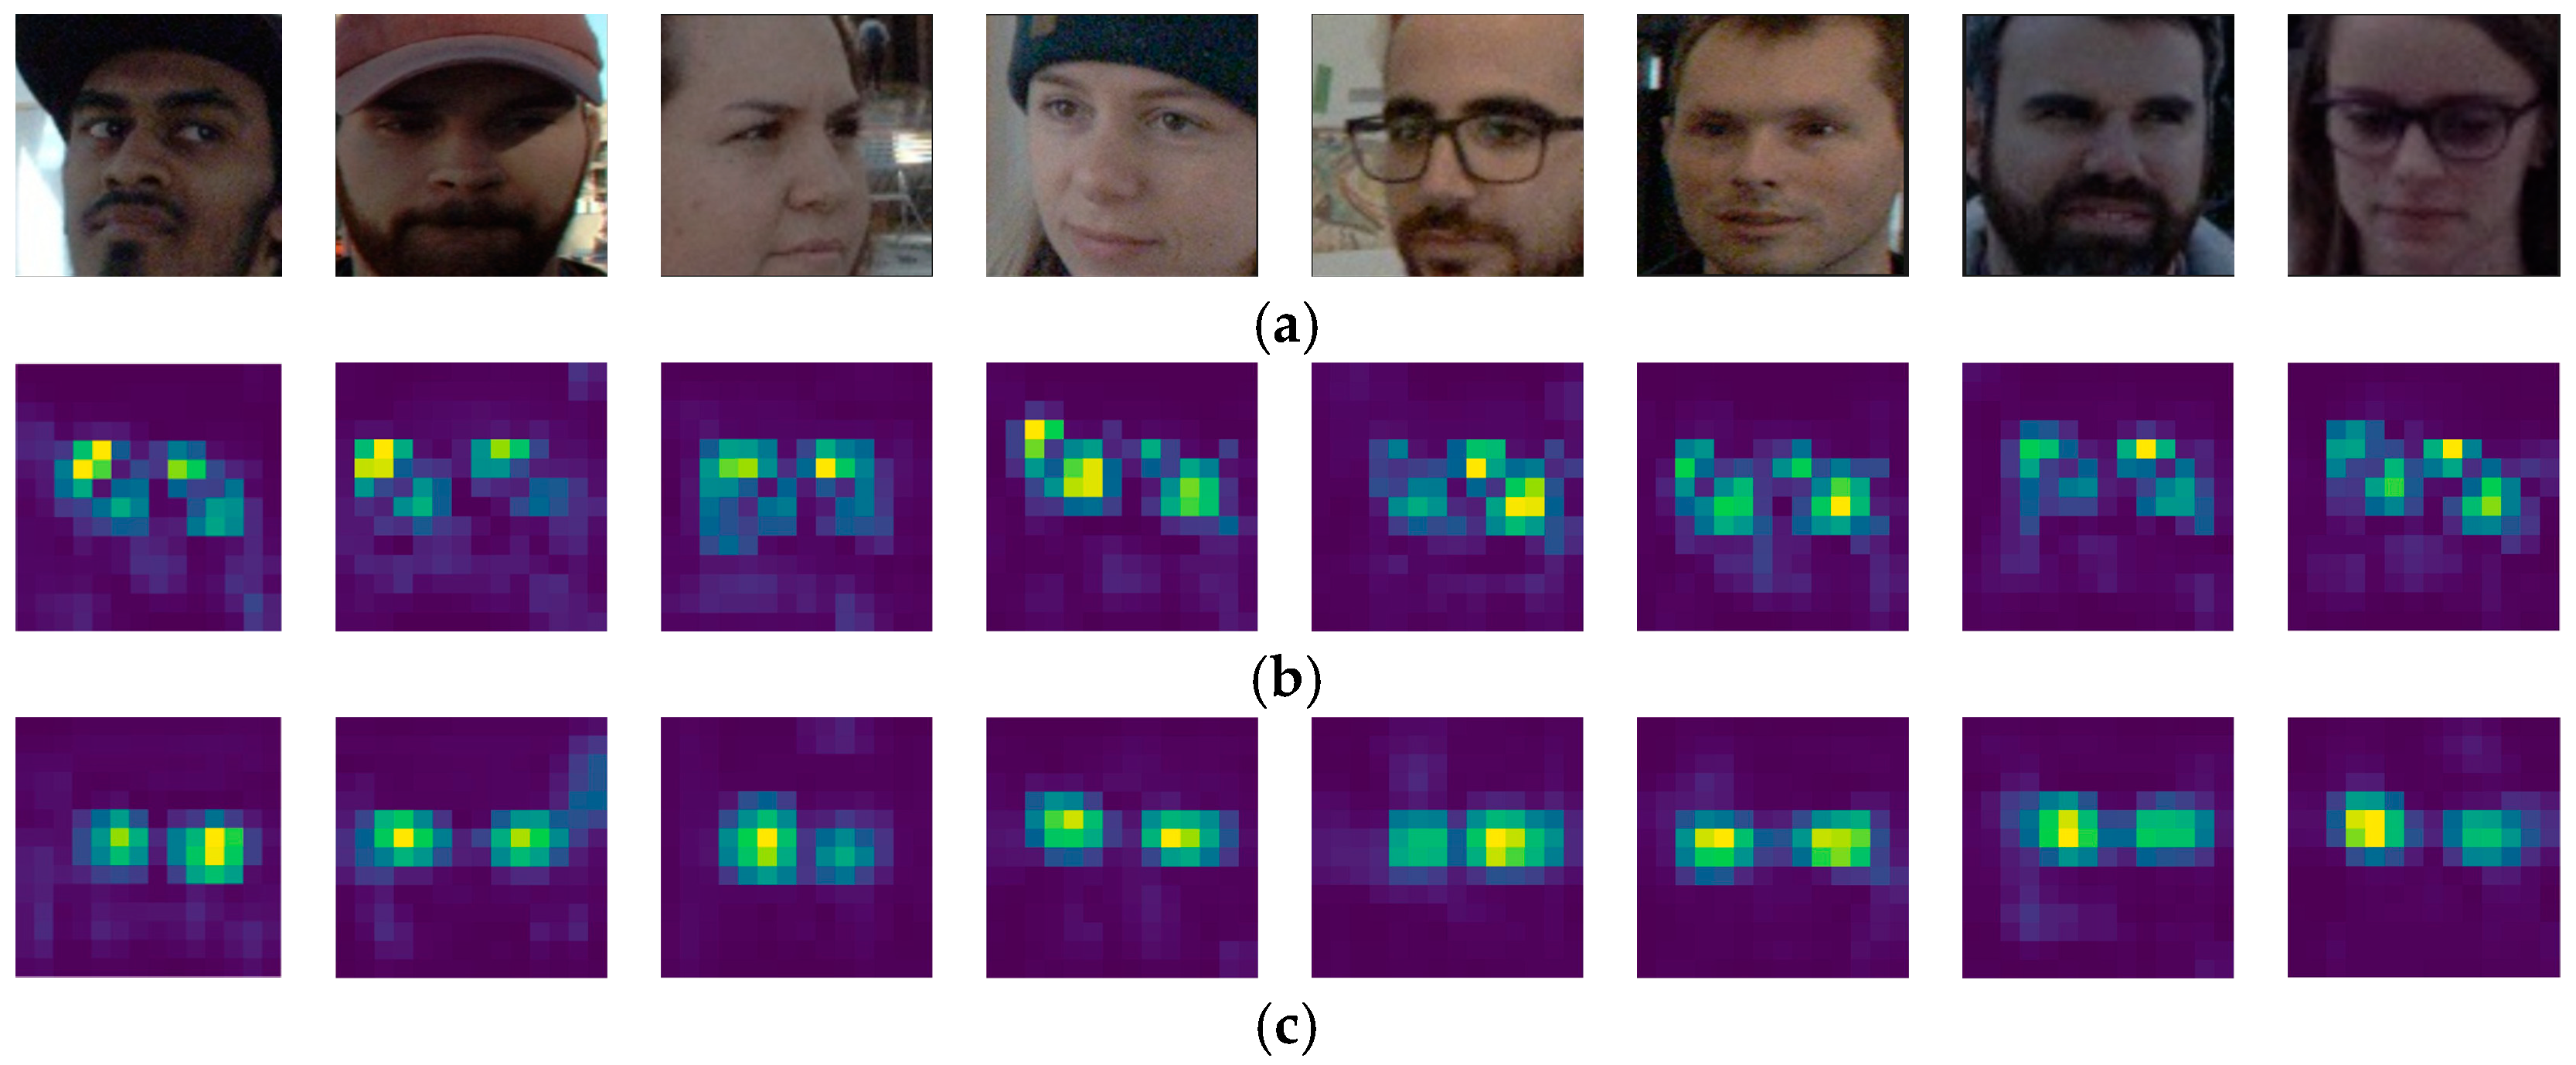
Table 5 shows that, when the backbone network only incorporates the strip pooling module to enhance its ability for capturing long-distance dependencies between the eyes and reduce interference from redundant information, the mean angular error is 10.21° and 6.63°, which produces a mean angular error reduction of 0.12° and 0.02° in comparison with the baseline method on Gaze360 and RT-Gene. When only the multi-criss-cross attention module is engaged, the network captures global context information and can also capture long-distance dependencies between the eyes, resulting in an average angular error of 10.26° and 6.63°, which produces a mean angular error reduction of 0.07° and 0.02° in comparison with the baseline method on Gaze360 and RT-Gene. When both modules are adopted, the mean angular error is 10.13° and 6.61° on each dataset, respectively. The final experiments show that adopting both modules in the backbone network at the same time produces better model performance and improves gaze estimation. The ablation experimental analyses in Table 5 all adopt smooth L1 loss. We also conducted a comparative analysis of the proposed SPMCCA-Net and L2CS-Net via feature map visualization, as depicted in Figure 10. Figure 10a shows the original test map from the Gaze360 dataset, while Figure 10b shows feature map fusion visualization results produced by the L2CS-Net model. The feature maps generated by the original network contain a lot of redundant information, making it difficult to locate the eye regions. Figure 10c shows feature map fusion visualization results for SPMCCA-Net when adopting both proposed modules. Redundant information in the feature maps that is unrelated to gaze is substantially reduced, and the model is more sensitive to feature information from the eye regions. This model assigns greater weight values to those regions while assigning lower weight values to gaze-independent regions, which largely prevents the influence of gaze-independent information on gaze estimation.

Table 5.
Analysis of ablation experiments of the two modules.
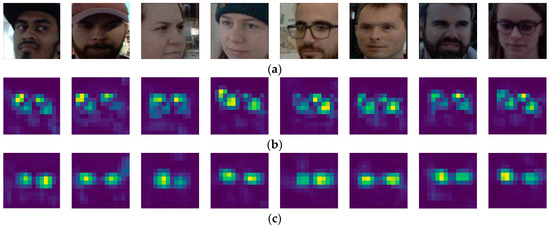
Figure 10.
Comparison of feature map fusion visualizations on Gaze360. (a) face images; (b) visualization of fused feature maps of L2CS-Net; (c) visualization of fused feature maps of SPMCCA-Net.
Since the base method pays more attention to the design of the loss structure aspect than the feature extraction part, it can be seen from Figure 9 and Figure 10 that simply improving the loss function part can also be very effective in improving the model convergence speed and the accuracy of the gaze estimation, while in the feature extraction part, although the degree of attention to the eye regions and the anti-interference ability of redundant information are greatly improved, there is still a tendency to further improve and reduce the final mean angular error.
We additionally conducted ablation analyses for various positions of the two modules applied to the Gaze360 dataset. In Table 6, A indicates that only bottleneck blocks from the final layer of ResNet-50 are adopted as SPbottleneck blocks, while B indicates that the final bottleneck blocks in every layer are adopted as SPbottleneck blocks, and C indicates that all bottleneck blocks are adopted as SPbottleneck blocks. None of the ablation experimental analyses in Table 6 are incorporated into the multi-criss-cross attention module, and all of them adopted smooth L1 loss. The findings show that, when SPbottleneck blocks include the final bottleneck block in every layer and every bottleneck block in the final layer, the lowest mean angular error is 10.21°, which produces a mean angular error reduction of 0.12° in comparison with the baseline method. Table 7 shows that network performance is improved when the multi-criss-cross attention module is added after every layer. In particular, network performance is improved most (with the lowest mean angular error of 10.13°) when the multi-criss-cross attention module is added after layer 1. All of the ablation experiments analyzed in Table 7 were added to the strip pooling module, and smooth L1 loss was adopted as the regression loss. In addition, the ablation experiments on the RT-Gene dataset were not very different, although they were both elevated, so we performed ablation experiments for the Gaze360 dataset only for the ablation experiments in Table 6 and Table 7.

Table 6.
Ablation analysis of the position of the SP module.

Table 7.
Analysis of ablation experiments of the MCCA module.
Based on the above ablation experiments, we conclude that gaze estimation performance is optimized when adding the strip pooling module to the final bottleneck block in every layer and to the final layer of each block across the entire bottleneck, as well as adding the multi-criss-cross attention module after layer 1.
5. Conclusions
In this paper, we propose a novel network architecture, referred to as SPMCCA-Net. We designed this model by incorporating strip pooling and the criss-cross attention mechanism for gaze estimation to address the insufficient ability of existing models to capture long-distance dependencies between the eyes from full-face images and to reduce the impact of redundant information in face images that may interfere with gaze prediction. We further improved model accuracy and enhanced the stability and convergence speed of model training by adopting smooth L1 loss as regression loss. The experimental results with the Gaze360 and RT-Gene datasets demonstrate that the newly designed network outperforms existing gaze estimation methods, with some dependence on the choice of different regression coefficients.
Author Contributions
Funding acquisition, S.D.; investigation, C.Y., S.D., C.X., W.P. and X.L.; methodology, C.Y. and S.D.; project administration, C.Y.; resources, S.D. and C.X.; software, S.D.; supervision, S.D. and C.X.; writing—original draft, C.Y.; writing—review and editing, C.Y., S.D., W.P. and C.X. All authors have read and agreed to the published version of the manuscript.
Funding
This research was funded by the Beijing Natural Science Foundation (4232026), the National Natural Science Foundation of China (Grant No. 61906017, 62102033, 62171042, 61871028, 62272049, 62006020), the Beijing Municipal Commission of Education Project (No. KM201911417001, KM202111417001), the Project of Construction and Support for high-level Innovative Teams of Beijing Municipal Institutions (No. BPHR20220121), the Beijing Advanced Talents Great Wall Scholar Training Program (CIT&TCD20190313), the R & D Program of the Beijing Municipal Education Commission (KZ202211417048), and the Collaborative Innovation Center of Chaoyang (Grant No. CYXC2203). Scientific research projects of Beijing Union University (ZK10202202, BPHR2020DZ02, ZK40202101, ZK120202104).
Institutional Review Board Statement
Not applicable.
Informed Consent Statement
Not applicable.
Data Availability Statement
Not applicable.
Conflicts of Interest
The authors declare no conflict of interest.
References
- Gu, W.; Zhu, Y.; Chen, X.; Zheng, B.; He, L. Research on fatigue detection method based on multi-scale pooled convolutional neural network. Comput. Appl. Res. 2019, 36, 3471–3475. [Google Scholar]
- Ghosh, S.; Dhall, A.; Hayat, M.; Knibbe, J.; Ji, Q. Automatic gaze analysis: A survey of deep learning based approaches. arXiv 2021, arXiv:2108.05479 2021. [Google Scholar]
- Gou, C.; Zhuo, Y.; Wang, K.; Wang, F. Progress and prospects of eye-tracking research. J. Autom. 2021, 45, 1–20. [Google Scholar]
- Cheng, Y.; Wang, H.; Bao, Y.; Lu, F. Appearance-based gaze estimation with deep learning: A review and benchmark. arXiv 2021, arXiv:2104.12668 2021. [Google Scholar]
- Hou, Q.; Zhang, L.; Cheng, M.M.; Feng, J. Strip pooling: Rethinking spatial pooling for scene parsing. In Proceedings of the IEEE/CVF Conference on Computer Vision and Pattern Recognition, Seattle, DC, USA, 13–19 June 2020; pp. 4003–4012. [Google Scholar]
- Huang, Z.; Wang, X.; Huang, L.; Huang, C.; Wei, Y.; Liu, W. Ccnet: Criss-cross attention for semantic segmentation. In Proceedings of the IEEE/CVF International Conference on Computer Vision, Seoul, Republic of Korea, 27–28 October 2019; pp. 603–612. [Google Scholar]
- Ren, S.; He, K.; Girshick, R.; Sun, J. Faster r-cnn: Towards real-time object detection with region proposal networks. Adv. Neural Inf. Process. Syst. 2015, 28, 1–9. [Google Scholar] [CrossRef] [PubMed]
- Zhang, X.; Sugano, Y.; Fritz, M.; Bulling, A. Appearance-based gaze estimation in the wild. In Proceedings of the IEEE Conference on Computer Vision and Pattern Recognition, Boston, MA, USA, 7–12 June 2015; pp. 4511–4520. [Google Scholar]
- Zhang, X.; Sugano, Y.; Fritz, M.; Bulling, A. Mpiigaze: Real-world dataset and deep appearance-based gaze estimation. IEEE Trans. Pattern Anal. Mach. Intell. 2017, 41, 162–175. [Google Scholar] [CrossRef] [PubMed]
- Chen, Z.; Shi, B.E. Appearance-based gaze estimation using dilated-convolutions. In Proceedings of the Asian Conference on Computer Vision, Perth, Australia, 2–6 December 2018; Springer: Berlin/Heidelberg, Germany, 2018; pp. 309–324. [Google Scholar]
- Chen, Z.; Shi, B.E. Geddnet: A network for gaze estimation with dilation and decomposition. arXiv 2020, arXiv:2001.09284 2020. [Google Scholar]
- Cheng, Y.; Lu, F.; Zhang, X. Appearance-based gaze estimation via evaluation-guided asymmetric regression. In Proceedings of the European Conference on Computer Vision (ECCV), Munich, Germany, 8–14 September 2018; pp. 100–115. [Google Scholar]
- Cheng, Y.; Zhang, X.; Lu, F.; Sato, Y. Gaze estimation by exploring two-eye asymmetry. IEEE Trans. Image Process. 2020, 29, 5259–5272. [Google Scholar] [CrossRef] [PubMed]
- Biswas, P.; Murthy, L.R.D. Appearance-based gaze estimation using attention and difference mechanism. In Proceedings of the IEEE/CVF Conference on Computer Vision and Pattern Recognition, Virtual, 19–25 June 2021; pp. 3143–3152. [Google Scholar]
- Cheng, Y.; Huang, S.; Wang, F.; Qian, C.; Lu, F. A coarse-to-fine adaptive network for appearance-based gaze estimation. In Proceedings of the AAAI Conference on Artificial Intelligence, New York, NY, USA, 7–12 February 2020; Volume 34, pp. 10623–10630. [Google Scholar]
- Cheng, Y.; Lu, F. Gaze estimation using transformer. In Proceedings of the 2022 26th International Conference on Pattern Recognition (ICPR), Montreal, QC, Canada, 21–25 August 2022; IEEE: Piscataway, NJ, USA, 2022; pp. 3341–3347. [Google Scholar]
- Abdelrahman, A.A.; Hempel, T.; Khalifa, A.; Al-Hamadi, A. L2CS-Net: Fine-Grained Gaze Estimation in Unconstrained Environments. arXiv 2022, arXiv:2203.03339 2022. [Google Scholar]
- Kong, J.; Wang, H.; Yang, C.; Jin, X.; Zuo, M.; Zhang, X. A spatial feature-enhanced attention neural network with high-order pooling representation for application in pest and disease recognition. Agriculture 2022, 12, 500. [Google Scholar] [CrossRef]
- Jin, X.B.; Wang, Z.Y.; Kong, J.L.; Bai, Y.T.; Su, T.L.; Ma, H.J.; Chakrabarti, P. Deep spatio-temporal graph network with self-optimization for air quality prediction. Entropy 2023, 25, 247. [Google Scholar] [CrossRef] [PubMed]
- Bao, Y.; Cheng, Y.; Liu, Y.; Lu, F. Adaptive feature fusion network for gaze tracking in mobile tablets. In Proceedings of the 2020 25th International Conference on Pattern Recognition (ICPR), Milan, Italy, 13–18 September 2021; IEEE: Piscataway, NJ, USA, 2021; pp. 9936–9943. [Google Scholar]
- Hu, J.; Shen, L.; Sun, G. Squeeze-and-excitation networks. In Proceedings of the IEEE Conference on Computer Vision and Pattern Recognition, Salt Lake City, UT, USA, 18–21 June 2018; pp. 7132–7141. [Google Scholar]
- Zhang, X.; Sugano, Y.; Fritz, M.; Bulling, A. It’s written all over your face: Full-face appearance-based gaze estimation. In Proceedings of the IEEE Conference on Computer Vision and Pattern Recognition Workshops, Honolulu, HI, USA, 21–26 July 2017; pp. 51–60. [Google Scholar]
- Hu, J.; Shen, L.; Albanie, S.; Sun, G.; Vedaldi, A. Gather-excite: Exploiting feature context in convolutional neural networks. Adv. Neural Inf. Process. Syst. 2018, 31, 1–11. [Google Scholar]
- Woo, S.; Park, J.; Lee, J.Y.; Kweon, I.S. Cbam: Convolutional block attention module. In Proceedings of the European Conference on Computer Vision (ECCV), Munich, Germany, 8–14 September 2018; pp. 3–19. [Google Scholar]
- Vieira, G.L.; Oliveira, L. Gaze estimation via self-attention augmented convolutions. In Proceedings of the 2021 34th SIBGRAPI Conference on Graphics, Patterns and Images (SIBGRAPI), Kuala Lumpur, Malaysia, 18 December 2021; IEEE: Piscataway, NJ, USA, 2021; pp. 49–56. [Google Scholar]
- Wang, X.; Girshick, R.; Gupta, A.; He, K. Non-local neural networks. In Proceedings of the IEEE Conference on Computer Vision and Pattern Recognition, Salt Lake City, UT, USA, 18–21 June 2018; pp. 7794–7803. [Google Scholar]
- He, K.; Zhang, X.; Ren, S.; Sun, J. Spatial pyramid pooling in deep convolutional networks for visual recognition. IEEE Trans. Pattern Anal. Mach. Intell. 2015, 37, 1904–1916. [Google Scholar] [CrossRef] [PubMed]
- Liang, T.; Bao, H.; Pan, W.; Pan, F. Traffic sign detection via improved sparse R-CNN for autonomous vehicles. J. Adv. Transp. 2022, 2022, 3825532. [Google Scholar] [CrossRef]
- He, K.; Zhang, X.; Ren, S.; Sun, J. Deep residual learning for image recognition. In Proceedings of the IEEE Conference on Computer Vision and Pattern Recognition, Las Vegas, NV, USA, 27–30 June 2016; 2016; pp. 770–778. [Google Scholar]
- Shahin, A.I.; Aly, W.; Aly, S. MBTFCN: A novel modular fully convolutional network for MRI brain tumor multi-classification. Expert Syst. Appl. 2023, 212, 118776. [Google Scholar] [CrossRef]
- Kellnhofer, P.; Recasens, A.; Stent, S.; Matusik, W.; Torralba, A. Gaze360: Physically unconstrained gaze estimation in the wild. In Proceedings of the IEEE/CVF International Conference on Computer Vision, Seoul, Republic of Korea, 27–28 October 2019; pp. 6912–6921. [Google Scholar]
- Fischer, T.; Chang, H.J.; Demiris, Y. Rt-gene: Real-time eye gaze estimation in natural environments. In Proceedings of the European Conference on Computer Vision (ECCV), Munich, Germany, 8–14 September 2018; pp. 334–352. [Google Scholar]
- Zhang, X.; Park, S.; Beeler, T.; Bradley, D.; Tang, S.; Hilliges, O. Eth-xgaze: A large scale dataset for gaze estimation under extreme head pose and gaze variation. In Proceedings of the Computer Vision–ECCV 2020: 16th European Conference, Glasgow, UK, 23–28 August 2020; Proceedings, Part V 16. Springer: Berlin/Heidelberg, Germany, 2020; pp. 365–381. [Google Scholar]
- Shahin, A.I.; Almotairi, S. DCRN: An optimized deep convolutional regression network for building orientation angle estimation in high-resolution satellite images. Electronics 2021, 10, 2970. [Google Scholar] [CrossRef]
- Fang, Y.; Tang, J.; Shen, W.; Shen, W.; Gu, X.; Song, L.; Zhai, G. Dual attention guided gaze target detection in the wild. In Proceedings of the IEEE/CVF Conference on Computer Vision and Pattern Recognition, Virtual, 19–25 June 2021; pp. 11390–11399. [Google Scholar]
Disclaimer/Publisher’s Note: The statements, opinions and data contained in all publications are solely those of the individual author(s) and contributor(s) and not of MDPI and/or the editor(s). MDPI and/or the editor(s) disclaim responsibility for any injury to people or property resulting from any ideas, methods, instructions or products referred to in the content. |
© 2023 by the authors. Licensee MDPI, Basel, Switzerland. This article is an open access article distributed under the terms and conditions of the Creative Commons Attribution (CC BY) license (https://creativecommons.org/licenses/by/4.0/).

