Article

Theoretical and Simulation Analysis of a Thin Film Temperature Sensor Error Model for In Situ Detection in Near Space

1
School of Mechatronical Engineering, Beijing Institute of Technology, Beijing 100081, China
2
MIIT Key Laboratory of Complex-Field Intelligent Exploration, Beijing Institute of Technology, Beijing 100081, China
3
Yangtze Delta Region Academy of Beijing Institute of Technology, Jiaxing 314000, China
4
Advanced Research Institute of Multidisciplinary Science, Beijing Institute of Technology, Beijing 100081, China
*
Author to whom correspondence should be addressed.
Appl. Sci. 2023, 13(10), 5954; https://doi.org/10.3390/app13105954
Submission received: 8 April 2023 / Revised: 5 May 2023 / Accepted: 10 May 2023 / Published: 12 May 2023
(This article belongs to the Special Issue Information Fusion and Its Applications for Smart Sensing)

Abstract

:
Near space environment is the airspace at 20–100 km, where complex conditions such as low temperature, low pressure, high wind speed, and solar radiation exist. Temperature, as one of the most important meteorological parameters, is crucial for space activities. However, the accuracy of traditional temperature sensors is low, and the influence of complex environments makes the error of conventional temperature measurement methods more extensive. Therefore, we designed a new microbridge temperature sensor to reduce solar radiation and achieve a fast response. Additionally, through simulation analysis, we investigated the three factors influencing the temperature errors of Joule heat, solar radiation heat, and aerodynamic heat. Additionally, the influence of temperature error is reduced by optimizing the installation position of the sensor. The error value in the actual measurement value is removed through the temperature error model to realize the high-accuracy detection of the near space temperature.

Graphical Abstract

1. Introduction

Near space refers to the airspace connecting the sky and space at an altitude of 20~100 km, where it is difficult for general aircraft to operate. It has an important strategic position [1,2,3,4]. The atmospheric environmental parameters in near space, including temperature, pressure, and wind, are critical meteorological parameters that can directly affect space activities, so it is essential to detect these parameters accurately [5,6,7,8]. Its environmental conditions are complex, with temperatures down to minus 70 °C, ultra-low pressure, and a complex wind field [9,10]. In addition, there are also environmental interference factors, such as irradiation and electromagnetism, which affect the high-precision detection of atmospheric environmental parameters in near space [6]. The space-based platform is equipped with multi-parameter radiosondes, forming a sizeable all-height detection cluster with fast maneuvering speed and high coverage. This platform can continuously detect environmental parameters such as temperature, density, wind field, and pressure at fixed points [11,12]. The sounding rocket platform possesses fast maneuverability and high coverage height, while the airship platform exhibits characteristics of high mobility and increased carrying capacity [13,14]. The sounding rocket platform cooperates with the airship platform. It is equipped with radiosondes to overcome the harsh environmental impact of near space and obtain fixed-point continuous detection of ecological parameters. When the radiosonde rises to a specific position with the platform, it is ejected and descends while the parachute opens. Due to the thin air, the radiosonde will drop with a vertical acceleration close to the acceleration of gravity. When reaching a low altitude, the air resistance increases, and the descent rate slows.
During in situ temperature detection, many temperature measurement errors can occur [5]. According to the radiosonde temperature correction model given by the World Meteorological Organization, the factors that cause temperature measurement errors include aerodynamic heat, temperature hysteresis, solar radiation, solar radiation reflected by the ground and clouds, environmental long-wave radiation, radiation from sensors to the environment, heat conduction of the support structure, and Joule heat, which need to be decoupled to obtain the actual atmospheric temperature value [15,16].
Aerodynamic heat: due to the thin atmosphere in near space, the falling speed can reach hundreds of meters per second during the dropping of the radiosonde [4]. The temperature sensor directly exposed to the air compresses the air in front of it, and the gas temperature rises—that is, aerodynamic heat. Therefore, the temperature field where the temperature sensor is located is not the actual atmospheric temperature field but the temperature field superimposed by aerodynamic heat [17,18].
Joule heat: during the working process of the resistance temperature sensor, a large Joule heat is generated due to the enormous resistance value, which significantly impacts its thermal field characteristics. This directly causes temperature measurement errors [19].
Solar radiation: the intensity of solar radiation in near space is significant, and the amount of solar radiation will lead to the change in temperature error caused by the solar radiation heating effect. In addition, the change in air pressure and the sensor surface material will also cause different temperature errors of solar radiation. Other radiation: after entering the Earth’s atmosphere, the solar radiation will be absorbed, reflected, scattered by various components in the air, and then absorbed and reflected by the ground after reaching the ground. This part reflects solar radiation from the ground and clouds, which will increase the sensor’s temperature. In near space, the temperature sensor is also exposed to long-wave radiation from the upper and lower atmosphere and the main body of the radiosonde, which belongs to the environmental long-wave radiation. In addition, there is the thermal radiation of the sensor to the environment in the form of electromagnetic waves [15,16,17,20,21,22].
Support structure heat conduction is the transfer of heat between the sensor and the supporting structure [15].
Temperature hysteresis: The sensor has a particular volume and a heat capacity. When there is a temperature difference from the outside world, the sensor generates stress and needs a certain amount of time to change to the outside temperature, which is called thermal hysteresis [23,24,25].
The primary temperature sensors for radiosonde are thermocouple sensors, bead thermistor temperature sensors, and platinum (Pt) thin film temperature sensors. Among them, the accuracy and linearity of thermocouple sensors are poor. As the most commonly used bead thermistor temperature sensor, it has low sensitivity and is susceptible to electromagnetic interference. The platinum thin film temperature sensor has the advantages of high sensitivity, small size, good stability, and high linearity. In terms of Pt thin film temperature sensor design, most of the existing Pt thin film temperature sensors have Pt deposited on a silicon or alumina substrate or have an adhesion layer added in between to increase the adhesion of the Pt [26,27,28,29]. For example, Huang et al. [29] evaluated electrical characteristics parameters such as resistance temperature coefficient, hysteresis, and measurement accuracy by preparing a temperature sensor with a Ti/Pt thin film layer. Zhang et al. [23] introduced a new processing technique for Pt thin film thermistors and verified the characteristics of Pt film thermistor models. Miyakawa et al. [30] obtained a thin film device with sufficient structural stability and adhesion by sputtering Pt films directly on the substrate and replacing the large-area Pt structure and passivation coating with an interconnected 10 µm wide line. However, this structure still has a significant heat transfer phenomenon from the substrate and the adhesion layer to the Pt thin film, and the Pt thin film heat dissipation is poor. Additionally, there is no radiation-proof structure, resulting in large radiation errors.
In terms of temperature error analysis, Babita et al. [31] studied the variation in the self-heating effect with applied current, temperature, and different surroundings using a platinum resistance thermometer. Han et al. [32] proposed an e-type temperature sensor for high-altitude meteorology, using a 0.02 mm diameter platinum wire as a thermistor. They obtained the radiation temperature correction equation by fitting the simulation results. The uncertainty of solar radiation on temperature measurement was also explored by Philipona et al. [33] and Lee et al. [34]. However, this literature only analyzed one of the errors, and their temperature error models do not match the temperature sensor designed in this paper. Therefore, the structural design and the corresponding temperature error analysis compensation are needed to achieve higher accuracy and temperature measurement performance when in situ temperature measurement is performed in near space.
In addition, Kamiński et al. [35] described how Shannon entropy can be applied to the stochastic analysis of MEMS to evaluate the performance and reliability of MEMS systems. In future research, we will introduce this method to improve the scientific nature of detection and data processing methods [36].
In this paper, by analyzing the source of temperature error, we optimize the sensor structure and the arrangement of sensors according to simulation and practical application and improve the temperature error model to realize high-precision in situ temperature detection in near space. The detected data correct the temperature error and enable a high-precision temperature value of near space [5,12,37].

2. Materials and Methods

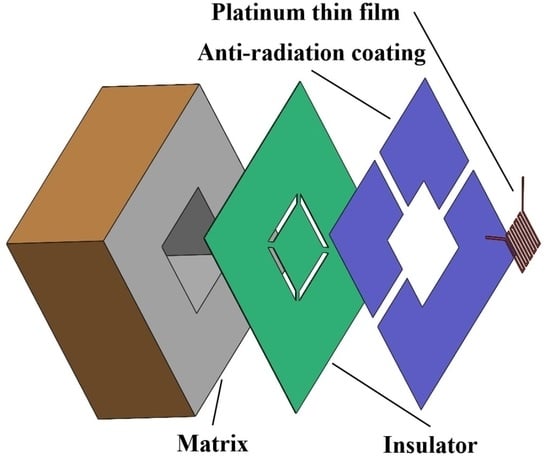
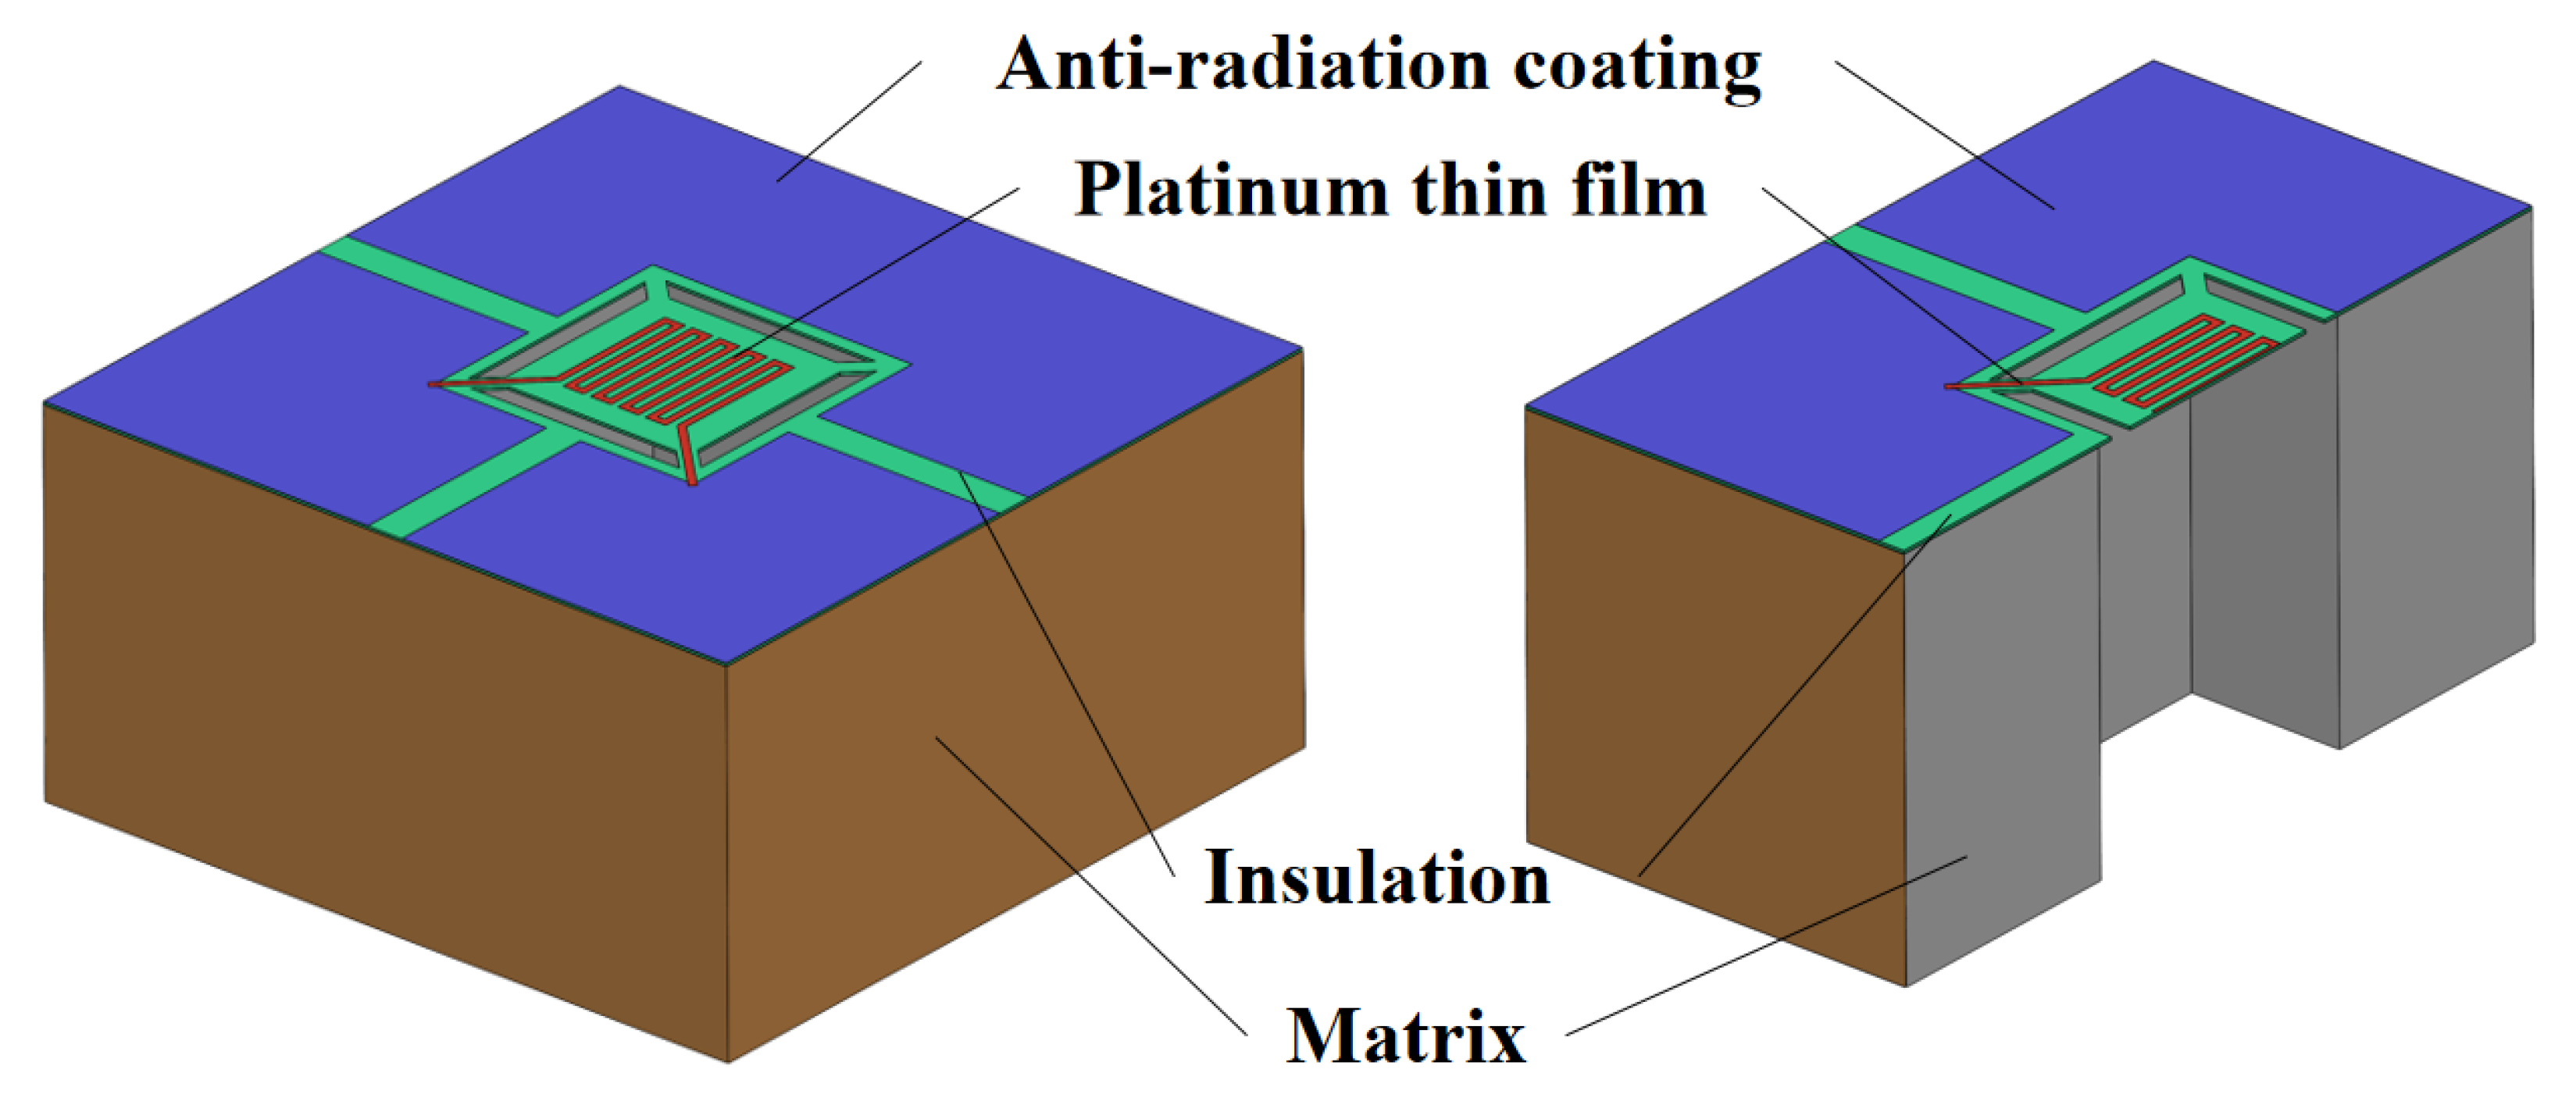
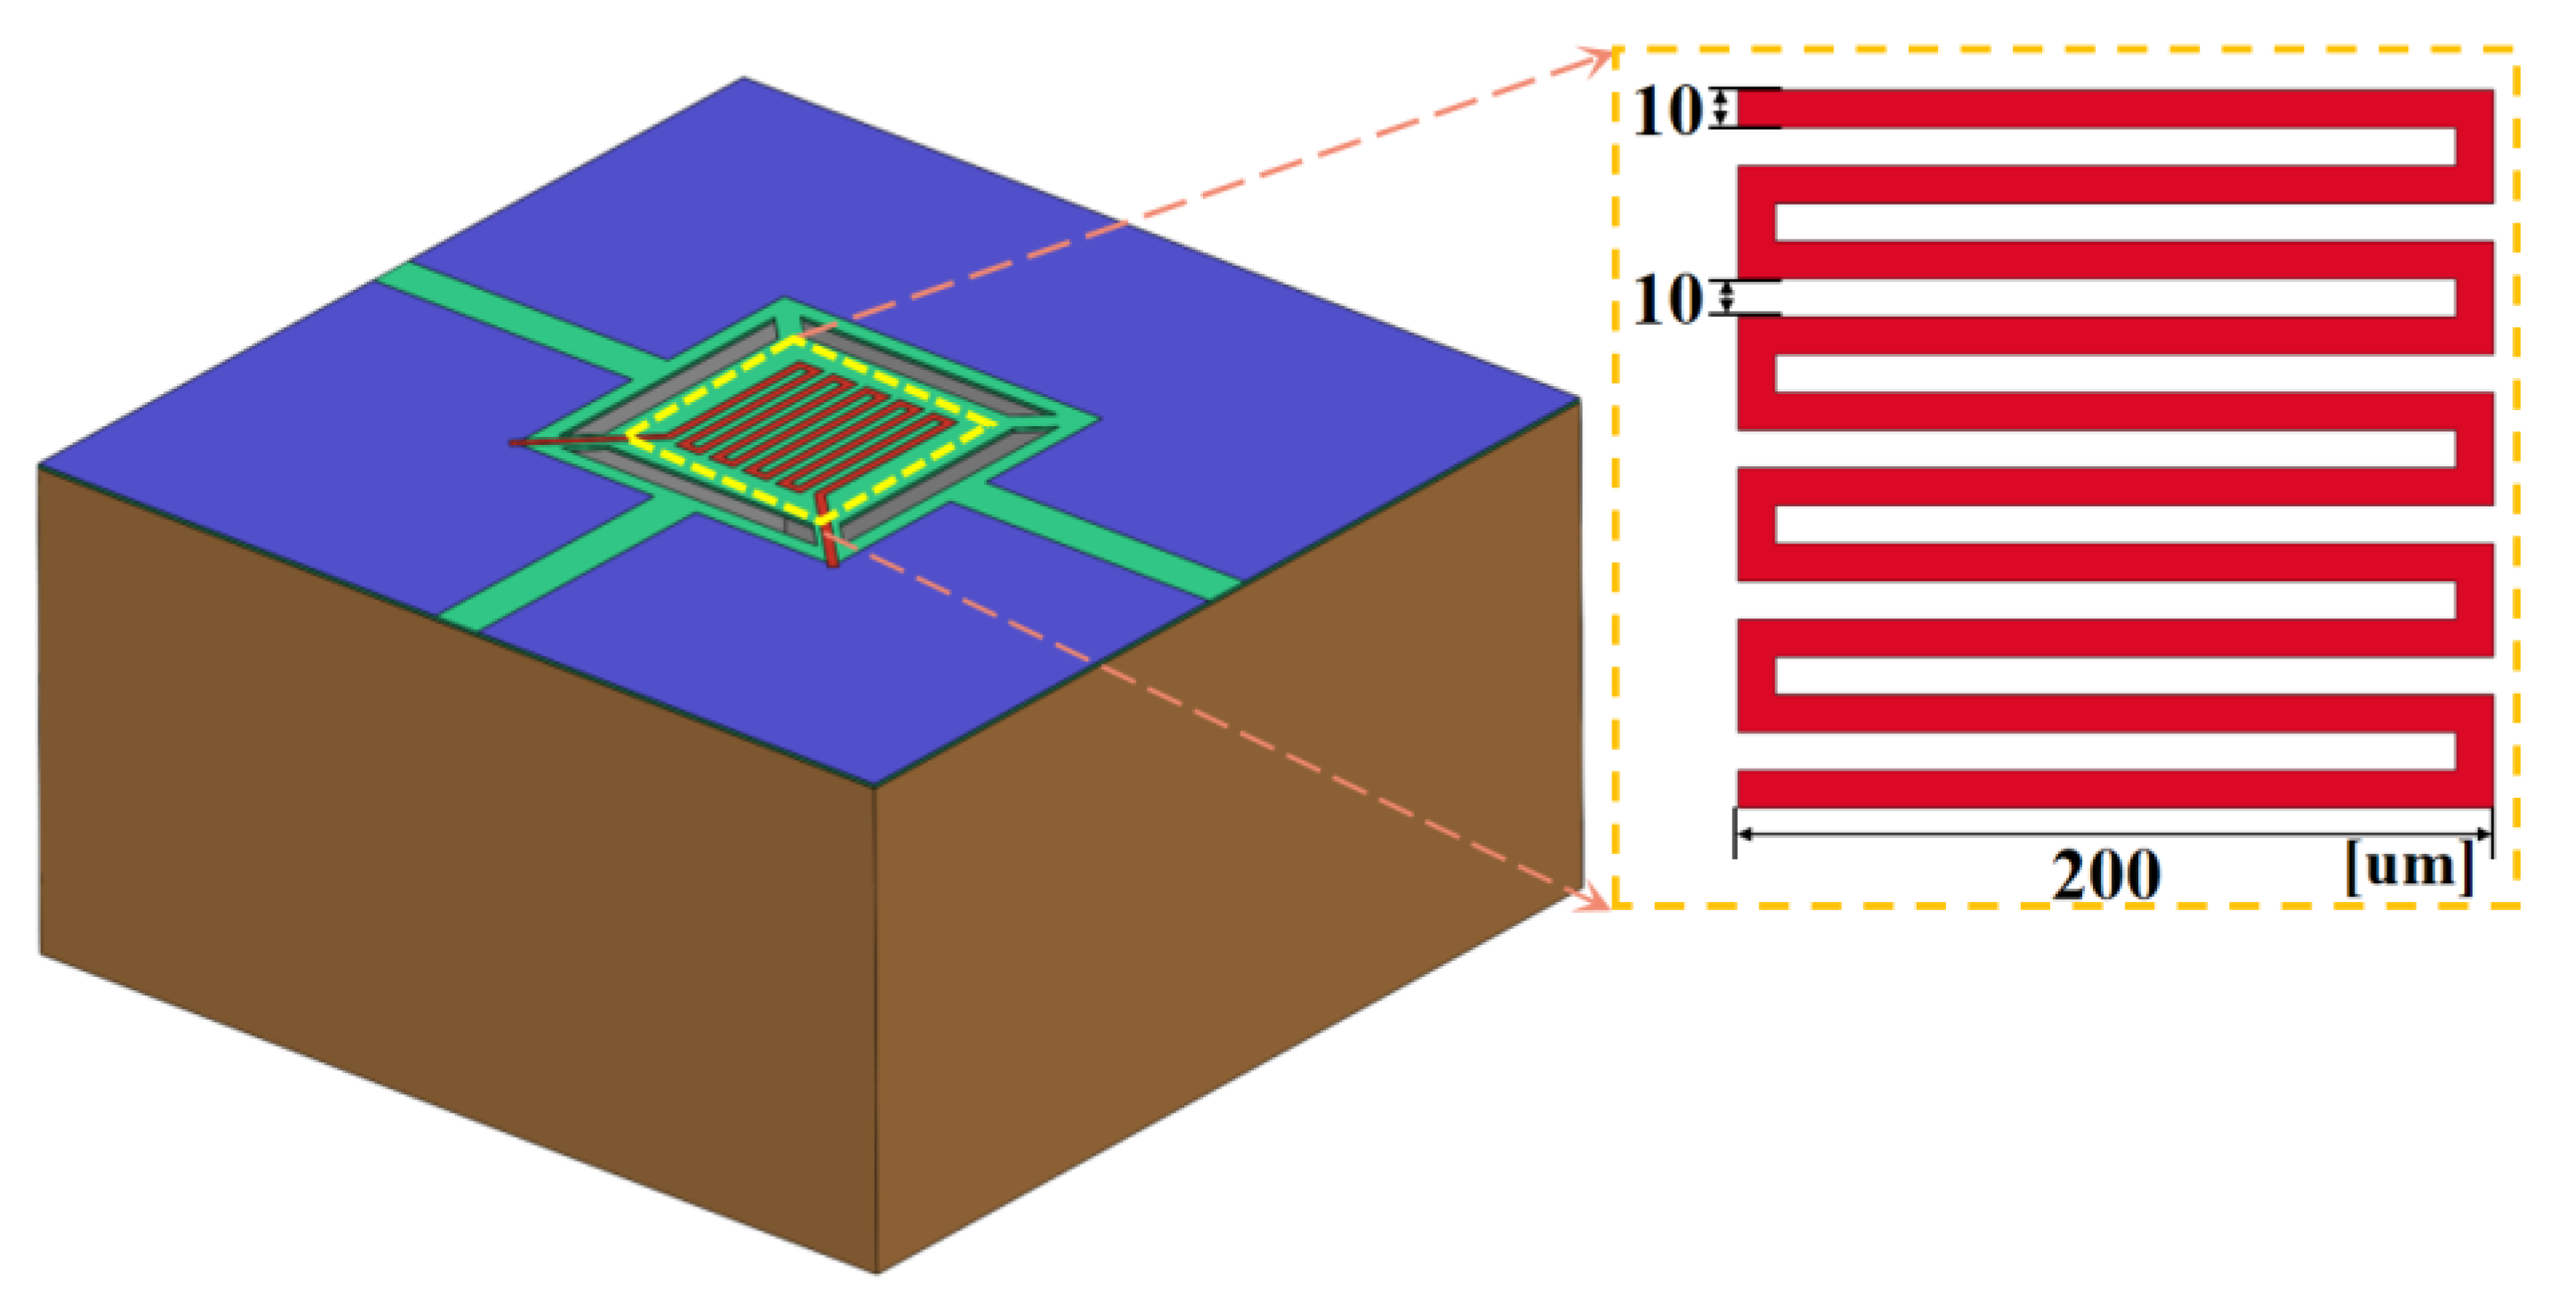
2.1. Structure of Thin Film Temperature Sensor

To accurately measure the fast-changing ambient temperature during the high-speed drop of a radiosonde, the temperature sensor needs to have a fast response and high sensitivity. So, the response speed can be improved by reducing the size of the platinum resistor to reduce the thermal hysteresis. At the same time, to achieve high sensitivity and high accuracy measurement, the resistance value can be increased, and the initial design resistance value is around 100 Ω. In addition, due to the thin atmosphere in near space and the object’s weak heat dissipation capability, the Pt resistor’s surface area needs to be increased to improve its heat dissipation capability. By designing the platinum as a thin film shape, one can achieve the performance of fast response and high-accuracy measurement.
In this scheme, we designed a Pt thin film microbridge temperature sensor, as shown in Figure 1. The sensor consists of three parts, from top to bottom: a thermistor, an insulating layer, and a matrix. The matrix was designed with a central hole to enhance the heat exchange between the thermistor and the air, allowing the insulator’s central part to be suspended. The insulation layer with insulation slots reduces heat transfer from the insulation layer to the thermistor. The thermistor is a Pt thin film, the insulating layer is silicon dioxide, and the substrate is sapphire. First, the Pt thin film’s small size and large surface area make the thermal hysteresis very small and allow for a fast response. Second, silica has good thermal insulation properties. Finally, the sensor has an anti-radiation coating that provides some protection against radiation. Therefore, for the temperature correction model of the radiosonde in this paper, there are three temperature measurement errors: aerodynamic heat, solar radiation, and Joule heat, while the other errors are negligible [23,38].

2.2. Measurement Model of Thin Film Temperature Sensor

During Pt thin film temperature measurement, most of the heat of the Pt thin film can be transferred to the substrate in contact with it through heat conduction, which affects the temperature value of the Pt thin film and causes errors. Therefore, an insulating layer is added between the sensor substrate and the Pt thin film to reduce the solid heat conduction of the Pt thin film [15,23]. The Pt thin film is attached to the insulator, but the suspended micro-bridge structure of the Pt thin film is adopted, and the two ends of the Pt thin film are directly attached to the insulator bridge, as shown in Figure 2. The accuracy of the sensor can be improved by reducing the contact surface and reducing the ineffective heat loss from the Pt thin film, as shown in the following Equation:
Q 1 = A 1 λ 1 · Δ T 1
where Q 1 is the heat transfer between the Pt thin film and the insulation layer, A 1 is the contact area between them, λ 1 is the heat transfer coefficient between them, and Δ T 1 is the temperature difference between the two contact surfaces.
The matrix size is 1000 µm × 1000 µm × 500 µm, the inner hole size is 400 µm × 400 µm × 500 µm, and the insulator size is 1000 µm × 1000 µm × 20 µm. The Pt thin film is a bending type with a width of 10 µm, a thickness of 0.2 µm, a spacing of 10 µm, a single strip length of 200 µm, and a total resistance of 112.98 Ω.
The temperature measurement principle of the Pt thin film temperature sensor is that the Pt resistance value is linearly related to the temperature. We can apply a fixed voltage across the Pt film and measure the current to calculate the Pt resistance [38]. When the external temperature changes, the resistance of the Pt thin film changes, which causes the current in the circuit to change. Then, the Pt thin film temperature (ambient temperature) can be obtained by measuring the current. Equation (2) shows the relationship between resistance and temperature, Equation (3) is the relationship between current and resistance under specific voltage, and Equation (4) is the change of the current with temperature:
R = R 0 1 + α ( t t 0 )
I = U R
I = U R 0 1 + α ( t t 0 ) 0
where R is the resistance value of the Pt thin film, R 0 is the resistance value of Pt thin film at 0 °C, α is the temperature coefficient of Pt resistance, I is the current value, U is the voltage value across the platinum film, t is the ambient temperature, and t 0 is 0 °C.

3. Theoretical Analysis and Simulation Model of Temperature Error

This paper proposes an error correction method for the temperature measurement process in near space through theoretical analysis of Joule heat, radiation heat, and aerodynamic heat generated by the temperature sensor during operation. The method was further validated through simulations using COMSOL and ANSYS software. The simulation results provided an error model, optimizing the sensor structure as much as possible. Error compensation of the actual detection data can lead to higher measurement accuracy. We can use this error correction method to perform in situ temperature measurements in near space.

3.1. Joule Heat

The Pt thin film sensor will generate Joule heat when it works, and the magnitude of Joule heat is related to the applied voltage and the Pt thin film resistance. Increasing the resistance value of the Pt thin film is necessary to enhance the sensor’s sensitivity. When the temperature changes, the greater the resistance change value is, and the greater the current change value is, the more sensitive the sensor is. Equation (5) shows the relationship between the current change and resistance value:
Δ I = U Δ R = U R 0 1 + α ( t t 0 ) 0
where Δ I is the current variation value, and Δ R is the voltage variation value.
However, the larger the resistance value, the larger the Pt thin film volume, leading to a larger sensor volume and Joule heat. Therefore, considering comprehensively, the resistance value of the Pt thin film was set to about 100 Ω (0 °C). The Joule heat of the sensor was also analyzed to obtain the temperature sensor’s measurement error and response time under the co-effect of rated voltage and heat dissipation.
To analyze the influence of different mechanical structures on the performance of the temperature sensor, we designed six insulators, as Figure 3 shows. The main difference between these six insulators was the size of the contact area between the platinum film and the insulator, which was used to study the effect of the contact area size on sensor performance. The contact area between the two increases sequentially from Insulator 1 to Insulator 5. In addition, Insulator 6 was designed for comparison with Insulator 5 to show the performance of the thermal insulation tank.
During the Joule thermal simulation of the temperature sensor, a voltage of 0.04 V was applied to both ends of the Pt thin film to study the influence of environment temperature on Joule heat. We set the ambient temperature at 233.15 K, the absolute pressure at 50 Pa, and the wind speed at 100 m/s. The initial temperature of the sensor was set at 228.15 K and 238.15 K, respectively. We compared the response time and Joule heat of six types of sensors to select the best insulator. The response time of the temperature sensor is represented by τ, and τ refers to the time required for the output change of the temperature sensor to reach 63.2% of the difference between its initial final value [39].
The Joule heat of the sensor was analyzed to obtain the temperature variation and response time of the temperature sensor under the combined effect of rated voltage and heat dissipation. The electrical load of the Pt thin film was determined before probing, the Joule heat generated by the current during probing was steady, and the air pressure further influenced the temperature value of the Pt thin film by affecting the heat transfer coefficient. The equations for heat dissipation and Joule heat of a Pt thin film are as follows:
Q 2 = A 2 λ 2 · Δ T 2
Q A = U 2 t s R
where Q 2 is the heat dissipated, A 2 is the contact area between the Pt thin film and the air, λ 2 is the heat transfer coefficient between them, Δ T 2 is the temperature difference between the two sides of the Pt thin film–air interface, Q A is the joule heat, and t s is the unit time.
Thus, the amount of heat gain in the Pt thin film due to Joule heat is expressed as Equation (8):
Q a = Q A Q 1 Q 2 = U 2 t s R A 1 λ 1 Δ T 1 A 2 λ 2 Δ T 2
Then, the value of the temperature increase in the Pt thin film is:
T a = Q a c m
where T a is the temperature rise of the Pt thin film due to Joule heat, Q a is the thermal increment in the Pt thin film due to Joule heat, c is the specific heat capacity of the Pt thin film, and m is the mass of the Pt thin film.
Therefore, the initial temperature of the sensor was set to 231.15 K and the ambient temperature to 233.15 K. The temperature sensor was simulated and analyzed at ambient pressures of 5 × 10 0 Pa, 5 × 10 1 Pa, 5 × 10 2 Pa, 5 × 10 3 Pa, 5 × 10 4 Pa, and 5 × 10 5 Pa to compare the differences in steady-state time and response rate.

3.2. Solar Radiation

When the temperature sensor conducts in situ measurements in near space, the Pt thin film will receive direct solar radiation and scattered radiation from the surrounding environment, which can transfer heat energy.
The formula for calculating the radiation heat flux of an object is:
Q B = A 3 { σ ε ( T m 4 T n 4 ) + I s ( 1 ε ) }
where A 3 is the irradiated surface area; σ is the Stephen–Boltzmann constant, which is 5.67 × 10 8 W / ( m 2 K 4 ) , ε is the emissivity of the object, and its value is 0~1; T m is the object’s surface temperature; T n is the temperature of the air; and I s is solar radiation intensity.
Thus, the amount of heat gain in the Pt thin film due to radiation heat is expressed as Equation (11):
Q b = Q B Q 1 Q 2 = A 3 { σ ε ( T m 4 T n 4 ) + I s ( 1 ε ) } A 1 λ 1 Δ T 1 A 2 λ 2 Δ T 2
Then, the value of the temperature increase in the Pt thin film is:
T b = Q b c m
where T b is the temperature rise of the Pt thin film due to Joule heat, and Q b is the thermal increment of the Pt thin film due to Joule heat.
In the design, we can modify the sensor’s surface emissivity to minimize the impact of radiation on the temperature sensor. The surface emissivity of the silicon substrate and the silicon dioxide insulation layer is above 0.5. The material surface was coated with radiation protection, and the coating structure is shown in Figure 1. In order to analyze the influence of different anti-radiation coatings on the radiation temperature rise, we studied the effect of coatings on sensor temperature. Copper, aluminum, and silver were selected as radiation-proof materials, and their surface emissivity was 0.03, 0.02, and 0.01, respectively. The atmospheric temperature was set at 233.15 K; the initial temperature of the sensor was 238.15 K; the ambient air pressure was 50 Pa; the wind speed was 100 m/s; and the solar radiation was set to 500 W/m2, 1000 W/m2, 1500 W/m2, and 2000 W/m2 to study the effect of radiation magnitude on the temperature rise in the temperature sensor. Similarly, different air pressures affect the Pt thin film heat dissipation, which further affects the temperature error generated by radiation. Therefore, the temperature rise in the sensor under different air pressure conditions of 5 × 10 0 Pa, 5 × 10 1 Pa, 5 × 10 2 Pa, 5 × 10 3 Pa, 5 × 10 4 Pa, and 5 × 10 5 Pa was studied.

3.3. Aerodynamic Heat

Based on the Joule and radiant heat simulation analysis above, the sensor scheme was determined, and further optimization of the sensor arrangement was carried out based on the aerodynamic heat analysis of the model. The positive work of air compression on the front of the object causes aerodynamic heat, making it more prominent at the front. Still, the parts around the object also have airflow disturbances that create a specific temperature difference. Therefore, we used ANSYS software to analyze the aerodynamic heat of the radiosonde and sensor to explore the distribution of the aerodynamic heat field [17]. Our analysis created a cuboid flow field surrounding the sensor to establish a fluid boundary. The boundary conditions were determined by selecting the mathematical model. The K-epsilon standard model was selected for the turbulence model, and the SIMPLE algorithm was used to solve the pressure field and velocity field. We determined the boundary conditions by selecting the mathematical model. Specifically, we chose the K-epsilon standard model for the turbulence model and used the SIMPLE algorithm to solve the pressure and velocity field. In this study, the sensor’s geometric model’s unstructured meshes were generated using the ICEM meshing software. To balance the calculation amount and accuracy, we set the size of the airfield outside the sensor to 10 mm × 10 mm × 15 mm. Additionally, we positioned the sensor in the middle of the front end of the fluid area. The overall calculation model is shown in Figure 4. To set the boundary conditions, the left end of the front end of the air domain was the velocity inlet boundary, the left end was the pressure outlet boundary, the four sides were the pressure far-field boundary, and the outer surface of the sensor was set as the fixed wall boundary.
The high-speed movement of the sensor in near space will compress the front air. This positive pressure will cause the gas to compress and deform, and the gas will move toward the center under the action of external forces. Therefore, the sensor will act positively on this part of the gas, raising the temperature. Aerodynamic heat generated on rockets and other aircraft exceeds 1000 K [40,41]. In the simulation of the sensor falling with the radiosonde by ANSYS software, it was found that this aerodynamic heat can make the gas temperature rise by tens or even hundreds of degrees. The magnitude of aerodynamic heat is related to the rate of descent of the object, i.e., to the relative flow rate of air. Additionally, the atmospheric pressure affects the specific heat capacity of air and the size of aerodynamic heat. First, the thermal field distribution of the radiosonde and sensors was studied by simulating the aerodynamic heat field distribution at different altitude locations during the radiosonde’s descent for sensor placement. Then, its effect on the aerodynamic heat of the radiosonde and sensor was studied by setting various air pressures ( 5 × 10 0 Pa, 5 × 10 1 Pa, 5 × 10 2 Pa, 5 × 10 3 Pa, 5 × 10 4 Pa, and 5 × 10 5 Pa) and relative air flow rates (100 m/s, 150 m/s, 200 m/s, 250 m/s, and 300 m/s). To reduce the computational effort, we simplified the whole model from a three-dimensional model to a two-dimensional model.
We studied the effects of different air pressures and relative air flow rates on the aerodynamic heat of the radiosonde or sensor.
The aerodynamic heat error model is shown in Equation (13):
T c = 0.5 × ρ V 3 A s c P
where T c is the aerodynamic heat correction error, ρ is the air density, V is the relative air velocity, A s is the reference area of the sensor, and c P is the air isobaric specific heat capacity.

3.4. Overall Model

The temperature error model in near space includes the measured temperature values of the temperature sensors and the Joule heat, radiant heat, and aerodynamic heat error values caused by external disturbances. To obtain the real temperature value of the atmosphere, it is necessary to eliminate the temperature error value caused by disturbance factors from the measured temperature value of the temperature sensor. Therefore, we constructed a temperature error model that can express the calculated value of the temperature sensor as
T 0 = T 1 + T 2 2
where T 1 and T 2 are the measured data of two temperature sensors.
According to the definition, the near space temperature T is calculated as shown in Equations (15) and (16):
T = T 0 Q A Q B Q 1 Q 2 c m T c
T = T 1 + T 2 2 U 2 t s R + A 3 { σ ε ( T m 4 T n 4 ) + I s ( 1 ε ) } A 1 λ 1 Δ T 1 A 2 λ 2 Δ T 2 c m 0.5 × ρ × V 3 × A s c P

4. Results and Discussion

4.1. Joule Heat

4.1.1. The Effect of Different Insulators on Joule Thermal Errors

Figure 5 shows the temperature change curve of Pt thin film for sensors with different insulators when the initial temperatures are 228.15 K and 238.15 K, respectively. We prepared Sensors 1–6, using Insulators 1–6 (as depicted in Figure 3) as the insulator structures for each sensor, respectively. Accordingly, the temperature corresponding to the response time is 231.31 K and 234.99 K, respectively. It can be seen in the figure that all curves change sharply at first and then slowly, and the final temperature approaches a steady state, which is higher than the ambient temperature. The final temperature decreases as the sensor number increases and the response time increases.
The reason for the above phenomenon is that the Joule heat causes the final temperature of the Pt thin film to be greater than the ambient temperature. As can be seen in the graph, temperature Sensor 5 has the fastest temperature change of the Pt thin film, followed by Sensor 4, Sensor 3, Sensor 2, and Sensor 1. It can be seen in Equations (1) and (6) that the heat dissipated by the Pt film is proportional to the contact area. Additionally, the heat exchange between the Pt thin film and the silica is faster than that with the air. The large surface area of the silica makes it more fully exchange heat with the air, so the larger the area of the silica, the faster its temperature response.
However, Sensor 6 is the slowest. This is because there is no insulating notch on the silica layer, the heat capacity of the whole sensor is large, and the temperature of the Pt film changes very slowly. For balance, the fifth temperature sensor was chosen to shorten the temperature sensor’s response time and improve the sensor’s measurement accuracy. As shown, under the influence of Joule heat, Sensor 5 had a response time of 20 ms during warming and 99 ms during cooling.

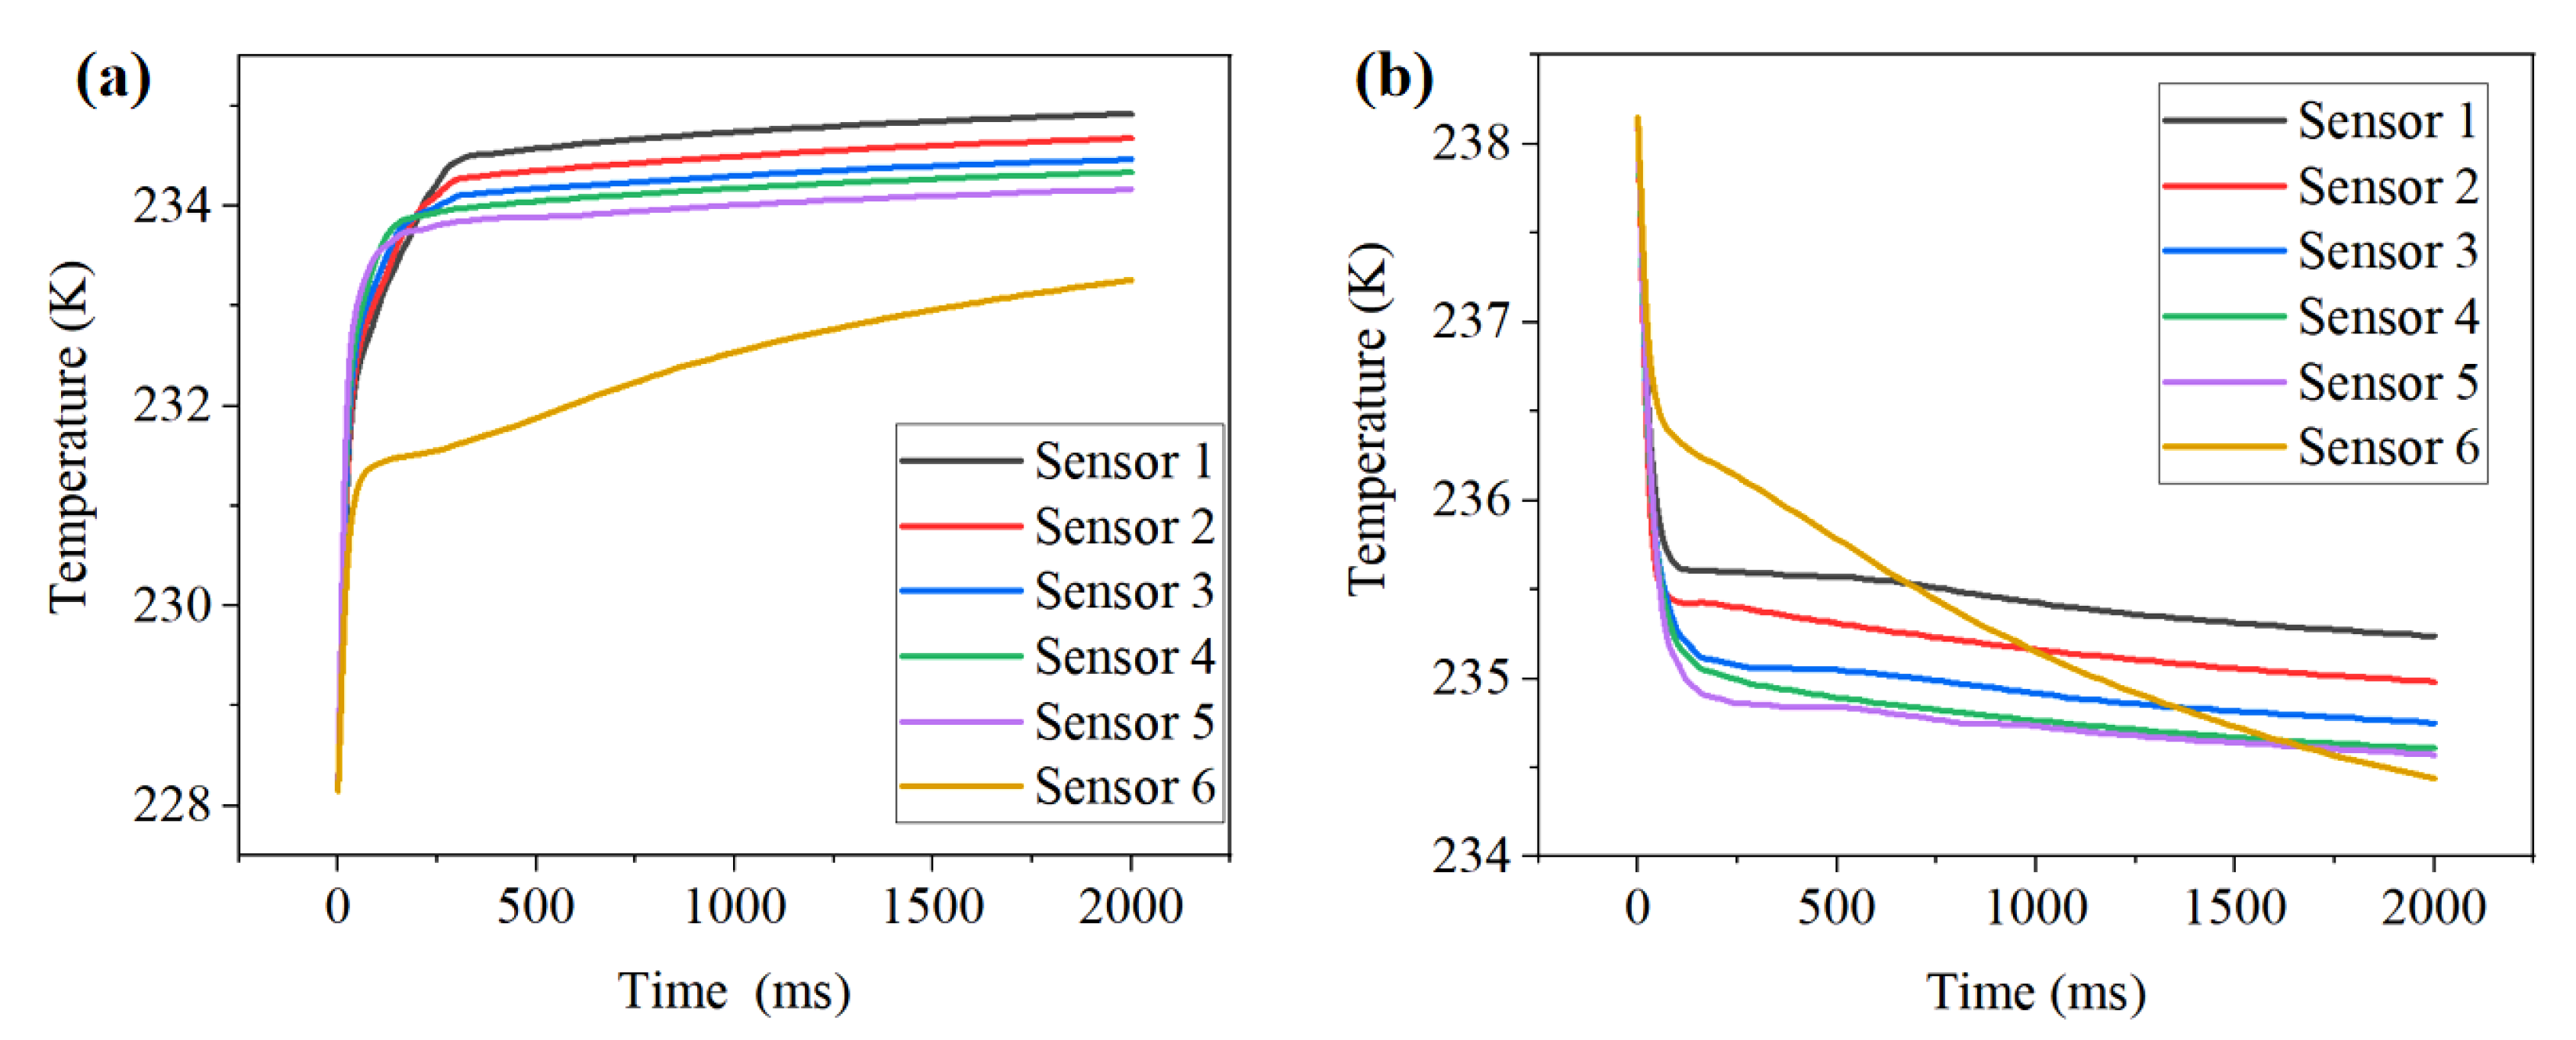
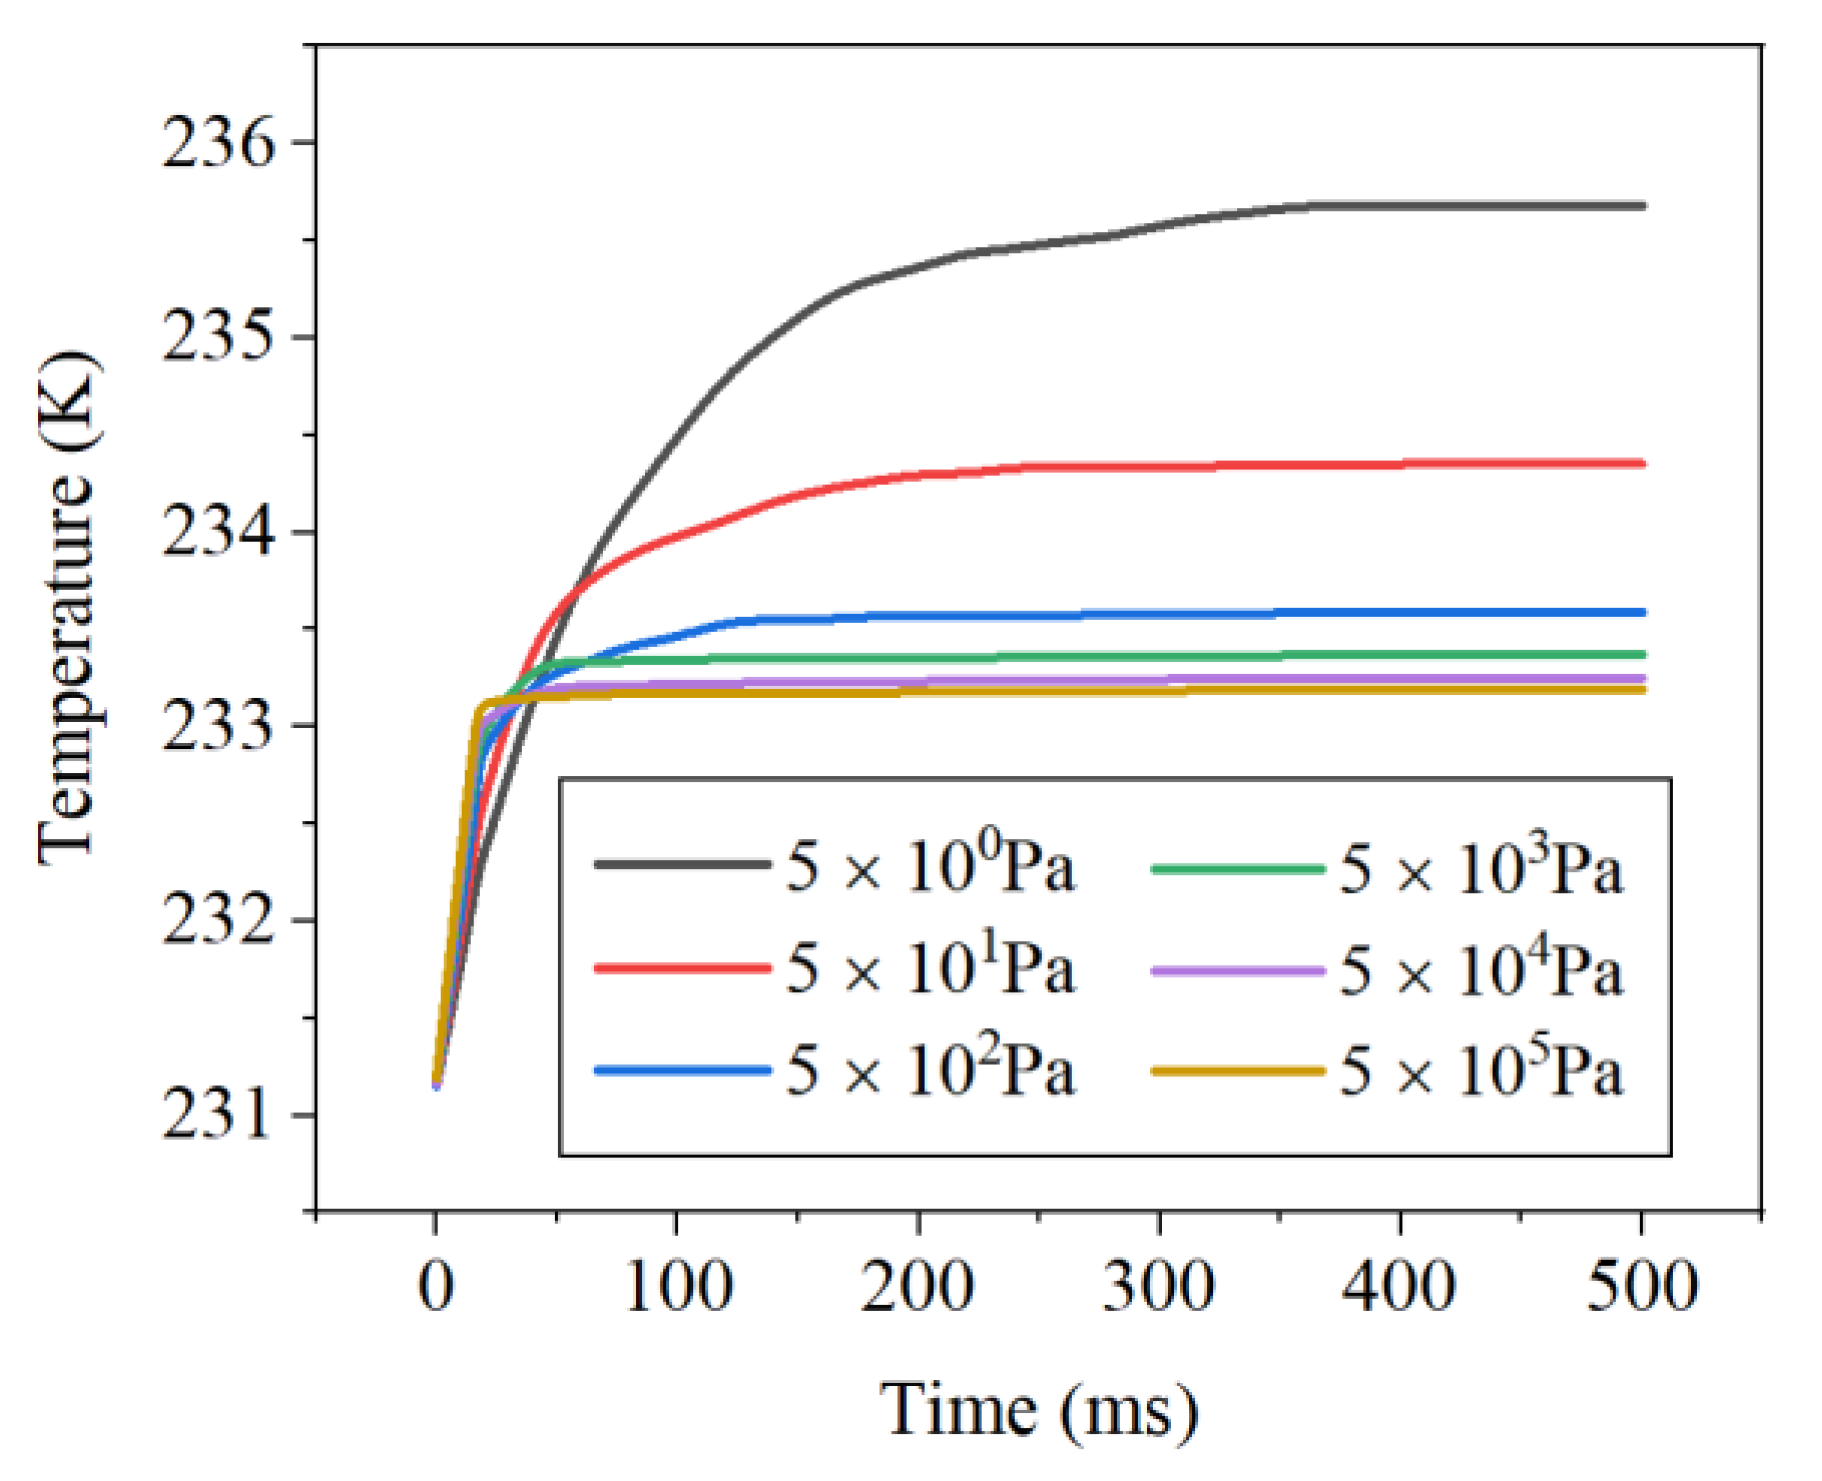
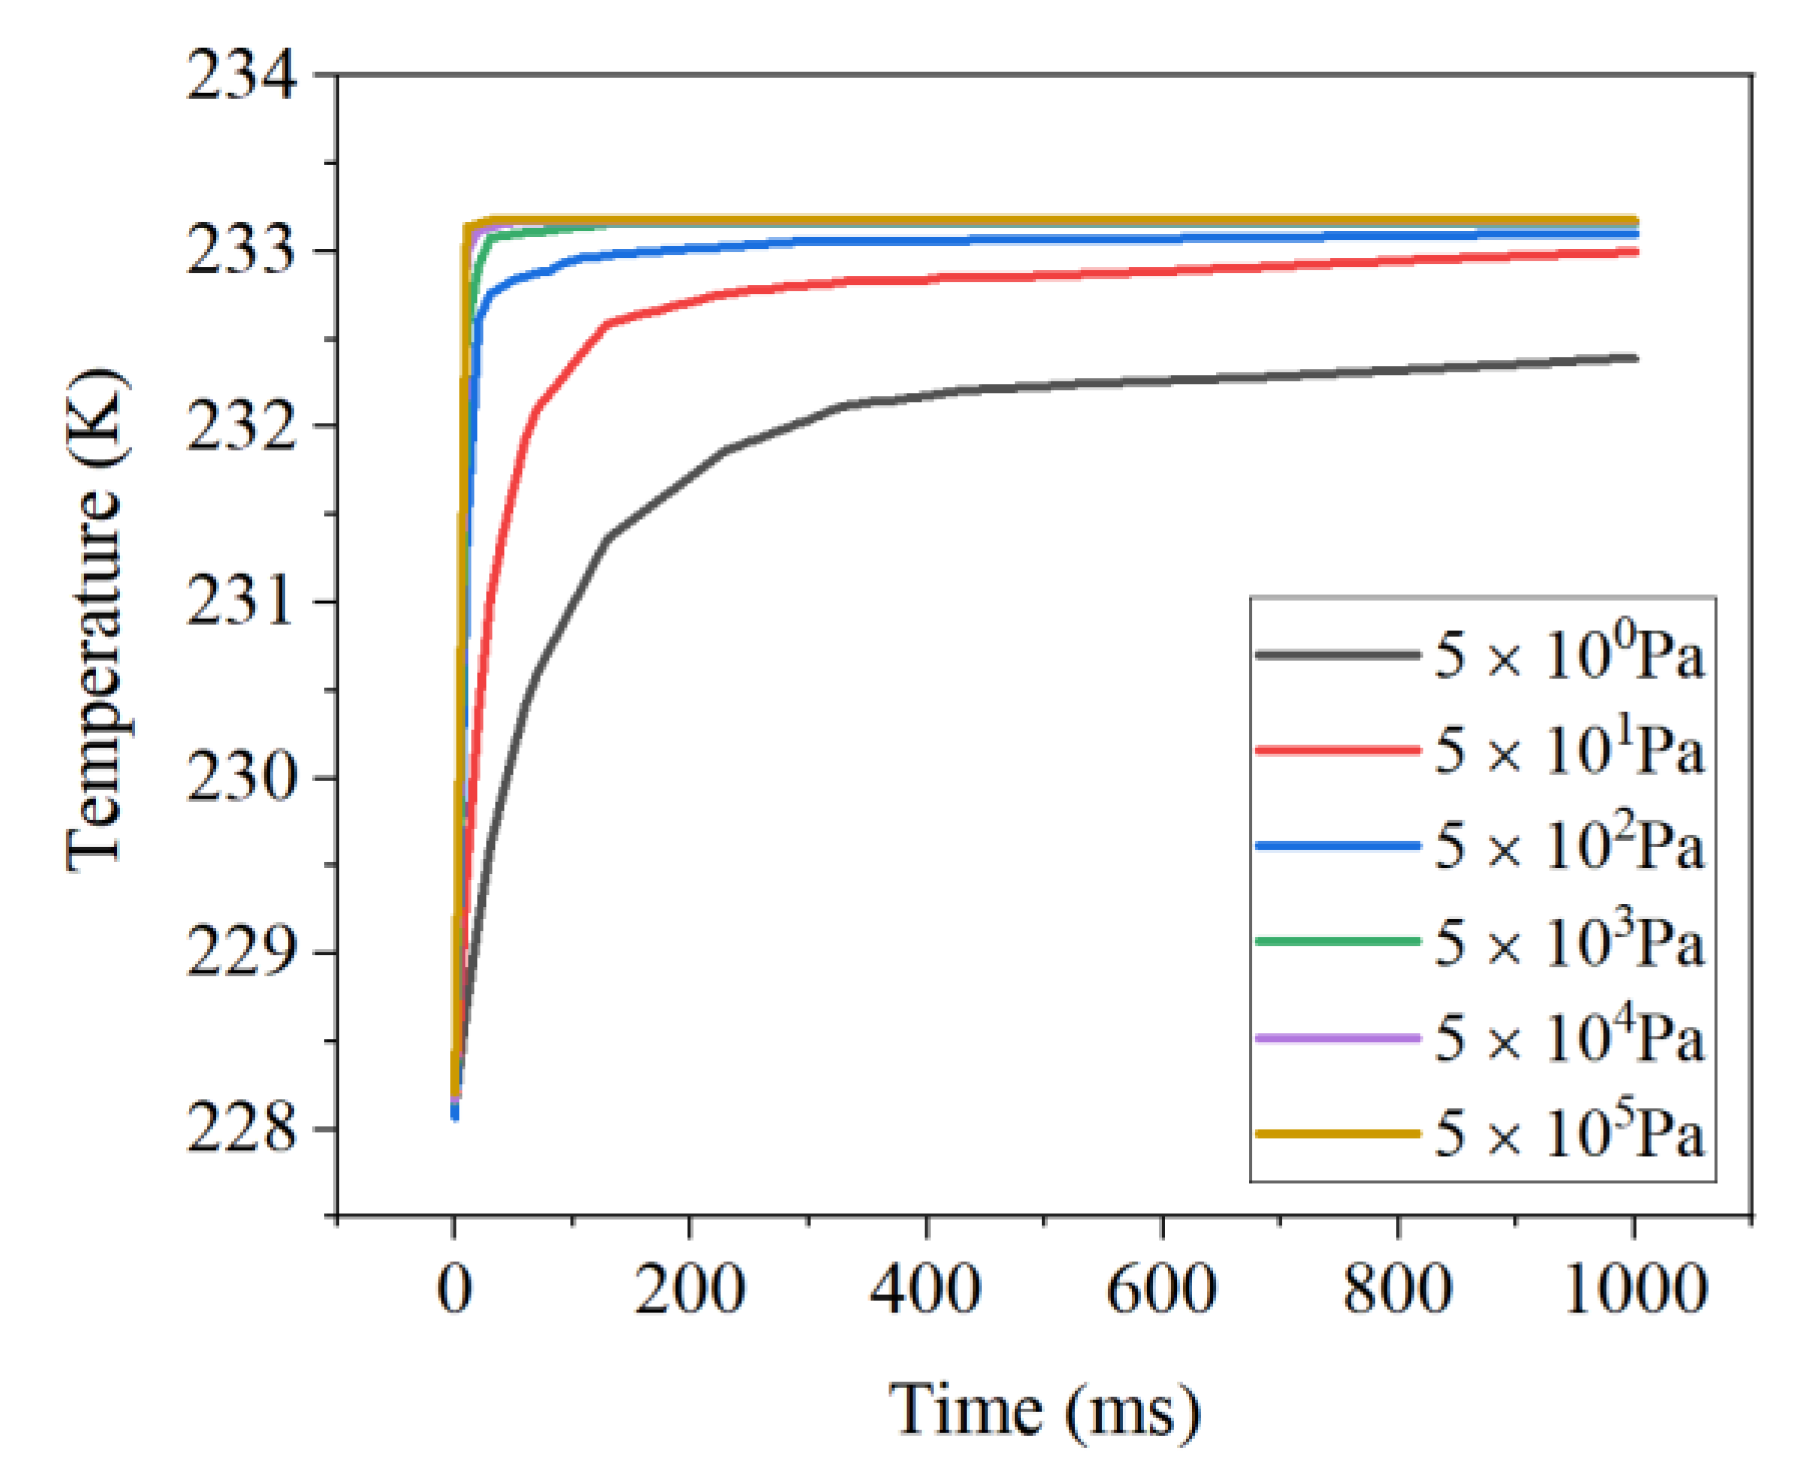
4.1.2. The Effect of Air Pressure on the Temperature Measurement Process of the Temperature Sensor

We selected the temperature sensor of Insulator 5 for simulation tests in this scenario. The initial temperature of the sensor was 231.15 K, and the ambient temperature was set to 233.15 K. The temperature sensor was simulated and analyzed at air pressure environments of 5 × 10 0 Pa, 5 × 10 1 Pa, 5 × 10 2 Pa, 5 × 10 3 Pa, 5 × 10 4 Pa, and 5 × 10 5 Pa to compare the difference in steady-state time and response speed. The results are shown in Figure 6. As the air pressure increases, the response rate of the temperature sensor becomes faster, and the steady-state temperature is closer to the ambient temperature. Therefore, the higher the altitude and lower the air pressure, the less effective the heat transfer and the greater the temperature error value.

4.2. Solar Radiation

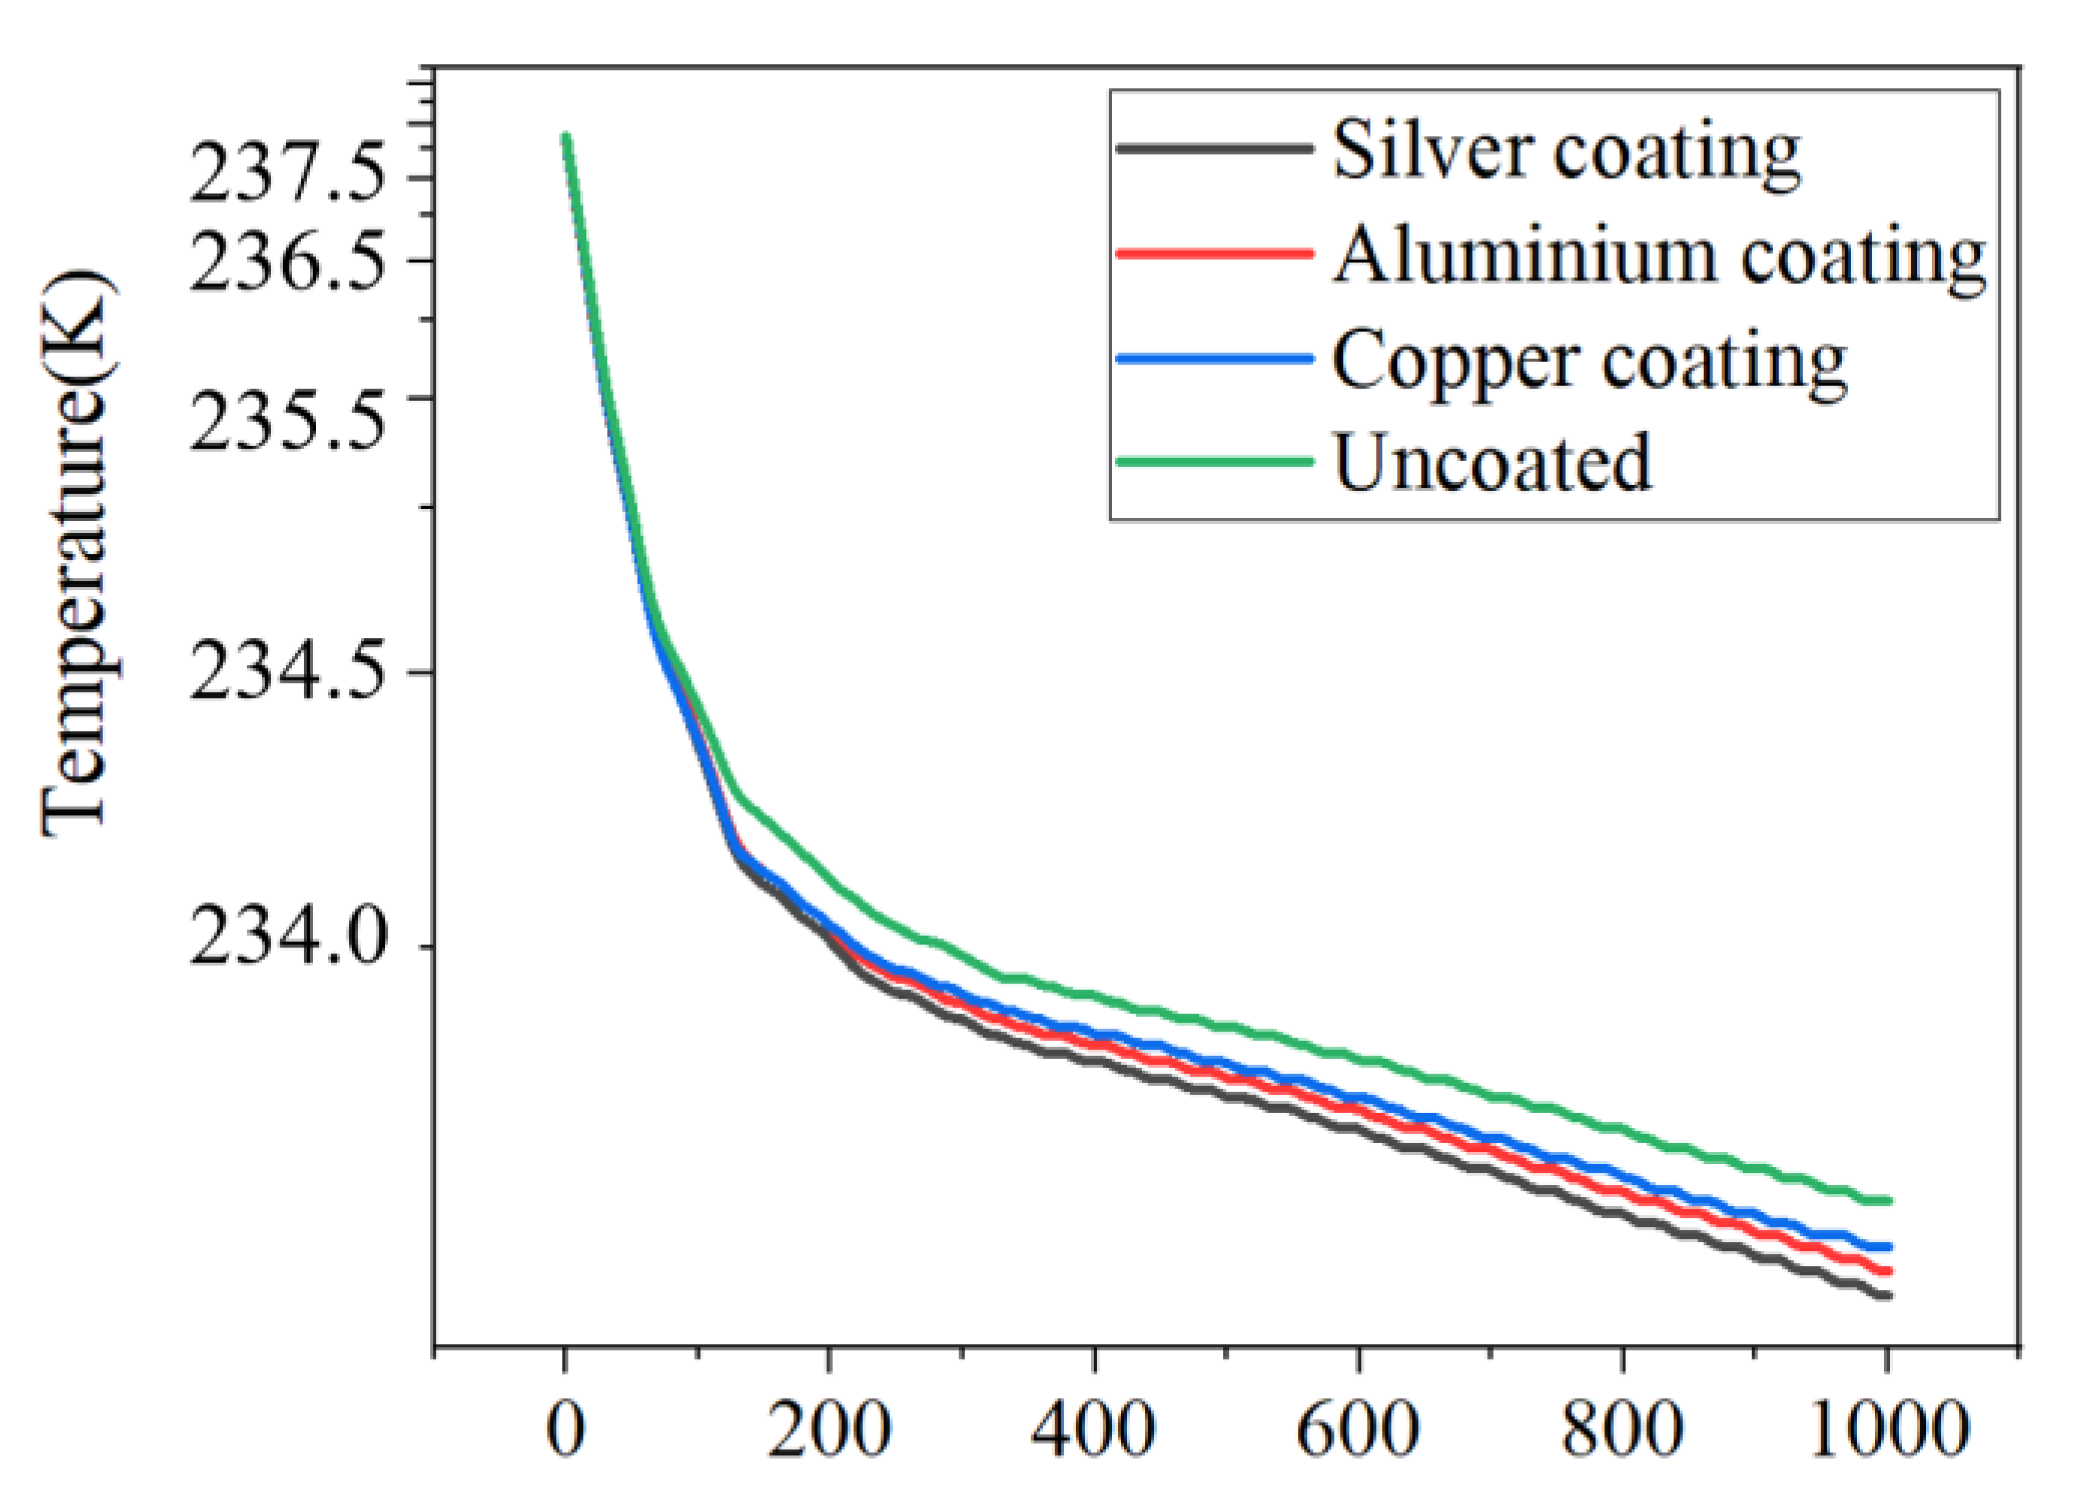
4.2.1. The Effect of Different Coatings on Radiant Heat Errors

After simulation analysis, as shown in Figure 7, when the surface emissivity of the radiation-proof material is smaller, the less it is affected by solar radiation, as demonstrated in Equation (11). Additionally, the thermal conductivity of the coating material also influences the heat exchange rate of the sensor. The radiation errors of the sensor using silver, aluminum, and copper as radiation-proof coatings are 0.14 K, 0.16 K, and 0.18 K at 1 s, respectively, while the error of the uncoated sensor is 0.22 K. Therefore, silver was used as the radiation-proof material for this sensor.

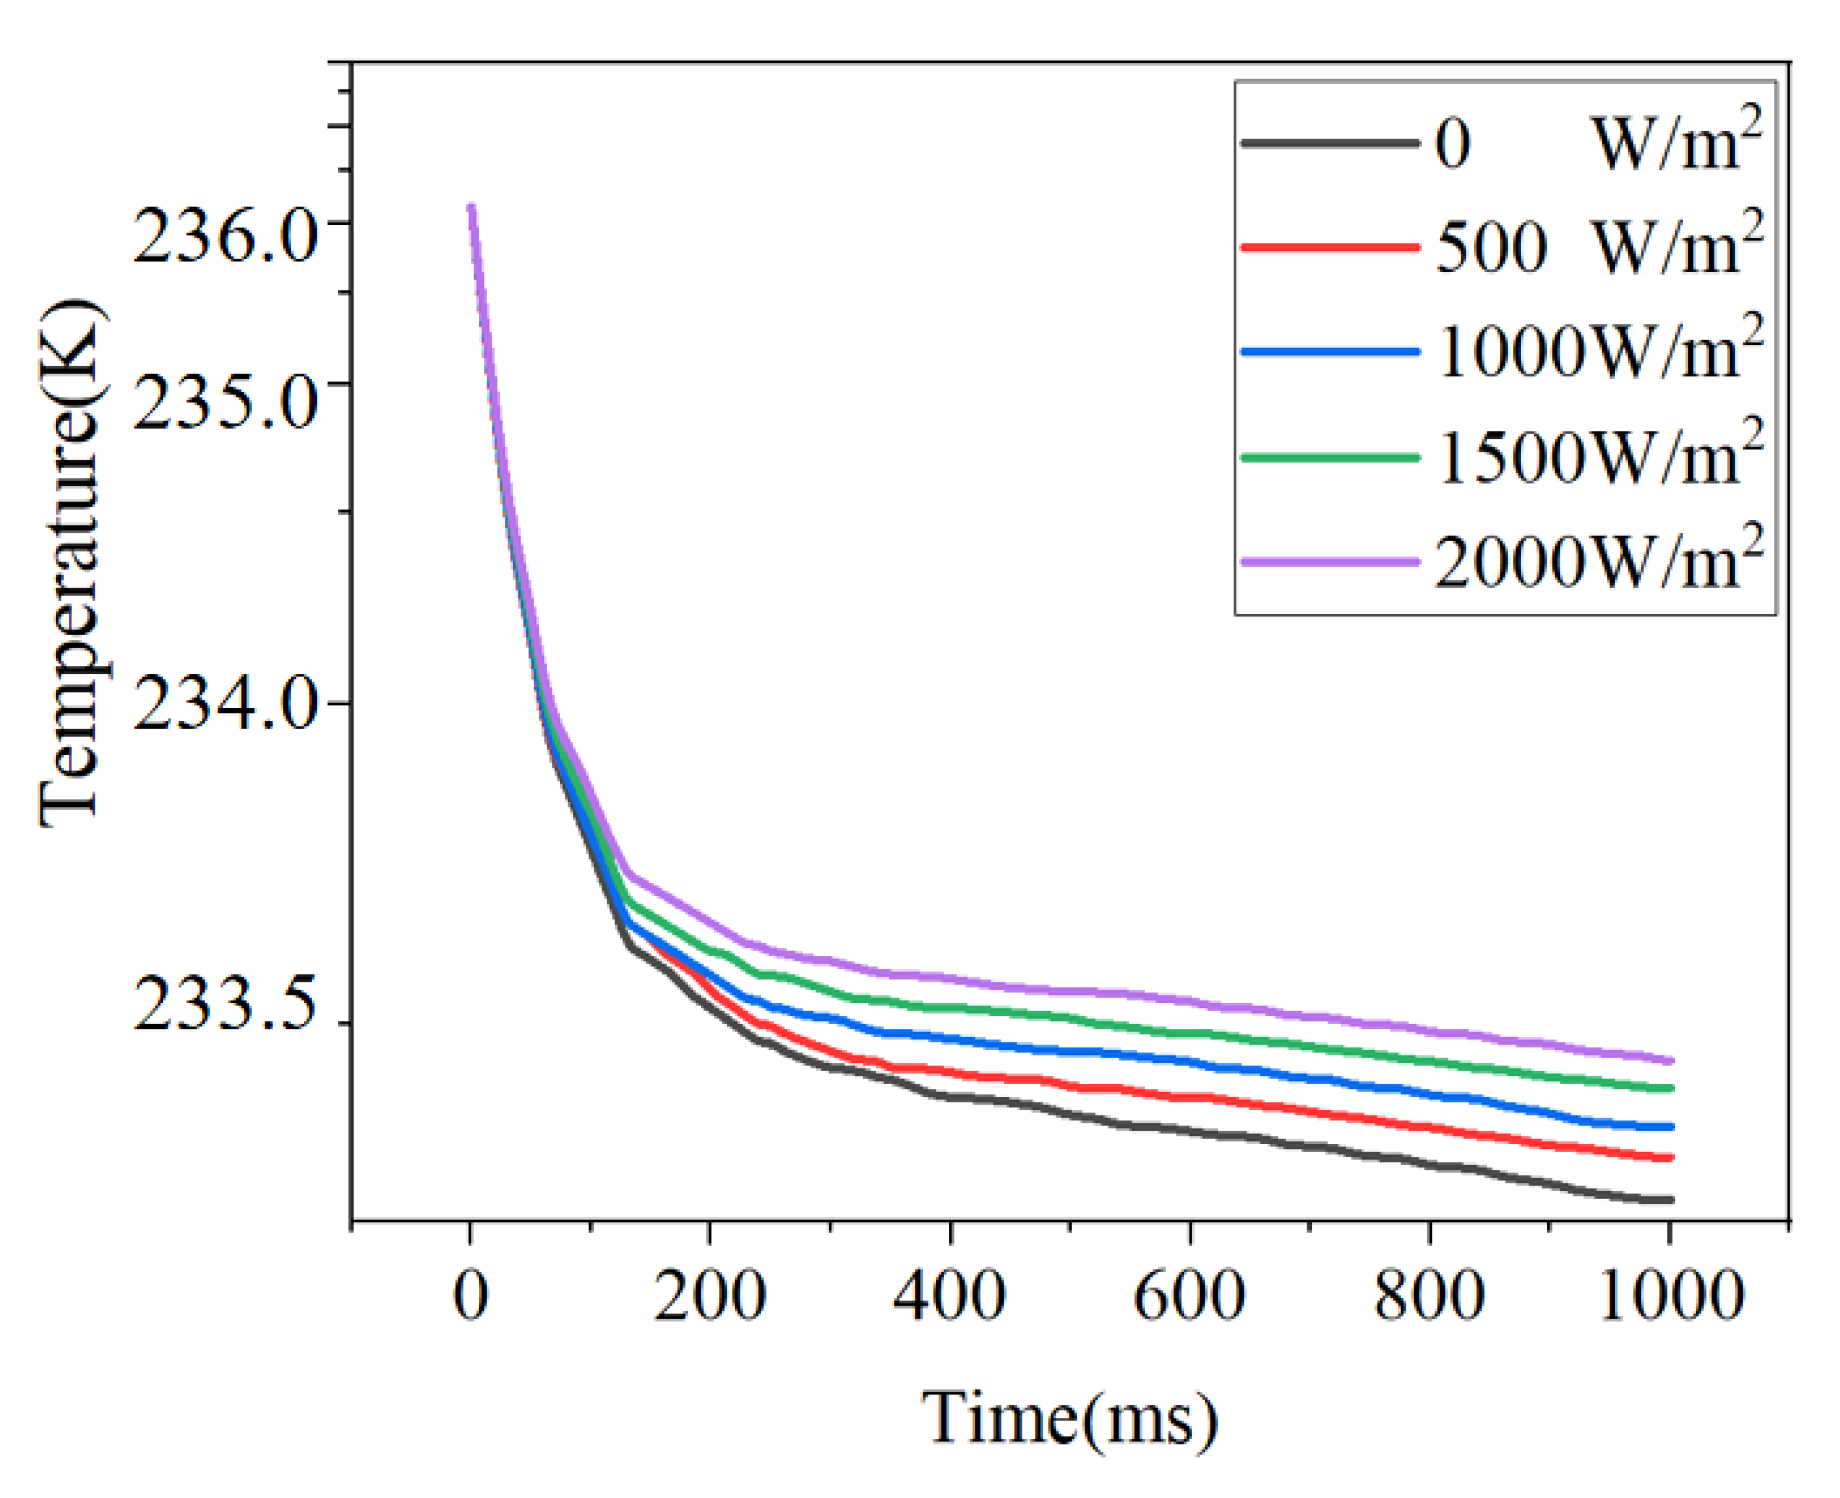
4.2.2. The Effect of Radiation Conditions on Radiant Heat Errors

Simulating a comparative analysis with the sensor without radiation conditions at an ambient temperature of 233.15 K allows us to derive the effect of radiation on the temperature rise of the sensor. The ambient air pressure was 50 Pa, the wind speed was 100 m/s, the initial temperature of the temperature sensor was 236.15 K, and the radiation values were 0 W/m2, 500 W/m2, 1000 W/m2, 1500 W/m2, and 2000 W/m2.
Figure 8 shows the temperature variation of the Pt thin film under five different radiation conditions. It can be seen in the figure that the temperature of the Pt thin film increases as the amount of radiation increases. For example, the temperature of Pt thin film under five different radiation conditions at 600 ms was 233.39 K, 233.42 K, 233.46 K, 233.49 K, and 233.53 K. This is because the more significant the radiation, the greater the radiation heat generated by the Pt thin film, can be seen in Equation (10).

4.2.3. The Effect of Different Air Pressures on Radiant Heat Errors

We analyzed the effect of solar radiation on the temperature rise in the sensor under different air pressure conditions during the soundings from high to low altitudes. The ambient temperature was set at 233.15 K, the air speed was 100 m/s, the initial temperature of the temperature sensor was 238.15 K, and the solar radiation was 1000 W/m2. The air pressure was set to 5 × 10 0 Pa, 5 × 10 1 Pa, 5 × 10 2 Pa, 5 × 10 3 Pa, 5 × 10 4 Pa, and 5 × 10 5 Pa.
As seen in Figure 9, the sensor’s temperature first falls sharply and then slowly. In the first part, the temperature drop rate of the sensor increases as the air pressure increases. In the second section, the sensor temperature drop rate decreases as the air pressure rises, and the steady-state temperature difference becomes smaller and smaller. Overall, the steady-state temperature becomes closer to the ambient temperature as the air pressure increases over a certain period of time, i.e., the temperature error decreases.
Similarly, as shown in Figure 10, the sensor’s temperature rises sharply and then slowly. In the first section, the temperature drop rate of the sensor increases as the air pressure increases. In the second section, the sensor temperature rises rate decreases as the air pressure increases, and the steady-state temperature difference becomes smaller and smaller. Overall, the steady-state temperature becomes closer to the ambient temperature as the air pressure rises over a certain period of time, i.e., the temperature error decreases.
Therefore, the higher the altitude and the lower the air pressure, the less effective the heat transfer and the greater the temperature error value.

4.3. Aerodynamic Heat

When the radiosonde is equipped with a temperature sensor for in situ temperature measurement in near space, it drops when it reaches a certain position along with the space-based platform and accelerates to descend under the action of gravity. Through Matlab software simulation, when dropping at the height of 70 km, the initial speed was set as 100 m/s, and the change in the falling rate of the radiosonde is shown in Figure 11.
It can be seen in the figure that the speed of the radiosonde reaches the maximum at 61.72 km, which is 310.35 m/s, and then the speed gradually decreases. Table 1 shows the velocity, atmospheric temperature, air pressure, and other parameters during the fall of the sounding device using Matlab.
ANSYS Fluent was used to analyze and study the aerodynamic heat field generated by the radiosonde during its high-speed descent. According to the environmental parameters at different altitudes in Table 1, the aerodynamic heat field distribution of the radiosonde at different altitudes was studied, and the altitudes of 60,000 m, 50,000 m, 40,000 m, and 30,000 m were selected as the study objects.

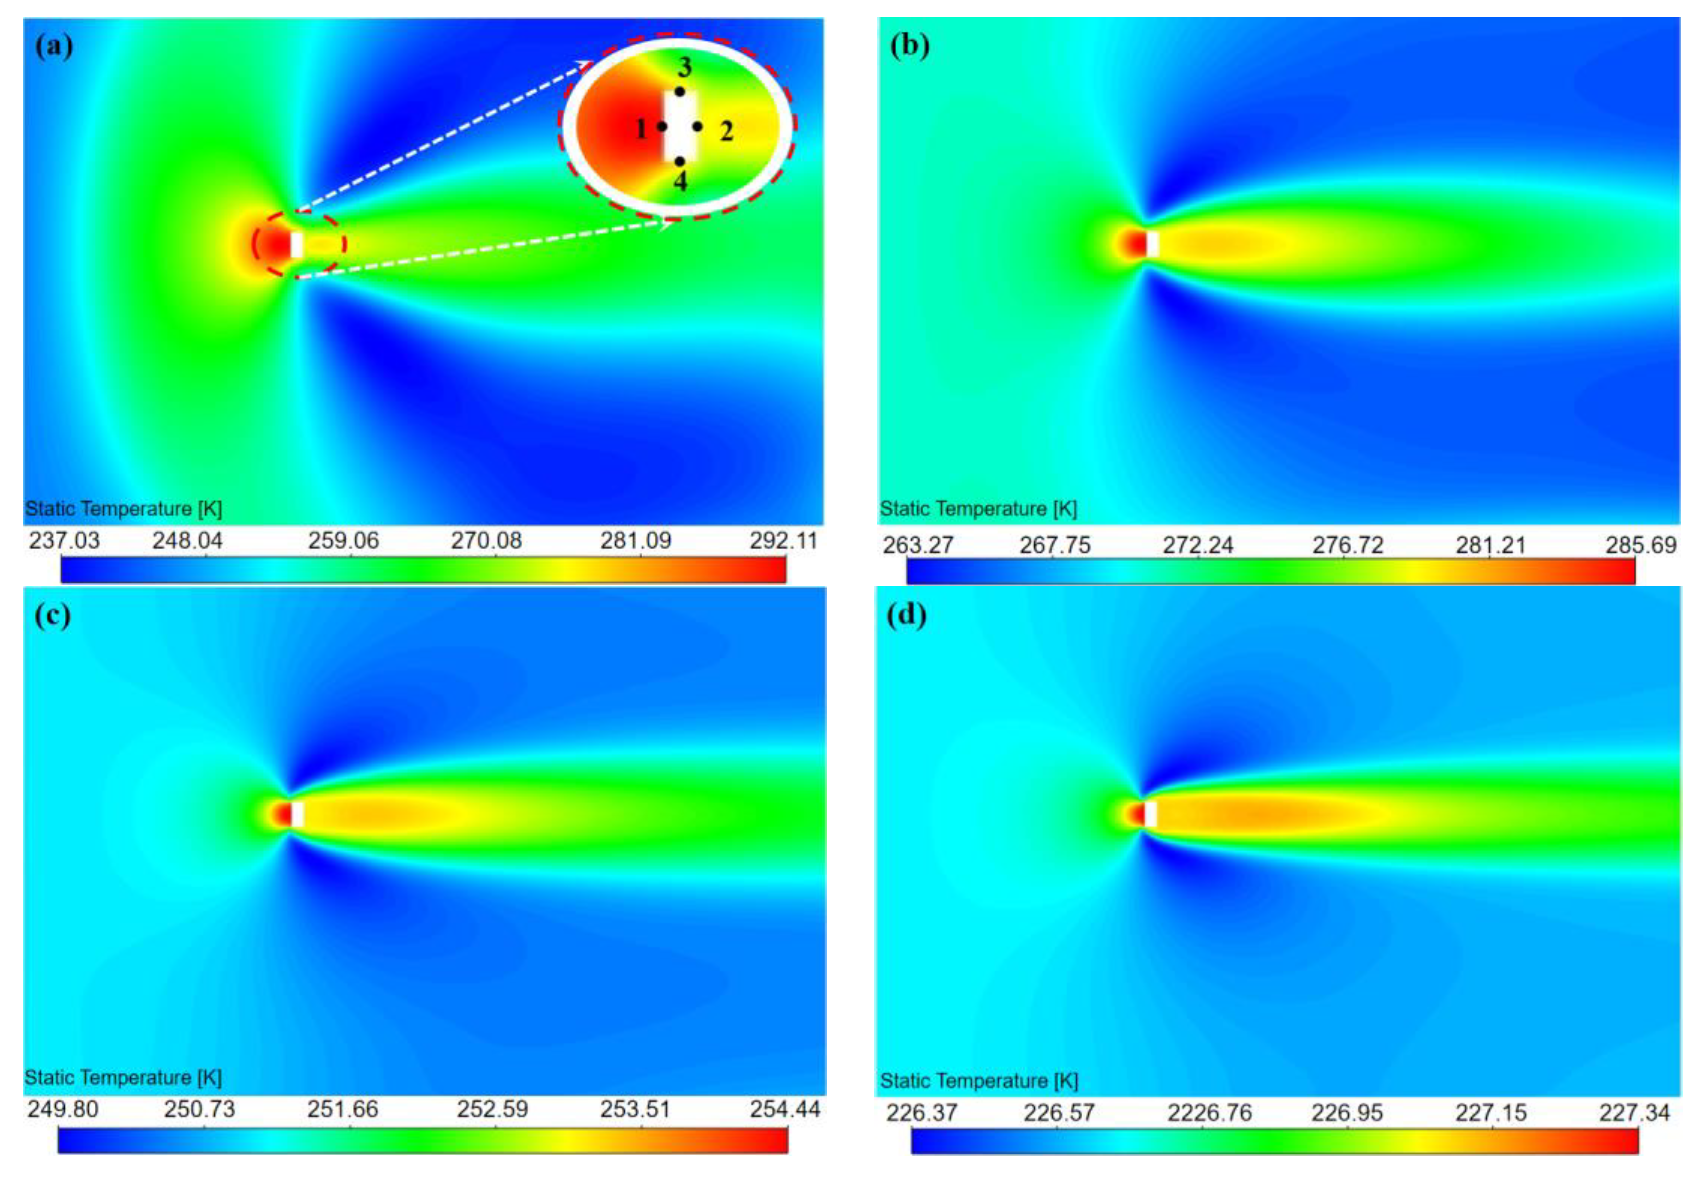
4.3.1. Aerodynamic Heat Field Distribution at Different Altitudes

The results of the analysis of the aerodynamic heat field distribution of the radio soundings at different heights are shown in Figure 12, where the blank is the radiosonde, from which it can be seen that the temperature rise in front of the radiosonde is the largest due to aerodynamic heat. For example, in Figure 12a, the temperature in front of the radiosonde is 290.71 K with an error of +45.264 K. The temperature of the outer wall behind and around the radiosonde is 248.21 K with an error value of +2.76 K. Meanwhile, the temperature of some areas outside the side decreases to 199.92 K, resulting in a significant temperature error of −45.53 K. At the same time, aerodynamic heat analysis was carried out for the temperature sensor. As shown in Figure 13a, the blank area is the sensor, and the temperature around the sensor is different (Point 1, 292.11 K; Point 2, 274.42 K; Point 3, 281.32 K; Point 4, 281.35 K). In other words, the aerodynamic heat exerted on the temperature sensor is minimal. Therefore, we positioned the temperature sensor at the front of the radiosonde with the Pt thin film end facing backward and symmetrically arranged two temperature sensors to ensure uniform force distribution on the radiosonde.

4.3.2. The Effect of Different Air Pressures on Aerodynamic Heat Errors

To investigate the effect of varying air pressures and relative flow rates on the aerodynamic heat of the radiosonde, we set different air pressures and air speeds to examine the magnitude of the aerodynamic heat.
To study the effect of air pressure on aerodynamic heat, the ambient temperature was set to 233.15 K; the airflow rate was set to 200 m/s; and the air pressure was set to 5 × 10 0 Pa, 5 × 10 1 Pa, 5 × 10 2 Pa, 5 × 10 3 Pa, 5 × 10 4 Pa, and 5 × 10 5 Pa, respectively, as shown in Figure 14.
Figure 14 shows that as the air pressure increases exponentially, the temperature at the two points rises rapidly and then slowly. In Equation (13), it can be seen that at low pressure, the greater the pressure, the greater the density of the air and the air isobaric specific heat capacity, and the more aerodynamic heat is generated. In addition, the more significant the air pressure, the smaller the change in the compression ratio of the gas ahead, and thus the smaller the change in aerodynamic heat, so the curve tends to be smooth.

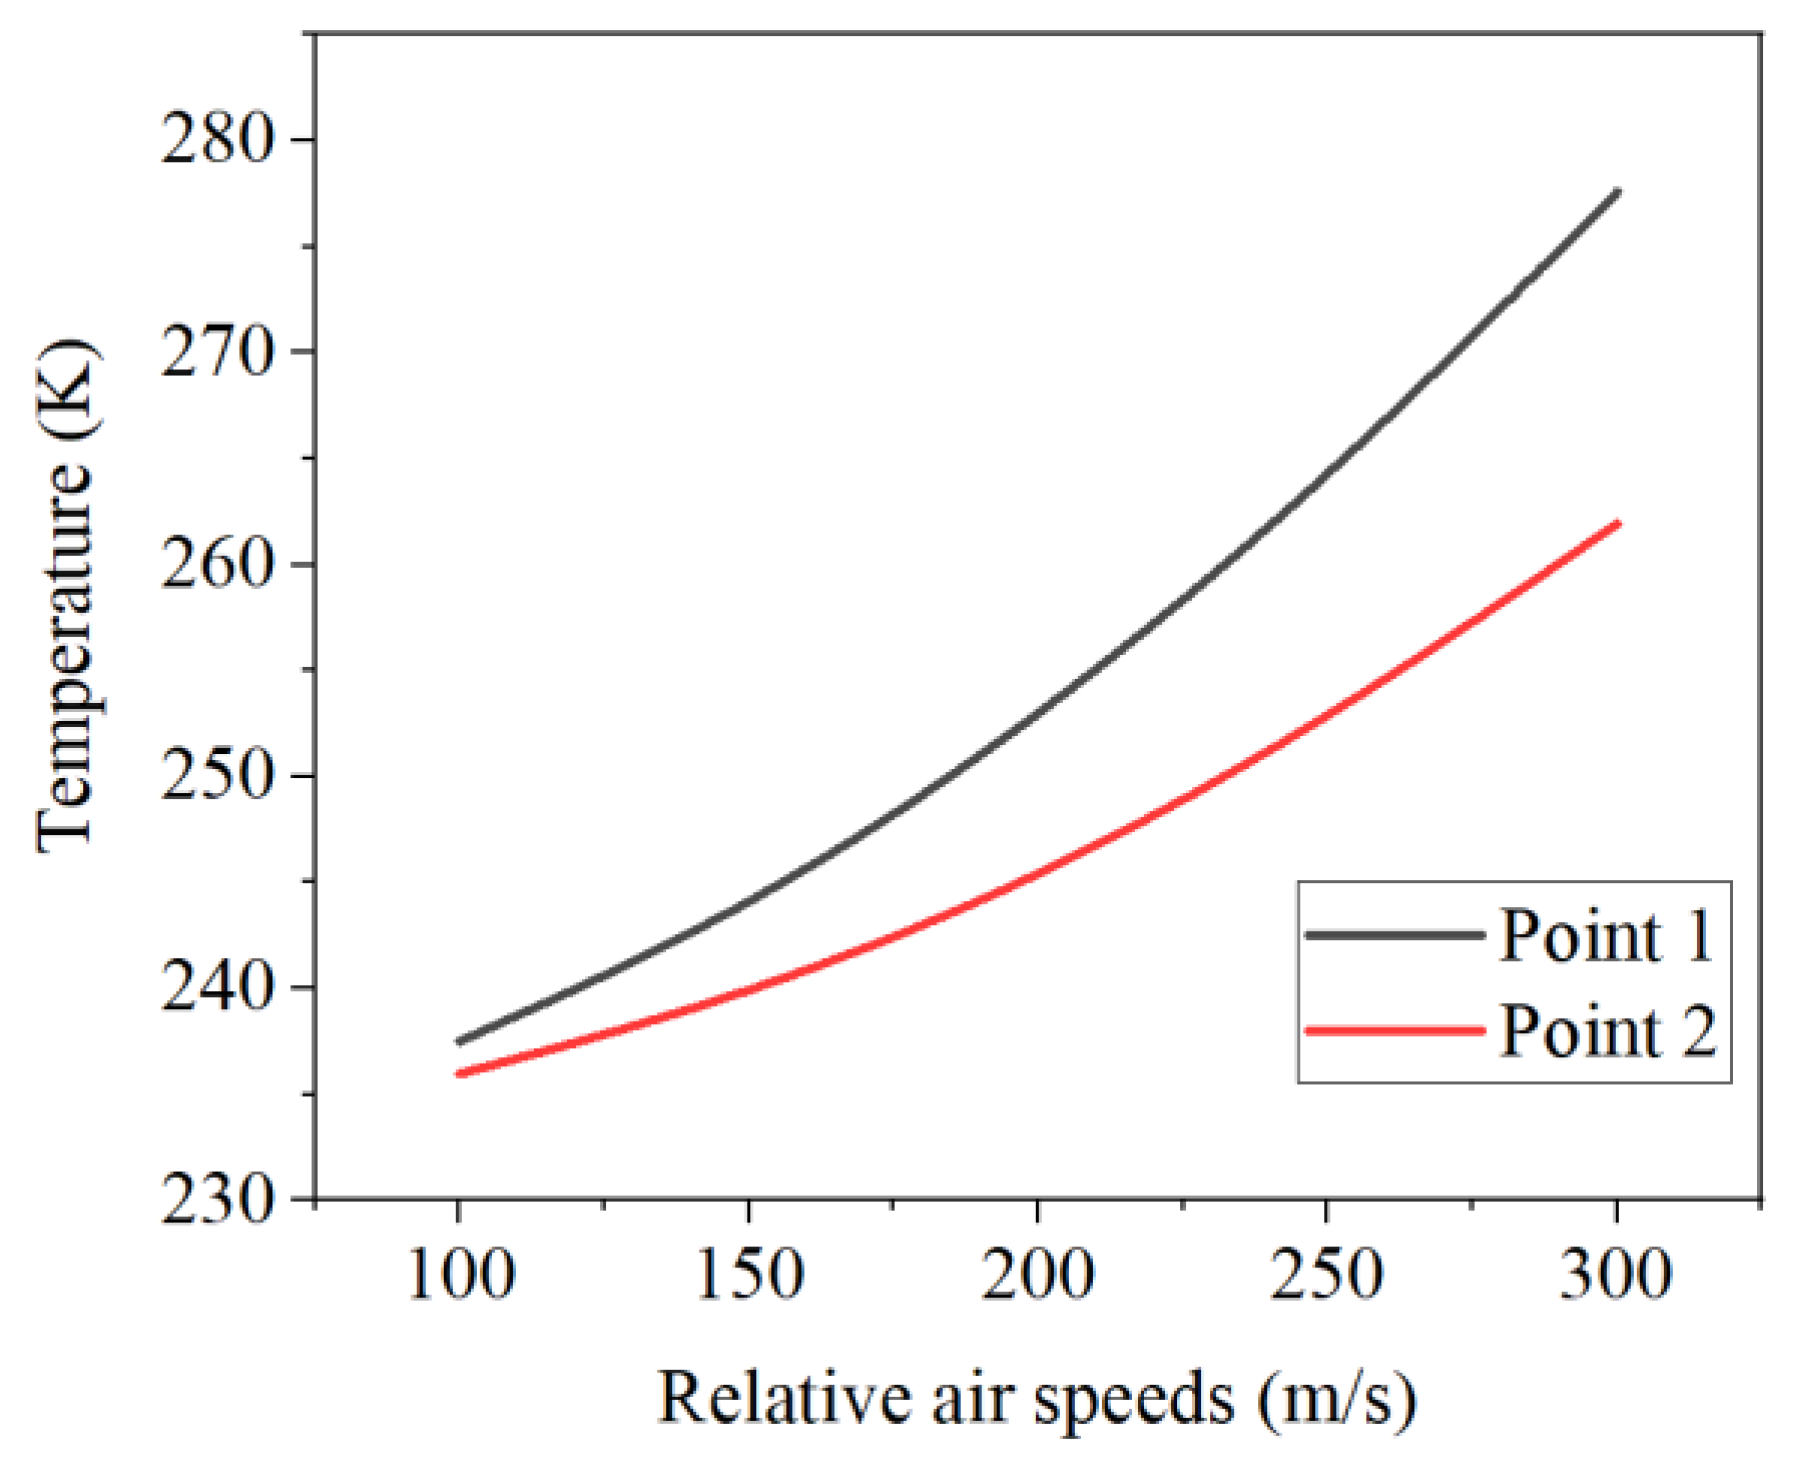
4.3.3. The Effect of Different Relative Air Speeds on Aerodynamic Heat Errors

To study the effect of the relative air flow rate on aerodynamic heat, the ambient temperature was set to 233.15 K; the air pressure was set to 5 Pa; and the airflow rates were set to 100 m/s, 150 m/s, 200 m/s, 250 m/s, and 300 m/s, respectively.
As shown in Figure 15, as the air velocity increases, the temperature at the two points then rises, and the rate of warming increases. This is because the more significant the air flow rate, the greater the aerodynamic heat, and according to the aerodynamic heat error model, it can be seen that the aerodynamic heat error is proportional to the square of the relative air flow rate. Hence, the slope of the curve increases.
The above analysis shows that aerodynamic heat has the greatest effect on the temperature error, followed by the temperature error caused by Joule heat. Additionally, solar radiation has the most minor effect on the sensor temperature error. The error model formula corrected the detection temperature. The correction was the sum of the thermal errors of aerodynamic heat, solar radiation, and Joule heat, dramatically improving the temperature’s accuracy.

4.4. Overall Analysis

The correctness of the equation model was verified by software simulation. When the temperature sensor measures the temperature of actually near space, it can calculate the measurement errors (Joule heat, radiant heat, and aerodynamic heat) of the temperature sensor by collecting information from other physical quantities.
Among them, due to the high-speed motion of the radiosonde, the sensor temperature rise caused by aerodynamic heat up to tens of Kelvins, which is the most influential factor in the three temperature errors. In addition, as a result of the presence of the radiation-proof layer, the temperature rise caused by the large solar radiation of 2000 W/m2 is much less than 1.00 K. Therefore, using the constructed temperature error model, the real atmospheric temperature value can be accurately calculated by the actual measured temperature value.

5. Conclusions

In response to the problems of existing methods, a method to achieve in situ high-accuracy temperature detection in near space was proposed by analyzing the actual measurement environment. By designing a new type of temperature sensor and analyzing the sources of error in the actual measurement process and their influencing factors, we achieved high-precision temperature values by applying a temperature error compensation method. In this way, we can apply it to the in situ high-precision detection of near space temperature. The conclusions are as follows.
(1)
The temperature sensor has a microbridge structure with a short response time using silver as the radiation-proof coating. The smaller the emissivity of the anti-radiation coating, the more minor the radiation heat generated. The choice of silver as the radiation-proof coating results in a small radiation heat error and improves the measurement accuracy of the temperature sensor.
(2)
The optimized near space temperature error model shows that the resulting measurement errors include aerodynamic heat, solar radiation, and Joule heat. Aerodynamic heat has the greatest effect on temperature error, and solar radiant heat has the least impact. Therefore, in the actual calculation process, the magnitude of the pneumatic heat needs to be calculated precisely.
(3)
The aerodynamic heat error at the front end of the radiosonde is the largest, and the temperature error at the rear end is the smallest. The temperature sensor is arranged at the front end of the radiosonde. The aerodynamic heat error of the front end of the sensor is the largest, the rear end has the slightest temperature error, and the Pt thin film is installed at the back end of the sensor. Additionally, reducing the descent speed can effectively decrease the aerodynamic heat.
(4)
As the air pressure increases, there will be the following changes: the response rate of the temperature sensor increases, and the steady-state temperature is closer to the ambient temperature, i.e., the temperature error decreases. The temperature of the sensor rises rapidly and then slowly. As a result, a more precise calculation of the temperature error is necessary for the low-pressure environment at high altitudes.
(5)
By establishing the temperature error model, we can significantly enhance the accuracy of obtaining temperature values in near space. This method can be applied to in situ high-precision temperature detection data in near space.

Author Contributions

Conceptualization and methodology, G.W. and C.H.; Software, G.W.; Validation, G.W. and C.H.; Investigation, G.W. and C.H.; Writing—original draft preparation, G.W.; Writing—review and editing, C.H.; Visualization, G.W. and D.Z.; Supervision, D.Z. and C.H.; Funding acquisition, D.Z. All authors have read and agreed to the published version of the manuscript.

Funding

This research was funded by the National Key R&D Program of China under Grant No. 2021YFB3201502 and the National Natural Science Foundation of China (Grant No. 61827901; No. 62088101; No. 62203056).

Institutional Review Board Statement

Not applicable.

Informed Consent Statement

Not applicable.

Data Availability Statement

Not applicable.

Acknowledgments

We thank Fei Cui and Xiaojun Yang (Innovation & Research Institute of HIWING Technology Academy, Beijing 100074, China) for their technical support in project administration, software, and survey research.

Conflicts of Interest

The authors declare no conflict of interest.

References

  1. Roney, J.A. Statistical wind analysis for near-space applications. J. Atmos. Sol. Terr. Phys. 2007, 69, 1485–1501. [Google Scholar] [CrossRef]
  2. Azadi, M.; Popov, G.A.; Lu, Z.; Eskenazi, A.G.; Bang, A.J.W.; Campbell, M.F.; Hu, H.; Bargatin, I. Controlled levitation of nanostructured thin films for sun-powered near-space flight. Sci. Adv. 2021, 7, eabe1127. [Google Scholar] [CrossRef] [PubMed]
  3. Wang, W.Q.; Cai, J.; Peng, Q. Near-space microwave radar remote sensing: Potentials and challenge analysis. Remote Sens. 2010, 2, 717–739. [Google Scholar] [CrossRef]
  4. Wang, W.Q. Near-space vehicles: Supply a gap between satellites and airplanes for remote sensing. IEEE Aerosp. Electron. Syst. Mag. 2011, 26, 4–9. [Google Scholar] [CrossRef]
  5. Sun, G.; Li, M.; Wang, Y.; Zhou, K.; Hu, X.; Guo, Z.; Zhu, L. Temperature-compensated fiber-optic online monitoring methodology for 3D shape and strain of near-space airship envelope. Appl. Opt. 2022, 61, 9279–9295. [Google Scholar] [CrossRef]
  6. He, W.; Wu, K.; Feng, Y.; Chen, Z.; Li, F. The near-space wind and temperature sensing interferometer: Forward model and measurement simulation. Remote Sens. 2019, 11, 914. [Google Scholar] [CrossRef]
  7. Wang, J.X.; Li, Y.Z.; Yu, X.K.; Li, G.C.; Ji, X.Y. Investigation of heat transfer mechanism of low environmental pressure large-space spray cooling for near-space flight systems. Int. J. Heat Mass Transf. 2018, 119, 496–507. [Google Scholar] [CrossRef]
  8. Wei, Q.; Yang, G.; Liu, G.; Jiang, H.; Zhang, T. Effects and mechanism on Kapton film under ozone exposure in a ground near space simulator. Appl. Surf. Sci. 2018, 440, 1083–1090. [Google Scholar] [CrossRef]
  9. Kozubek, M.; Laštovička, J.; Zajicek, R. Climatology and long-term trends in the stratospheric temperature and wind using ERA5. Remote Sens. 2021, 13, 4923. [Google Scholar] [CrossRef]
  10. Li, J.W.; Sheng, Z.; Fan, Z.Q.; Zhou, S.D.; Shi, W.L. Data analysis of upper atmosphere temperature detected by sounding rockets in China. J. Atmos. Ocean. Technol. 2017, 34, 555–565. [Google Scholar] [CrossRef]
  11. He, Y.; Sheng, Z.; He, M. Spectral analysis of gravity waves from near space high-resolution balloon data in Northwest China. Atmosphere 2020, 11, 133. [Google Scholar] [CrossRef]
  12. Li, T.; Wang, L.; Chen, R.; Fu, W.; Xu, B.; Jiang, P.; Han, Y. Refining the empirical global pressure and temperature model with the ERA5 reanalysis and radiosonde data. J. Geod. 2021, 95, 31. [Google Scholar] [CrossRef]
  13. Zuo, Z.; Song, J.; Zheng, Z.; Han, Q.L. A survey on modelling, control and challenges of stratospheric airships. Control. Eng. Pract. 2022, 119, 104979. [Google Scholar] [CrossRef]
  14. Zhou, L.; Sheng, Z.; Fan, Z.; Liao, Q. Data analysis of the TK-1G sounding rocket installed with a satellite navigation system. Atmosphere 2017, 8, 199. [Google Scholar] [CrossRef]
  15. Burt, S.; Podesta, M.D. Response times of meteorological air temperature sensors. Q. J. R. Meteorol. Soc. 2020, 146, 2789–2800. [Google Scholar] [CrossRef]
  16. De Jong, S.A.P.; Slingerland, J.D.; Van de Giesen, N.C. Fiber optic distributed temperature sensing for the determination of air temperature. Atmos. Meas. Tech. 2015, 8, 335–339. [Google Scholar] [CrossRef]
  17. Tang, J.; Xie, W.; Wang, X.; Chen, C. Simulation and analysis of fluid–solid–thermal unidirectional coupling of near-space airship. Aerospace 2022, 9, 439. [Google Scholar] [CrossRef]
  18. Sun, B.; Oran, E.S. New principle for aerodynamic heating. Natl. Sci. Rev. 2018, 5, 606–607. [Google Scholar] [CrossRef]
  19. Nursultanov, N.; Heffernan, W.J.B.; van Herel, M.J.W.M.R.; Nijdam, J.J. Computational calculation of temperature and electrical resistance to control Joule heating of green Pinus radiata logs. Appl. Ther. Eng. 2019, 159, 113855. [Google Scholar] [CrossRef]
  20. Cao, K.; Baker, J. Multimode heat transfer in a near-space environment. Heat Transf. Eng. 2010, 31, 70–82. [Google Scholar] [CrossRef]
  21. Fan, D.; Chen, X.; Li, Z.; Mei, X. Radiation environment study of near space in China area. In Proceedings of the Remote Sensing of Clouds and the Atmosphere XX, Toulouse, France, 16 October 2015. [Google Scholar]
  22. Lee, S.W.; Yang, I.; Choi, B.I.; Kim, S.; Woo, S.B.; Kang, W.; Oh, Y.K.; Park, S.; Yoo, J.; Kim, J.C.; et al. Development of upper air simulator for the calibration of solar radiation effects on radiosonde temperature sensors. Meteorol. Appl. 2020, 27, 1855. [Google Scholar] [CrossRef]
  23. Zhang, B.; Chen, X.; Yuan, J.; Zhu, H. Research on temperature measurement technology of platinum film thermistor. J. Phys. Conf. Ser. 2021, 1907, 012038. [Google Scholar] [CrossRef]
  24. Žužek, V.; Batagelj, V.; Bojkovski, J. Determination of PRT Hysteresis in the Temperature Range from −50 °C to 300 °C. Int. J. Thermophys. 2010, 31, 1771–1778. [Google Scholar] [CrossRef]
  25. Chiou, J.A.; Chen, S. Thermal hysteresis analysis of MEMS pressure sensors. J. Microelectromech. Syst. 2005, 14, 782–787. [Google Scholar] [CrossRef]
  26. Goncalves, S.B.; Palha, J.M.; Fernandes, H.C.; Souto, M.R.; Pimenta, S.; Dong, T.; Yang, Z.; Ribeiro, J.; Correia, J.H. LED optrode with integrated temperature sensing for optogenetics. Micromachines 2018, 9, 473. [Google Scholar] [CrossRef]
  27. Kandpal, M.; Shirhatti, V.; Singh, J.; Sontakke, B.A.; Jejusaria, A.; Arora, S.P.S.; Singh, S. Experimental study of chromium oxide thin films as an intermediate layer for Pt-based temperature sensor applications. J. Mater. Sci. Mater. Electron. 2022, 33, 21287–21296. [Google Scholar] [CrossRef]
  28. Shao, L.; Zhao, X.; Gu, S.; Ma, Y.; Liu, Y.; Deng, X.; Jiang, H.; Zhang, W. Pt thin-film resistance temperature detector on flexible Hastelloy tapes. Vacuum 2021, 184, 109966. [Google Scholar] [CrossRef]
  29. Huang, M.M.; Zhao, L.B.; Han, X.G.; Jia, C.; Gao, Y.; Fan, S.; Yang, P.; Dong, L.; Jiang, Z.D. MEMS-based Pt film temperature sensor chip on silicon substrate. Meas. Sci. Technol. 2022, 33, 125113. [Google Scholar] [CrossRef]
  30. Miyakawa, N.; Legner, W.; Ziemann, T.; Telitschkin, D.; Fecht, H.J.; Friedberger, A. Microthruster with integrated platinum thin film resistance temperature detector (RTD), heater, and thermal insulation. In Proceedings of the Smart Sensors, Actuators, and MEMS V, Ulm, Germany, 5 May 2011. [Google Scholar]
  31. Babita; Pant, U.; Meena, H.; Gupta, G.; Bapna, K.; Shivagan, D.D. Evaluation of self-heating effect in platinum resistance thermometers. Measurement 2022, 203, 111994. [Google Scholar] [CrossRef]
  32. Han, S.; Liu, Q.; Han, X.; Dai, W.; Yang, J. An E-type temperature sensor for upper air meteorology. Nanotechnol. Precis. Eng. 2018, 1, 145–149. [Google Scholar]
  33. Philipona, R.; Kräuchi, A.; Romanens, G.; Levrat, G.; Ruppert, P.; Brocard, E.; Jeannet, P.; Ruffieux, D.; Calpini, B. Solar and thermal radiation errors on upper-air radiosonde temperature measurements. J. Atmos. Ocean. Technol. 2013, 30, 2382–2393. [Google Scholar] [CrossRef]
  34. Lee, S.W.; Park, E.U.; Choi, B.I.; Kim, J.C.; Woo, S.B.; Kang, W.; Park, S.; Yang, S.D.; Kim, Y.G. Compensation of solar radiation and ventilation effects on the temperature measurement of radiosondes using dual thermistors. Meteorol. Appl. 2018, 25, 209–216. [Google Scholar] [CrossRef]
  35. Kamiński, M.; Corigliano, A. Shannon Entropy in Stochastic Analysis of Some Mems. Energies 2022, 15, 5483. [Google Scholar] [CrossRef]
  36. Liu, H.; Chen, W.; Sudjianto, A. Relative entropy based method for probabilistic sensitivity analysis in engineering design. ASME J. Mech. Des. 2006, 128, 326–336. [Google Scholar] [CrossRef]
  37. Farsad, S.; Ardekani, M.A.; Farhani, F. Experimental investigation of aerodynamic effects of probe on heat transfer from hot-wire sensors at vertical and horizontal orientations. Flow Meas. Instrum. 2019, 70, 101642. [Google Scholar] [CrossRef]
  38. Lacy, F. Using nanometer platinum films as temperature sensors (constraints from experimental, mathematical, and finite-element analysis). IEEE Sens. J. 2009, 9, 1111–1117. [Google Scholar] [CrossRef]
  39. Wales, M.D.; Clark, P.; Thompson, K.; Wilson, Z.; Wilson, J.; Adams, C. Multicore fiber temperature sensor with fast response times. OSA Continuum 2018, 1, 764–771. [Google Scholar] [CrossRef]
  40. Dimitrienko, Y.; Zakharov, A.; Koryakov, M. Coupled problems of high-speed aerodynamics and thermomechanics of heat-shielding structures. J. Phys. Conf. Ser. 2018, 1141, 012094. [Google Scholar] [CrossRef]
  41. Wu, D.; Wu, S.; Wang, Y.; Gao, Z.; Yang, J. High-speed and accurate non-linear calibration of temperature sensors for transient aerodynamic heating experiments. Trans. Inst. Meas. Control 2014, 36, 845–852. [Google Scholar] [CrossRef]
Figure 1. Structure diagram of Pt thin film temperature sensor.
Applsci 13 05954 g001
Figure 2. Pt thin film structure and sensor structure.
Applsci 13 05954 g002
Figure 3. The six types of insulator with increasing areas from (1) to (6).
Applsci 13 05954 g003
Figure 4. Sensor and airflow field model.
Applsci 13 05954 g004
Figure 5. Temperature variation curves of Pt thin film for sensors with different insulators at initial temperatures of (a) 228.15 K and (b) 238.15 K.
Applsci 13 05954 g005
Figure 6. Effect of different air pressures on temperature changes in Pt thin film.
Applsci 13 05954 g006
Figure 7. Effect of different radiation-proof coatings on the temperature of temperature sensors.
Applsci 13 05954 g007
Figure 8. Temperature variation of Pt thin film under different radiation conditions.
Applsci 13 05954 g008
Figure 9. Changes in cooling of Pt thin film under the influence of radiation at different air pressures.
Applsci 13 05954 g009
Figure 10. Changes in the heating of Pt thin film under the influence of radiation at different air pressures.
Applsci 13 05954 g010
Figure 11. Velocity curve of the falling radiosonde.
Applsci 13 05954 g011
Figure 12. Aerodynamic heat distribution of radiosonde at an altitude of (a) 60,000 m, (b) 50,000 m, (c) 40,000 m, and (d) 30,000 m during high-speed falling.
Applsci 13 05954 g012
Figure 13. Aerodynamic heat distribution of temperature sensor at altitude of (a) 60,000 m, (b) 50,000 m, (c) 40,000 m, and (d) 30,000 m during high-speed falling.
Applsci 13 05954 g013
Figure 14. Variation in aerodynamic heat with air pressure at two points of the sensor.
Applsci 13 05954 g014
Figure 15. Variation in aerodynamic heat with relative air speed at two sensor points.
Applsci 13 05954 g015
Table 1. State parameters during the fall of the sounding device.
Altitude
(m)
Falling Speed
(m/s)
Ambient Temperature
(K)
Air Pressure
(Pa)
Time
(s)
70,000100217.4525.016990
61,724310.35240.6315.9435.41
60,000304.34245.4520.3140.97
50,000166.31270.6575.9584.23
40,00077.76251.05277.55174.27
30,00035.19226.651171.95370.02
Disclaimer/Publisher’s Note: The statements, opinions and data contained in all publications are solely those of the individual author(s) and contributor(s) and not of MDPI and/or the editor(s). MDPI and/or the editor(s) disclaim responsibility for any injury to people or property resulting from any ideas, methods, instructions or products referred to in the content.

