Abstract
With the rapid increase in bridge spans, the mitigation of risk to flutter (aeroelastic instability) is of critical importance in the design of long-span bridges, especially considering the more frequent intense hurricanes under climate change. Although the strong nonlinearities of the aeroelastic (self-excited) forces in wind–bridge interactions can be well captured through either numerical simulations or experimental tests, both are expensive and time consuming. Hence, it is important to develop an efficient reduced-order model for the simulations of nonlinear aeroelastic forces on the bridge decks. This study proposes a reduced-order model based on the long short-term memory (LSTM) network to simulate the nonlinear aeroelastic forces on bridge decks with various leading edges, and thus rapidly predict the corresponding post-flutter behaviors of long-span bridges. To generate the training datasets, computational fluid dynamics (CFD) was employed to simulate the nonlinear aeroelasticities of bridge decks with a wide range of leading-edge configurations and wind speeds. Trained on the high-fidelity CFD datasets, the LSTM network takes the motion of a bridge deck, leading-edge angles and wind speeds as inputs and outputs the nonlinear aeroelastic forces on the bridge decks. A hybrid loss function utilizing the prediction errors of both aeroelastic forces simulated by the LSTM network and the bridge deck responses calculated by the Newmark-β algorithm was introduced into the training process to improve the network performance. The prediction results of the trained LSTM model were compared with the CFD simulations, which demonstrated that the nonlinear aeroelastic forces of the bridge deck with various leading edges can be accurately and efficiently acquired by the proposed LSTM model.
1. Introduction
The flutter of long-span bridges is an aeroelastic instability that may lead to catastrophic consequences. With the rapid increase in the spans, the bridges are increasingly flexible and hence vulnerable to the flutter. This situation can even be aggravated by the increase in hurricane intensity and frequency under climate change. The aeroelastic forces on long-span bridges are conventionally simulated based on the well-known Scanlan’s semi-empirical linear model [1], where the self-excited forces are linearly related to the structural motion through flutter derivatives. Over the past several decades, efforts have been made to improve the simulation accuracy based on the linear models [2,3,4,5,6]. According to the linear aeroelastic theory, the bridge deck will undergo divergent vibrations with a negative damping once the wind speed is higher than a threshold (i.e., critical flutter wind speed). However, the aeroelastic forces on bridge decks essentially contain nonlinear components due to the complexity of flow surrounding the bluff bodies. Several nonlinear features of bridge aerodynamics typically observed in the wind tunnel tests include: (i) the non-proportional relationship between the input and output amplitudes, (ii) the single frequency input resulting in multiple frequency outputs, (iii) the amplitude dependency of aeroelastic transfer functions, and (iv) the hysteretic behavior of aeroelastic forces versus angles of attack [7,8]. Accordingly, the bridge deck vibrations in the post-flutter wind speed region may not diverge rapidly but shift to a limit cycle oscillation (LCO) with constant amplitude [9,10].
As a consequence of the rapid development of the computation power and the improvement of the computational fluid dynamic (CFD) technology, the numerical simulation approaches have proved to be a reliable and effective way of simulating the aeroelastic features of the flexible bridges to complement wind tunnel testing [11,12]. Though the CFD method performs with great accuracy in simulating the nonlinear bluff body aeroelastic forces, its computational cost is relatively high for small time steps and a long simulation duration because of the three-dimensional wakes and intensive flow separations around the structure. To address the issue of high computational cost in CFD simulations, a number of reduced-order models of nonlinear aeroelastic forces have been proposed to balance the simulation fidelity and computational efficiency. A nonlinear analytical self-excited force model was developed by Náprstek et al. [13] based on the Rayleigh–Duffing and Van Der Pol–Duffing types of differential equations. Wu et al. [14,15] introduced Volterra series that consist of linear and higher-order convolutions representing the complex mapping rules and time lags (fluid memory effects) between the bridge aerodynamics inputs and outputs. Gao et al. [16] proposed a polynomial function with high-order terms to describe the nonlinear aeroelastic forces on the bridge decks. Zhang et al. [17,18] modified the traditional Scanlan model to consider the nonlinear aerodynamics effects, where the flutter derivates are functions of the vibration amplitude and phase difference. While these developments have advanced the nonlinear bridge aeroelastic modeling, the complexities involved in the identification of their parameters pose a great challenge for wide applications.
With the fast advances in machine learning techniques, artificial neural networks (ANNs) have received increasing attention due to their advantages for modeling complex nonlinear dynamic systems [19]. Compared to the shallow architectures, the deep architectures of networks show better prediction abilities [20]. The applications of deep learning have been very successful in various fields [21,22], and hence it is reasonable to expect that it can be used to effectively model nonlinear wind–bridge interactions. Considering the fluid memory effects, the self-excited forces (and hence aeroelastic responses) of the bridge deck depend not only on the motion of the current time step, but also on the history of the previous time steps, which cannot be efficiently captured by conventional feedforward ANN with a fixed input length [23]. On the other hand, the recurrent neural networks (RNNs) take the previous outputs as part of the inputs of the current time step. However, theoretical and empirical evidence have shown that the traditional RNN network cannot reliably utilize the information of more than 10 previous time steps [24,25]. To overcome the gradient vanishing or explosion, long short-term memory (LSTM) was introduced to augment the network. Several studies have shown LSTM as presenting great promise in modeling the complex nonlinear dynamic systems and the prediction of long-time series [26,27,28]. Li et al. [29] used an LSTM neural network to predict the LCO of the airfoil in transonic flow, indicating that the LSTM network has the ability to learn the complex nonlinear system with various structural parameters. Li et al. [30] successfully captured the nonlinear post-flutter behavior of a bridge deck at various wind speeds by utilizing the LSTM networks. Furthermore, Li and Wu [31] introduced a knowledge-enhanced LSTM network to enhance the training efficiency and simulation accuracy. Li et al. [32] and Wang et al. [33] also introduced a new loss function to the original LSTM network for enhancing the training efficiency and prediction stability. The works mentioned previously motivated this current study to develop a reduce-order model to capture the nonlinear features of the post-flutter of the bridge decks under different leading-edge angles.
In this study, CFD was first used to simulate nonlinear aeroelastic forces to investigate the LCO phenomenon of bridge decks with various aerodynamic configurations. Then, the aerodynamics datasets were generated by high-fidelity CFD simulations, where the deck motion was used as the input and the aeroelastic forces were outputs. With a hybrid loss function utilizing the prediction errors of both aeroelastic forces simulated by an LSTM network and bridge deck responses calculated by the Newmark-β algorithm to improve the network performance, the LSTM network was trained to be a nonlinear aeroelastic force model for the bridge decks with various leading edges. The simulation results demonstrate that the nonlinear post-flutter behavior of bridges can be accurately and efficiently predicted through the developed LSTM network. Due to the low computational cost, the obtained model can facilitate the aerodynamic optimization of the bridge decks under winds.
2. Numerical Simulation of LCO
2.1. Governing Equations
The simulation of the incompressible, two-dimensional (2D) wind field crossing the bridge deck was based on the unsteady Reynold-averaged Navier–Stokes (RANS) equations. Considering the deck section motion, the dynamic mesh is used to accommodate the moving boundaries. Accordingly, the governing equations of the wind–bridge interaction system nested in an arbitrary Lagrange–Euler framework can be expressed as:
where the ui and uj represent the wind velocity components in the along-wind and cross-wind directions; zi and zj denote the Cartesian spatial coordinates; ρ is the air density; p is the wind pressure; is the grid velocity; Si is the additional source contributions; and μeff is the effective viscosity including both laminar and turbulent effects. The turbulence was modeled using the shear-stress transport (SST) k-ω scheme, where k is the turbulence kinetic energy and ω is the specific dissipation. In this study, the commercial CFD software Fluent 2020R2 was employed to simulate the wind–bridge interactions.
2.2. Computational Domain and Mesh Arrangement
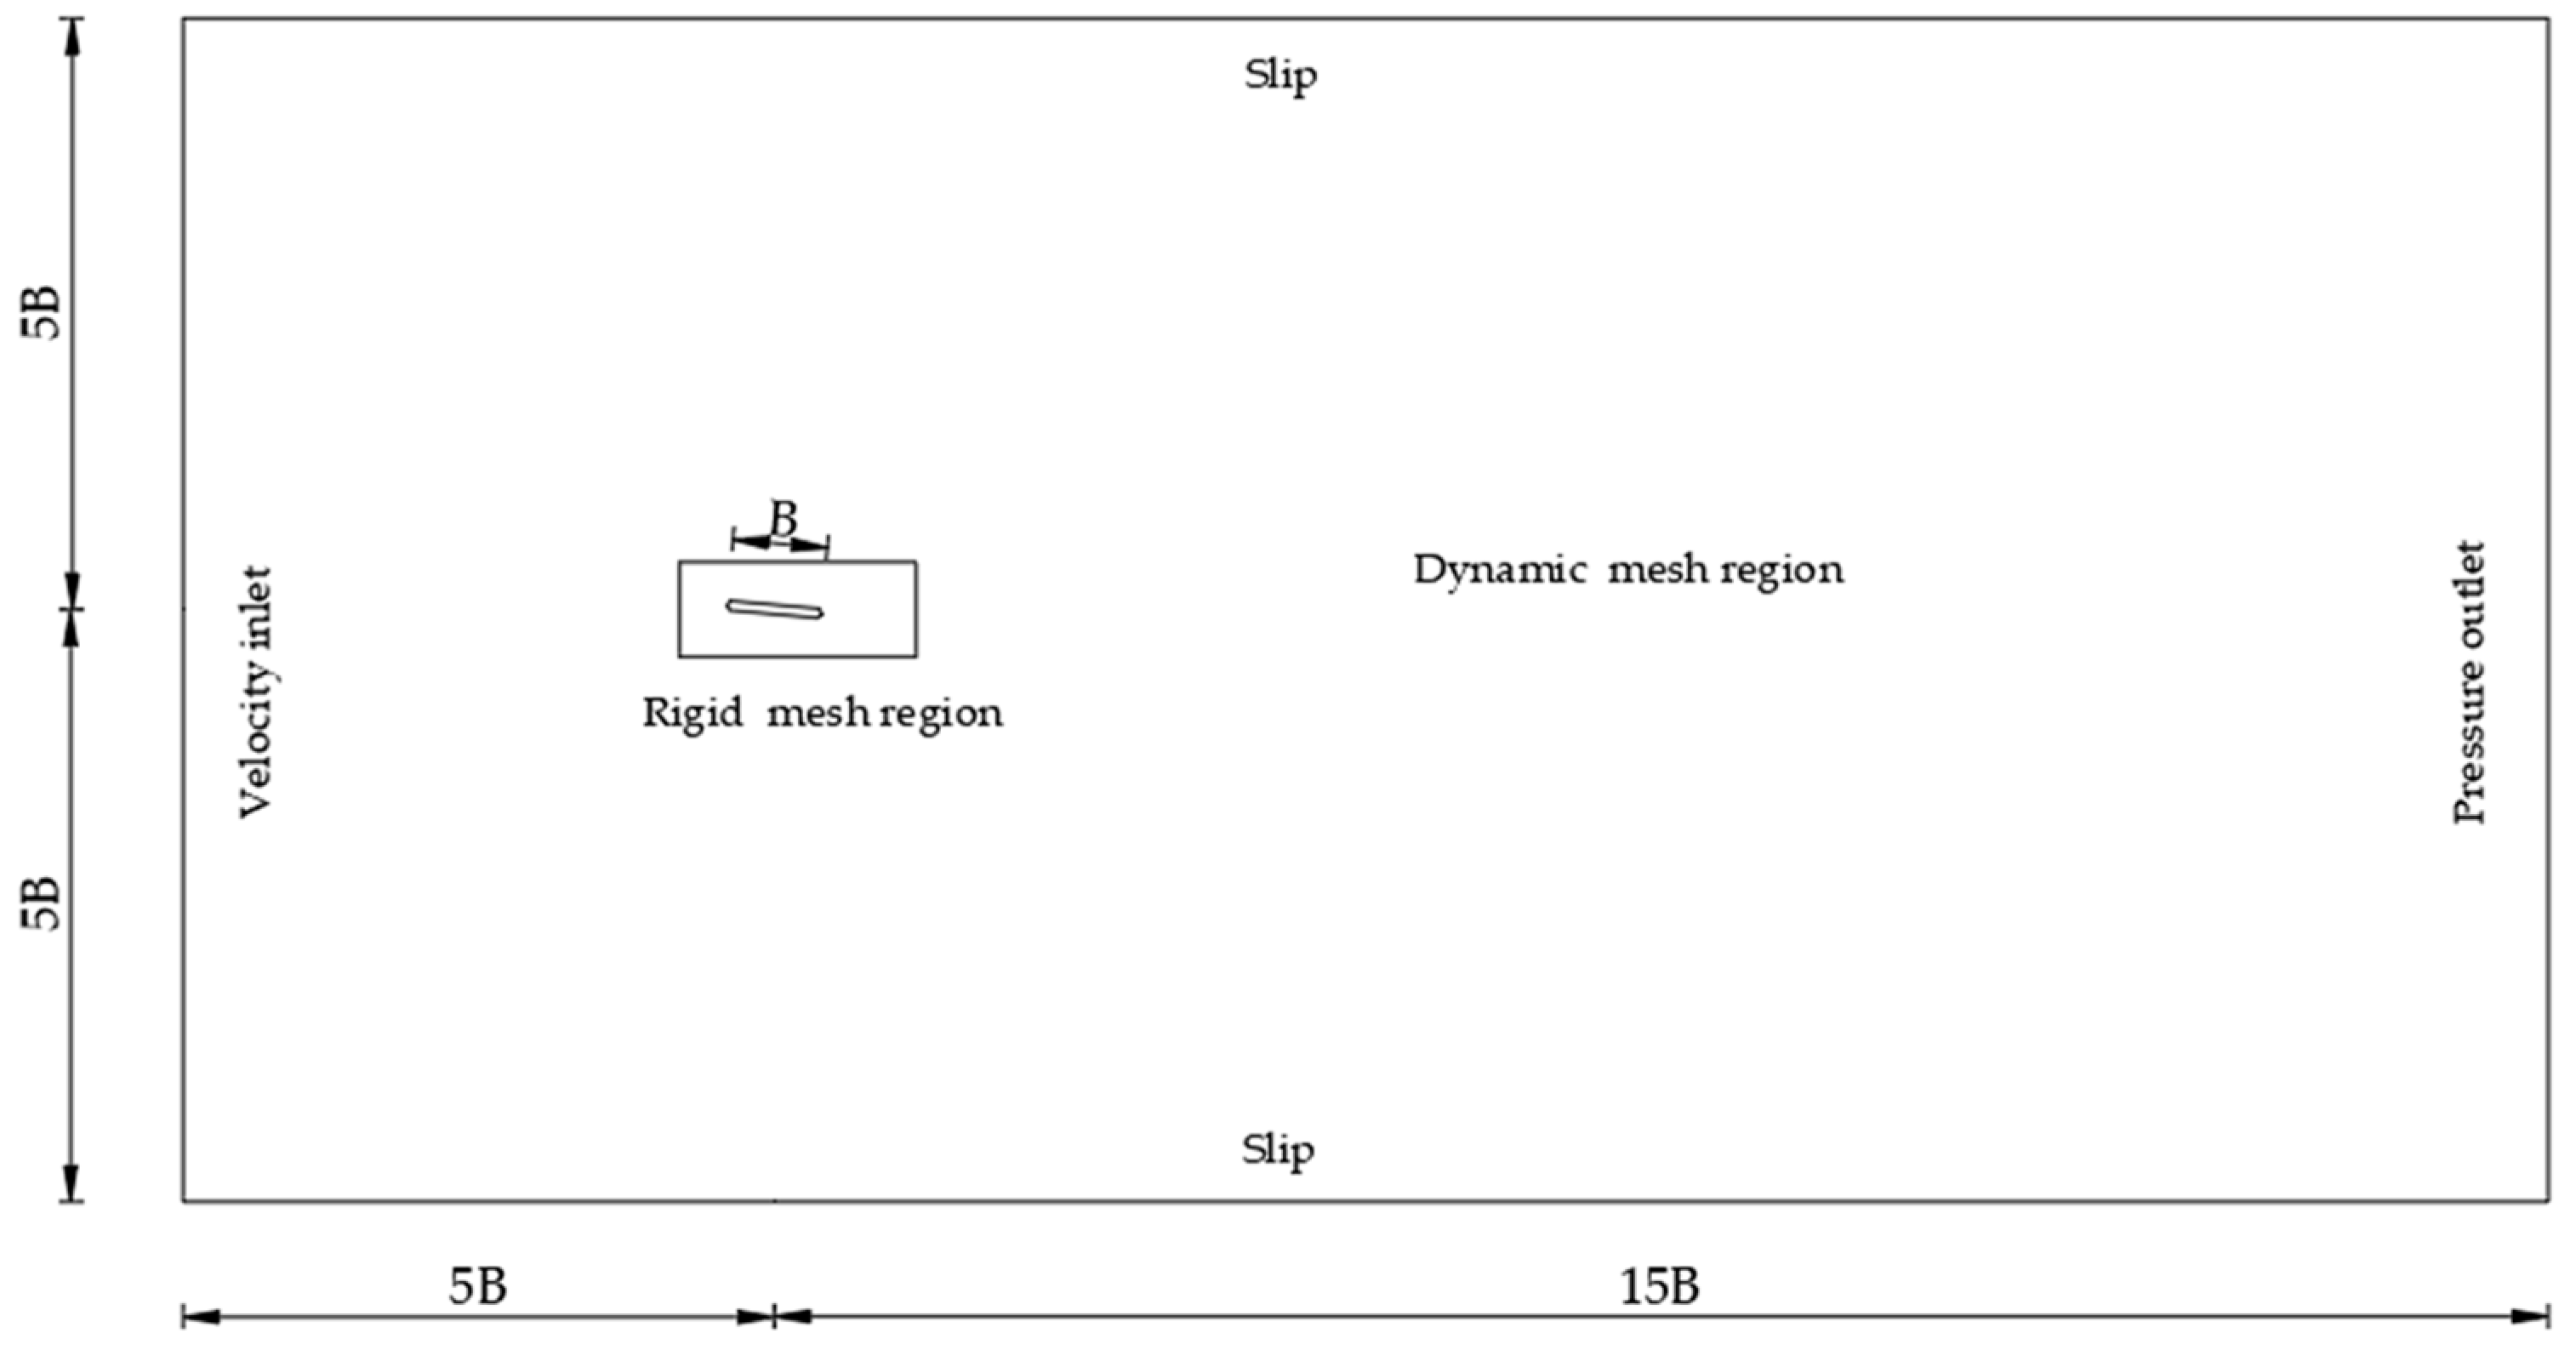
The computational domain and the corresponding boundary conditions are shown in Figure 1, where the along-wind domain size is set as and the cross-wind domain size (B = bridge deck width). The computational domain size was sufficiently large to avoid the flow obstacle effect. The velocity inlet condition was set to be the inflow boundary, and the turbulence intensity of the oncoming flow was set to be 0.5%. The constant pressure outlet condition was set to be the outflow boundary. The non-slip condition was used for the bridge deck boundary, while the slip condition was used at the top and bottom boundaries. The hybrid mesh was used to discretize the computational domain to balance the computational efficiency and accuracy. The structured quadrangular grid was generated around the bridge deck section to capture the details of the separation flow, while the unstructured triangular grid was used for the remaining area. In the computational domain, the mesh of the rigid region followed the bridge deck motion exactly while the mesh in the dynamic region deformed based on the spring-based smoothing method at each time step. To accurately simulate the flow in the bridge deck boundary layer, the distance of the first grid layer to the deck surface was set to be 0.00001B. Accordingly, the nondimensional wall coordinate y+ was smaller than unity. The mesh cell number used in the following CFD cases was around 75,000.
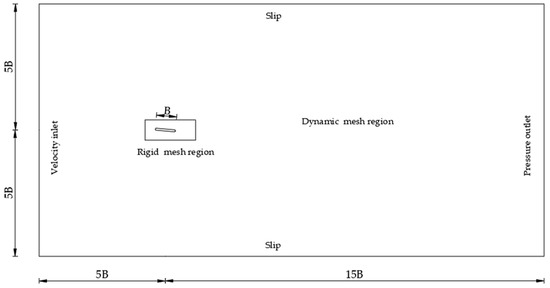
Figure 1.
Computational domain and boundary conditions.
2.3. Wind–Bridge Interaction
The sectional bridge deck motion can be simplified as a two degrees-of-freedom vibration system with the corresponding governing equations expressed as:
where the and respectively represent the vertical and torsional displacements; the overdot denotes the derivative with respect to time; m and Im are the mass and inertial moment per unit length of the deck section; ω and ξ are the natural circular frequency and damping ratio; and L and M are the aeroelastic lift force and torsional moment on the bridge deck section, respectively. To satisfy the geometrical compatibility and the equilibrium conditions on the interface between the wind and bridge, the weak coupling method was employed for the sake of computational efficiency. Once the flow field was initialized (with a steady state), the basic procedure of solving the wind–bridge interactions could be summarized as below:
Step 1. The pressure on the bridge deck surface is calculated and used to obtain the lift force and torsional moment.
Step 2. The bridge deck motion is accordingly solved using the Newmark-β algorithm.
Step 3. The obtained displacements are used to determine the deck section position for the next time step, and the mesh around the section is accordingly updated.
Step 4. Based on the new deck position and grid (mesh) velocity, the flow field is then calculated and the corresponding aeroelastic forces is acquired.
Step 5. The Steps 1–4 are repeated until the prescribed motion duration and maximum displacement conditions are satisfied.
2.4. CFD Validation
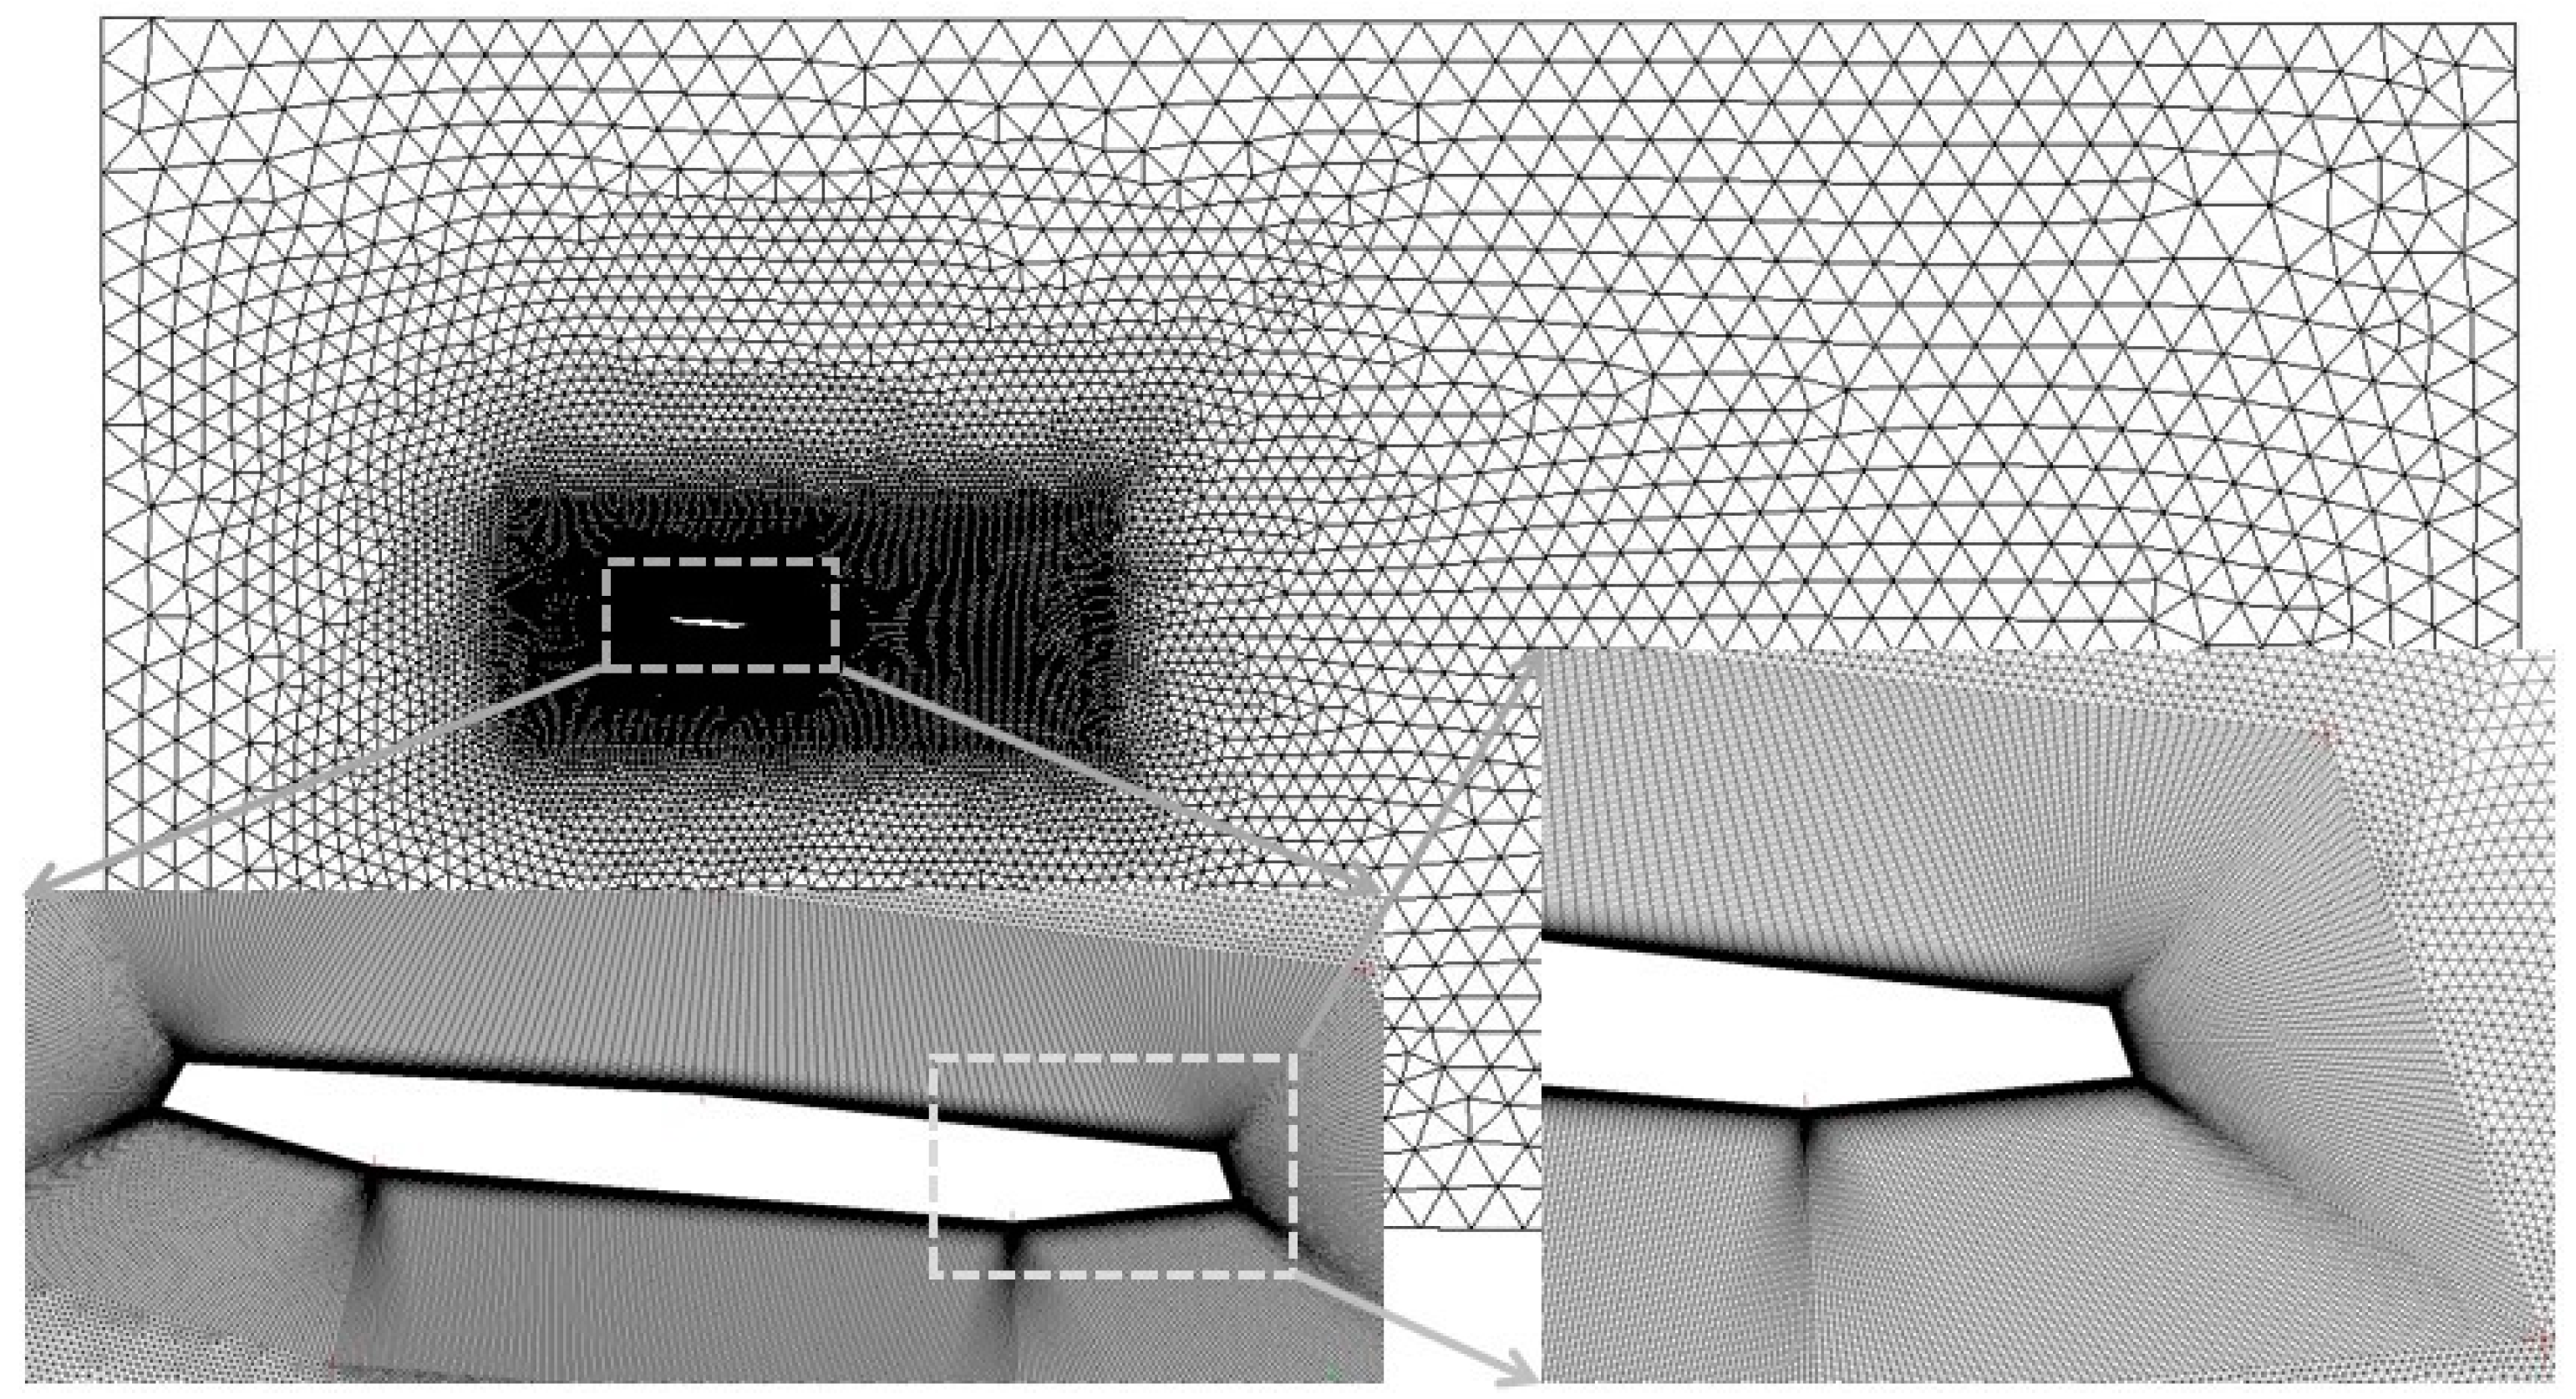
The experimental data in Zhang et al. [17] were utilized to validate the CFD simulation accuracy. The structural parameters of the validation system were the bridge deck width B = 0.78 m, bridge deck height H = 0.07 m, vertical frequency fh = 2.01 Hz; torsional frequency fα = 3.79 Hz, m = 12 kg/m, Im = 0.44 kg·m2/m and ξh = ξα = 0.005, and the corresponding mesh configuration used in the CFD simulations is presented in Figure 2. The comparison results of the critical flutter wind speeds of the bridge deck under the wind angle of attack α0 = 0° between the CFD simulation and experimental test are shown in Table 1, and the LCO amplitudes of the bridge deck under wind angle of attack α0 = +5° and mean wind speed U = 12.0 m/s are presented in Table 2. It was noted that the CFD and experimental results were in an excellent agreement.
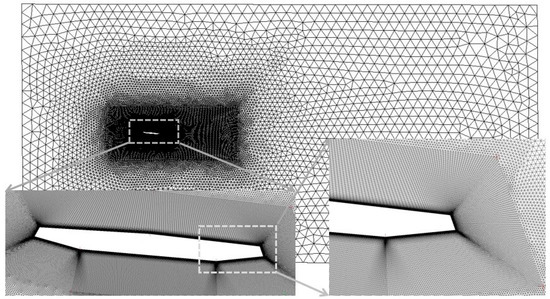
Figure 2.
Mesh details of validation bridge system.

Table 1.
Critical flutter wind speed comparison.

Table 2.
LCO amplitude comparison.
2.5. CFD Simulation
It is well known that the leading-edge configuration has significant effects on the critical flutter wind speed and post-flutter LCO amplitudes. The validated CFD method was utilized to simulate the flutter and post-flutter responses of the bridge decks with various leading-edge angles αd (as defined in Figure 3), including αd = 120°, αd = 126°, αd = 130°, αd = 134°, αd = 140°, αd = 150° and αd = 165°. The structural parameters of the bridge deck system with various leading-edge angles are listed in Table 3. The initial wind angle of attack α0 was set to be +5° to ensure that the post-flutter LCO phenomenon can be observed. A wide range of wind speeds were employed in the CFD simulations to clearly present the evolvement of the bridge deck LCO amplitudes.

Figure 3.
Bridge deck section geometry (unit: m).

Table 3.
Structural parameters of bridge deck system with various leading edges.
The steady-state LCO amplitudes as a function of wind speeds for various leading-edge angles are shown in Figure 4. The critical flutter wind speed decreased with the leading-edge angle. Under each wind speed, the LCO amplitude increased with the leading-edge angle. Both the LCO amplitude and its growth rate increased with the wind speed in the post-flutter region. To closely examine the aeroelastic forces on the bridge deck, the time histories of the CFD simulation results with a deck leading-edge angle of 165° and wind speed of 11.5 m/s are shown in Figure 5. It was noted that higher-order harmonics were observed in both the aeroelastic lift force and torsional moment time histories.

Figure 4.
Steady state amplitudes for LCO. (a) Vertical amplitude. (b) Torsional amplitude.

Figure 5.
Time histories of CFD-based nonlinear aeroelastic forces. (a) Lift force. (b) Torsional moment.
3. LSTM Network
The recurrent neural network (RNN) was designed for sequential data processing, such as speech recognition, natural language processing and time series prediction. Unlike traditional neural networks, RNNs possess loops that allow previous information to be stored. This loop structure enables RNNs to be naturally suitable for bridge aeroelastic force simulations involving fluid memory effects. The RNN usually presents issues of gradient vanishing and gradient explosion for long-term time series predictions. To this end, the LSTM cell was introduced to replace the conventional neuron in the RNN hidden layers [24,25].
3.1. Forward Pass of LSTM Network
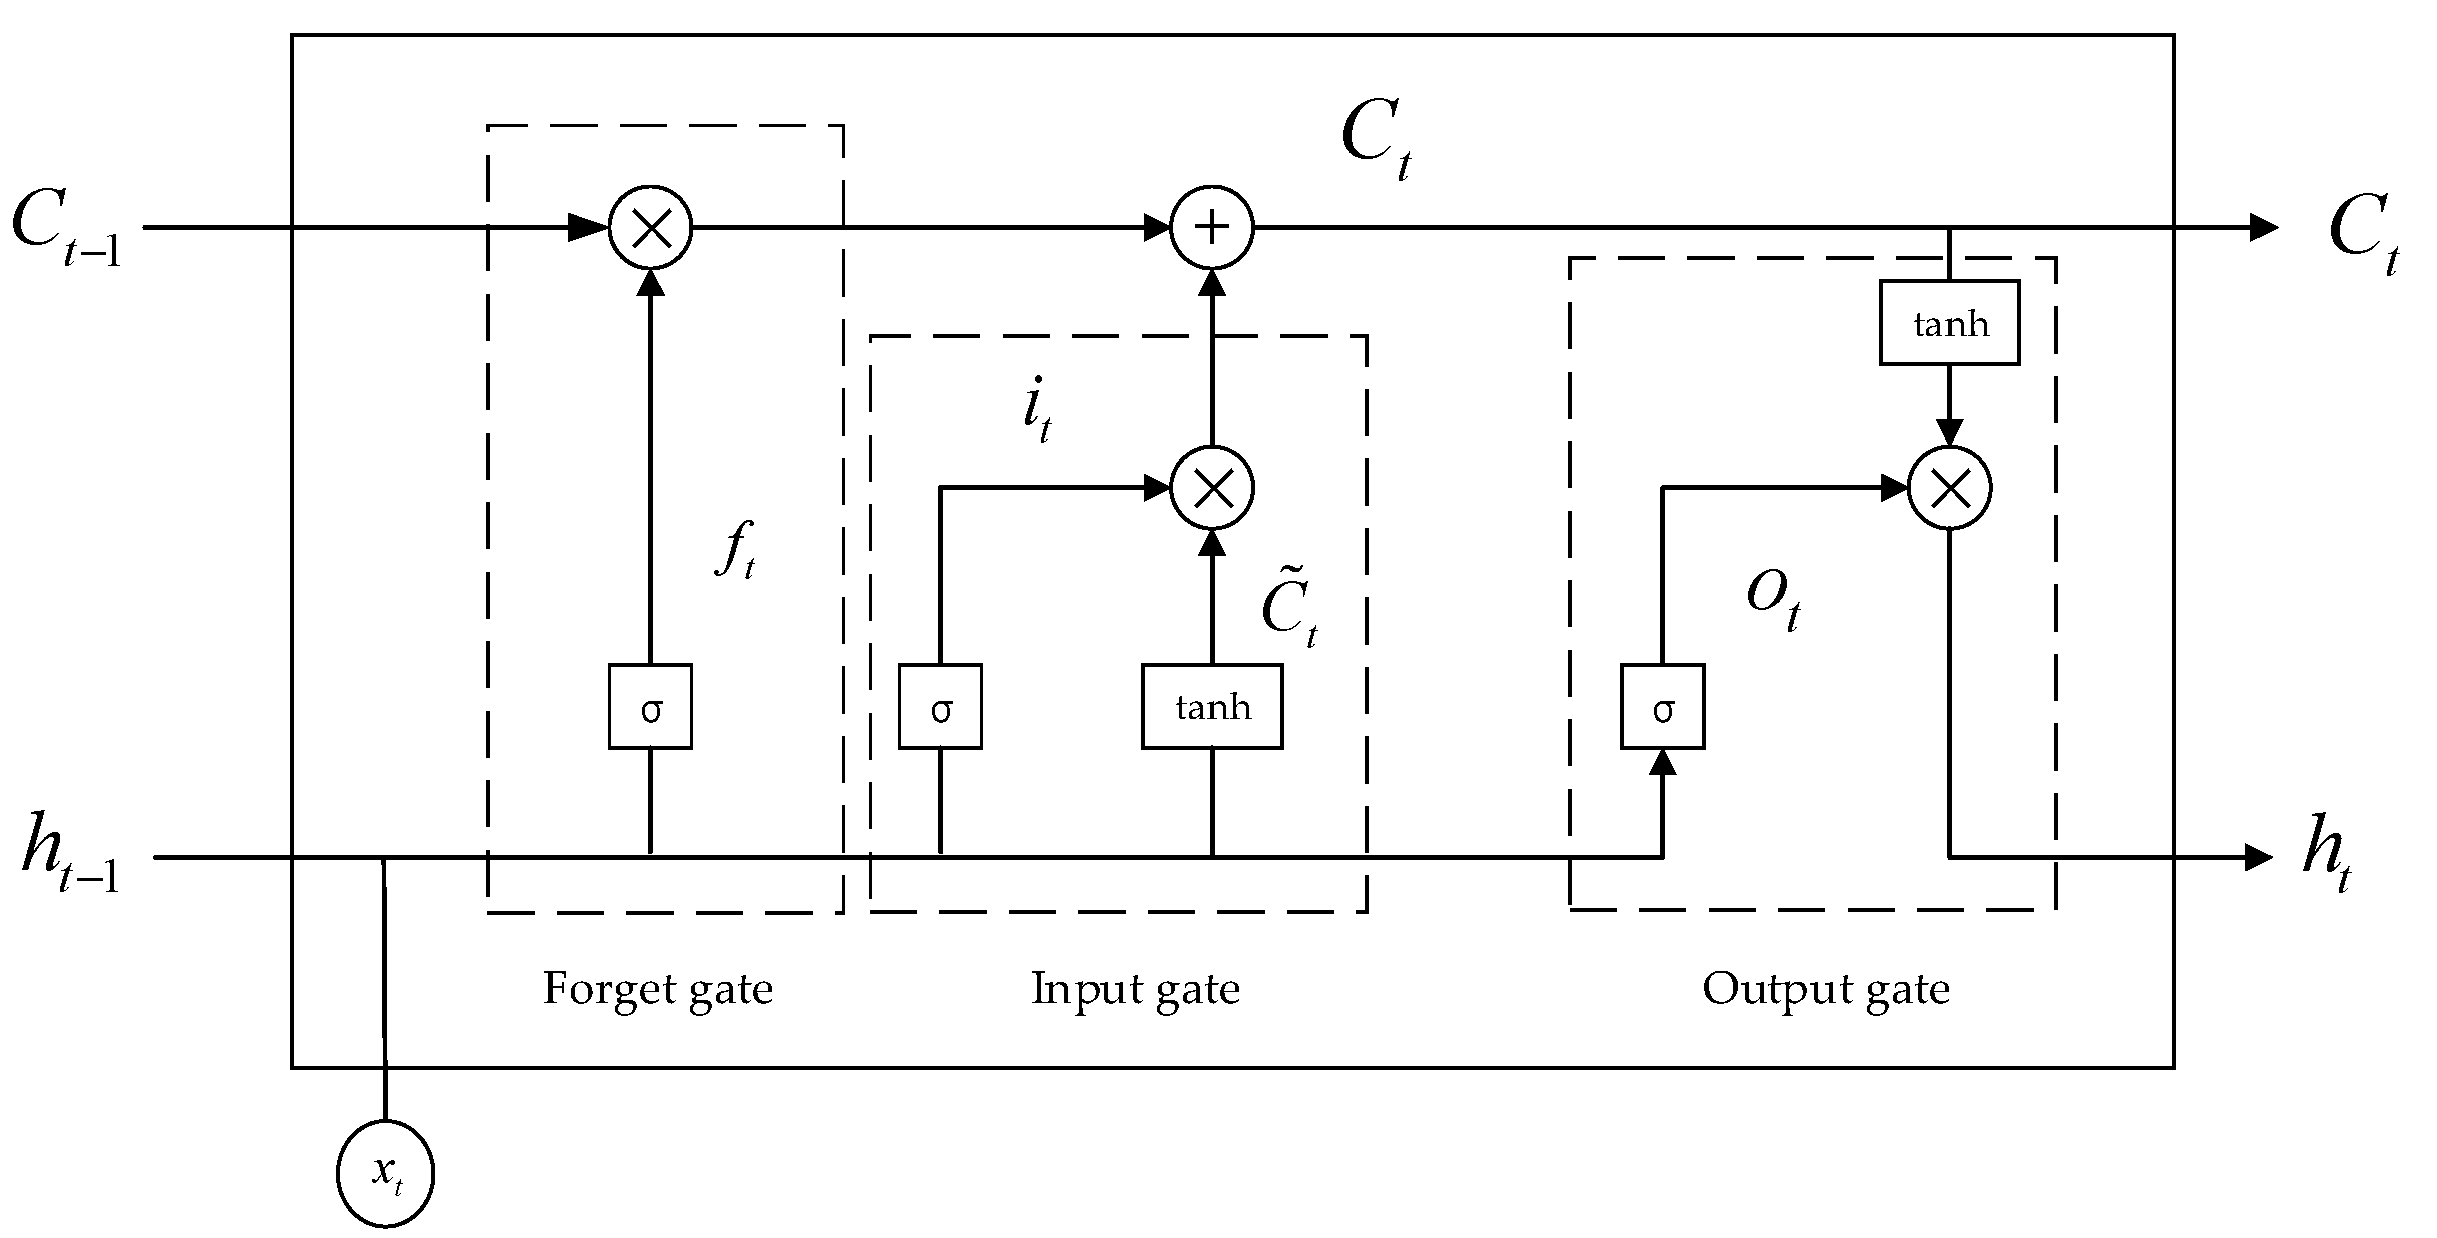
As shown in Figure 6, the LSTM cell acts like a gated leaky neuron, where xt represents the input at time t; ht means the cell output; and denote the cell state and internal hidden state, respectively; ft, it and ot are the forget gate, input gate and output gate, respectively; and σ(x) and tanh(x) are the activation functions described using logistic sigmoid (in the range of [0 1]) and hyperbolic tangent sigmoid (in the range of [−1 1]), respectively. The forget gate essentially empowers the memory cell to forget or remove outdated information from previous time steps by using the nonlinear activation function and the multiplication operation. The input gate is used to add new information to the cell state together with the internal hidden state, and the output gate generates the output information from the cell state.
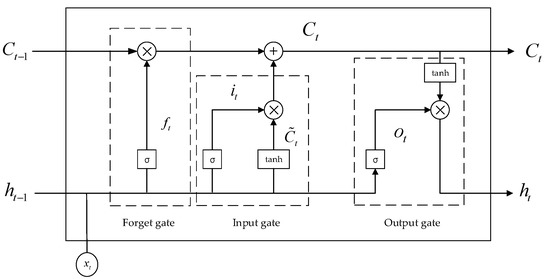
Figure 6.
Schematic of LSTM cell.
Accordingly, the forward pass of LSTM in Figure 6 can be expressed as:
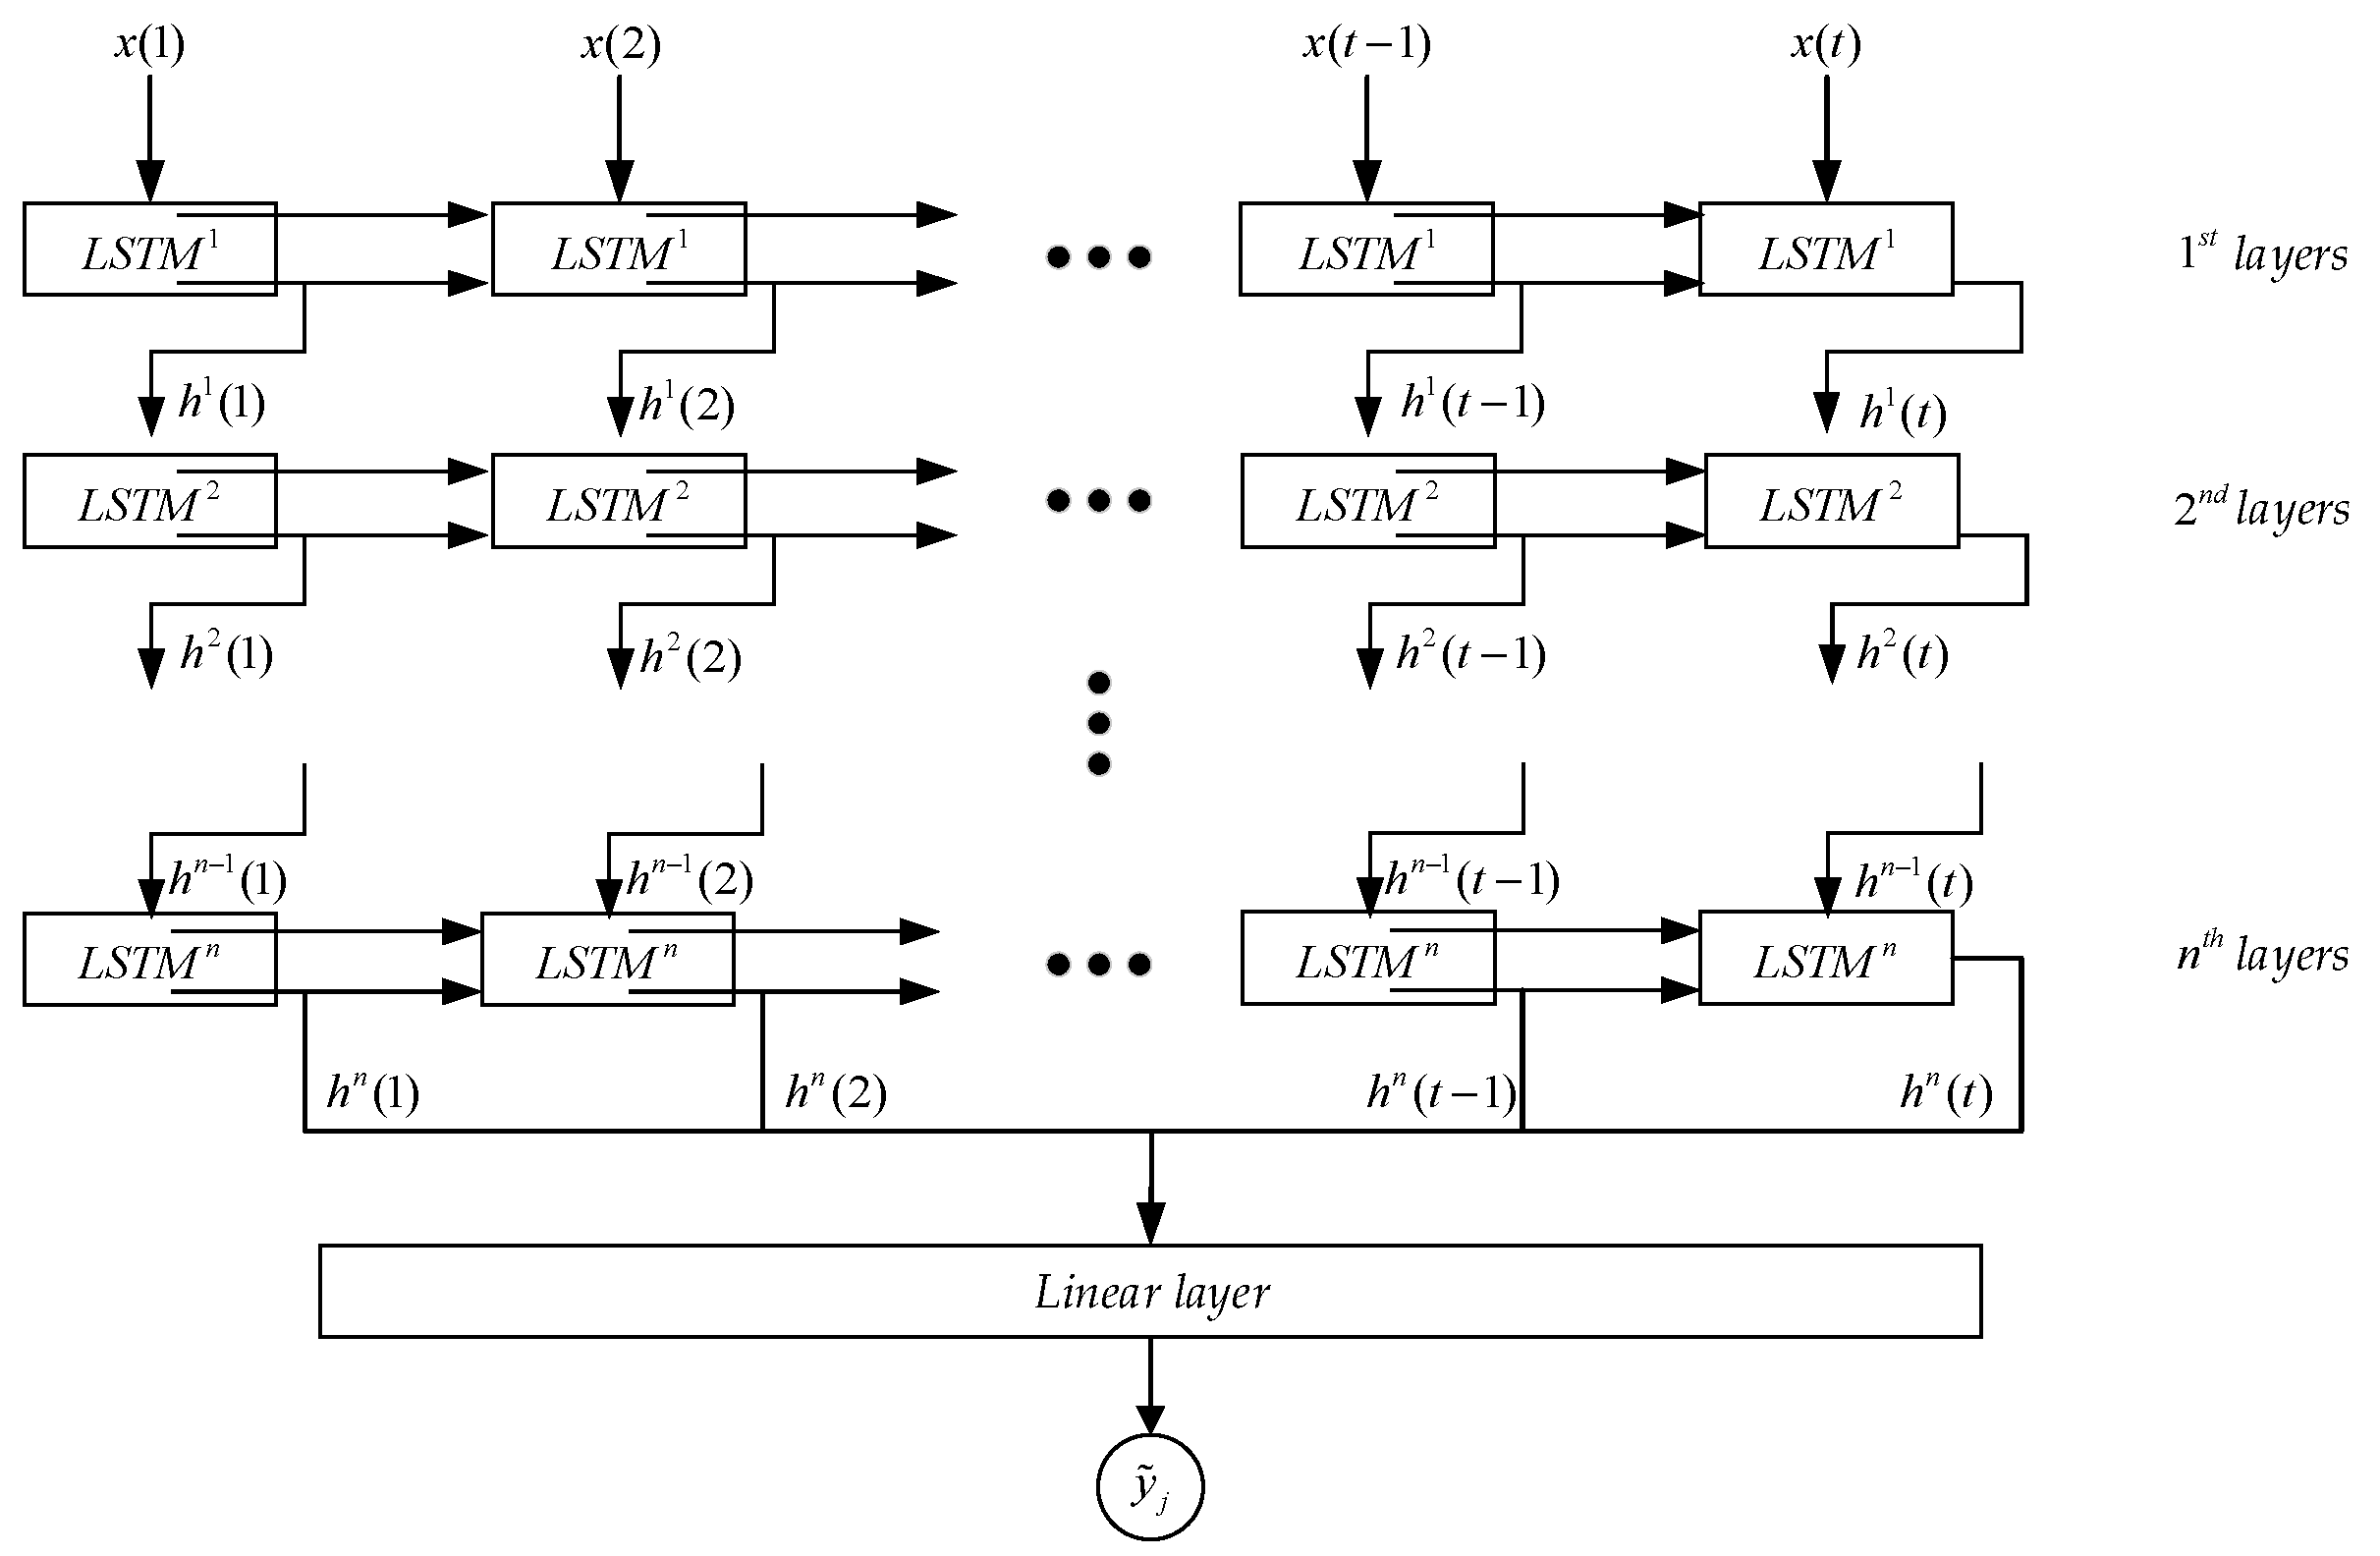
where the symbol denotes the dot product operation, and W~ and b~ are the corresponding weight and biases matrices, whose dimensions are the hyper parameters usually determined by trial and error. During the calculation, the current input and hidden state generate the output and new hidden state to be used (together with input) for the calculation at the next time step. As shown in Figure 7, an LSTM network usually consists of an input layer, several hidden layers of LSTM cells and an output layer. It is noted that each LSTM layer has its own initial state that is usually set to zero. For each LSTM layer, its input is the output of the previous layer and its output will be the input of the next layer. The last LSTM layer will be the input for the output layer (usually a linear layer) to generate the final output data (where j denotes the jth training sample).
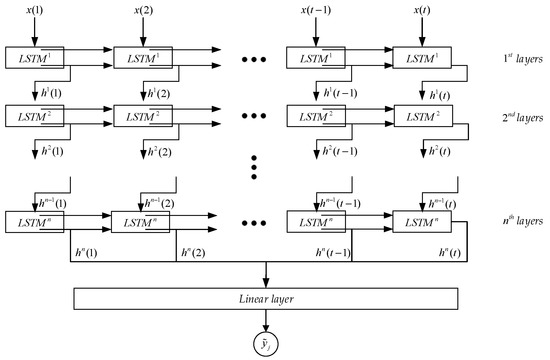
Figure 7.
The structure of a multiple-layer LSTM network.
3.2. Back Pass of LSTM Network with a Hybrid Loss Function
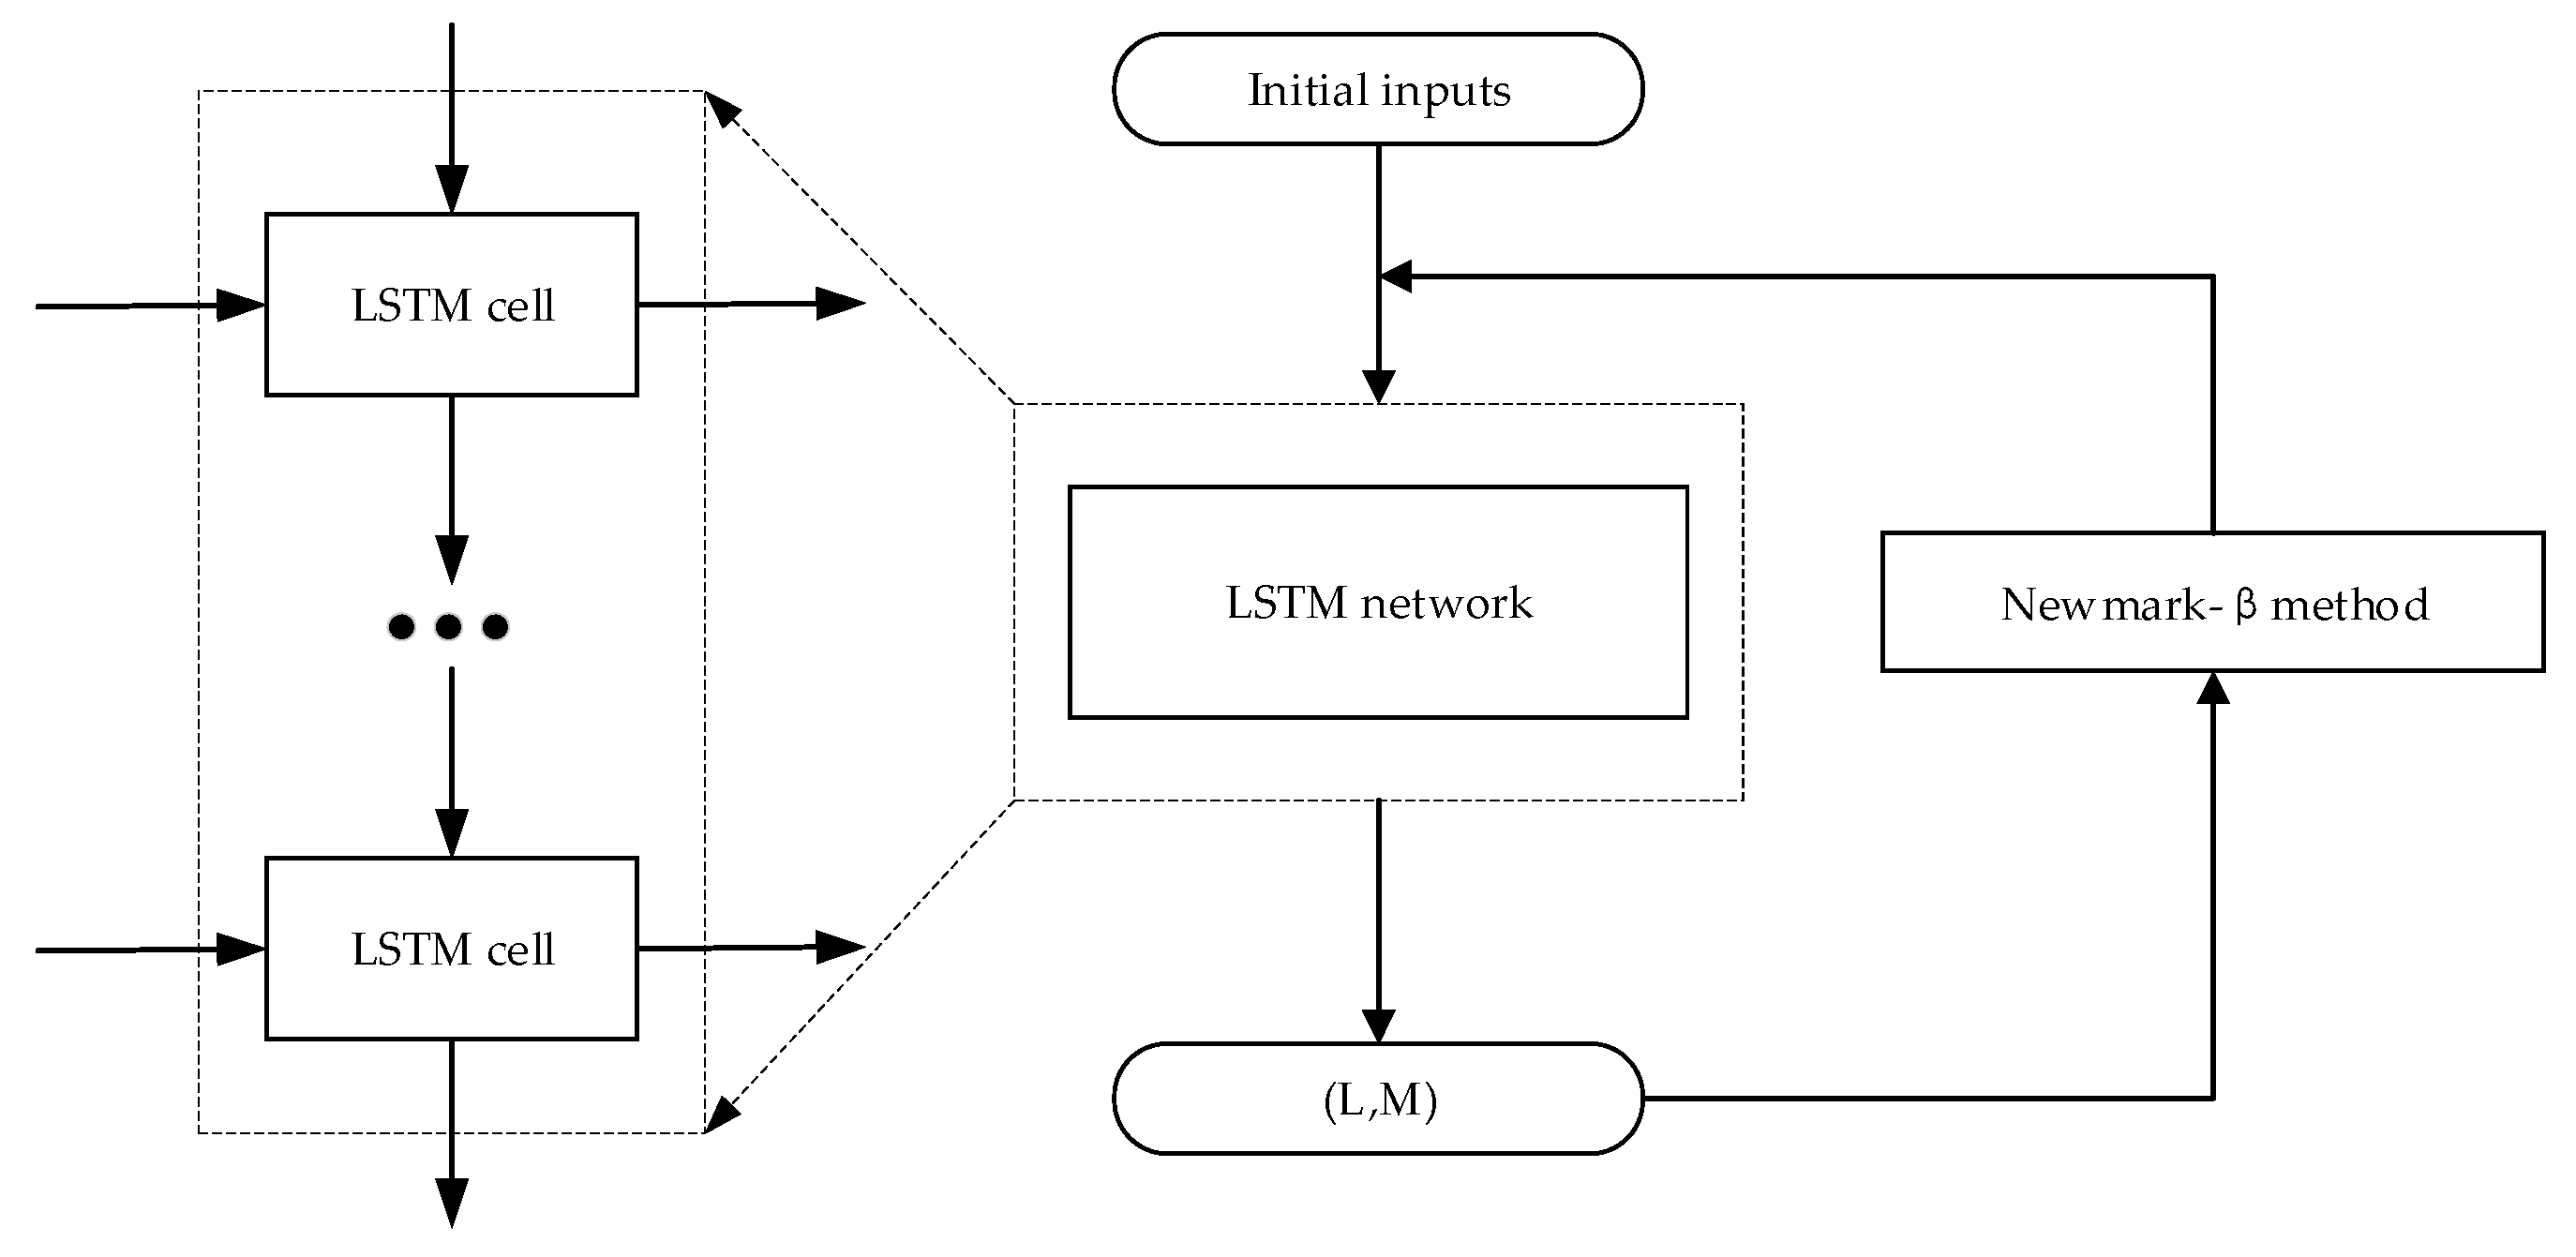
The BPTT (back propagation through time) is an inverse process of the forward pass of LSTM, which is aimed to determine the proper weight matrices and biases of the network. As presented in Figure 8, the aeroelastic force output of the current time step was used as the input of the Newmark-β algorithm to calculate the corresponding bridge deck response, which became the input of the next time step. During such a process, any small error will be accumulated and augmented through time steps, and finally may cause inaccurate results or divergence.
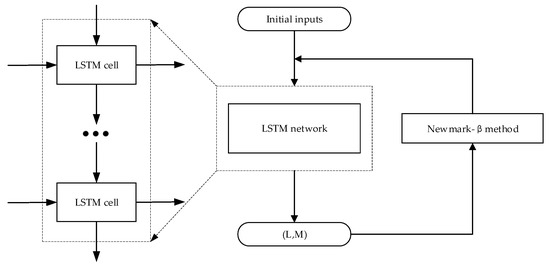
Figure 8.
The LSTM network prediction procedure.
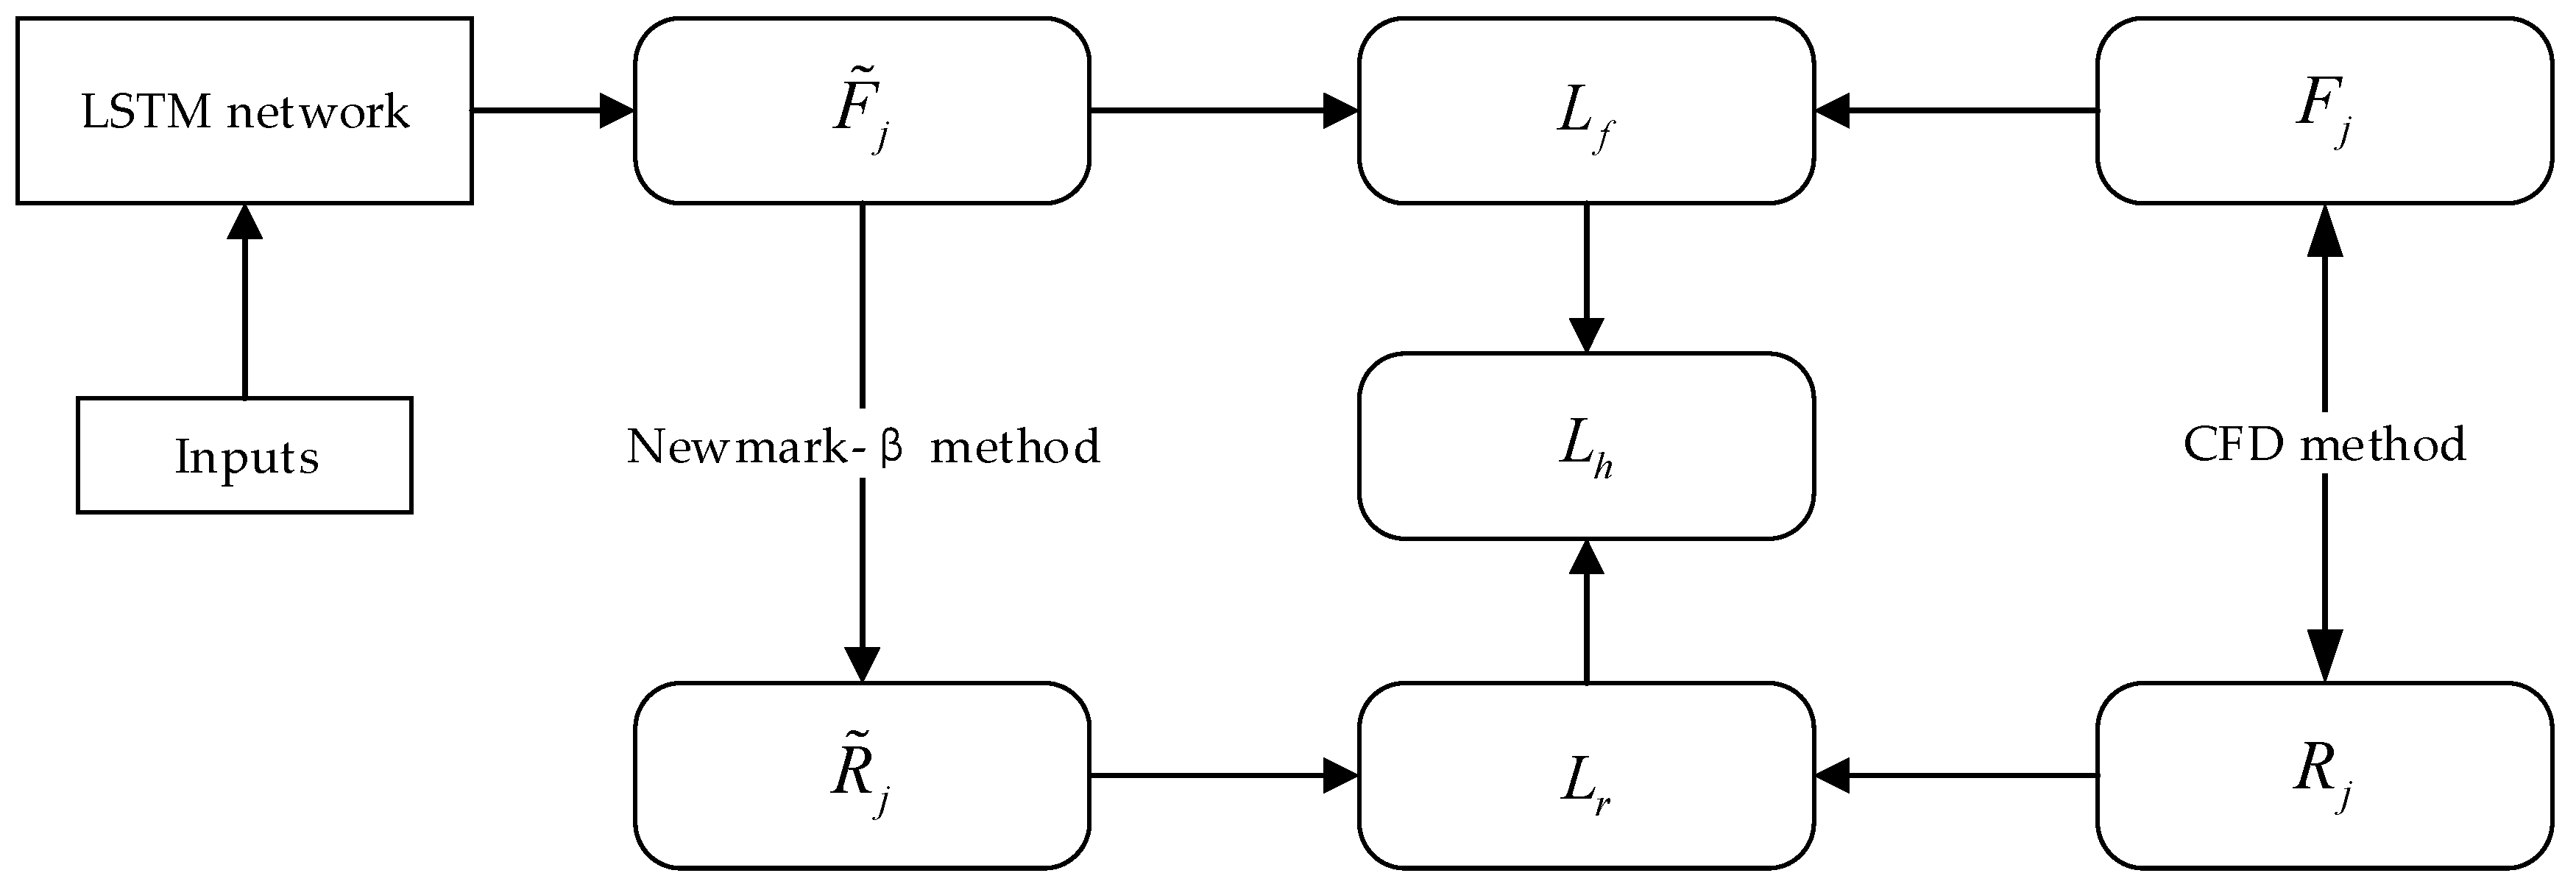
To improve the training efficiency and stability, a hybrid loss function was designed as:
where and respectively represent the loss functions related to the aeroelastic forces and bridge deck responses. These losses can be expressed as:
where N represents the number of training samples; is the target aeroelastic force (based on CFD simulations); is the corresponding results generated by the LSTM network; is the target bridge deck response (based on the CFD simulations); and is the corresponding results generated by the Newmark-β algorithm. For each batch of training datasets, as shown in Figure 9, the network first generated the aeroelastic force time history (and the corresponding ) that were used as the input for the Newmark-β algorithm to calculate the bridge deck responses (and the corresponding ). The Adam method was adopted to minimize the final hybrid loss function through updating the weight matrix and biases of the network. The LSTM network in this study contained three hidden layers, and the hidden size of each LSTM layer was set to be 32. Other hyperparameters of the LSTM network, such as the batch size of datasets (200) and the learning rate, were determined by trial and error.
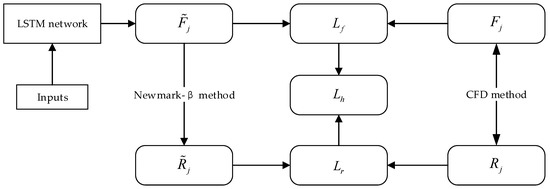
Figure 9.
The configuration of hybrid loss function.
3.3. LSTM Training
To design an LSTM network for the simulation of nonlinear aeroelastic forces, it is crucial to select the proper variables as its inputs. Conventionally, the deck displacements and velocities are utilized to represent the bridge motion state. To take the mass effects on bridge aerodynamics into account, the accelerations are also often added into the inputs. Considering that the major purpose of the present study was to predict the post-flutter LCO performance of the bridge decks with various leading edges, both the leading-edge angle and wind speed were part of the inputs. Accordingly, the inputs of the LSTM network contain the leading-edge angle αd, the wind speed U, the displacements (h, α), velocities (, ) and accelerations (, ). Due to the fluid memory effects, the responses of the bridge decks under the nonlinear self-excited forces not only depend on the current motion state but also on the previous motion states. Previous research has pointed out that the fluid memory fades over time, which means that the responses of the bridge deck are only impacted by limited time steps in the past [14]. In the LSTM network, the forget gate is designed to achieve this. Several studies have discussed the input length of the LSTM network to balance the accuracy and efficiency in the consideration of fading fluid memory effects [30]. In this study, the length of the training data was determined to be 0.3 s (i.e., 300 time steps with a time interval of 0.001 s).
The CFD simulation responses of the bridge decks with the leading-edge angles of 120°, 130°, 140°, 150° and 165° were utilized as the training datasets, while the CFD simulation data with αd of 126° and 134° were used as test datasets to verify the effectiveness and accuracy of the trained LSTM network. It was noted that all the data used in the training were normalized to improve the training efficiency (using where and were the mean value and standard deviation of the CFD simulations).
4. LSTM Network Simulation Results
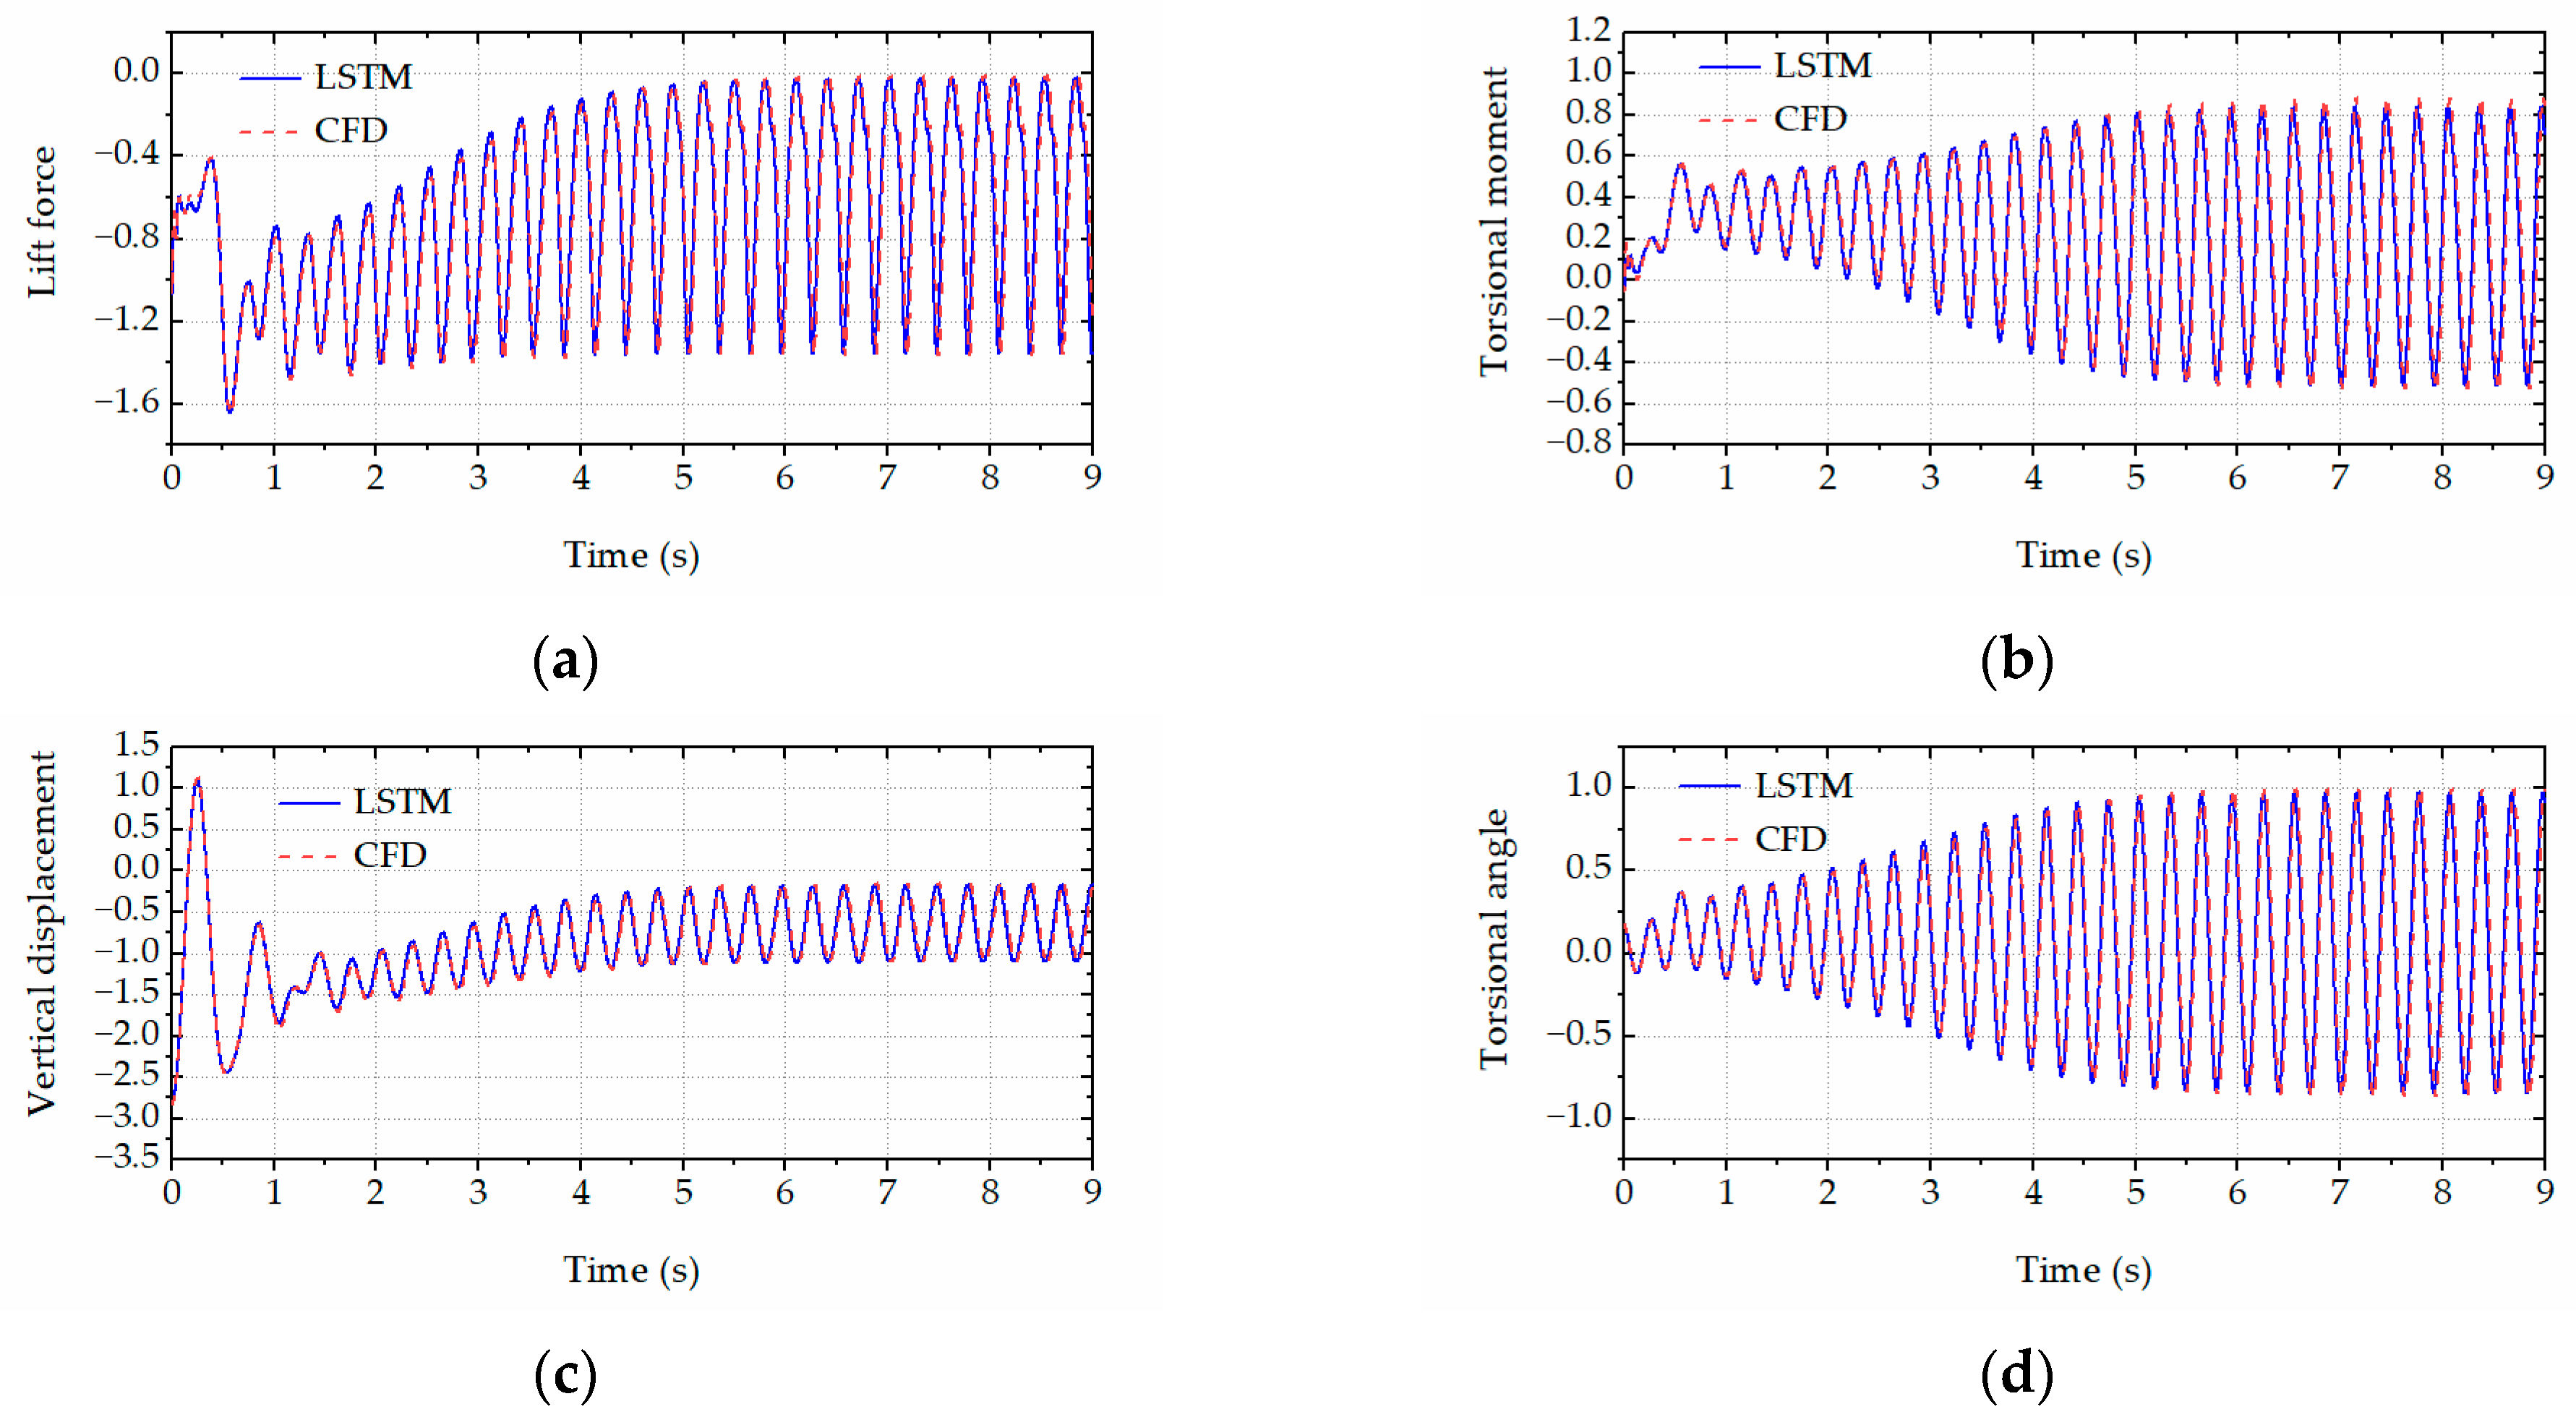
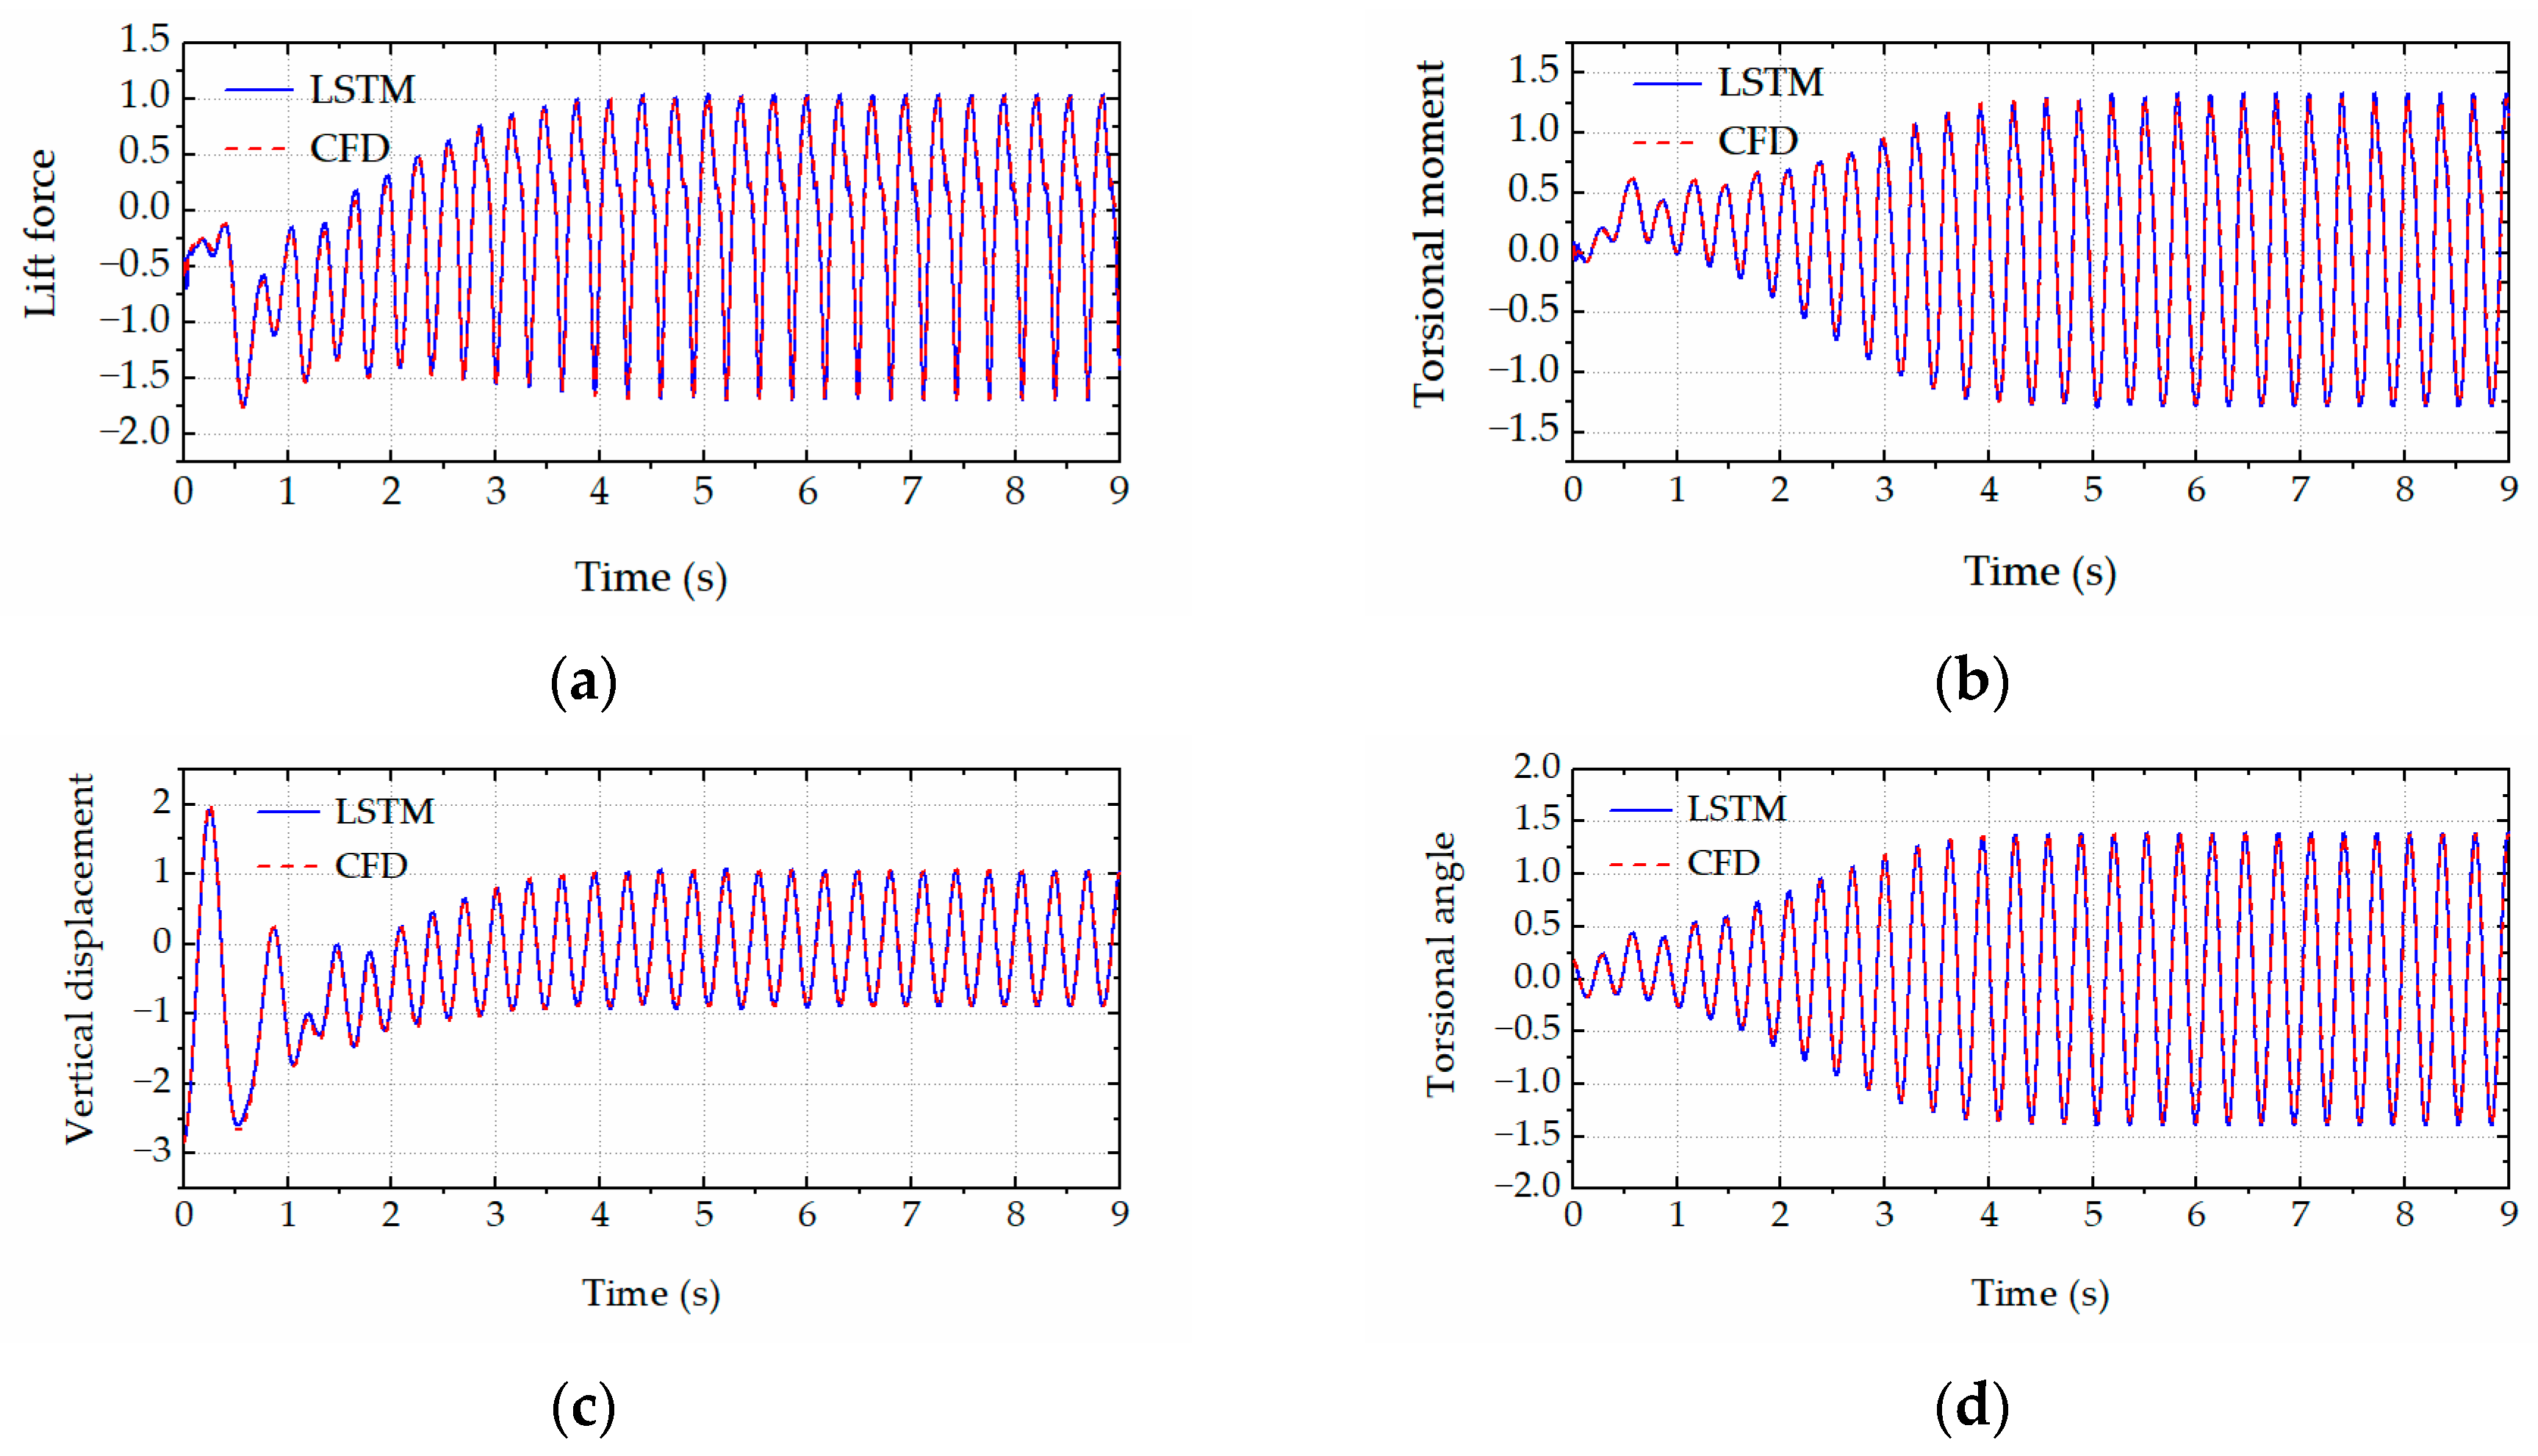
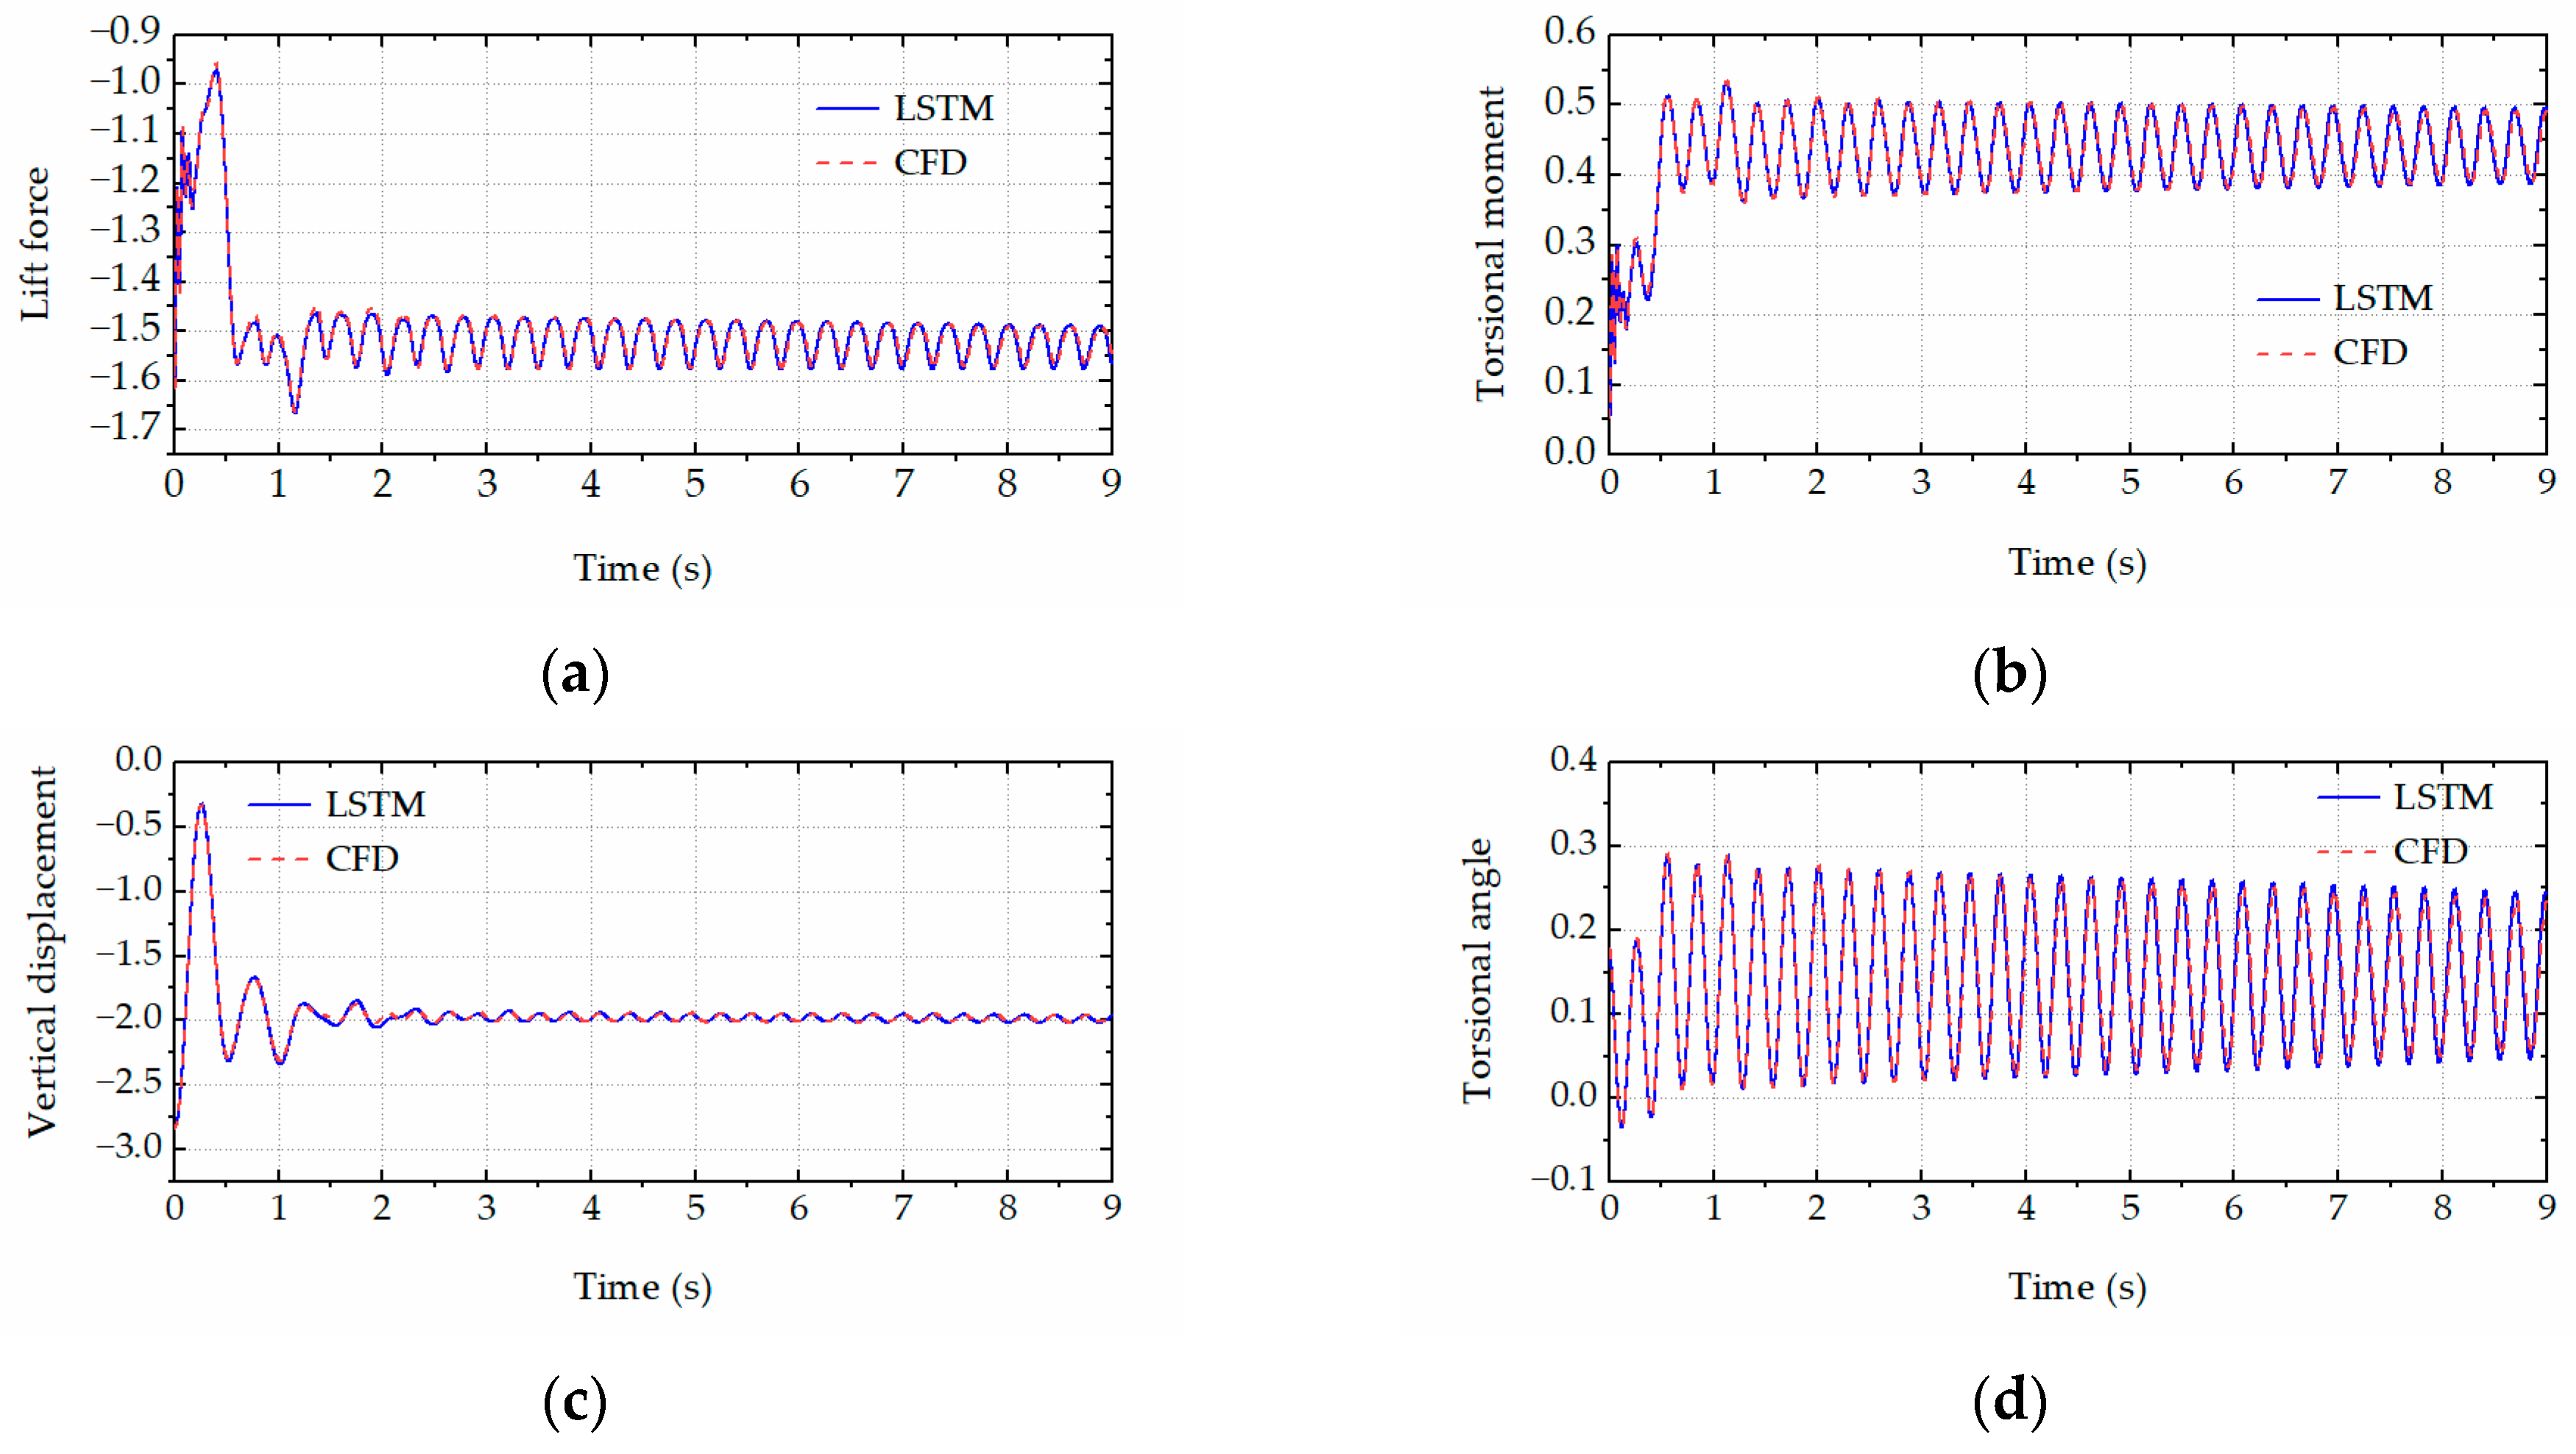
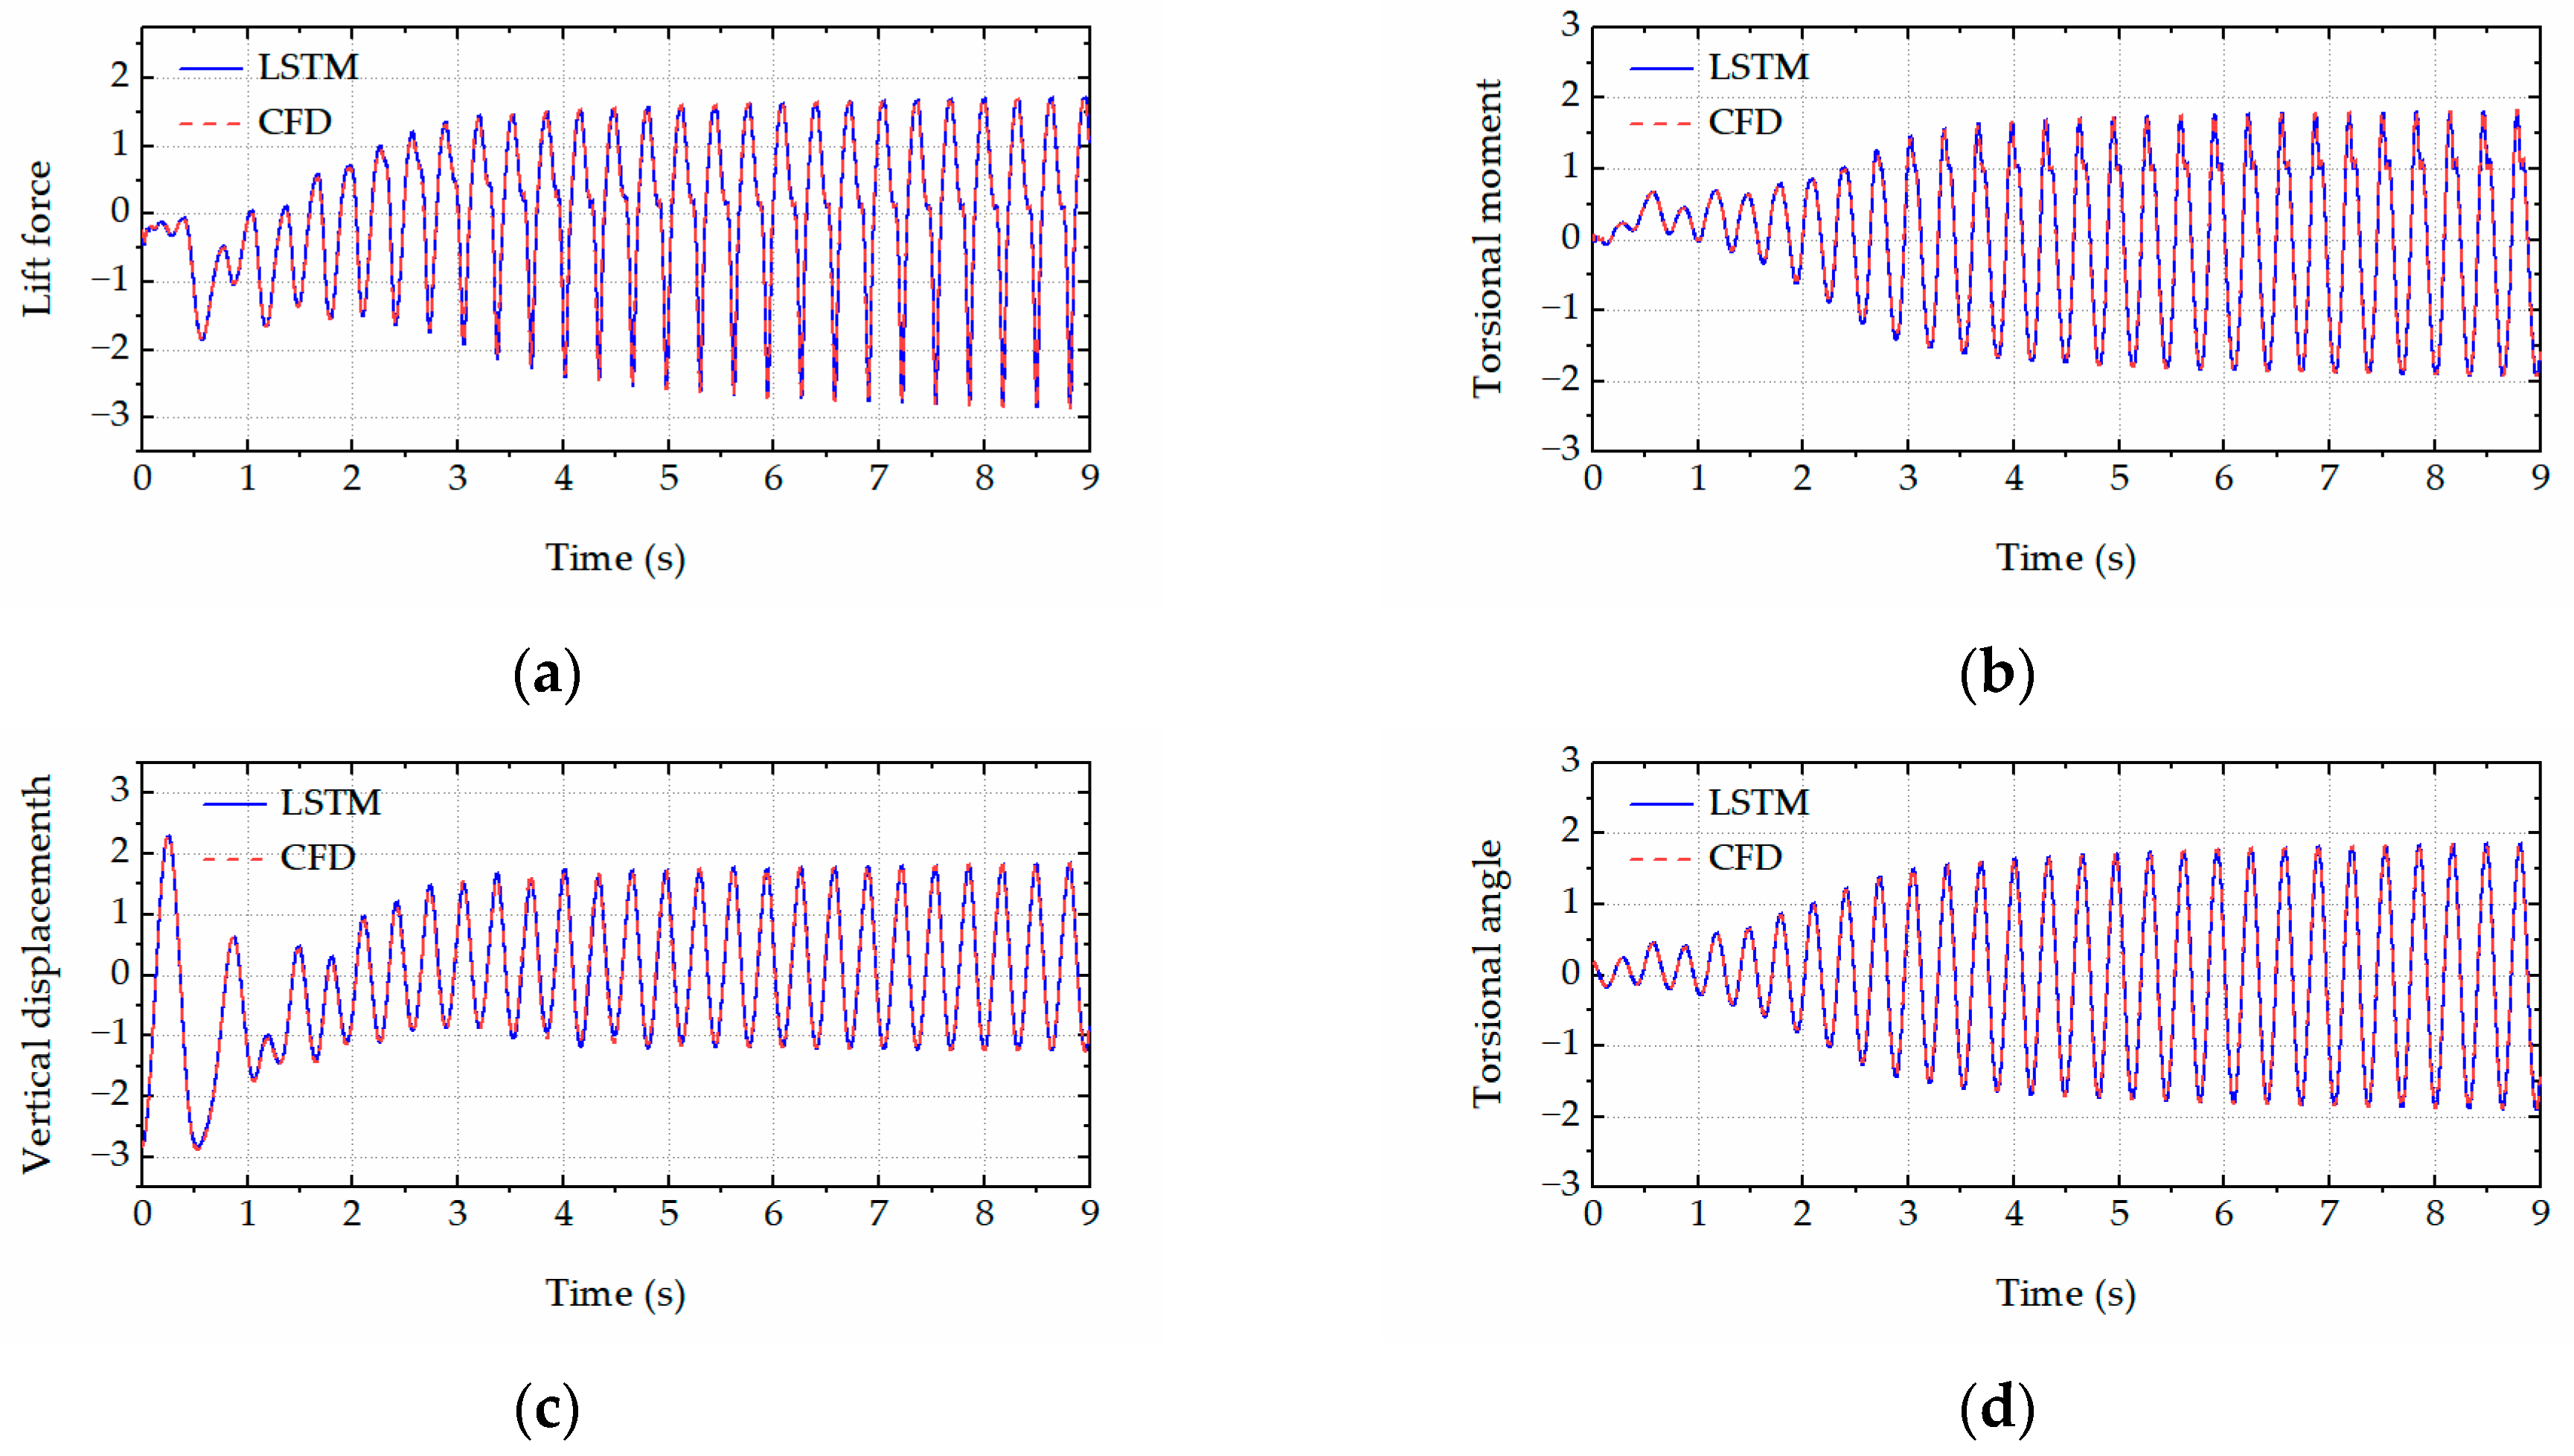
The trained LSTM network was employed to rapidly predict the aeroelastic forces and accordingly calculate the critical flutter wind speeds and post-flutter LCO amplitudes of the bridge deck (with various leading-edge angles) based on the Newmark-β algorithm. Specifically, Figure 10 and Figure 11 respectively present the comparison results of the LCO amplitudes in the post-flutter wind speed region for the bridge decks with the leading-edge angles of 126° and 134°. The excellent agreement between the CFD simulations and LSTM predictions is observed in the figures. The comparison results demonstrated that the proposed LSTM network could efficiently and accurately predict the complex nonlinear aerodynamics of the bridge decks with various leading-edge angles. Figure 12, Figure 13, Figure 14 and Figure 15 present the time histories of the LSTM-based aeroelastic forces and bridge deck motions (together with the corresponding CFD results) for four selected combinations of wind speeds and leading-edge angles, namely (1) U = 10.5 m/s and αd = 126°, (2) U = 11.5 m/s and αd = 126°, (3) U = 8.5 m/s and αd = 134° and (4) U = 11.8 m/s and αd = 134°. Good agreement was observed in terms of the amplitudes and phase differences in the growth stage, steady stage and decay stage (where the wind speed is smaller than the critical flutter wind speed). High-order harmonics in the aeroelastic lift force and torsional moment time histories were clearly presented. All these comparison results demonstrate that the proposed LSTM network has the capability and robustness to predict the complex nonlinear aerodynamics of the bridge decks with various leading-edge angles.

Figure 10.
The LCO amplitude comparison between CFD simulations and LSTM predictions for αd = 126°. (a) Vertical amplitude. (b) Torsional amplitude.

Figure 11.
The LCO amplitude comparison between CFD simulations and LSTM predictions for αd = 134°. (a) Vertical amplitude. (b) Torsional amplitude.
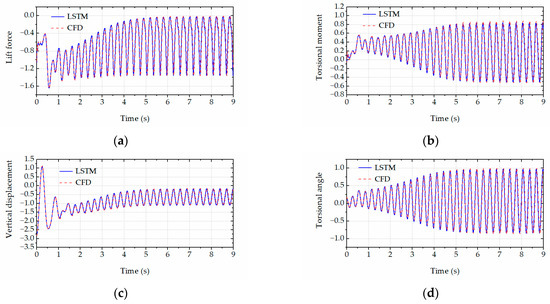
Figure 12.
The time history comparison between CFD simulations and LSTM predictions for U = 10.5 m/s and αd = 126°. (a) Lift force. (b) Torsional moment. (c) Vertical displacements. (d) Torsional angle.
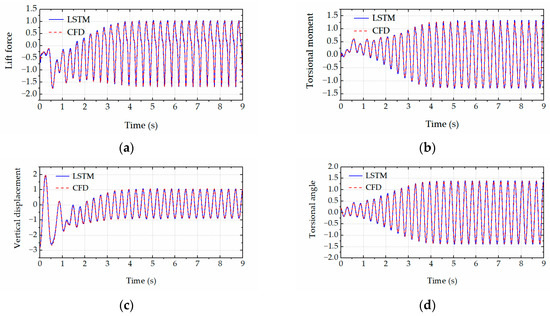
Figure 13.
The time history comparison between CFD simulations and LSTM predictions for U = 11.5 m/s and αd = 126°. (a) Lift force. (b) Torsional moment. (c) Vertical displacements. (d) Torsional angle.
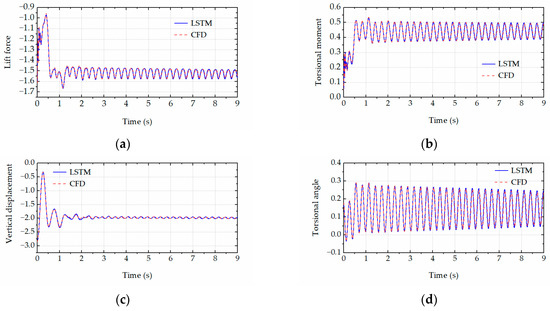
Figure 14.
The time history comparison between CFD simulations and LSTM predictions for U = 8.5 m/s and αd = 134°. (a) Lift force. (b) Torsional moment. (c) Vertical displacements. (d) Torsional angle.
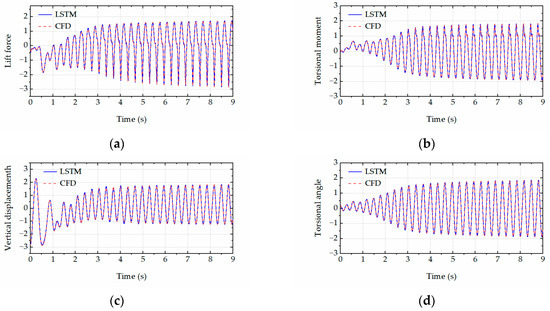
Figure 15.
The time history comparison between CFD simulations and LSTM predictions for U = 11.8 m/s and αd = 134°. (a) Lift force. (b) Torsional moment. (c) Vertical displacements. (d) Torsional angle.
5. Concluding Remarks
In this study, the computational fluid dynamics (CFD) simulations were first conducted to investigate the critical flutter wind speeds and post-flutter limit-cycle oscillations (LCOs) of the bridge decks with various leading-edge angles. Based on the obtained CFD data, a reduced-order model for the nonlinear, unsteady aeroelastic forces on the bridge decks was developed by training a deep long short-term memory (LSTM) network. At each time step, the LSTM-based nonlinear aeroelastic forces were used to calculate the bridge deck motion (displacements, velocities and accelerations) through the Newmark-β algorithm and were then fed into the LSTM network as the inputs of the next time step. A hybrid loss function involving the prediction errors of both aeroelastic forces simulated by the LSTM network and bridge deck responses calculated by the Newmark-β algorithm was designed to improve the training efficiency and stability. The LSTM-based predictions of the critical flutter wind speeds and post-flutter LCO amplitudes presented an excellent agreement with the CFD simulations. The ability of the LSTM model to efficiently predict the post-flutter responses of the bridge decks with various leading-edge angles can be effectively used to facilitate the aerodynamic optimization in wind-resistant bridge design. In future studies, more design variables that can comprehensively represent the geometry changes of bridge decks will be input into the LSTM network. The developed LSTM model can be readily extended to the three-dimensional full-bridge configurations.
Author Contributions
Conceptualization, T.W.; Methodology, X.A. and T.W.; Software, X.A.; Validation, X.A.; Formal analysis, X.A.; Writing—original draft, X.A.; Writing—review & editing, S.L. and T.W. All authors have read and agreed to the published version of the manuscript.
Funding
This work was supported by the Innovation-Driven Project of Central South University (No. 2020CX009) and the Institute of Bridge Engineering at University at Buffalo.
Institutional Review Board Statement
Not applicable.
Informed Consent Statement
Not applicable.
Data Availability Statement
All data are available from the corresponding author by request.
Conflicts of Interest
The authors declare no conflict of interest.
References
- Scanlan, R.H.; Tomko, J.J. Airfoil and Bridge Deck Flutter Derivatives. J. Eng. Mech. Div. 1971, 97, 1717–1737. [Google Scholar] [CrossRef]
- Scanlan, R.H.; Lin, W.-H. Effects of Turbulence on Bridge Flutter Derivatives. J. Eng. Mech. Div. 1978, 104, 719–733. [Google Scholar] [CrossRef]
- Sarkar, P.P.; Jones, N.P.; Scanlan, R.H. Identification of Aeroelastic Parameters of Flexible Bridges. J. Eng. Mech. 1994, 120, 1718–1742. [Google Scholar] [CrossRef]
- Scanlan, R.H. Amplitude and Turbulence Effects on Bridge Flutter Derivatives. J. Struct. Eng. 1997, 123, 232–236. [Google Scholar] [CrossRef]
- Xu, F.; Zhu, L.; Ge, X.; Zhang, Z. Some New Insights into the Identification of Bridge Deck Flutter Derivatives. Eng. Struct. 2014, 75, 418–428. [Google Scholar] [CrossRef]
- Zhu, Z.; Gu, M. Identification of Flutter Derivatives of Bridge Decks Using CFD-Based Discrete-Time Aerodynamic Models. Wind. Struct. 2014, 18, 215–233. [Google Scholar] [CrossRef]
- Wu, T.; Kareem, A. Aerodynamics and Aeroelasticity of Cable-Supported Bridges: Identification of Nonlinear Features. J. Eng. Mech. 2013, 139, 1886–1893. [Google Scholar] [CrossRef]
- Wu, T.; Kareem, A.; Li, S. On the Excitation Mechanisms of Rain–Wind Induced Vibration of Cables: Unsteady and Hysteretic Nonlinear Features. J. Wind. Eng. Ind. Aerodyn. 2013, 122, 83–95. [Google Scholar] [CrossRef]
- Xu, F.Y.; Chen, A.R. Flutter Test and Analysis for the Suramadu Bridge in Indonesia. China Civ. Eng. J. 2009, 42, 35–40. [Google Scholar] [CrossRef]
- Zhu, L.; Gao, G. Influential Factors of Soft Flutter Phenomenon for Typical Bridge Deck Sections. Biol. Sci. 2015, 43, 1289–1294+1382. [Google Scholar] [CrossRef]
- Xu, F.; Wu, T.; Ying, X.; Kareem, A. Higher-Order Self-Excited Drag Forces on Bridge Decks. J. Eng. Mech. 2016, 142, 06015007. [Google Scholar] [CrossRef]
- Ying, X.; Xu, F.; Zhang, M.; Zhang, Z. Numerical Explorations of the Limit Cycle Flutter Characteristics of a Bridge Deck. J. Wind. Eng. Ind. Aerodyn. 2017, 169, 30–38. [Google Scholar] [CrossRef]
- Náprstek, J.; Pospíšil, S.; Hračov, S. Analytical and Experimental Modelling of Non-Linear Aeroelastic Effects on Prismatic Bodies. J. Wind. Eng. Ind. Aerodyn. 2007, 95, 1315–1328. [Google Scholar] [CrossRef]
- Wu, T.; Kareem, A. Simulation of Nonlinear Bridge Aerodynamics: A Sparse Third-Order Volterra Model. J. Sound Vib. 2014, 333, 178–188. [Google Scholar] [CrossRef]
- Wu, T.; Kareem, A. A Nonlinear Analysis Framework for Bluff-Body Aerodynamics: A Volterra Representation of the Solution of Navier-Stokes Equations. J. Fluids Struct. 2015, 54, 479–502. [Google Scholar] [CrossRef]
- Gao, G.; Zhu, L.; Han, W.; Li, J. Nonlinear Post-Flutter Behavior and Self-Excited Force Model of a Twin-Side-Girder Bridge Deck. J. Wind. Eng. Ind. Aerodyn. 2018, 177, 227–241. [Google Scholar] [CrossRef]
- Zhang, M.; Xu, F.; Zhang, Z.; Ying, X. Energy Budget Analysis and Engineering Modeling of Post-Flutter Limit Cycle Oscillation of a Bridge Deck. J. Wind. Eng. Ind. Aerodyn. 2019, 188, 410–420. [Google Scholar] [CrossRef]
- Zhang, M.; Wu, T.; Xu, F. Vortex-Induced Vibration of Bridge Decks: Describing Function-based Model. J. Wind. Eng. Ind. Aerodyn. 2019, 195, 104016. [Google Scholar] [CrossRef]
- Wu, T.; Snaiki, R. Applications of Machine Learning to Wind Engineering. Front. Built Environ. 2022, 8, 811460. [Google Scholar] [CrossRef]
- Glorot, X.; Bengio, Y. Understanding the Difficulty of Training Deep Feedforward Neural Networks. In Proceedings of the Thirteenth International Conference on Artificial Intelligence and Statistics, JMLR Workshop and Conference Proceedings, Sardinia, Italy, 31 March 2010; pp. 249–256. [Google Scholar]
- Graves, A. Generating Sequences with Recurrent Neural Networks. arXiv 2013, arXiv:1308.0850. [Google Scholar] [CrossRef]
- Wei, S.; Jin, X.; Li, H. General Solutions for Nonlinear Differential Equations: A Rule-Based Self-Learning Approach Using Deep Reinforcement Learning. Comput. Mech. 2019, 64, 1361–1374. [Google Scholar] [CrossRef]
- Wu, T.; Kareem, A. Modeling Hysteretic Nonlinear Behavior of Bridge Aerodynamics via Cellular Automata Nested Neural Network. J. Wind. Eng. Ind. Aerodyn. 2011, 99, 378–388. [Google Scholar] [CrossRef]
- Bengio, Y.; Simard, P.; Frasconi, P. Learning Long-Term Dependencies with Gradient Descent Is Difficult. IEEE Trans. Neural Netw. 1994, 5, 157–166. [Google Scholar] [CrossRef] [PubMed]
- Gers, F.A.; Schmidhuber, J.; Cummins, F. Continual Prediction Using LSTM with Forget Gates. In Perspectives in Neural Computing, Proceedings of the Neural Nets WIRN Vietri-99, Salerno, Italy, 20–22 May 1999; Marinaro, M., Tagliaferri, R., Eds.; Springer: London, UK, 1999; pp. 133–138. [Google Scholar]
- Mannarino, A.; Mantegazza, P. Nonlinear Aeroelastic Reduced Order Modeling by Recurrent Neural Networks. J. Fluids Struct. 2014, 48, 103–121. [Google Scholar] [CrossRef]
- Wang, R.; Kalnay, E.; Balachandran, B. Neural Machine-Based Forecasting of Chaotic Dynamics. Nonlinear Dyn. 2019, 98, 2903–2917. [Google Scholar] [CrossRef]
- Zhang, W.; Wang, B.; Ye, Z.; Quan, J. Efficient Method for Limit Cycle Flutter Analysis Based on Nonlinear Aerodynamic Reduced-Order Models. AIAA J. 2012, 50, 1019–1028. [Google Scholar] [CrossRef]
- Li, K.; Kou, J.; Zhang, W. Deep Neural Network for Unsteady Aerodynamic and Aeroelastic Modeling across Multiple Mach Numbers. Nonlinear Dyn. 2019, 96, 2157–2177. [Google Scholar] [CrossRef]
- Li, T.; Wu, T.; Liu, Z. Nonlinear Unsteady Bridge Aerodynamics: Reduced-Order Modeling Based on Deep LSTM Networks. J. Wind. Eng. Ind. Aerodyn. 2020, 198, 104116. [Google Scholar] [CrossRef]
- Li, T.; Wu, T. Modeling Nonlinear Flutter Behavior of Long-Span Bridges using Knowledge-Enhanced Long Short-Term Memory Network. Comput. Aided Civ. Infrastruct. Eng. 2023, 1–16. [Google Scholar] [CrossRef]
- Li, W.; Laima, S.; Jin, X.; Yuan, W.; Li, H. A Novel Long Short-Term Memory Neural-Network-Based Self-Excited Force Model of Limit Cycle Oscillations of Nonlinear Flutter for Various Aerodynamic Configurations. Nonlinear Dyn. 2020, 100, 2071–2087. [Google Scholar] [CrossRef]
- Wang, H.; Wu, T. Knowledge-Enhanced Deep Learning for Wind-Induced Nonlinear Structural Dynamic Analysis. J. Struct. Eng. 2020, 146, 04020235. [Google Scholar] [CrossRef]
Disclaimer/Publisher’s Note: The statements, opinions and data contained in all publications are solely those of the individual author(s) and contributor(s) and not of MDPI and/or the editor(s). MDPI and/or the editor(s) disclaim responsibility for any injury to people or property resulting from any ideas, methods, instructions or products referred to in the content. |
© 2023 by the authors. Licensee MDPI, Basel, Switzerland. This article is an open access article distributed under the terms and conditions of the Creative Commons Attribution (CC BY) license (https://creativecommons.org/licenses/by/4.0/).

