
Comparison of Different-Energy-Level Abrasion in Los Angeles and Micro-Deval Apparatuses Using Mass Loss and Rounding of Sediment Particles

Abstract
:1. Introduction
2. Materials and Methods
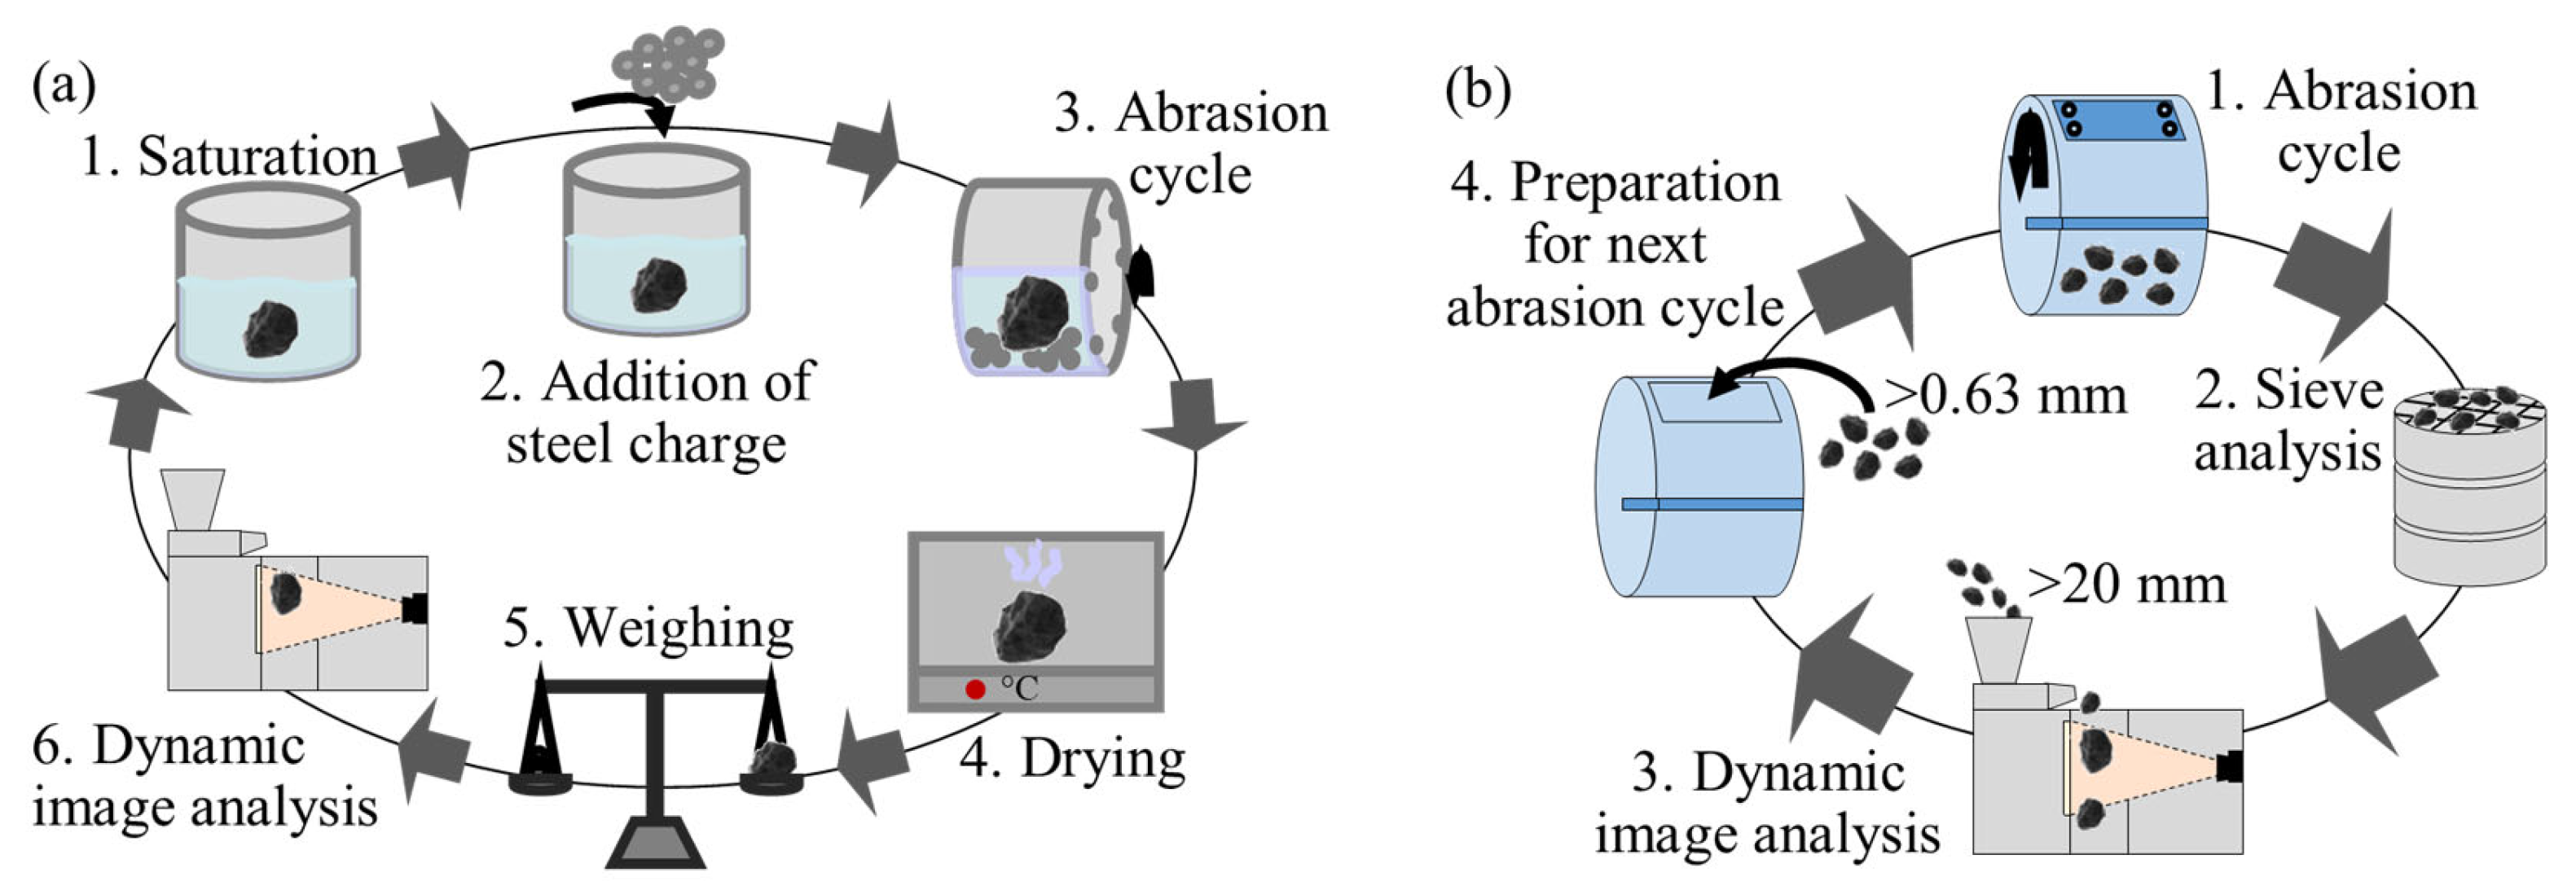
2.1. Abrasion in Micro-Deval Apparatus
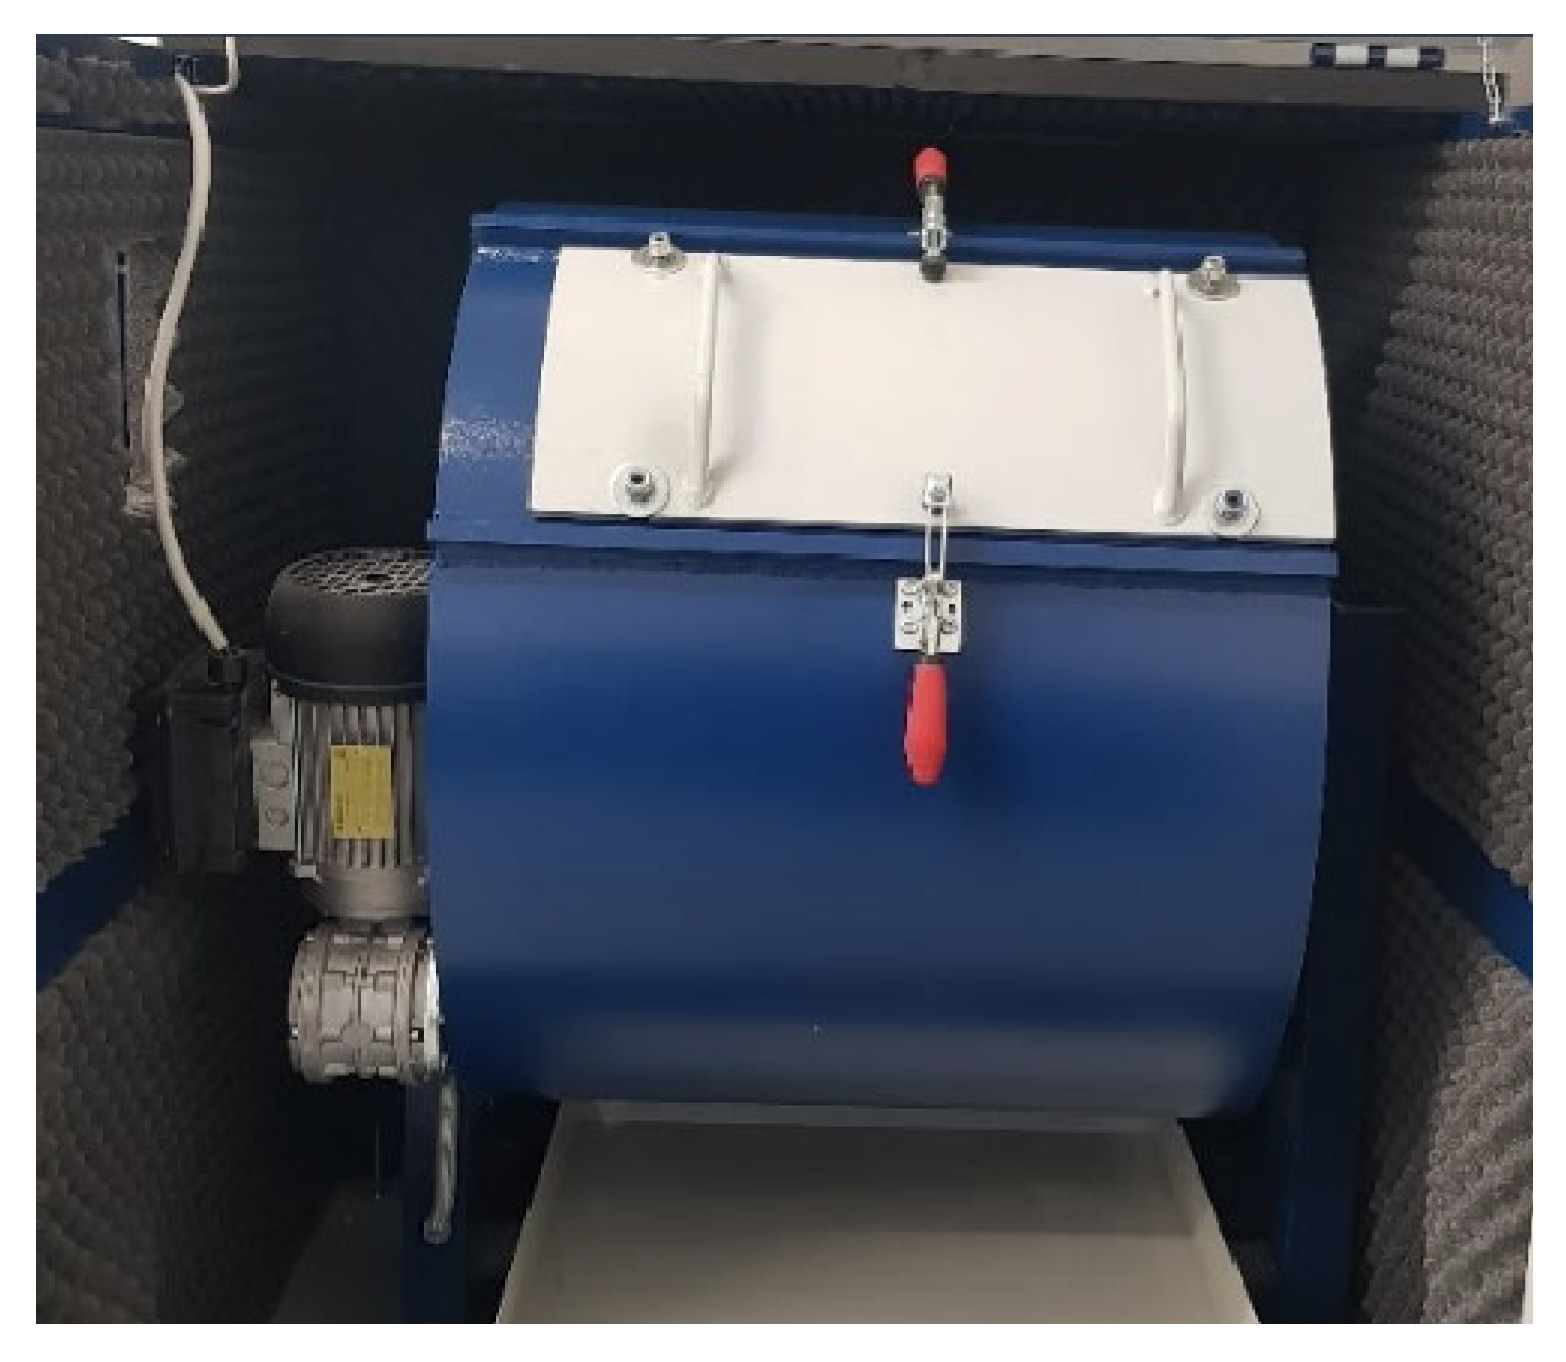
2.2. Abrasion in Los Angeles Machine
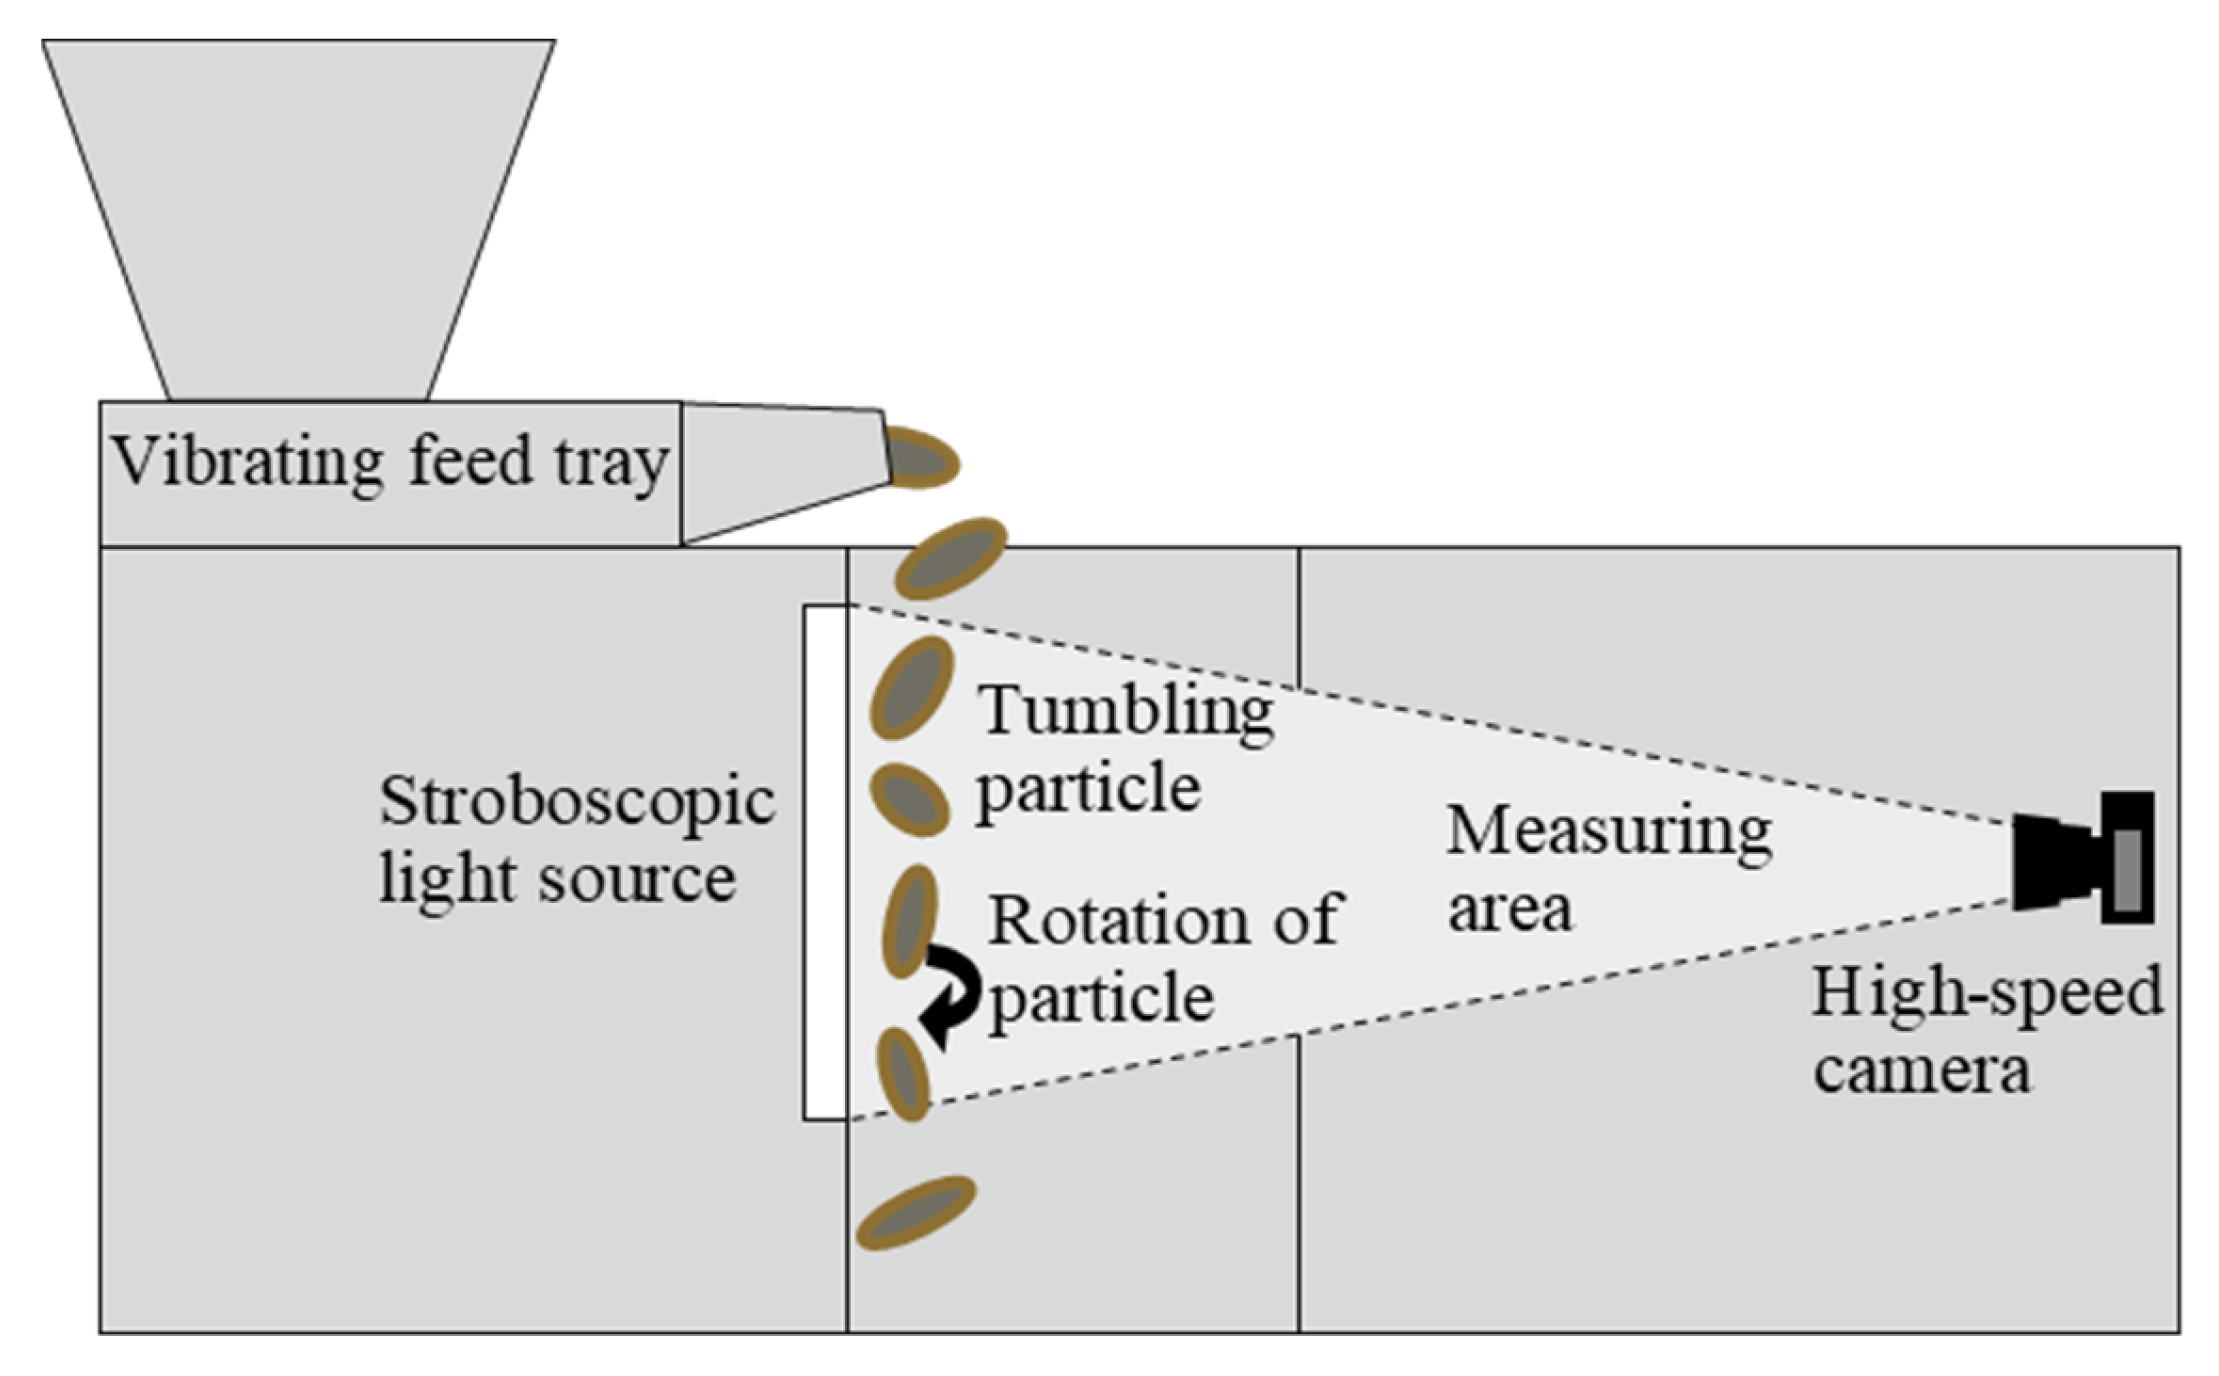
2.3. Dynamic Image Analysis
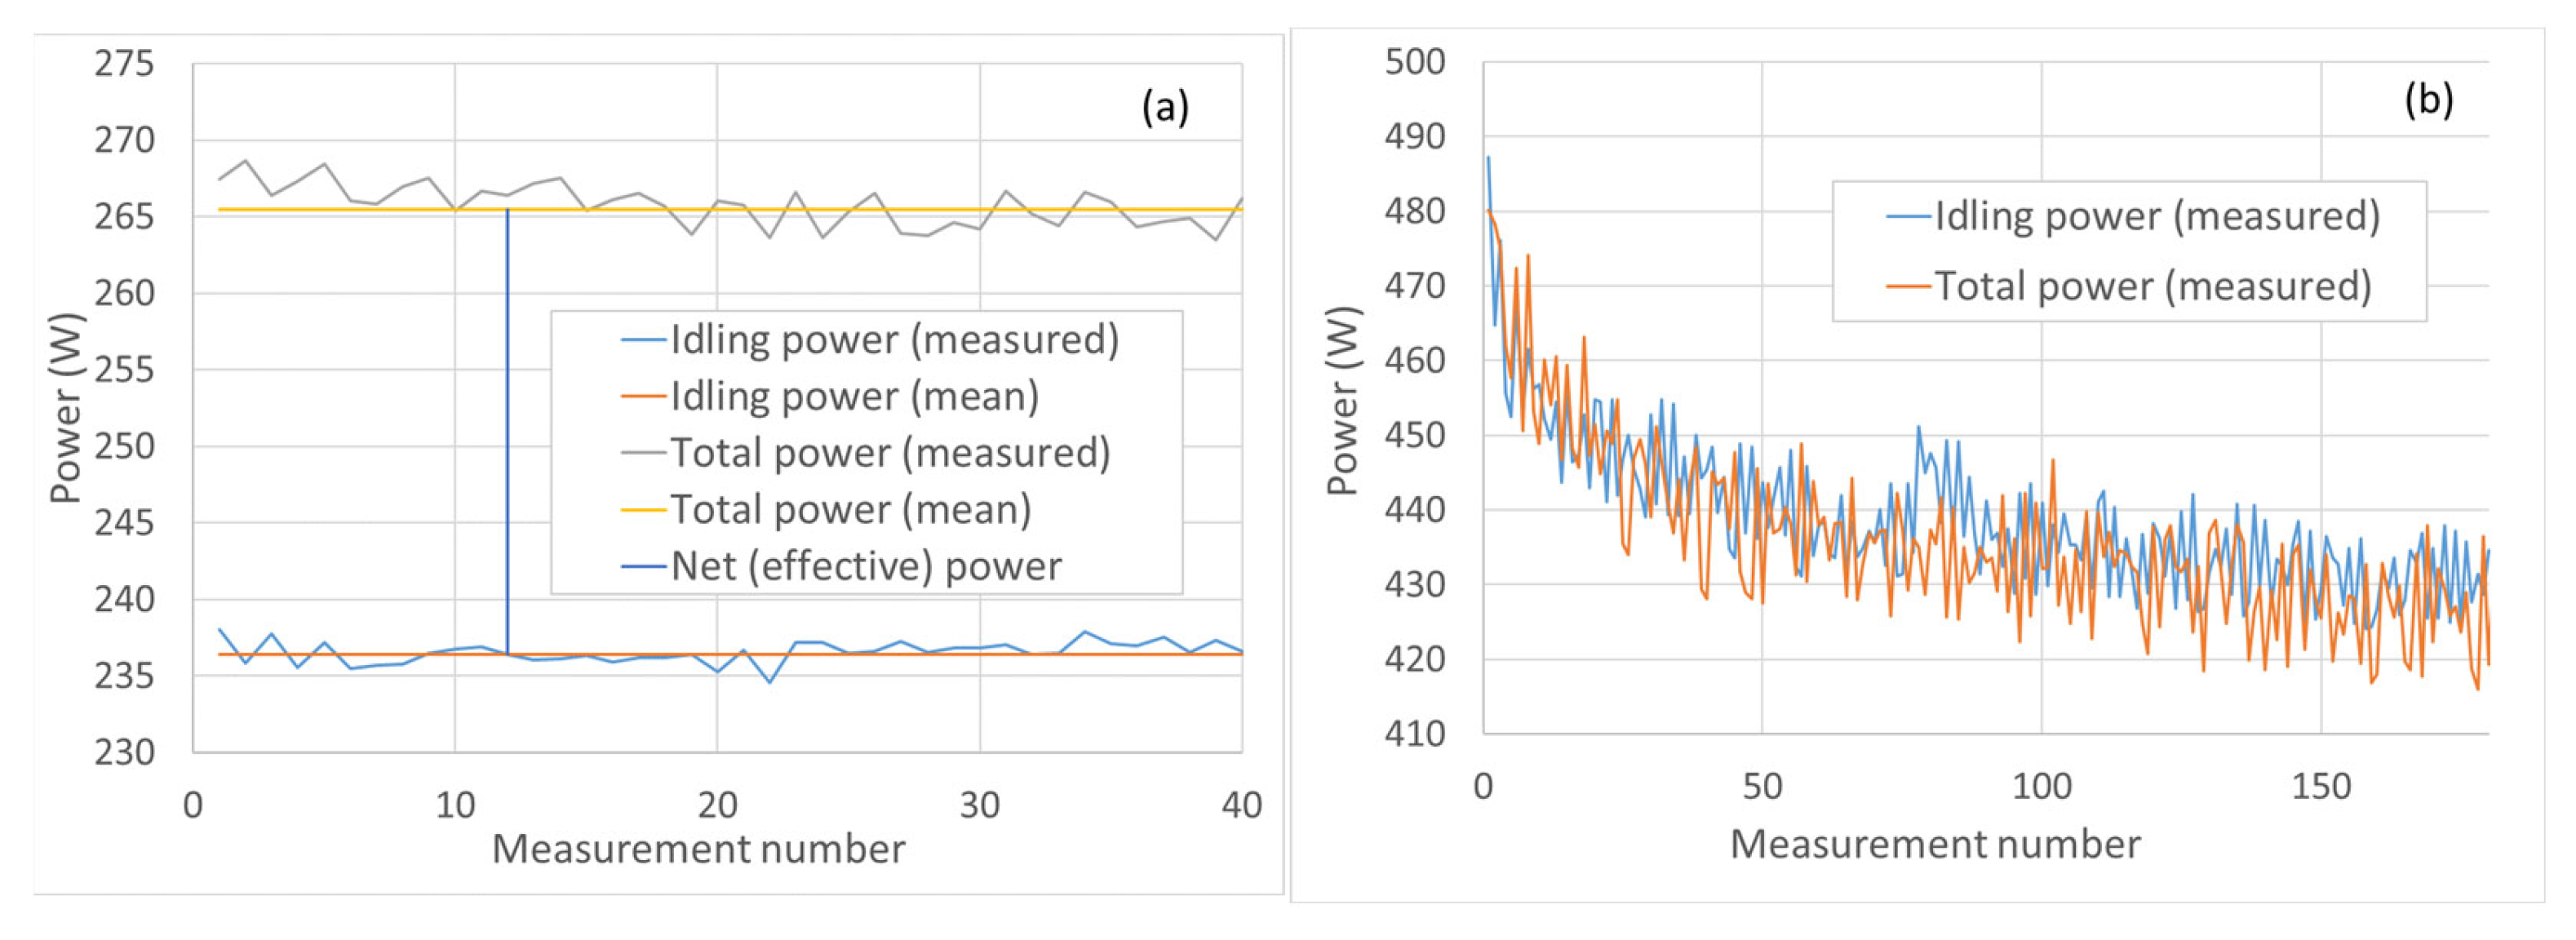
2.4. Abrasion Energy Input (Mechanical Work) and Power Estimation
3. Results and Discussion
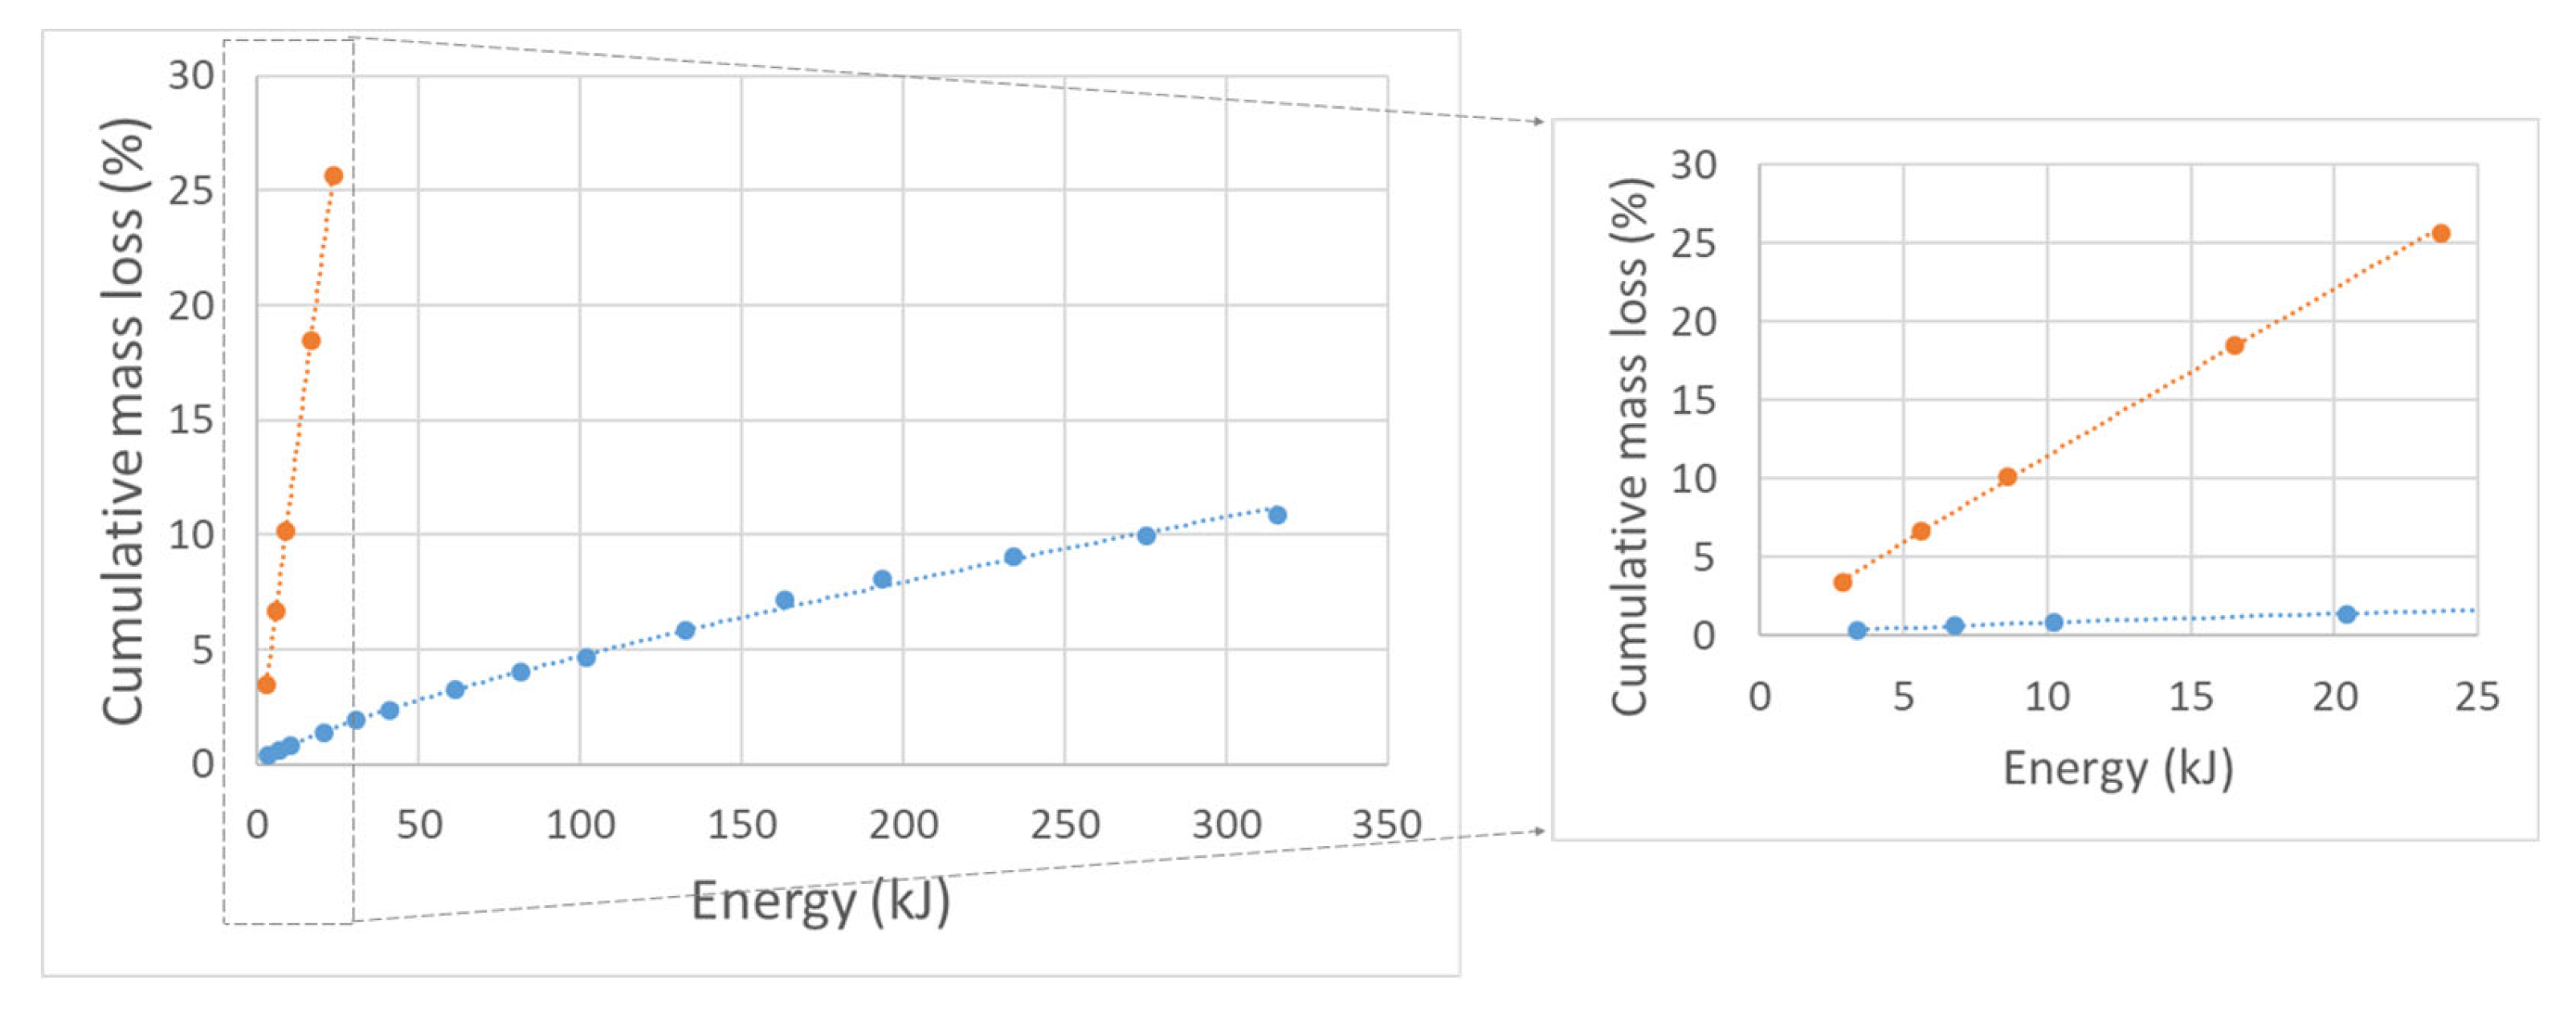
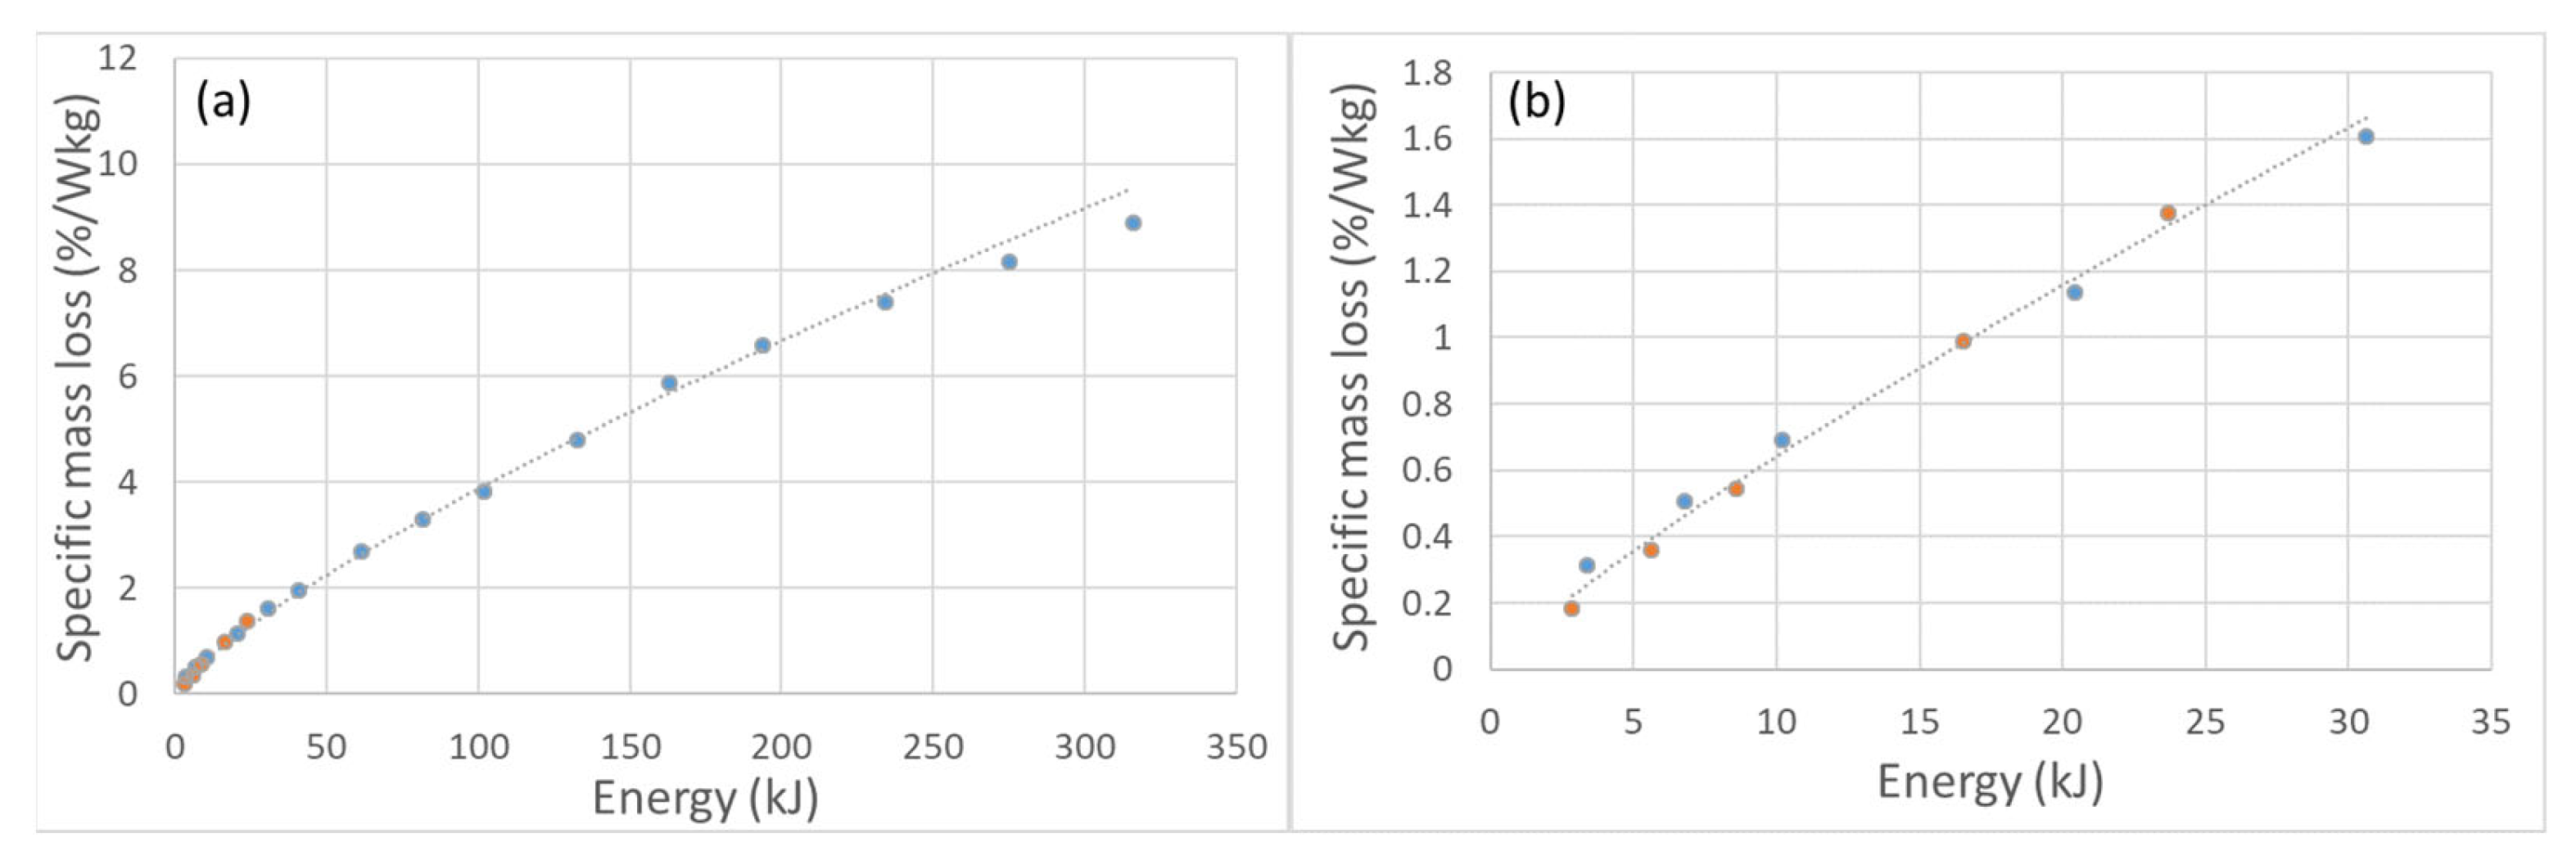
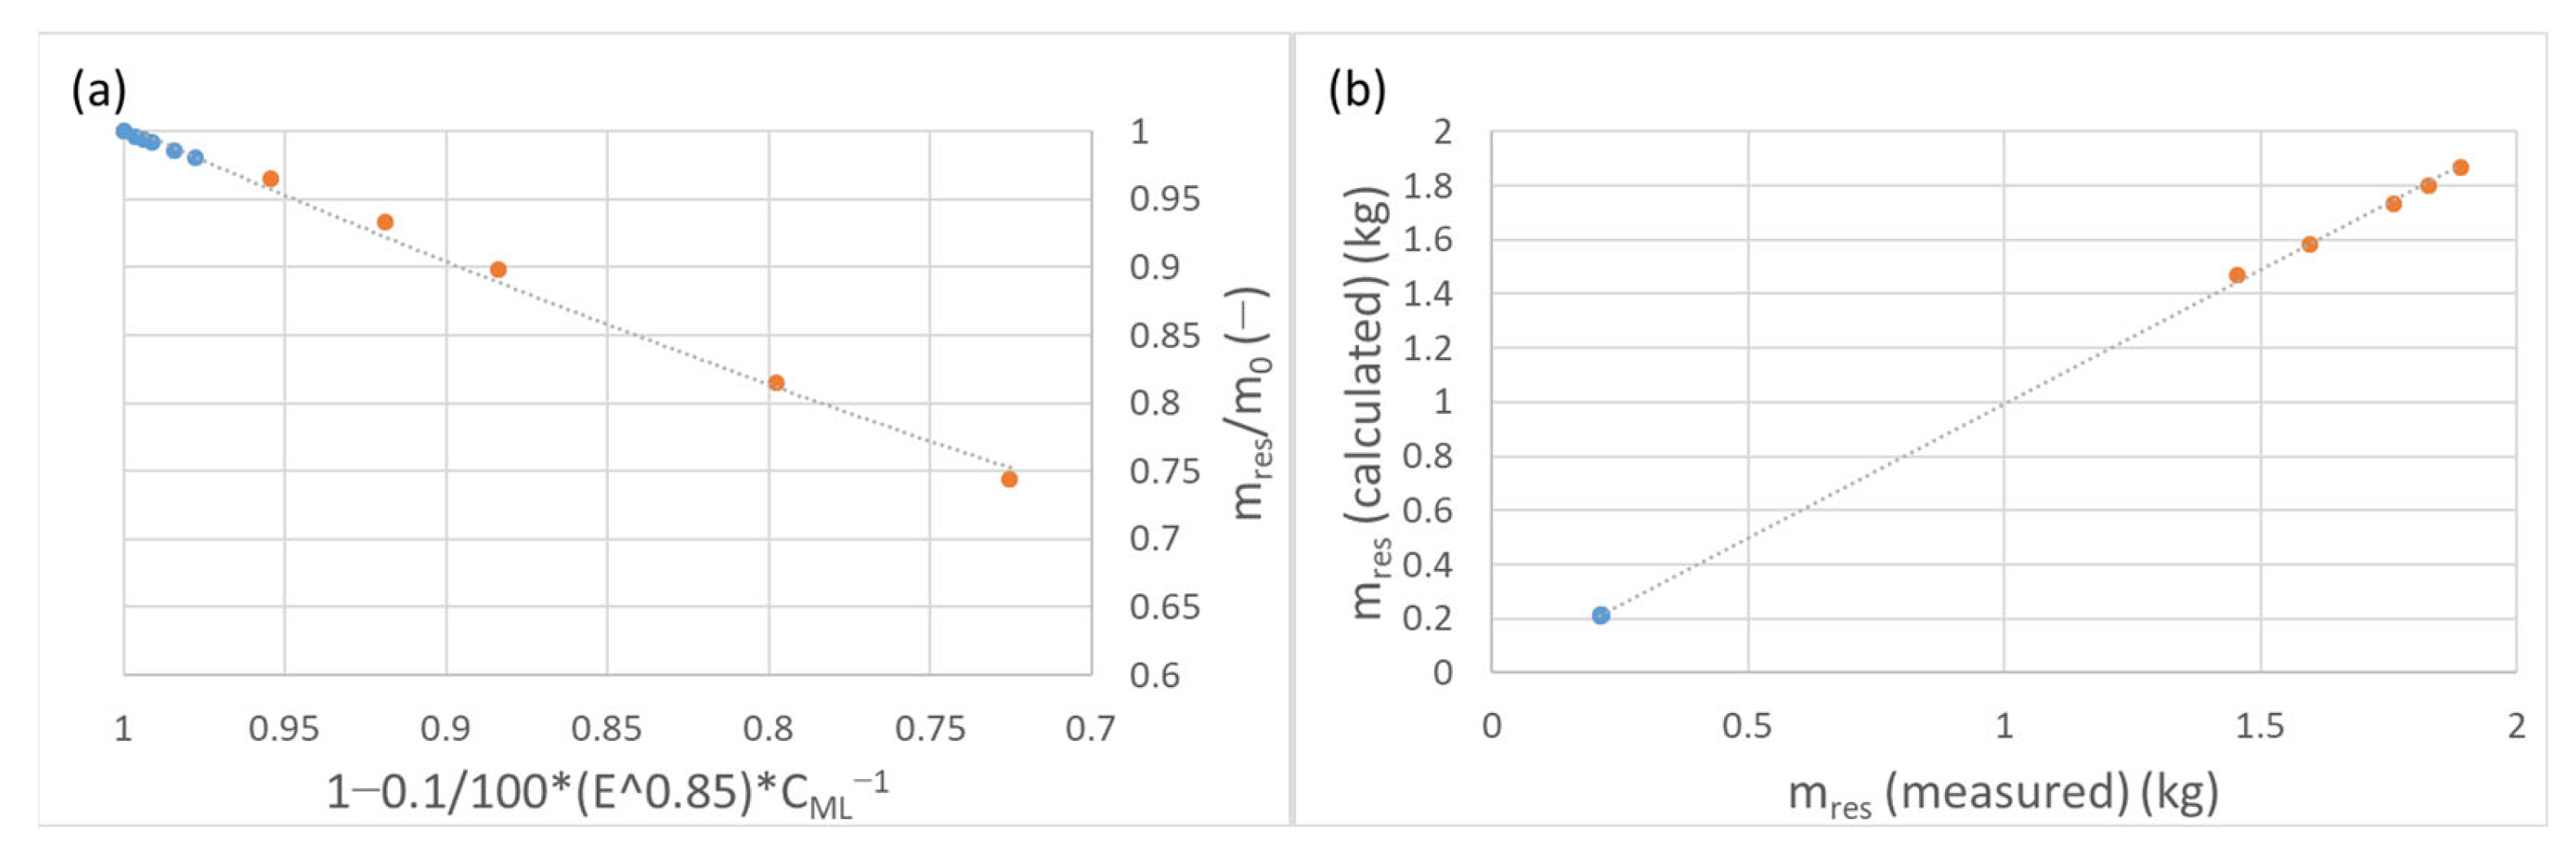
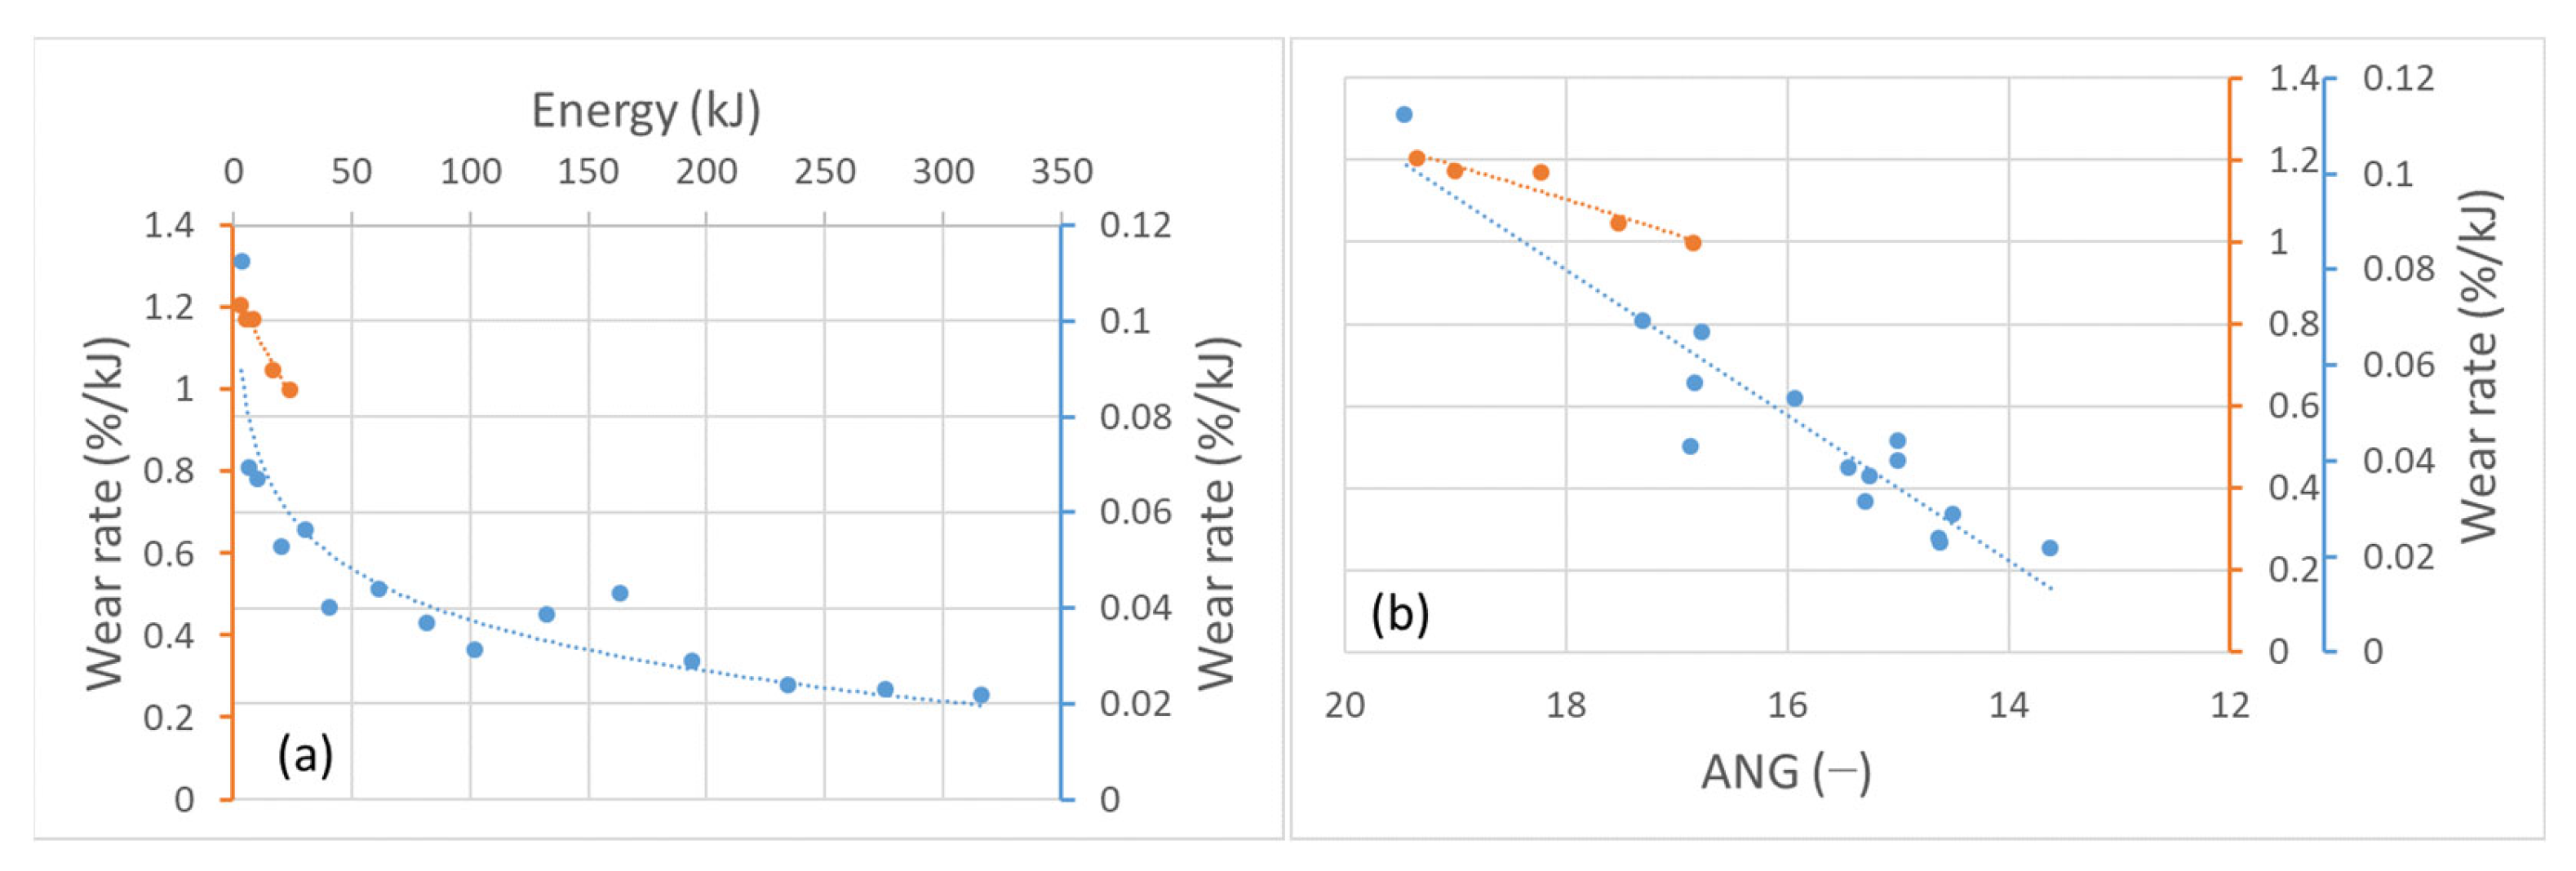
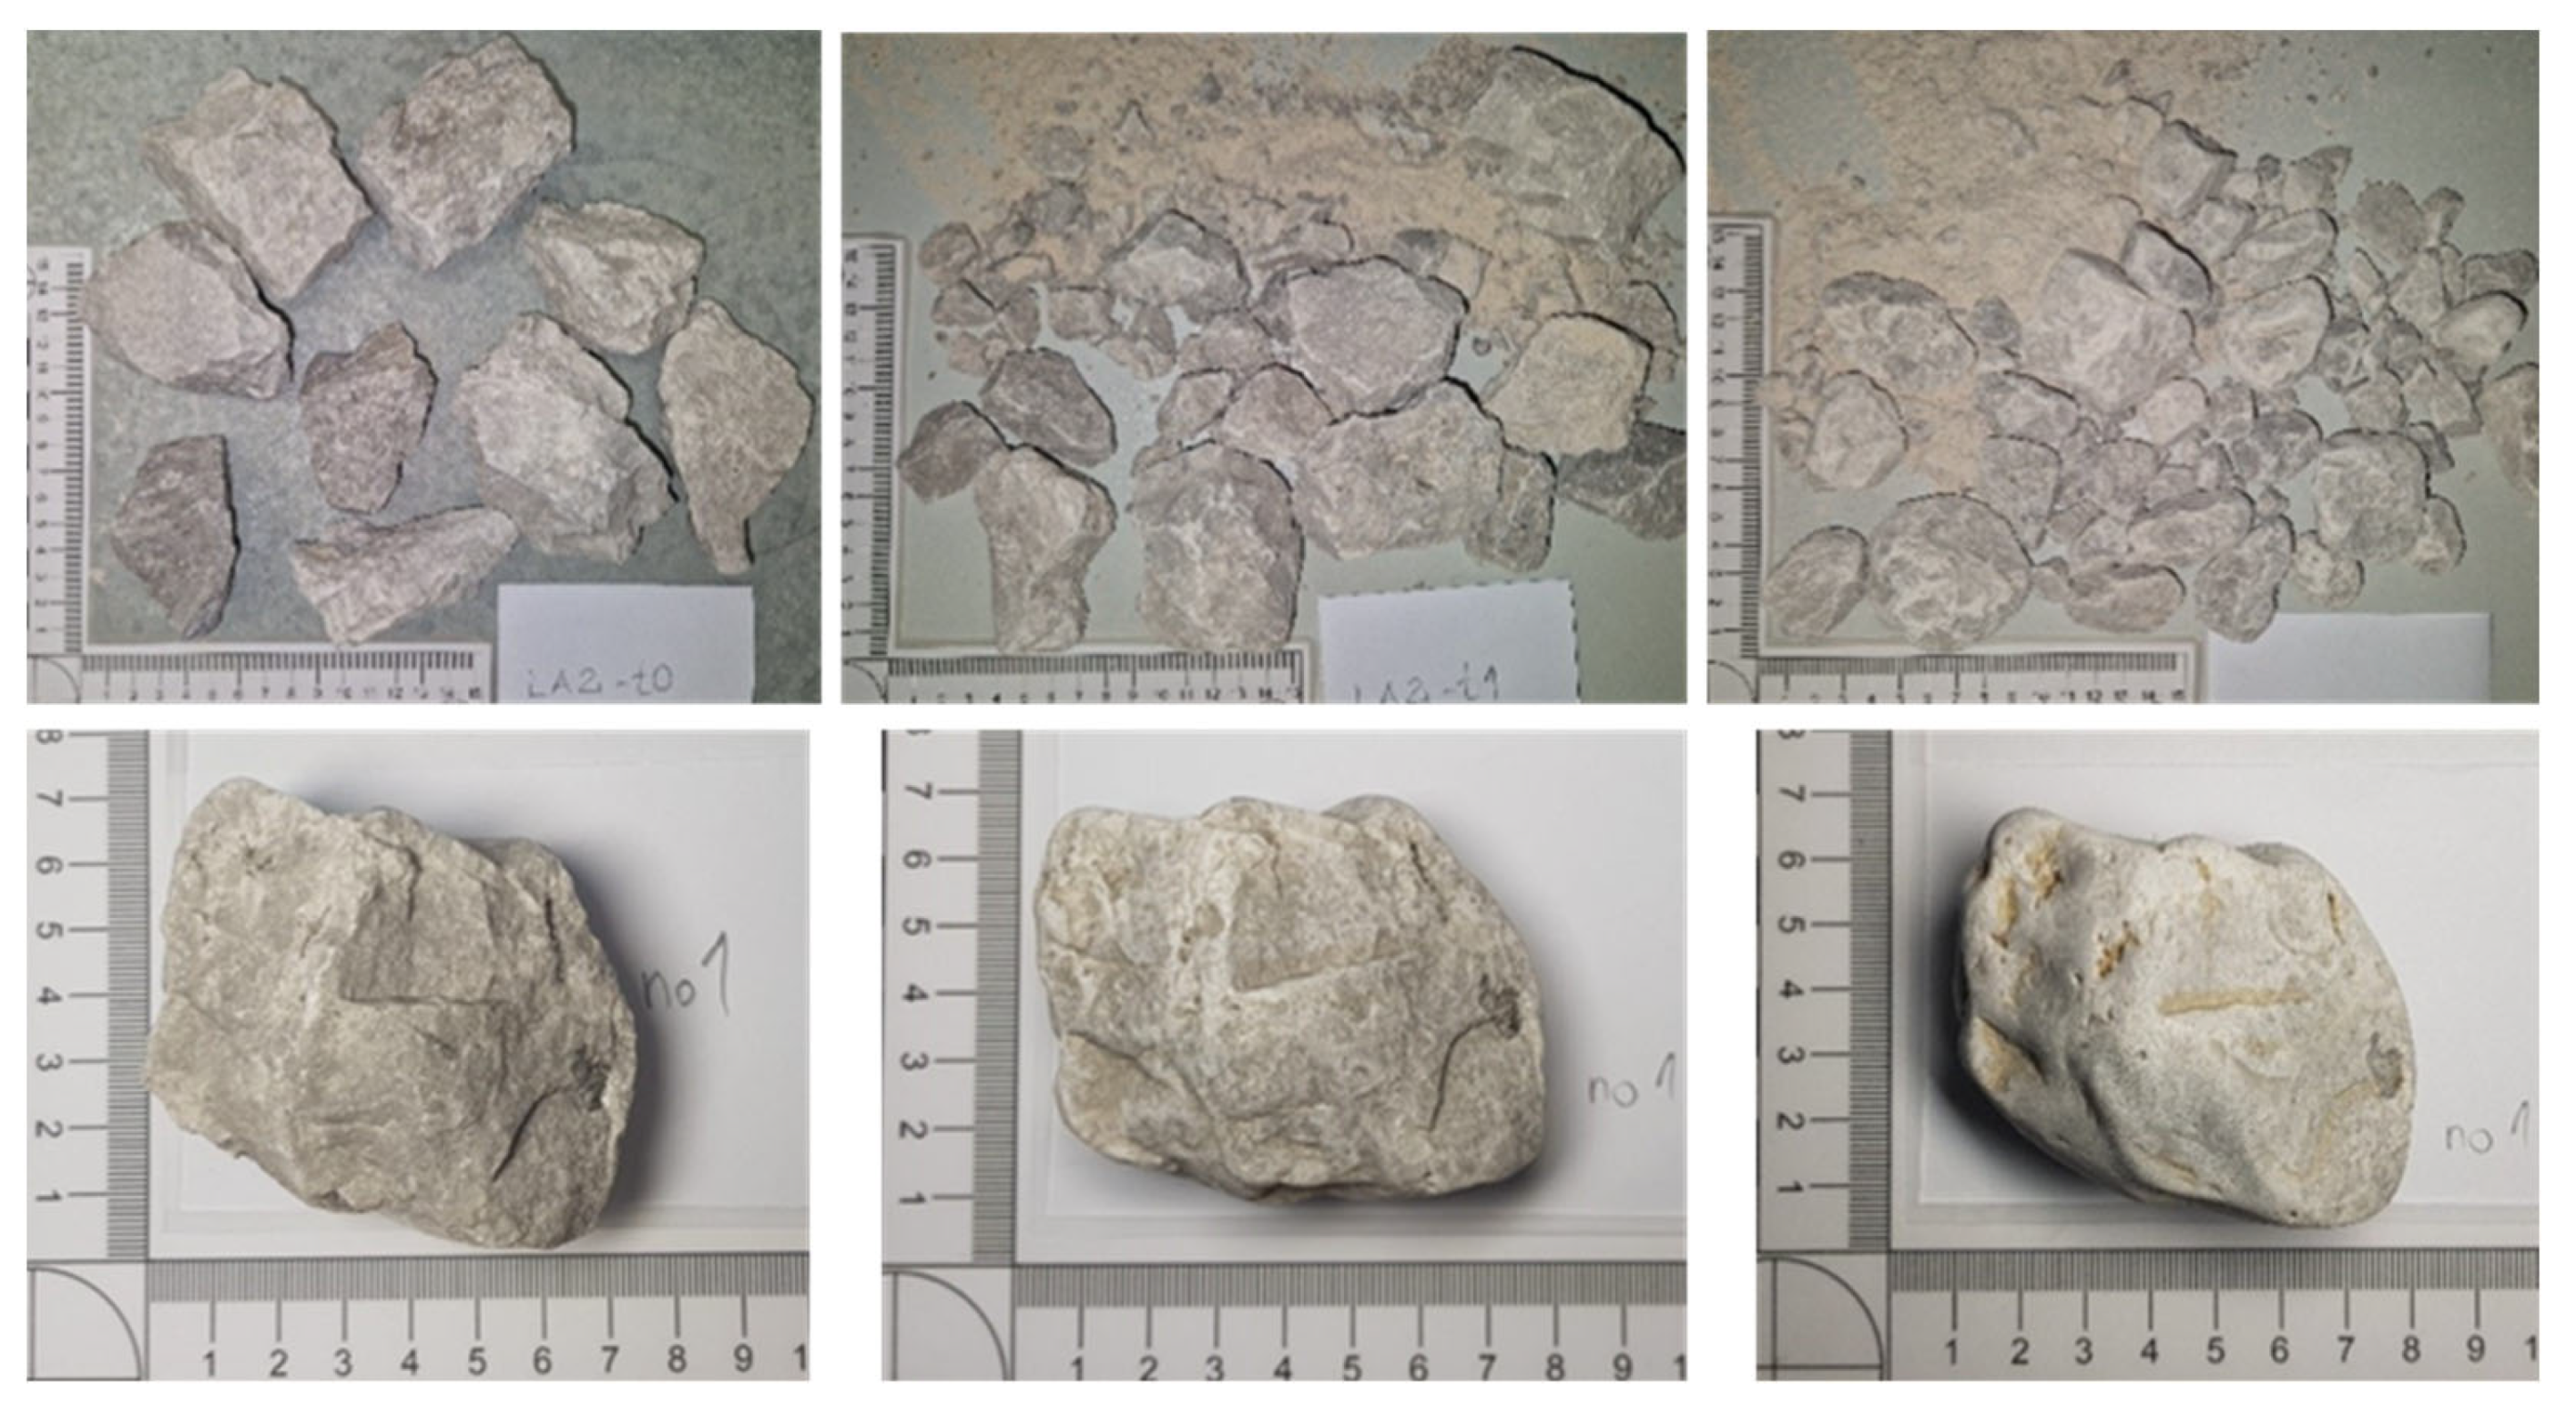
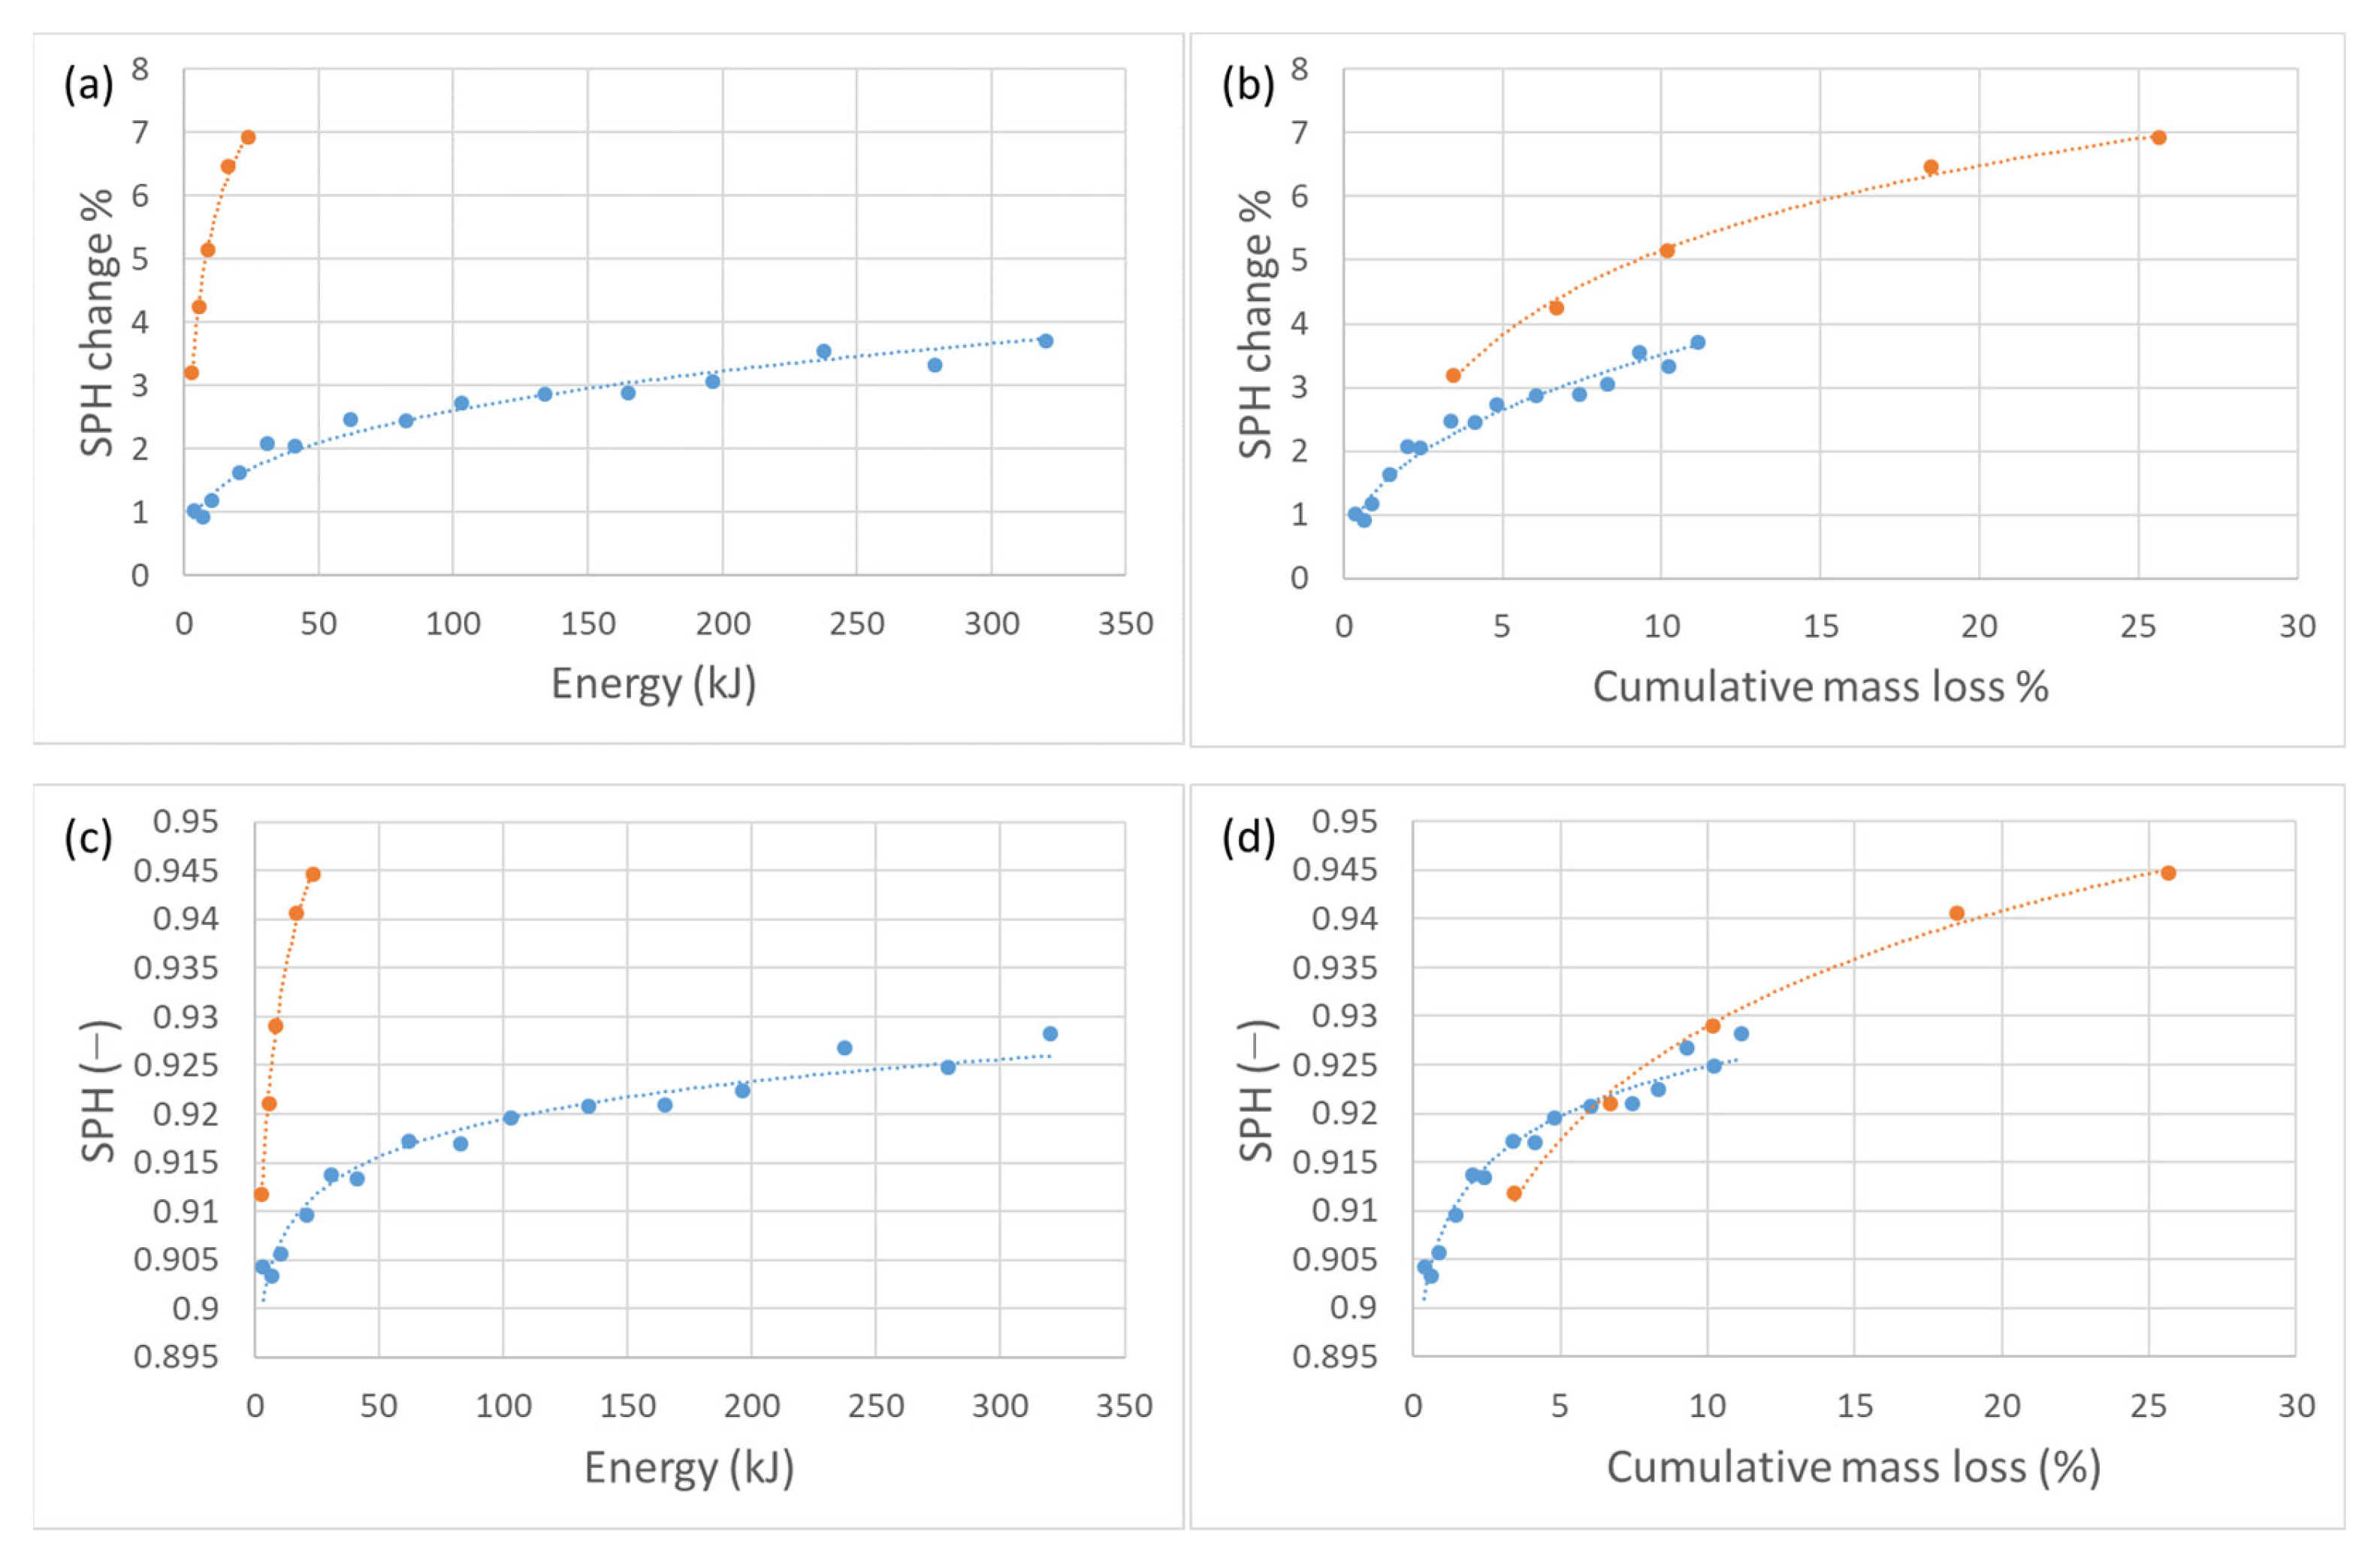
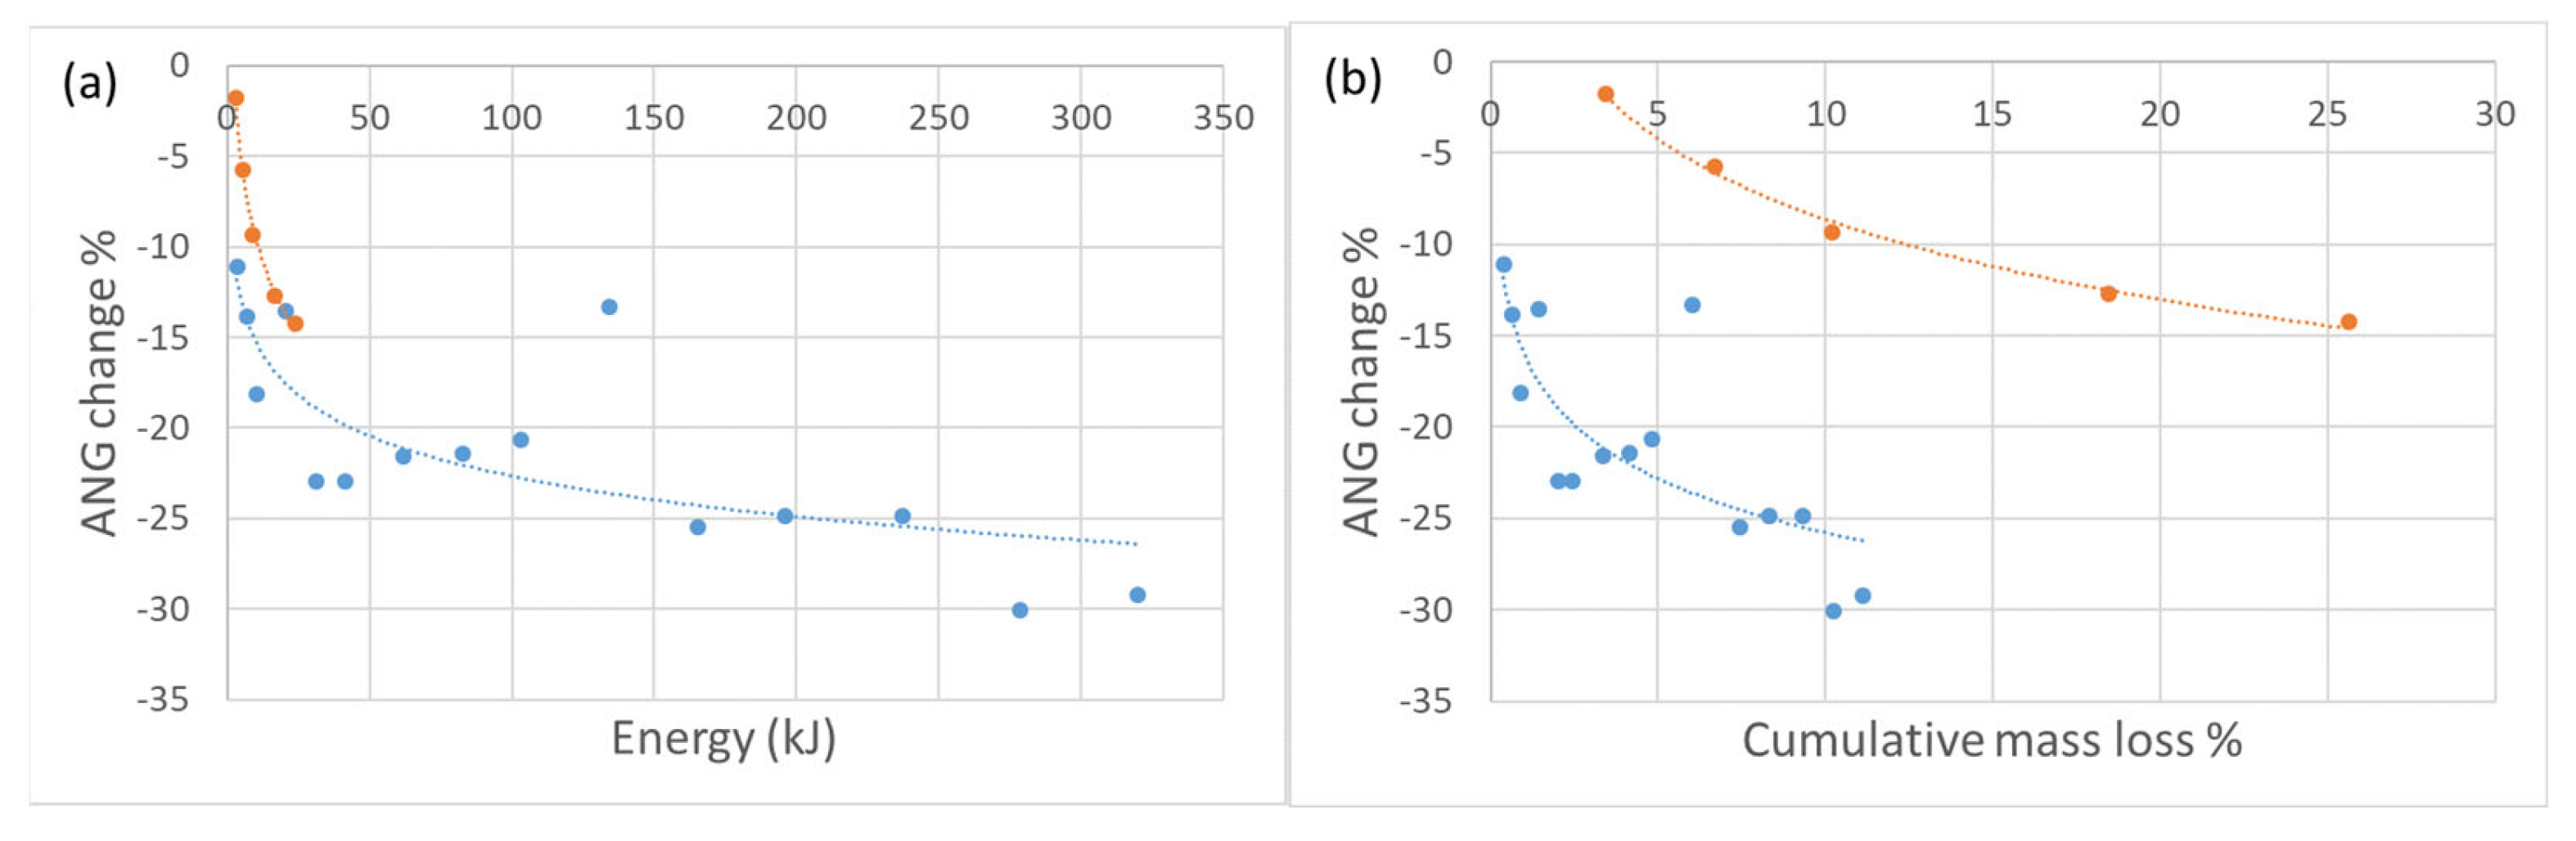
3.1. Mass
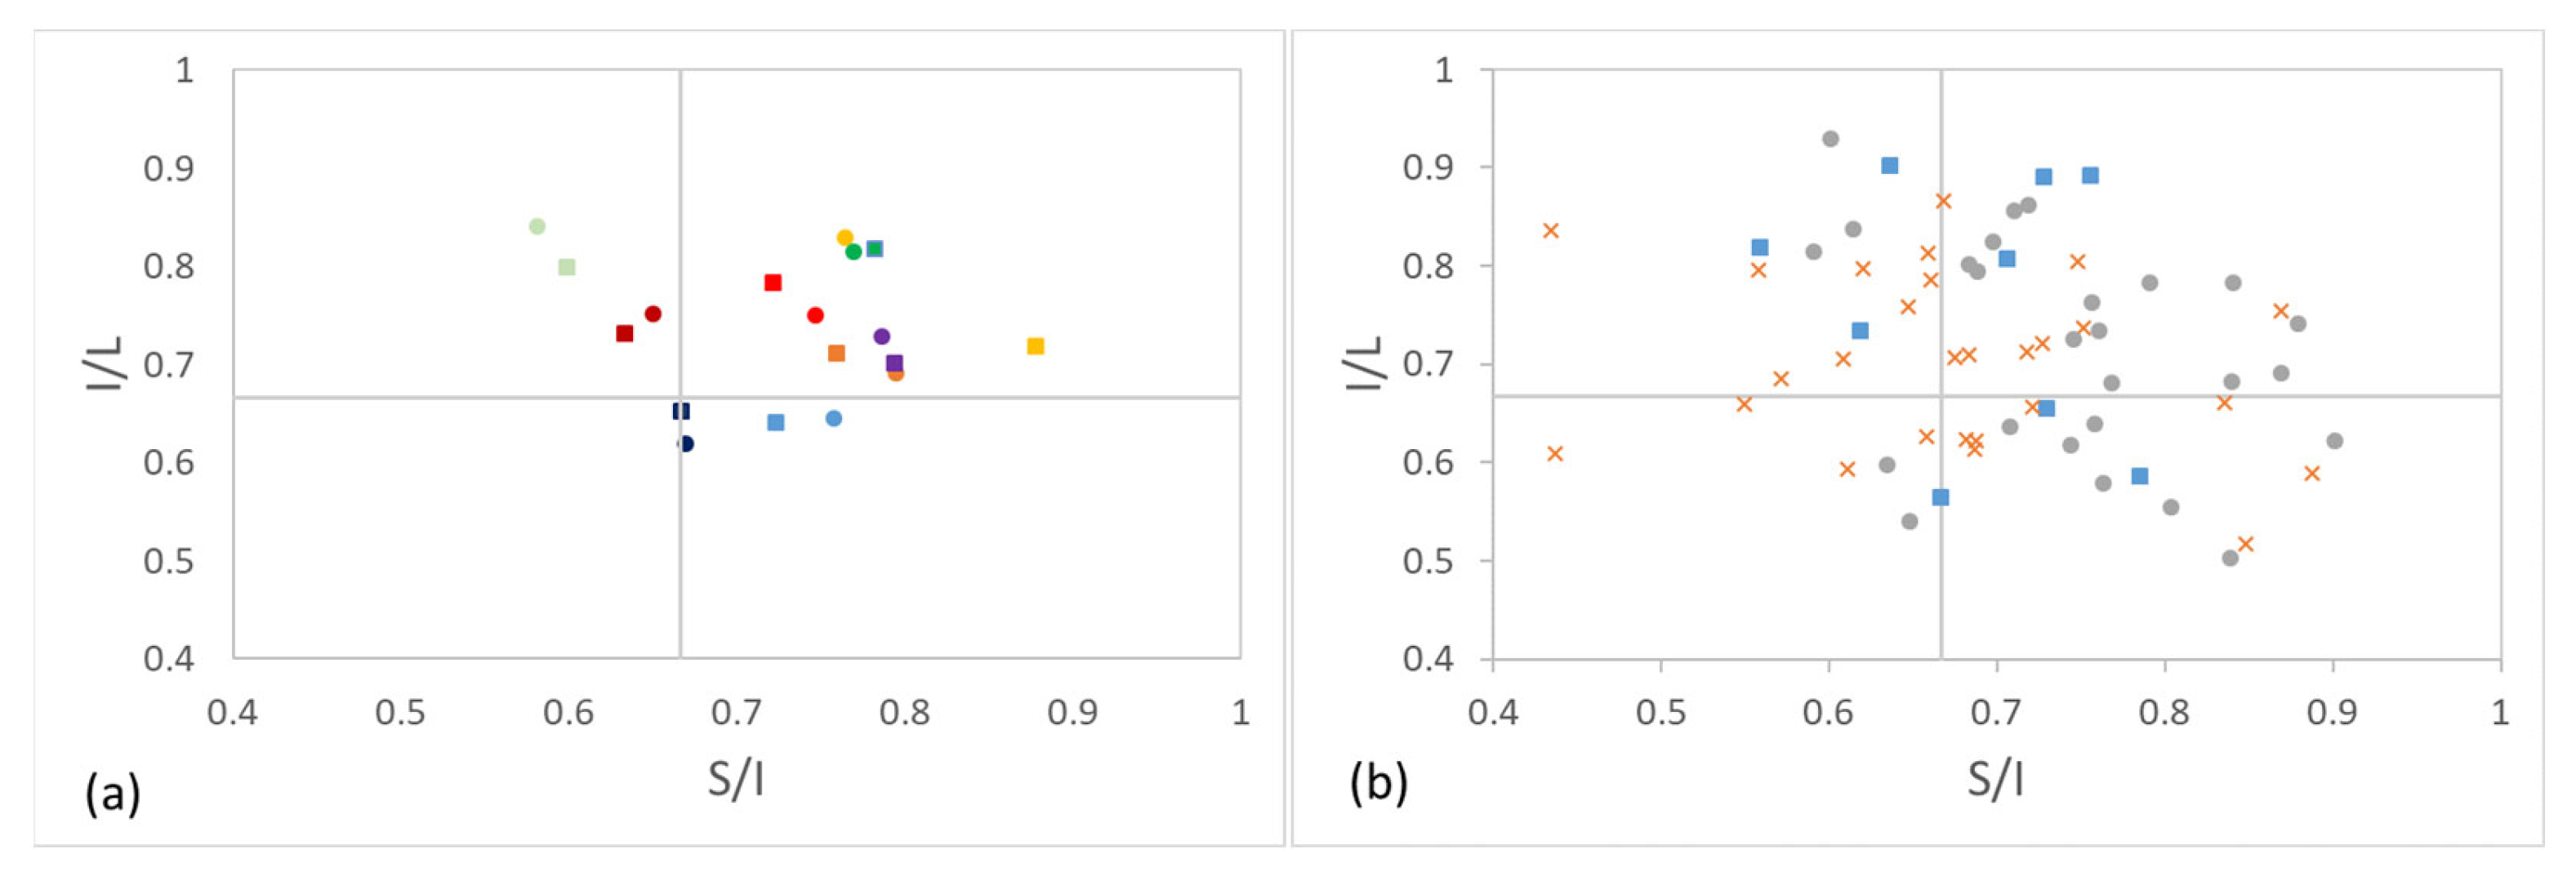
3.2. Morphology
4. Conclusions
Author Contributions
Funding
Institutional Review Board Statement
Informed Consent Statement
Data Availability Statement
Conflicts of Interest
References
- Blott, S.J.; Pye, K. Particle Shape: A Review and New Methods of Characterization and Classification. Sedimentology 2008, 55, 31–63. [Google Scholar] [CrossRef]
- Cassel, M.; Piégay, H.; Lavé, J.; Vaudor, L.; Hadmoko Sri, D.; Wibiwo Budi, S.; Lavigne, F. Evaluating a 2D Image-Based Computerized Approach for Measuring Riverine Pebble Roundness. Geomorphology 2018, 311, 143–157. [Google Scholar] [CrossRef]
- Wang, L.; Sun, W.; Tutumluer, E.; Druta, C. Evaluation of Aggregate Imaging Techniques for Quantification of Morphological Characteristics. Transp. Res. Rec. 2013, 2335, 39–49. [Google Scholar] [CrossRef]
- Wang, L.; Yao, Y.; Li, J.; Tao, Y.; Liu, K. Review of Visualization Technique and Its Application of Road Aggregates Based on Morphological Features. Appl. Sci. 2022, 12, 571. [Google Scholar] [CrossRef]
- Zingg, T. Beitrag Zur Schotteranalyse. Doctoral Dissertation; ETH Zurich: Zürich, Switzerland, 1935; pp. 39–140. [Google Scholar]
- Sneed, E.D.; Folk, R.L. Pebbles in the Lower Colorado River, Texas a Study in Particle Morphogenesis. J. Geol. 1958, 66, 114–150. [Google Scholar] [CrossRef]
- Krumbein, W.; Sloss, L. Stratigraphy and Sedimentation; W.H.Freeman and Co.: San Francisco, CA, USA, 1963. [Google Scholar]
- Sternberg, H. Untersuchungen Uber Langen-und Querprofil Geschiebefuhrender Flusse. Z. Bauwes 1875, 25, 486–506. [Google Scholar]
- Brachaniec, T. Relationship between the Abrasion of Tektite Clasts and Their Host Sedimentary Facies, Pleistocene, Sw Poland. Ann. Soc. Geol. Pol. 2019, 89, 83–90. [Google Scholar] [CrossRef]
- Mikoš, M.; Jaeggi, M.N.R. Experiments on Motion of Sediment Mixtures in a Tumbling Mill to Study Fluvial Abrasion. J. Hydraul. Res. 1995, 33, 751–772. [Google Scholar] [CrossRef]
- Lewin, J.; Brewer, P.A. Laboratory Simulation of Clast Abrasion. Earth Surf. Process. Landf. 2002, 27, 145–164. [Google Scholar] [CrossRef]
- Novák-Szabó, T.; Sipos, A.Á.; Shaw, S.; Bertoni, D.; Pozzebon, A.; Grottoli, E.; Sarti, G.; Ciavola, P.; Domokos, G.; Jerolmack, D.J. Universal Characteristics of Particle Shape Evolution by Bed-Load Chipping. Sci. Adv. 2018, 4, 1–12. [Google Scholar] [CrossRef]
- Attal, M.; Lavé, J. Pebble Abrasion during Fluvial Transport: Experimental Results and Implications for the Evolution of the Sediment Load along Rivers. J. Geophys. Res. Earth Surf. 2009, 114, F04023. [Google Scholar] [CrossRef]
- Wu, J.; Hou, Y.; Wang, L.; Guo, M.; Meng, L.; Xiong, H. Analysis of Coarse Aggregate Performance Based on the Modified Micro Deval Abrasion Test. Int. J. Pavement Res. Technol. 2018, 11, 185–194. [Google Scholar] [CrossRef]
- Bian, X.; Shi, K.; Li, W.; Luo, X.; Tutumluer, E.; Chen, Y. Quantification of Railway Ballast Degradation by Abrasion Testing and Computer-Aided Morphology Analysis. J. Mater. Civ. Eng. 2021, 33, 04020411. [Google Scholar] [CrossRef]
- Maue, A.D.; Levy, J.S.; Burr, D.M.; Matulka, P.R.; Nathan, E. Rapid Rounding of Icy Clasts during Simulated Fluvial Transport in the Titan Tumbler. Icarus 2022, 375, 114831. [Google Scholar] [CrossRef]
- Bak, E.N.; Larsen, M.G.; Jensen, S.K.; Nørnberg, P.; Moeller, R.; Finster, K. Wind-Driven Saltation: An Overlooked Challenge for Life on Mars. Astrobiology 2019, 19, 497–505. [Google Scholar] [CrossRef]
- Kueppers, U.; Putz, C.; Spieler, O.; Dingwell, D.B. Abrasion in Pyroclastic Density Currents: Insights from Tumbling Experiments. Phys. Chem. Earth 2012, 45–46, 33–39. [Google Scholar] [CrossRef]
- Hornby, A.J.; Kueppers, U.; Maurer, B.; Poetsch, C.; Dingwell, D.B. Experimental Constraints on Volcanic Ash Generation and Clast Morphometrics in Pyroclastic Density Currents and Granular Flow. Volcanica 2020, 3, 263–283. [Google Scholar] [CrossRef]
- Frontini, R.; Fernández-Jalvo, Y.; Pesquero Fernández, M.D.; Vecchi, R.J.; Bayón, C. Abrasion in Archaeological Fish Bones from Sand Dunes. An Experimental Approach. Archaeol. Anthropol. Sci. 2019, 11, 4891–4907. [Google Scholar] [CrossRef]
- Thompson, C.E.L.; Ball, S.; Thompson, T.J.U.; Gowland, R. The Abrasion of Modern and Archaeological Bones by Mobile Sediments: The Importance of Transport Modes. J. Archaeol. Sci. 2011, 38, 784–793. [Google Scholar] [CrossRef]
- Chu, W.; Thompson, C.; Hosfield, R. Micro-Abrasion of Flint Artifacts by Mobile Sediments: A Taphonomic Approach. Archaeol. Anthropol. Sci. 2015, 7, 3–11. [Google Scholar] [CrossRef]
- BS EN 1097-6:2013; Tests for Mechanical and Physical Properties of Aggregates—Part 6: Determination of Particle Density and Water Absorption. British Standards Institution: London, UK, 2013.
- Strzałkowski, P.; Kazmierczak, U. Wear and Fragmentation Resistance of Mineral Aggregates—A Review of Micro-Deval and Los Angeles Tests. Materials 2021, 14, 5456. [Google Scholar] [CrossRef] [PubMed]
- Erichsen, E.; Ulvik, A.; Sævik, K. Mechanical Degradation of Aggregate by the Los Angeles-, the Micro-Deval-and the Nordic Test Methods. Rock Mech. Rock Eng. 2011, 44, 333–337. [Google Scholar] [CrossRef]
- ASTM D6928-17; Resistance of Coarse Aggregate to Degradation by Abrasion in the Micro-Deval Apparatus. ASTM: West Conshohocken, PA, USA, 2017.
- ASTM D7428-15; Resistance of Fine Aggregate to Degradation by Abrasion in the Micro-Deval Apparatus. ASTM: West Conshohocken, PA, USA, 2015.
- BS EN 1097-1:2011; Tests for Mechanical and Physical Properties of Aggregates, Part 1: Determination of Resistance to Wear (Micro-Deval). British Standards Institution: London, UK, 2011.
- ASTM C535-16; Resistance to Degradation of Large-Size Coarse Aggregate by Abrasion and Impact in the Los Angeles Machine. ASTM: West Conshohocken, PA, USA, 2016.
- ASTM C131/C131M-14; Resistance to Degradation of Small-Size Coarse Aggregate by Abrasion and Impact in the Los Angeles Machine. ASTM: West Conshohocken, PA, USA, 2014.
- BS EN 1097-2:2010; Tests for Mechanical and Physical Properties of Aggregates. Part 2: Methods for the Determination of Resistance to Fragmentation. British Standards Institution: London, UK, 2010; 34p.
- ISO 14688-1:2017; Geotechnical Investigation and Testing—Identification and Classification of Soil—Part 1: Identification and Description. ISO: Geneva, Switzerland, 2017.
- Walling, D.E.; Moorehead, P.W. The Particle Size Characteristics of Fluvial Suspended Sediment: An Overview. Hydrobiologia 1989, 176–177, 125–149. [Google Scholar] [CrossRef]
- Singh, M.; Singh, I.B.; Müller, G. Sediment Characteristics and Transportation Dynamics of the Ganga River. Geomorphology 2007, 86, 144–175. [Google Scholar] [CrossRef]
- ISO 13322-2:2021; Particle Size Analysis—Image Analysis Methods—Part 2: Dynamic Image Analysis Methods. ISO: Geneva, Switzerland, 2021.
- Buckland, H.M.; Saxby, J.; Roche, M.; Meredith, P.; Rust, A.C.; Cashman, K.V.; Engwell, S.L. Measuring the Size of Non-Spherical Particles and the Implications for Grain Size Analysis in Volcanology. J. Volcanol. Geotherm. Res. 2021, 415, 107257. [Google Scholar] [CrossRef]
- Guo, Y.; Markine, V.; Song, J.; Jing, G. Ballast Degradation: Effect of Particle Size and Shape Using Los Angeles Abrasion Test and Image Analysis. Constr. Build. Mater. 2018, 169, 414–424. [Google Scholar] [CrossRef]
- Li, L.; Iskander, M. Evaluation of Roundness Parameters in Use for Sand. J. Geotech. Geoenviron. Eng. 2021, 147, 04021081. [Google Scholar] [CrossRef]
- Rao, C.; Tutumluer, E.; Kim, I.T. Quantification of Coarse Aggregate Angularity Based on Image Analysis. Transp. Res. Rec. 2002, 1787, 117–124. [Google Scholar] [CrossRef]
- Czinder, B.; Vásárhelyi, B.; Török, Á. Long-Term Abrasion of Rocks Assessed by Micro-Deval Tests and Estimation of the Abrasion Process of Rock Types Based on Strength Parameters. Eng. Geol. 2021, 282, 105996. [Google Scholar] [CrossRef]
- Gupta, A.; Yan, D. Mineral Processing Design and Operations Roll Crushers; Elsevier: Amsterdam, The Netherlands, 2016; ISBN 9780444635891. [Google Scholar]
- Dias Filho, J.L.E.; Pereira Santos, V.G.; Cesar, P.; Maia, A.; De Castro Xaviera, G. Study of Relationship between Wear Tests on Rocks by Slake Durability, Micro-Deval and Los Angeles Abrasion Tests. In Proceedings of the ISRM Regional Symposium-8th South American Congress on Rock Mechanics SACRM, Buenos Aires, Argentina, 15–18 November 2015; pp. 225–230. [Google Scholar] [CrossRef]
- Brachaniec, T. Susceptibility of Various Tektite Types to Fluvial Abrasion. Geol. Q. 2019, 63, 150–161. [Google Scholar] [CrossRef]
- Trotta, R.P.; Barroso, E.V.; da Motta, L.M.G. Migmatitic Gneiss Aggregates: Compositional, Mechanical, and Morphological Responses to Innate Heterogeneity. Eng. Geol. 2021, 283, 106002. [Google Scholar] [CrossRef]
- Czinder, B.; Török, Á. Long-Term Durability Tests of Andesite Aggregates from Hungary. Cent. Eur. Geol. 2017, 60, 333–343. [Google Scholar] [CrossRef]
- Yao, T.; Yang, H.; Lourenço, S.D.N.; Baudet, B.A.; Kwok, F.C.Y. Multi-Scale Particle Morphology Evolution in Rotating Drum Tests: Role of Particle Shape and Pore Fluid. Eng. Geol. 2022, 303, 106669. [Google Scholar] [CrossRef]
- Caballero, L.; Sarocchi, D.; Borselli, L.; Cárdenas, A.I. Particle Interaction inside Debris Flows: Evidence through Experimental Data and Quantitative Clast Shape Analysis. J. Volcanol. Geotherm. Res. 2012, 231–232, 12–23. [Google Scholar] [CrossRef]
- Yahyaei, M.; Weerasekara, N.S.; Powell, M.S. Characterisation of Superficial Breakage Using Multi-Size Pilot Mills. Miner. Eng. 2015, 81, 71–78. [Google Scholar] [CrossRef]
- Schoklitsch, A. Über Die Verkleinerung Der Geschiebe in Flussläufen. Akad. Wiss. Wien 1933, IIa, 343–366. [Google Scholar]
- Paixão, A.; Fortunato, E. Abrasion Evolution of Steel Furnace Slag Aggregate for Railway Ballast: 3D Morphology Analysis of Scanned Particles by Close-Range Photogrammetry. Constr. Build. Mater. 2021, 267, 121225. [Google Scholar] [CrossRef]
- Manga, M.; Patel, A.; Dufek, J. Rounding of Pumice Clasts during Transport: Field Measurements and Laboratory Studies. Bull. Volcanol. 2011, 73, 321–333. [Google Scholar] [CrossRef]
- Deiros Quintanilla, I.; Combe, G.; Emeriault, F.; Voivret, C.; Ferellec, J.F. X-Ray CT Analysis of the Evolution of Ballast Grain Morphology along a Micro-Deval Test: Key Role of the Asperity Scale. Granul. Matter 2019, 21, 30. [Google Scholar] [CrossRef]
- ISO 14688-2:2017; Geotechnical Investigation and Testing—Identification and Classification of Soil—Part 2: Principles for a Classification. ISO: Geneva, Switzerland, 2017.
- Kamani, M.; Ajalloeian, R. Investigation of the Changes in Aggregate Morphology during Different Aggregate Abrasion/Degradation Tests Using Image Analysis. Constr. Build. Mater. 2022, 314, 125614. [Google Scholar] [CrossRef]


| Micro-Deval | Los Angeles | |
|---|---|---|
| D (drum) (mm) | 200 | 711 |
| L (drum) (mm) | 154 | 508 |
| ω (rpm) | 100 | 32 |
| Mean m0 (kg) | 0.22 | 1.96 |
| No. of samples | 9 | 3 |
| Filling (%) | 56.3 | 0.35 |
| P0 (W) | 5.67 | 9.52 |
| ∑E (kJ) | 315.93 | 23.71 |
| ∑t (min) | 930 | ~47 |
| ∑Rev (n) | 93000 | 1500 |
Disclaimer/Publisher’s Note: The statements, opinions and data contained in all publications are solely those of the individual author(s) and contributor(s) and not of MDPI and/or the editor(s). MDPI and/or the editor(s) disclaim responsibility for any injury to people or property resulting from any ideas, methods, instructions or products referred to in the content. |
© 2023 by the authors. Licensee MDPI, Basel, Switzerland. This article is an open access article distributed under the terms and conditions of the Creative Commons Attribution (CC BY) license (https://creativecommons.org/licenses/by/4.0/).
Share and Cite
Kuzmanić, T.; Lebar, K.; Mikoš, M. Comparison of Different-Energy-Level Abrasion in Los Angeles and Micro-Deval Apparatuses Using Mass Loss and Rounding of Sediment Particles. Appl. Sci. 2023, 13, 6102. https://doi.org/10.3390/app13106102
Kuzmanić T, Lebar K, Mikoš M. Comparison of Different-Energy-Level Abrasion in Los Angeles and Micro-Deval Apparatuses Using Mass Loss and Rounding of Sediment Particles. Applied Sciences. 2023; 13(10):6102. https://doi.org/10.3390/app13106102
Chicago/Turabian StyleKuzmanić, Tamara, Klaudija Lebar, and Matjaž Mikoš. 2023. "Comparison of Different-Energy-Level Abrasion in Los Angeles and Micro-Deval Apparatuses Using Mass Loss and Rounding of Sediment Particles" Applied Sciences 13, no. 10: 6102. https://doi.org/10.3390/app13106102