Abstract
Small objects detection is a challenging task in computer vision due to the limited semantic information that can be extracted and the susceptibility to background interference. In this paper, we propose a decoupled multi-scale small object detection algorithm named DMS-YOLOv5. The algorithm incorporates a receptive field module into the feature extraction network for better focus on low-resolution small objects. The coordinate attention mechanism, which combines spatial and channel attention information, is introduced to reduce interference from background information and enhance the network’s attention to object information. A detection layer tailored to small-sized objects is added to compensate for the loss of small object information in multiple downsampling operations, greatly improving the detection capability of small objects. Next, The decoupled network is introduced into the detection head network for branch processing of classification and bounding box regression tasks. Finally, the bounding box loss function is improved to alleviate missed detection problems caused by the concentration of small objects and mutual occlusion between objects. The improved method achieved a mean average precision improvement of 12.1% on VisDrone2019-DET dataset compared to the original method. In comparison experiments with similar methods, our proposed method also demonstrated good performance, validating its effectiveness.
1. Introduction
In recent years, computer technology has entered a period of rapid development. Images as an important carrier of information transmission have also reached new heights. Computer vision, as an important branch of computer technology [1], has become a popular field of research for image processing and analysis.
Object detection technology [2] is a key research direction in computer vision. Traditional object detection methods such as HOG features [3] and SURF features [4] suffer from poor generalization capabilities and require complex feature extraction optimization algorithms for different scenes and tasks. With the advancement of hardware devices and the efficient combination of computing power and convolutional neural networks, deep learning-based object detection algorithms are becoming more practical and efficient.
Deep learning has pointed to new directions in the development of object detection methods. Conventional-sized object detection tasks have achieved good detection results. However, small object detection tasks pose a significant challenge due to the limited feature information that can be extracted and susceptibility to background interference [5].
Small objects are widely present in practical scenarios such as remote sensing images [6], unmanned aerial vehicle (UAV) images [7], and autonomous driving road condition images [8]. As small objects often have a wide distribution range and can overlap with one another, it becomes difficult to extract their features, increasing the difficulty of feature extraction and detection. Therefore, improving small object detection models and enhancing their recognition accuracy and effectiveness has become particularly important in extending the theoretical research of small object detection to practical application scenarios such as aerial image detection, which will contribute to better application value for human society.
The main reasons for the challenges faced by the field of small object detection based on deep learning are as follows:
- (1)
- Excessively increasing the depth of the feature extraction network for small objects with small size and resolution leads to the loss of their own feature information. Increasing the receptive field size during pooling leads to problems such as image resolution reduction and loss of image details.
- (2)
- Small objects are easily confused with the background in complex background environments, making it difficult to extract their feature information through feature extraction.
- (3)
- Multiple downsampling operations in the detection head network of the object detection algorithm cause a loss of small object details.
- (4)
- The coupled network in the object detection algorithm processes classification and bounding box regression tasks simultaneously, which weakens the performance of both tasks.
- (5)
- The bounding box regression loss function in object detection algorithms has different spatial sensitivity to objects of different scales, resulting in low regression prediction accuracy for small objects and easy missed detection of adjacent objects.
The contributions of this paper are as follows:
- (1)
- This paper proposes an improved small object detection method based on the official version of the originla YOLOv5s algorithm, namely DMS-YOLOv5.
- (2)
- The receptive field module is introduced into the feature extraction network to increase the network’s receptive field, allowing the network to focus more on small objects with small size and low resolution and complete the extraction of multi-level semantic information.
- (3)
- The CA attention mechanism is introduced, which combines spatial and channel attention information, to reduce the interference of background information on object features and enhance the network’s ability to focus on object information.
- (4)
- A small object detection layer is added to compensate for the problem of losing small object details during multiple downsampling operations.
- (5)
- The decoupling network is introduced into the detection head network to process classification and bounding box regression tasks separately, thereby improving the detection accuracy and efficiency of both tasks.
- (6)
- The bounding box loss function and non-maximum suppression algorithm are improved to alleviate the missed detection problem caused by the concentrated distribution of small objects and mutual occlusion between objects.
The organizational structure of this paper is as follows:
Section 1 introduces the key issues and challenges in small object detection and the necessity of addressing them. Section 2 reviews the research status in the field of small object detection based on deep learning. Section 3 describes the proposed methods for improving various modules, including the receptive field module, the mixed channel and spatial attention module, the multi-head small object detection layer, the decoupled detection head network, and the bounding box loss function and non-maximum suppression algorithm. In Section 4, the detection performance of each improved module is presented in detail, and the experimental results are evaluated and analyzed, with comparisons made to similar methods. Finally, Section 5 concludes the paper and outlines future research directions.
2. Related Work
The definition of small objects can be divided into two forms: absolute size-based small objects and relative size-based small objects. Absolute size-based small objects are defined based on the absolute number of pixels in the object. For example, in the COCO dataset [9], small objects are defined as objects with a resolution smaller than 32 × 32. Since the resolution of images in different datasets varies, the specific definition of small objects also differs. Relative size-based small objects are usually defined based on the ratio of the object’s bounding box width and height to the image width and height. Objects with a ratio less than 0.1 are often defined as small objects.
Solutions for small object detection can be divided into two aspects: improvements in input image preprocessing and network structure.
In terms of input image preprocessing, super-resolution techniques [10] can be used to obtain detailed information about small objects. Additionally, image reconstruction algorithms based on Generative Adversarial Networks (GANs) [11] can more effectively extract features of small objects.
In terms of network structure improvements, deep networks in convolutional neural networks acquire more comprehensive semantic information, which is contradictory to the small size and low resolution of small objects. Therefore, it is necessary to combine the feature information of deep networks with the positional information of shallow networks to achieve multi-scale feature fusion [12] and improve the feature extraction ability of small objects. There are also studies on context information extraction [13] and feature channel attention [14] and spatial information attention [15], as well as improvements in detection head networks for better performance in small object detection tasks.
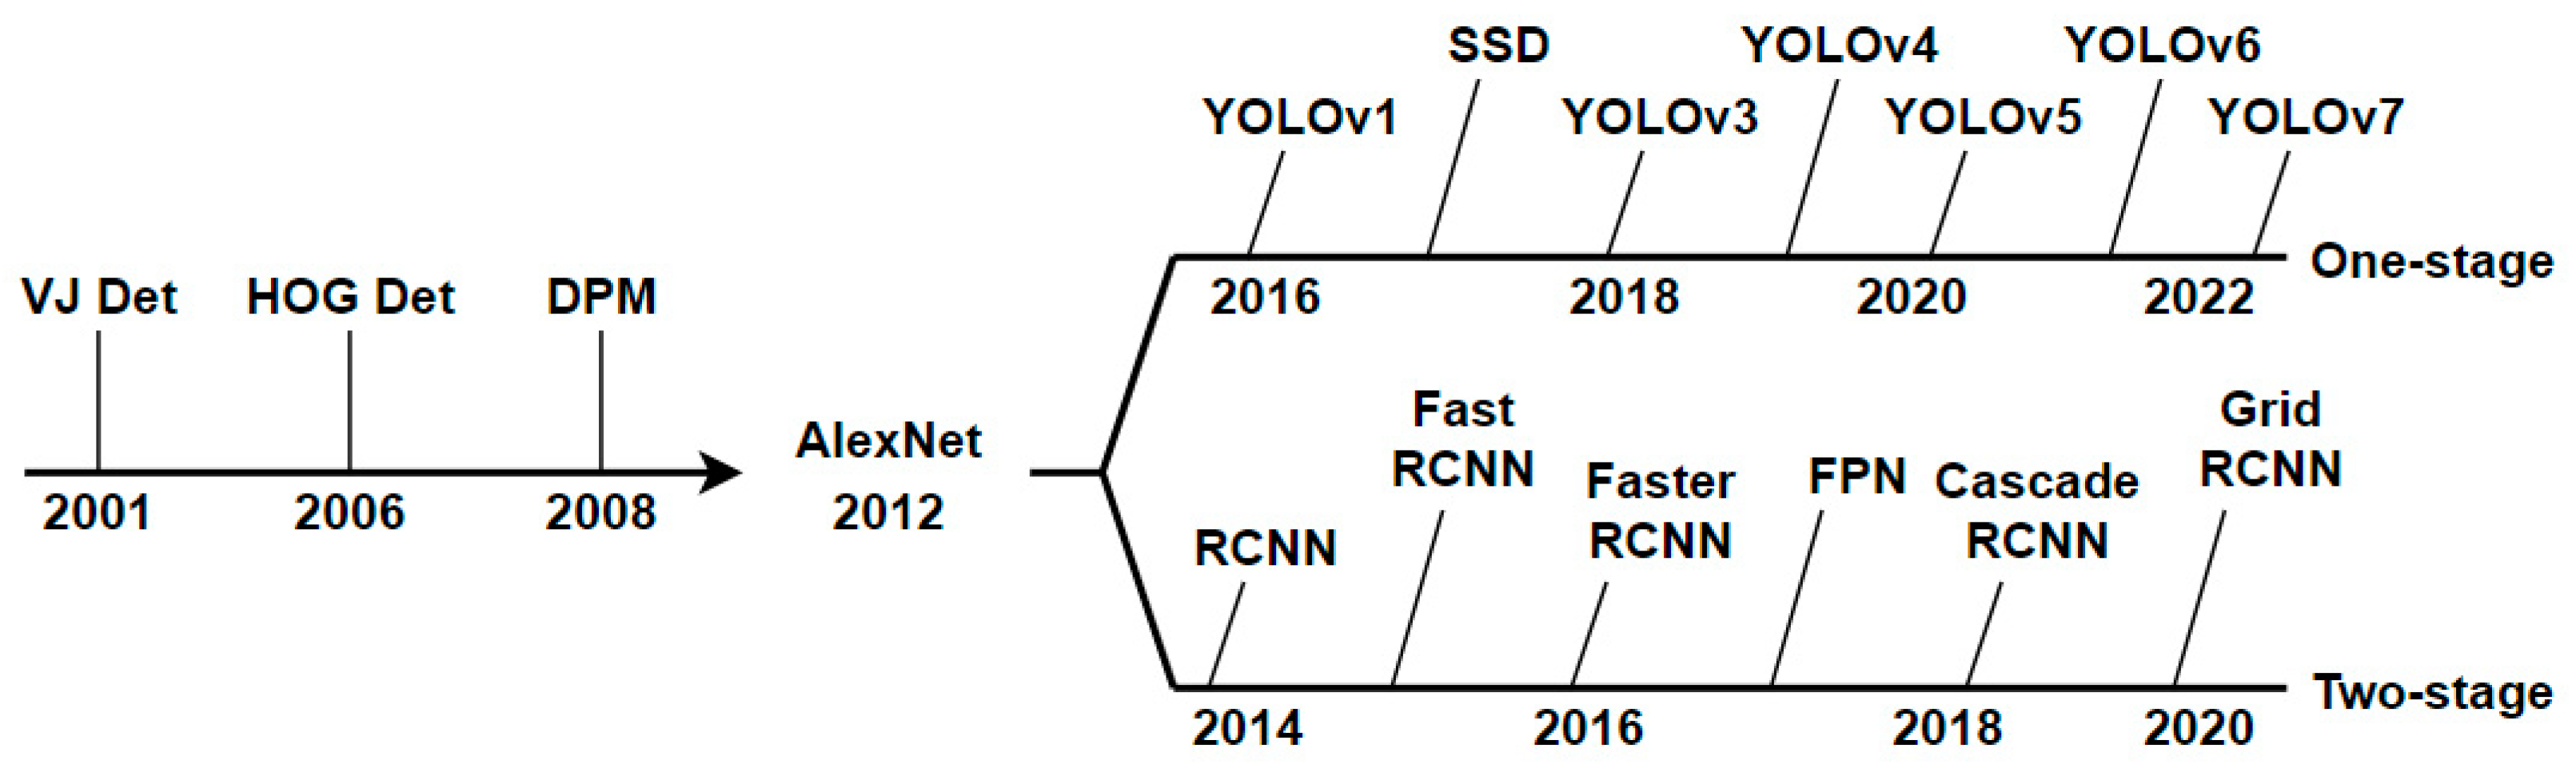
Next, we briefly introduce object detection algorithms based on deep learning. With the widespread use of convolutional neural networks and the improvement of computer hardware capabilities, object detection algorithms based on deep learning have made significant progress. According to whether there is a separate step for obtaining candidate boxes, the algorithms can be divided into one-stage object detection algorithms [16] and two-stage object detection algorithms [17]. Compared to two-stage object detection algorithms, the main advantage of one-stage object detection algorithms is that they omit the step of candidate box extraction, resulting in faster detection speed. The important milestones of object detection algorithms are shown in Figure 1.
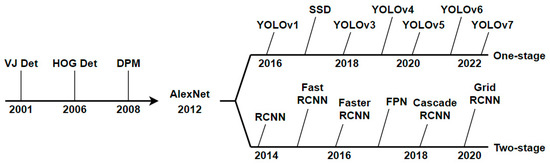
Figure 1.
The milestones of traditional object detection algorithms, one-stage object detection algorithms, and two-stage object detection algorithms.
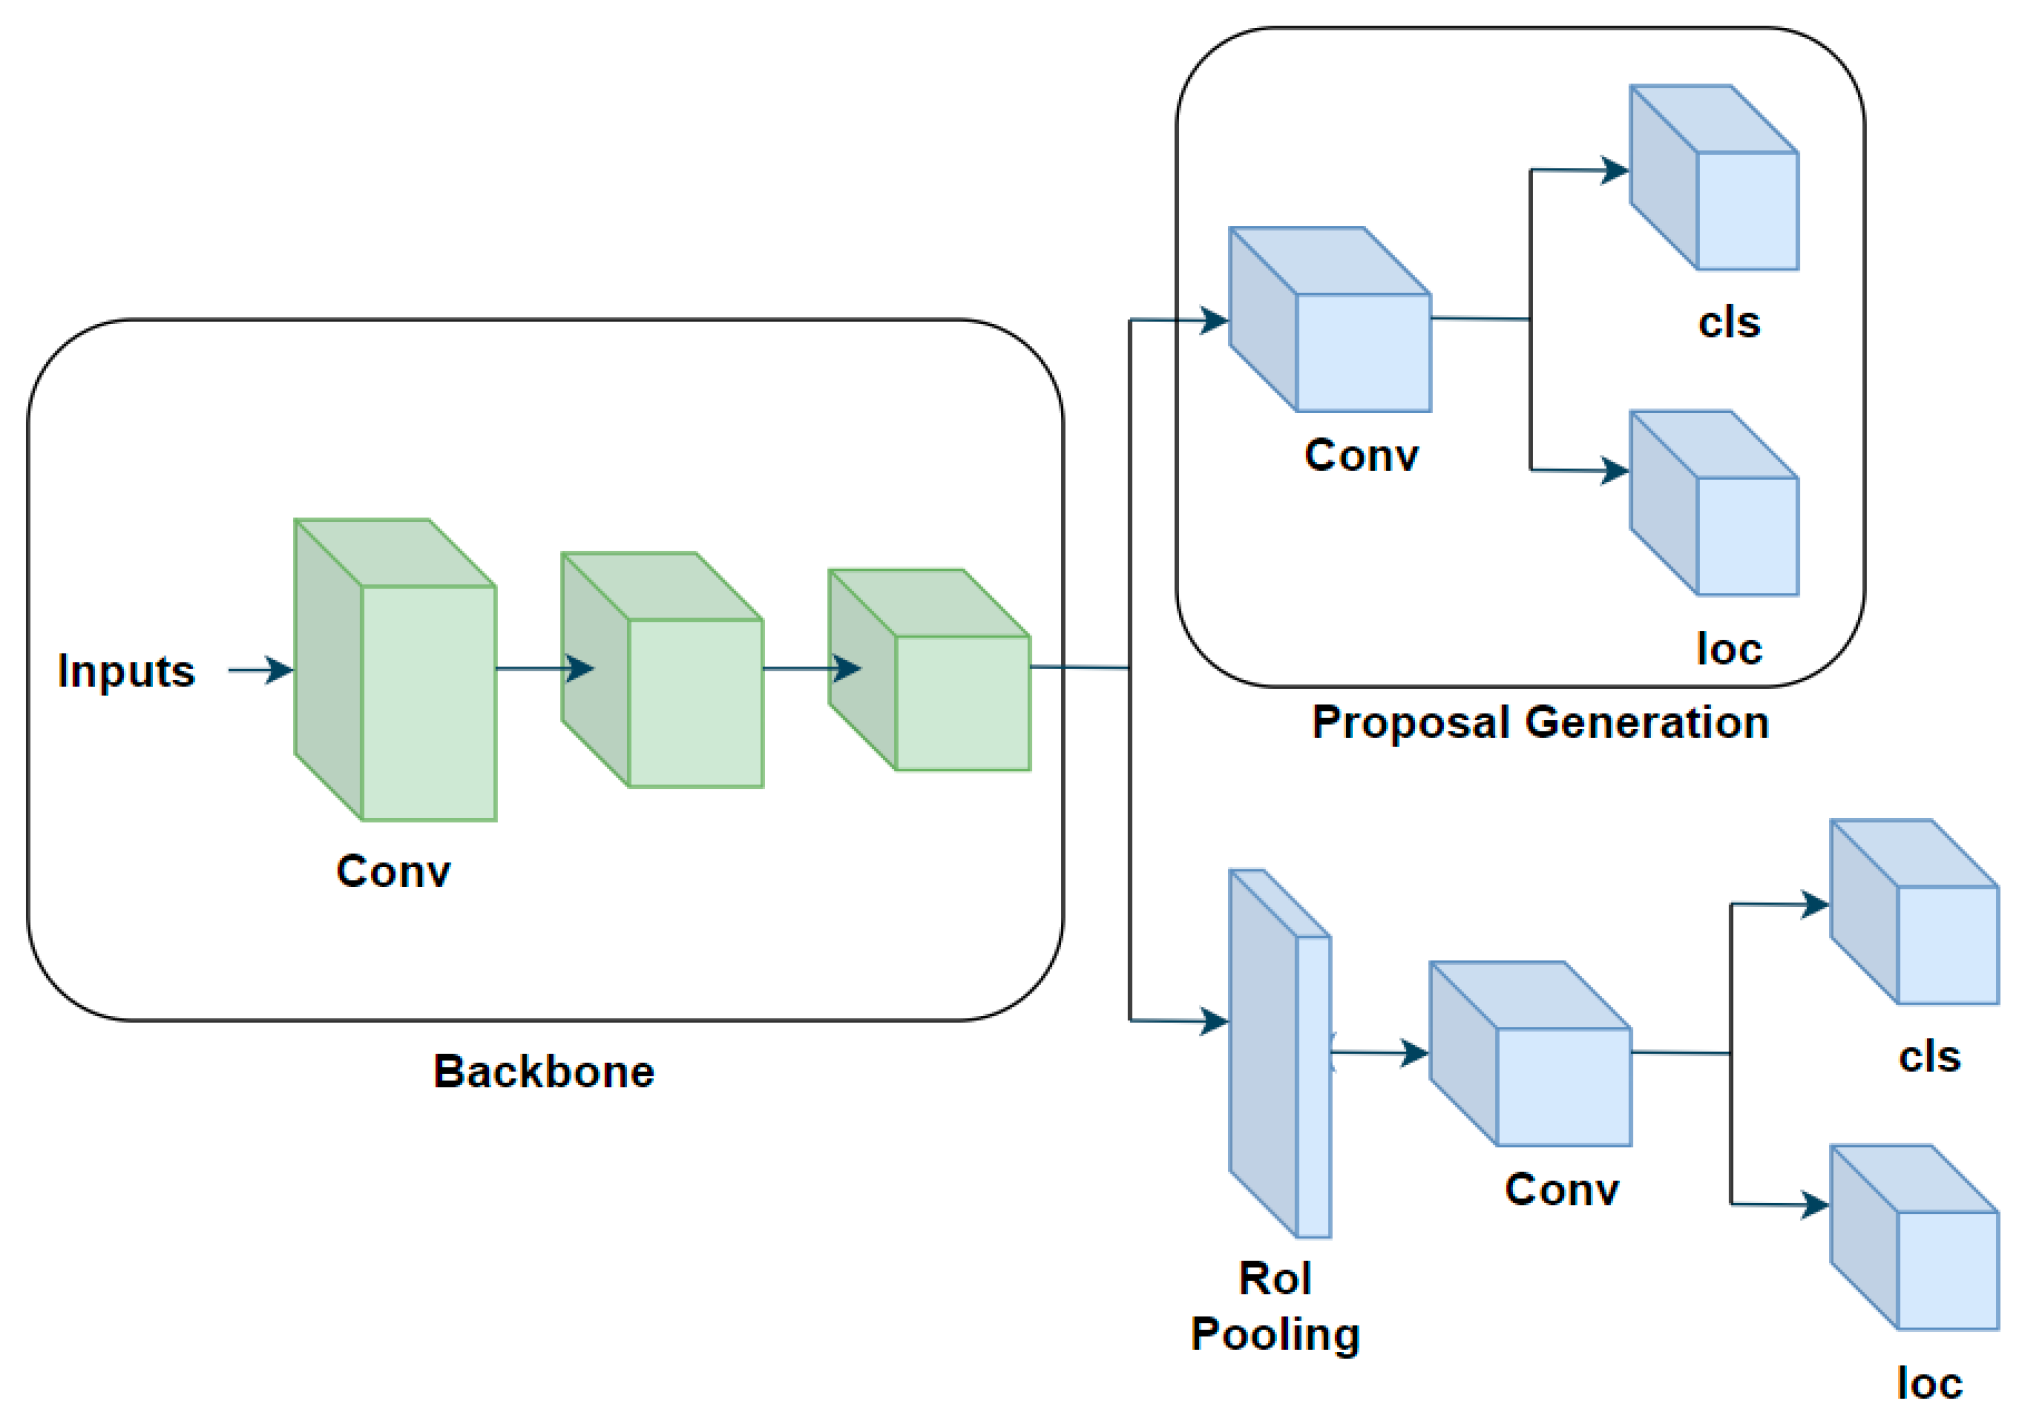
Two-stage object detection algorithms consist of two parts: region proposal part and feature classification and regression prediction part. The first part mainly performs binary classification of the background and foreground of the input image, selects the position of the region of interest (RoI) by boxing it with a rectangular box, and obtains the coordinates of the upper left and lower right corners of the rectangular box to determine the specific location of the region of interest. The second part extracts features from all candidate regions obtained in the previous step, inputs them into a classifier for multi-classification tasks to determine the specific category of the object, and finally completes the regression prediction to refine the candidate boxes and complete the entire process. Common two-stage object detection algorithms include R-CNN [18], Fast R-CNN [19], Faster R-CNN [20], FPN [21], Cascade RCNN [22], and Grid RCNN [23]. The process of two-stage object detection is shown in Figure 2.

Figure 2.
Two-stage object detection algorithm architecture diagram.
The pioneering work of one-stage object detection algorithms is the YOLOv1 object detection algorithm [24], which omits the process of extracting feature candidate boxes and directly divides the input image into regions. The obtained regions are subjected to feature extraction and directly undergo classification and regression operations, greatly improving the speed of model operation and detection. Common one-stage object detection algorithms include the SSD [25], YOLOv2 [26], YOLOv3 [27], YOLOv4 [28], YOLOv5 [29], YOLOv6 [30], and YOLOv7 [31]. The structure diagram of one-stage object detection algorithm is shown in Figure 3.
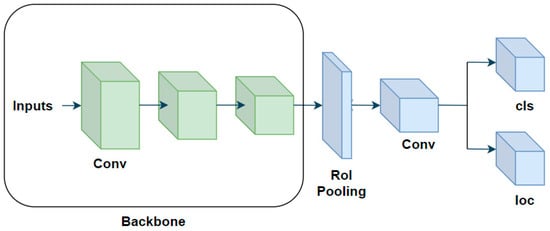
Figure 3.
One-stage object detection algorithm architecture diagram.
3. Methods
3.1. Overview of the Network Architecture
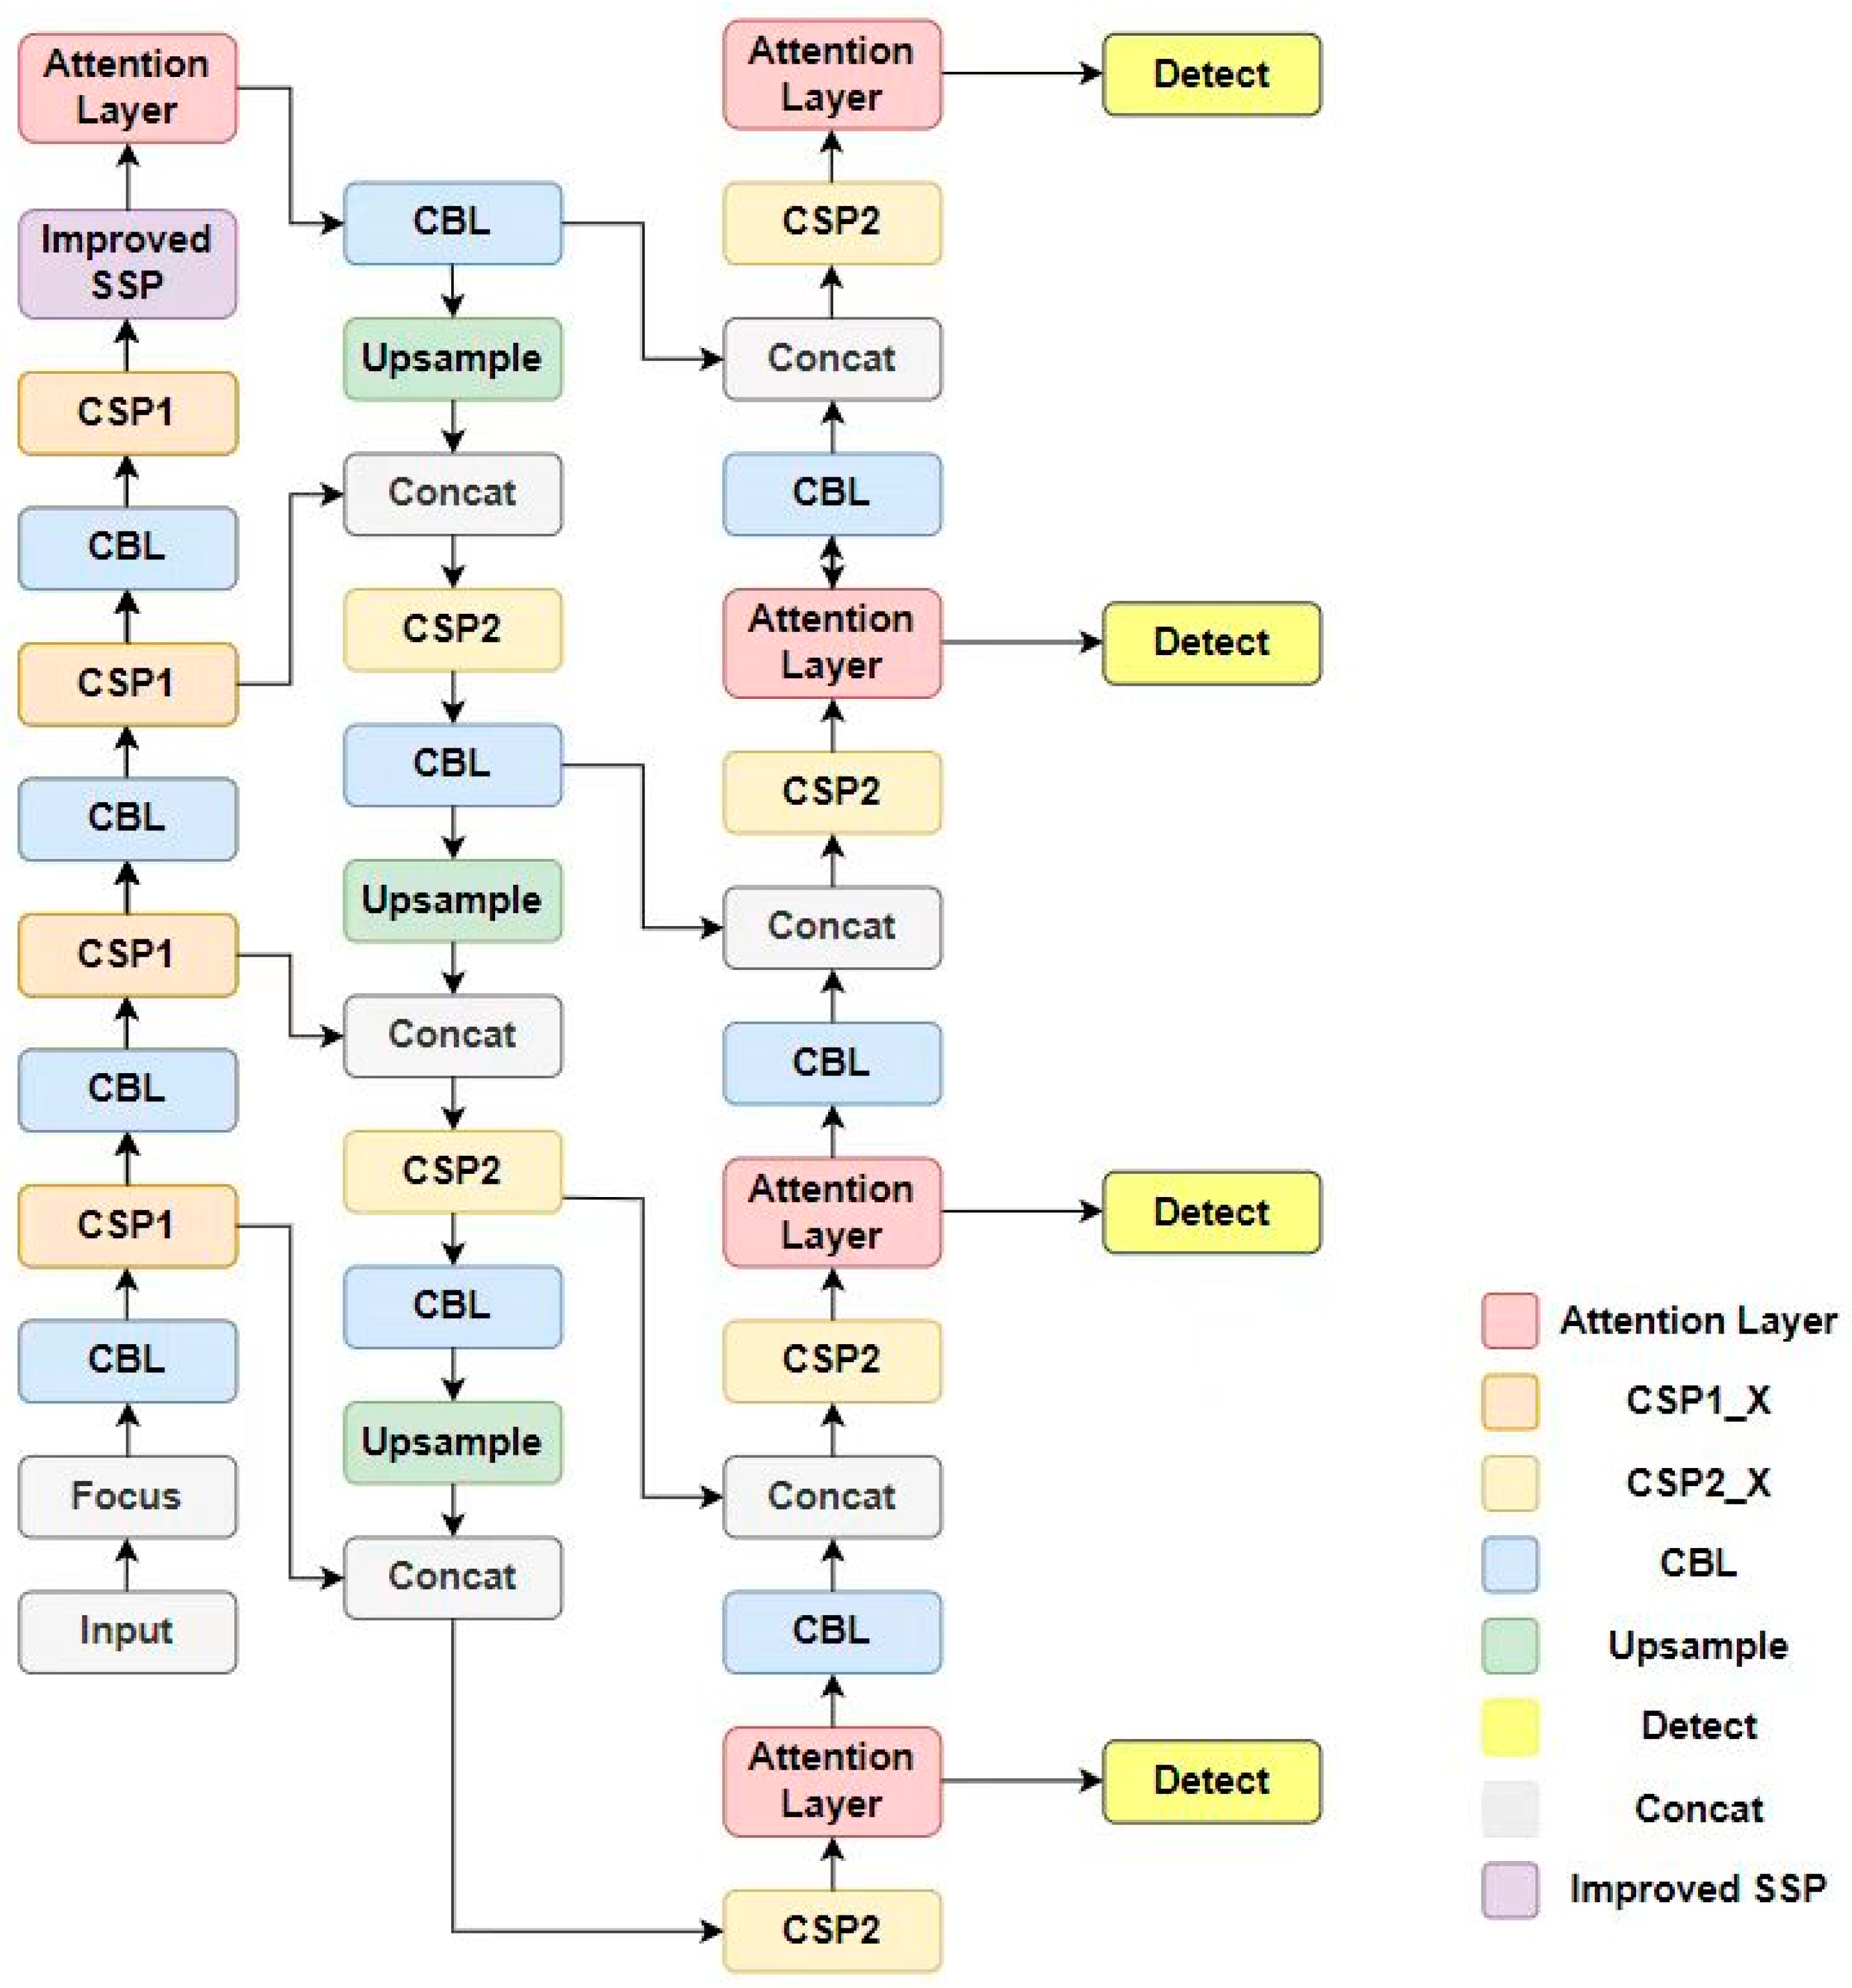
In this paper, we propose an improved YOLOv5 method for small object detection. The receptive field module with the concept of dilated convolution is introduced into the feature extraction network to increase the network’s receptive field. With a small loss of image resolution, the network can pay more attention to small objects with small size and low resolution and complete multi-level semantic information extraction. In addition, the CA attention mechanism that introduces mixed spatial and channel attention information is used to reduce the interference of background information on object features and enhance the network’s attention to object information. To solve the problem of losing small object details due to multiple downsampling, a small object detection layer is added. Furthermore, by introducing a decoupled network to handle the classification and bounding box regression tasks separately, the detection accuracy and efficiency of the two tasks are improved. Finally, the boundary box loss function and non-maximum suppression algorithm are improved to alleviate the missing detection problem caused by the concentration of small objects and the occlusion among objects. The proposed network architecture is shown in Figure 4.

Figure 4.
Improved network model architecture diagram.
3.2. Receptive Field Module
To improve the feature extraction ability of the network, increasing the network depth to learn more semantic information is a common practice. This method is effective for objects of regular size, as it can learn both deep-level detail information and shallow-level object position information, thus extracting more complete feature information. However, for small objects with small size and resolution, increasing the depth too much often leads to the loss of their own feature information, which affects the network’s classification and regression operations. Additionally, existing spatial pyramid pooling modules often lead to problems such as decreased resolution and loss of image details while increasing the receptive field. To address these issue, this paper introduces the concept of dilated convolution and uses the receptive field module to improve the existing spatial pyramid pooling module. This approach can increase the receptive field while avoiding the problem of missing image information and decreased resolution. At the same time, different scales of receptive fields are constructed in the feature extraction process to better focus on small objects with small size and low resolution.
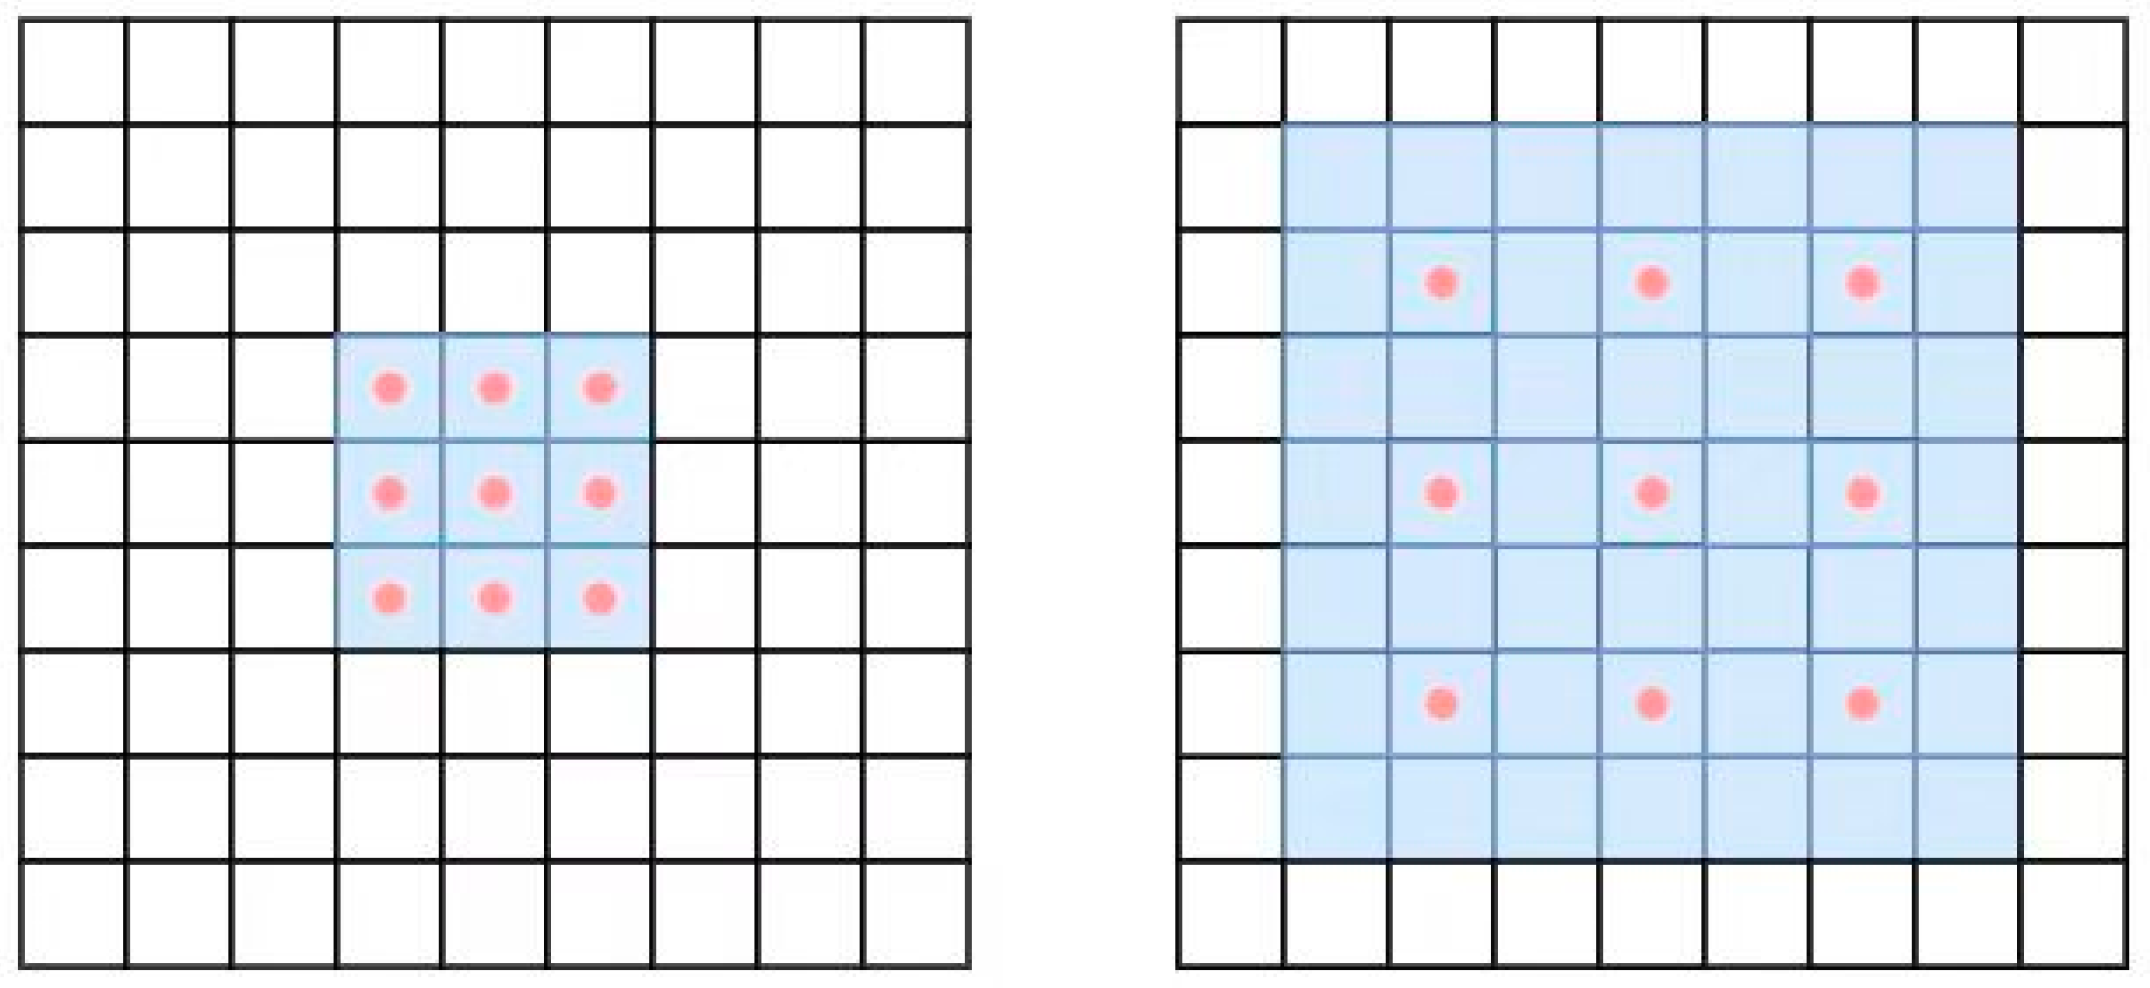
Compared with ordinary convolution, dilated convolution does not increase the training volume of the model network, and the actual calculation points are the same as those of ordinary convolution. By setting the dilation rate parameter, the number of padding zeros in the convolution kernel can adjust to the size of the network’s receptive field and achieve sufficient extraction of information at different scales. The comparison between ordinary convolution and dilated convolution is shown in Figure 5. In dilated convolution, only the red points are involved in the calculation, and the calculation of pixel values around the red points is skipped directly.
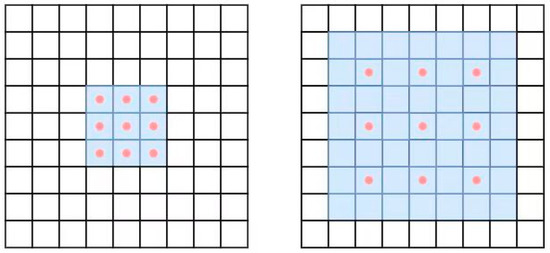
Figure 5.
Comparison diagram of regular convolution and dilated convolution.
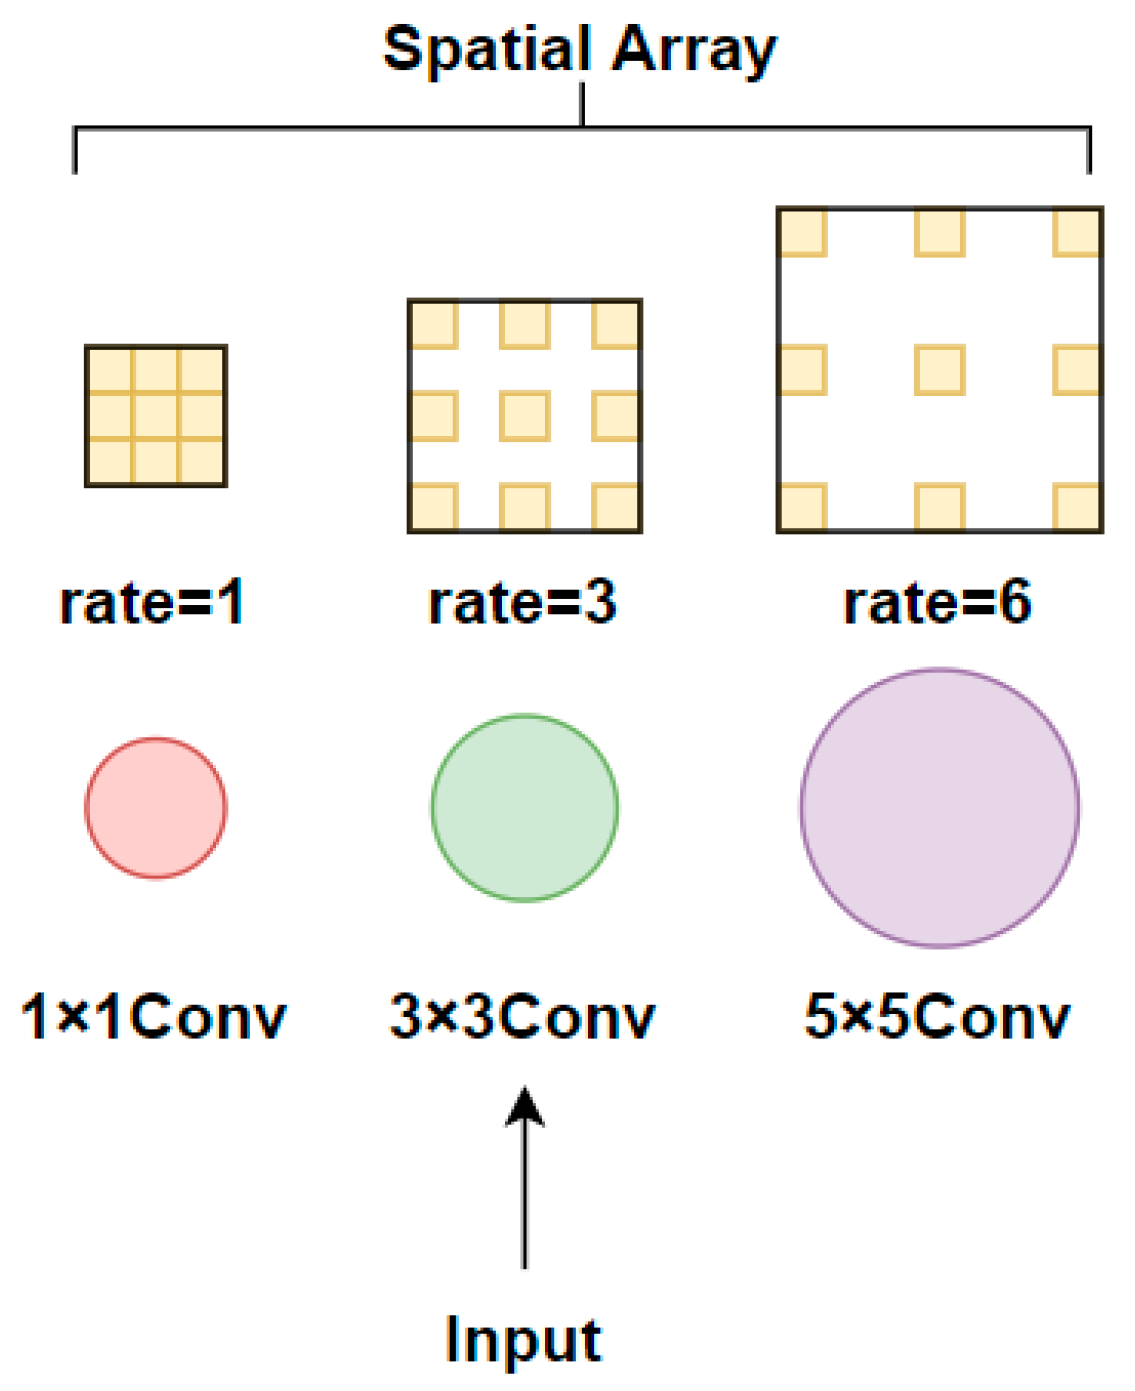
The receptive field module is a multi-branch structure module that uses dilated convolutions to improve the performance of computer vision tasks from the perspective of simulating the human visual system. Unlike the dilated spatial convolution pooling pyramid, the convolution kernel size of each branch in the receptive field module is not the same. The small-sized 1 × 1 convolution kernel corresponds to a small-sized dilation rate, and as the kernel size increases, the corresponding dilation rate also increases. Finally, different sizes of feature maps are sampled in parallel, and the feature channel number is adjusted by 1 × 1 convolution. The use of convolution kernels with gradually increasing gradients and dilated convolution sizes in receptive field modules enables the extraction of multi-scale feature information, facilitating the extraction of small object detail information. The structure diagram of the receptive field module is shown in Figure 6.
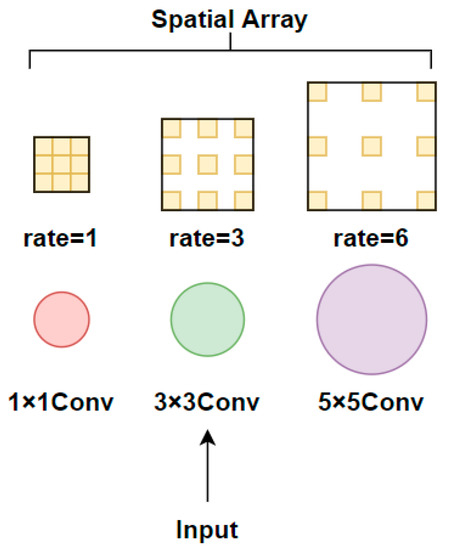
Figure 6.
Receptive field module architecture diagram.
3.3. Attention Mechanism Module
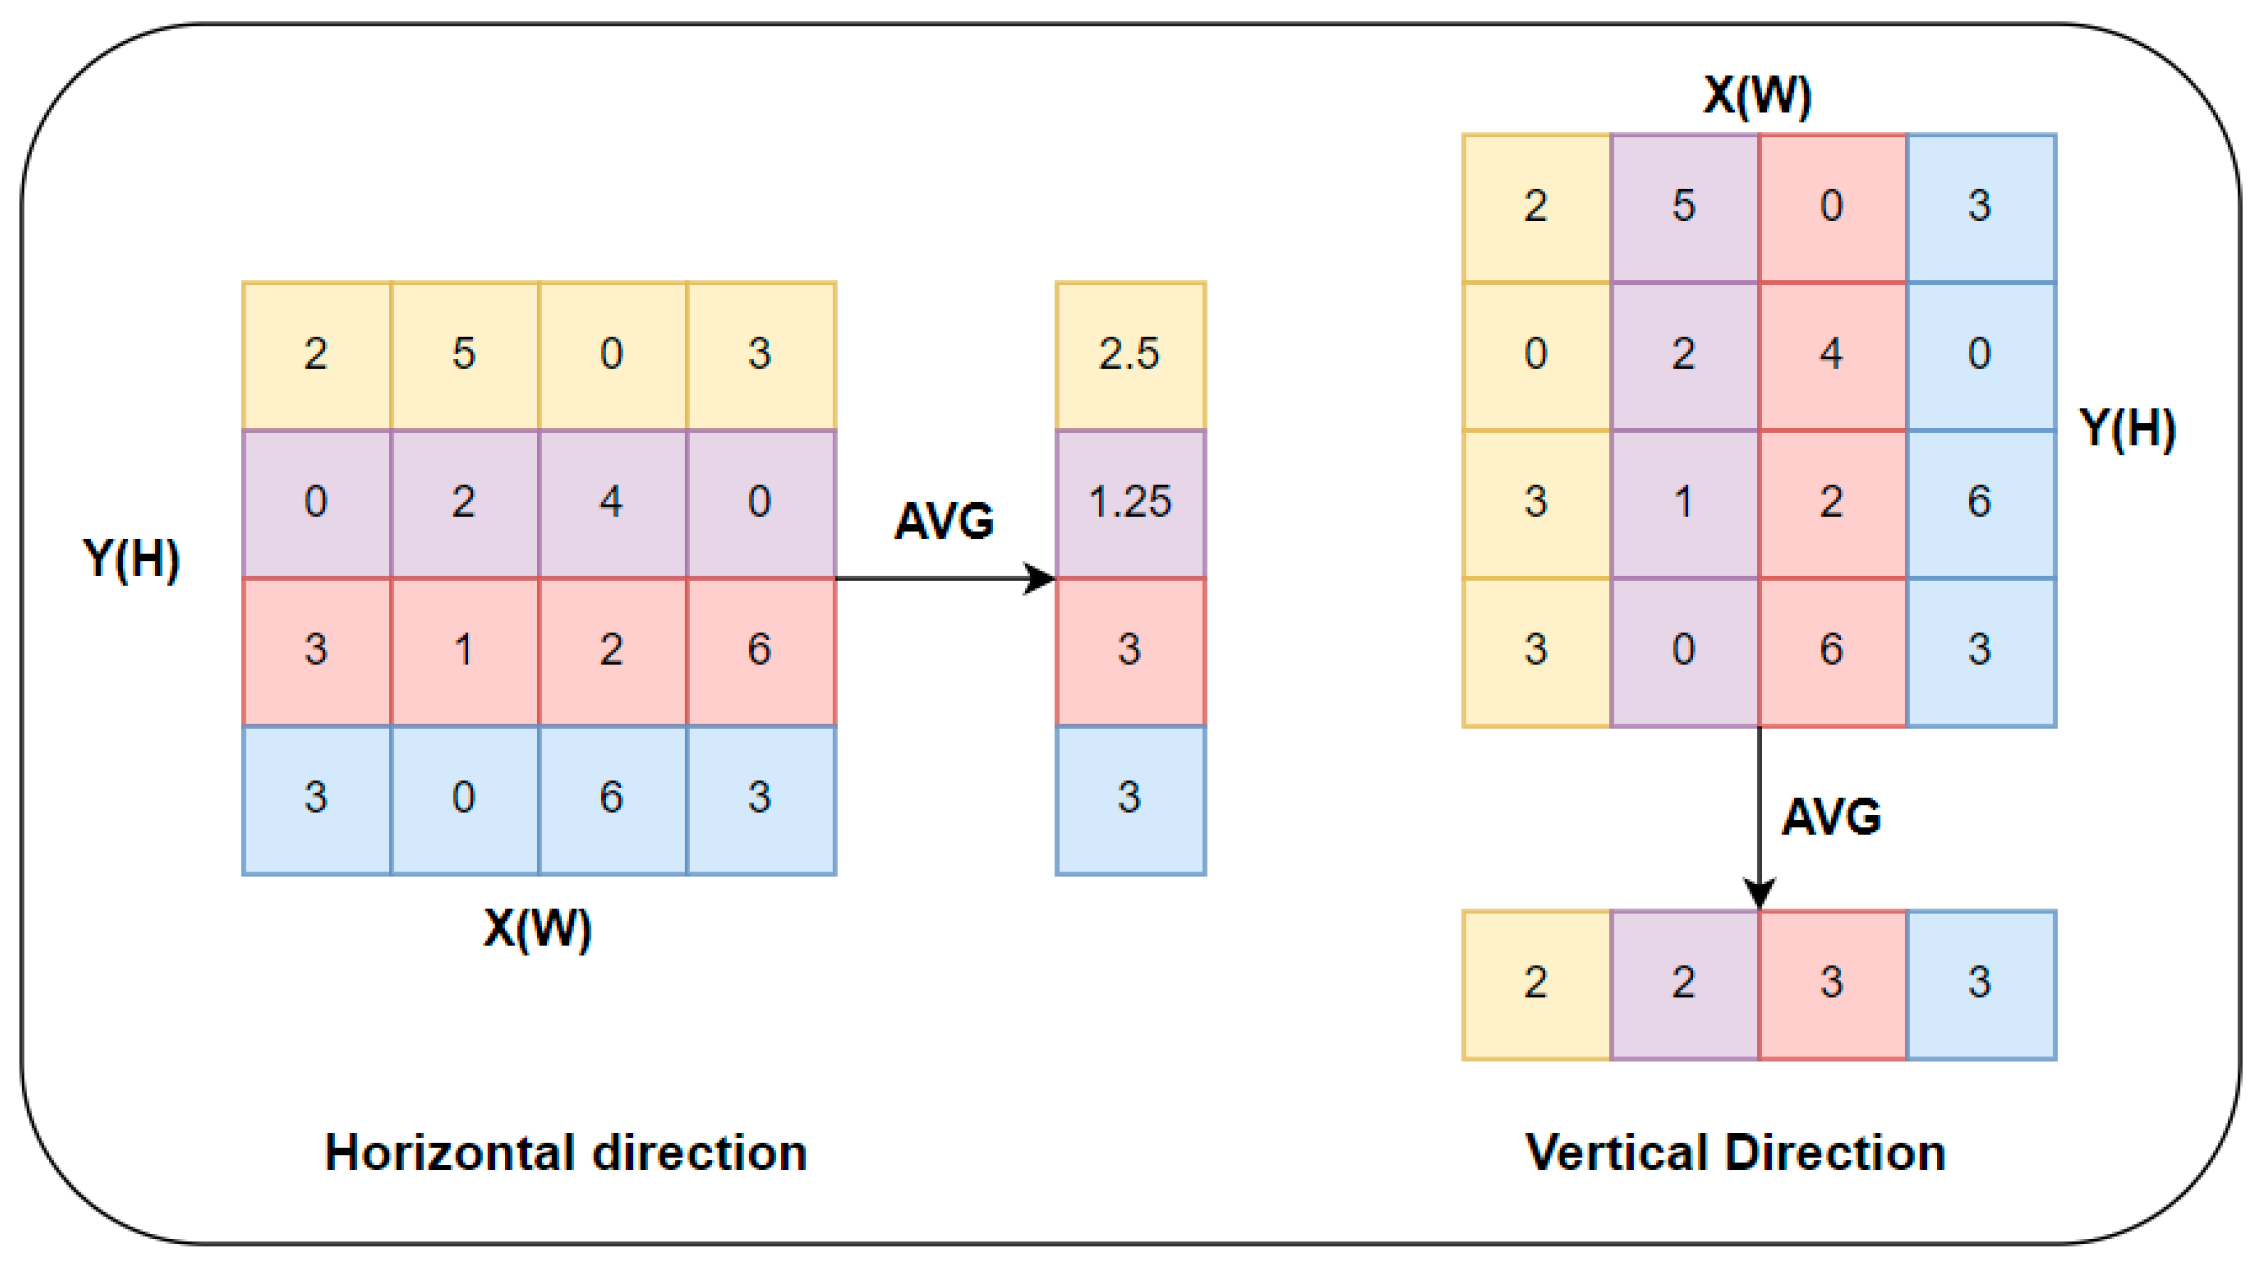
Small objects are often difficult to extract feature information from due to their small size and low resolution and are easily confused with the background in complex environments. Therefore, attention mechanisms are introduced to solve the problem of background interference, allowing small object information in image features to be better attended to. According to the different dimensions of the input multidimensional information, attention mechanisms can be divided into three types: spatial attention, channel attention, and spatial and channel mixed attention. Among them, the attention mechanism that mixes spatial and channel information achieves a more balanced effect between the two. This paper introduces the CA attention mechanism [32] that mixes spatial and channel information. The CA attention mechanism considers lightweight design principles, reducing both the number of parameters and computational complexity while also solving the problem of long-distance dependency in the spatial dimension. The CA attention mechanism mainly consists of three parts: information embedding, attention generation, and feature map correction. In the information embedding module, the input feature information is globally average-pooled in both the horizontal and vertical directions. The input feature map with a size of is pooled in the horizontal and vertical directions separately, resulting in feature maps with sizes and . The calculation process of global average pooling in the horizontal and vertical directions is shown in Equations (1) and (2), respectively.
The information embedding module structure diagram of the CA attention mechanism is shown in Figure 7.
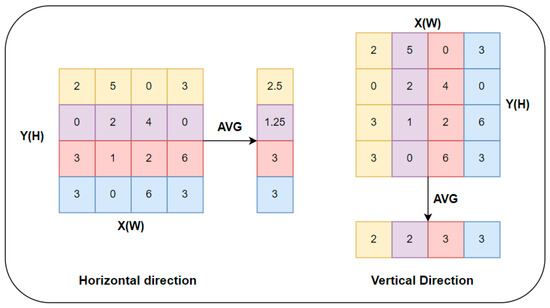
Figure 7.
Information embedding module architecture diagram.
The attention generation module concatenates the horizontally feature map and vertically feature map extracted from the information embedding module according to the spatial dimension and inputs them into the activation function after dimension reduction through 1 × 1 convolution. Next, the feature maps of the horizontal and vertical directions are separated according to the spatial dimension and input into the Sigmod activation function. Finally, two attention vectors in the horizontal and vertical directions are output. The calculation process is shown in Equation (3):
The feature map correction module expands the dimension of the attention vectors in the horizontal and vertical directions and performs element-wise multiplication between the expanded attention vectors and the feature map vectors to output the final attention feature. The concatenation of the feature information in the horizontal and vertical directions is beneficial for solving the problem of long-range dependencies. The element-wise multiplication operation between the feature information in the horizontal direction and vertical direction and the feature map is shown in Equation (4):
To enhance the performance of small object detection tasks, attention mechanism modules are added after the pyramid pooling layer in the feature extraction network and the last layer in the detection head network. Adding attention mechanisms after the pyramid pooling layer is beneficial for solving the problem of missing weight allocation for regions of interest during feature extraction. Adding attention mechanisms to the last layer of the detection head network is beneficial for the classification and regression operations of the detection heads of various scales in the subsequent steps. At the same time, adding attention mechanisms to the detection head network does not affect the use of pre-trained weight files and does not require complex and time-consuming pre-training processes for network structure changes.
3.4. Multi-Head Small Object Detection Layer
In the YOLOv5 algorithm, the default input resolution is 640 × 640, and the default downsampling strategy performs downsampling operations of 8×, 16×, and 32×. However, for small object datasets that mainly consist of medium and small-sized objects, the downsampling strategy needs to be adjusted correspondingly to better adapt to the small object dataset. After multiple downsampling operations in the network, a considerable amount of information is lost. This phenomenon is particularly severe for small objects with small resolutions and sizes. To compensate for the lost information due to multiple downsampling operations, a 4× downsampling small object detection layer can be added to improve the recognition and detection efficiency of small objects. By adding a four-detection head structure composed of 4× downsampling small object detection layers, the problem of missed detection of small objects by the network can be alleviated.
3.5. Decoupled Network Module
The detection head network is mainly used to complete the classification of object categories and the discrimination of object position and predicted box size. In the YOLOv5 algorithm for one-stage object detection and the Faster R-CNN algorithm for two-stage object detection, the detection head network combines the two tasks of object classification and bounding box regression through a coupled network, completing both classification and regression operations simultaneously.
Although the coupled network has advantages in improving the speed of the detection head network, due to the differences in the implementation principles of classification and bounding box regression tasks, improving the detection head network by decoupling can achieve branch processing for both tasks and improve the performance of both tasks. In the detection head network of the YOLOv5 algorithm, different sizes of coupled networks are used to predict objects of different sizes in the dataset. Based on the input of different image features, each input generates anchor boxes corresponding to the size of the object boxes in the dataset for the regression and positioning of predicted boxes. Each coupled network module contains a convolution module and a 1 × 1 convolution module, and the feature map is directly fed into the coupled network to generate objects position and class information output. The structure diagram of a single coupled network is shown in Figure 8.
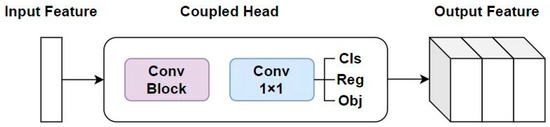
Figure 8.
Single Coupled network architecture diagram.
Unlike the structure of the coupled network, the decoupled network divides the network into classification branch modules and bounding box regression branch modules according to the different functions of the tasks. The bounding box regression branch module is further divided into object confidence module and bounding box prediction module. The decoupled network extracts object position and class information separately and learns them through branch structures. The basic module of the decoupled network consists of a standard convolution module, a batch normalization layer, and a SiLU activation function. In addition, there is also a 1 × 1 convolution module after the basic module. Finally, the classification module, object confidence module, and bounding box prediction module are combined in a concatenation manner to input three types of numerical information, namely classification loss function, confidence loss function, and bounding box regression loss function, to complete the classification and bounding box regression tasks. The structure diagram of the decoupled network is shown in Figure 9.
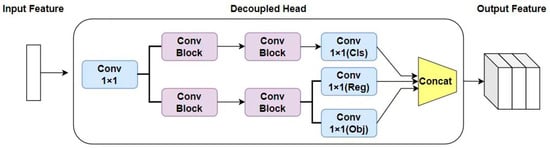
Figure 9.
Decoupled network architecture diagram.
3.6. Bounding Box Regression Loss Function
In detection head network, the loss function [33] is mainly divided into three types: classification loss function, bounding box regression loss function, and confidence loss function. The binary cross-entropy loss function is used for both classification loss function and confidence loss function to complete the classification of objects and calculation of object confidence values. In the regression process, the bounding box regression loss function plays an important role, but objects of different scales have different sensitivities to position deviation. For medium and large-sized objects, small position deviations have little effect on the intersection-over-union (IoU) value, while for small-sized objects, the position deviation between the predicted box and the ground truth box has a greater impact on the IoU value. Therefore, it is necessary to improve the bounding box regression loss function to achieve more accurate regression predictions for small-sized objects.
The default GIoU loss function used in the YOLOv5 algorithm successfully solves the problem of no overlap between the predicted box and the ground truth box in the IoU loss function by introducing the concept of minimum enclosing box. However, the GIoU loss function does not consider the spatial differences in the intersection area between the predicted box and the ground truth box, resulting in relatively slow convergence in both the horizontal and vertical directions. To address this issue, the DIoU loss function introduces the distance between the center points of the ground truth box and the predicted box and the impact of the diagonal of the two boxes on the loss calculation. Based on the DIoU loss function, the CIoU loss function adds the calculation of aspect ratio loss, which can effectively judge the predicted boxes located at the edges of the image. We introduce the integration of the DIoU and CIoU loss functions into the detection head network, in addition to the existing GIoU loss function, to account for spatial information and aspect ratio of bounding boxes.
The regression prediction process using the intersection-over-union (IoU) threshold generates a large number of predicted boxes. In the YOLOv5 algorithm, non-maximum suppression (NMS) is used to filter and select these candidate boxes. This method iteratively retains the predicted boxes with the highest scores and removes those with lower scores. Although NMS can effectively filter the predicted boxes, it has two main drawbacks. First, in the NMS algorithm, when the overlap between two predicted boxes exceeds the set threshold, neighboring predicted boxes are set to zero, which may cause undetected adjacent objects and reduce detection accuracy. Second, the threshold in the NMS algorithm is a hyperparameter that needs to be manually set. Setting a high threshold may increase the possibility of false positives, while setting a low threshold may cause missed detections. Especially in datasets with a large number of small objects that are concentrated, the phenomenon of missed detections due to overlapping predicted boxes is more obvious. Therefore, it is necessary to improve the NMS algorithm to update the way predicted boxes are filtered. In this paper, we introduce the DIoU-NMS algorithm [34], which improves the IoU threshold in the NMS algorithm to a DIoU threshold and includes the distance between the center points of the ground truth box and the predicted box in the calculation process to filter redundant predicted boxes. When two objects are too close, the predicted box closest to the center point of the ground truth box will be retained, and the predicted box far from the center point will be removed. The DIoU-NMS algorithm can achieve better detection performance in datasets with a large number of small objects that are concentrated, avoiding missed detections. When used in conjunction with the bounding box regression loss function that focuses on multidimensional information, it will achieve better detection results. is the classification confidence; is the NMS threshold; represents the candidate box with the highest confidence score, and checks for overlap between each box and high-confidence candidate boxes. The specific process of the DIoU-NMS algorithm is shown in Equation (5).
4. Experiments
4.1. Datasets
For small object detection tasks, it is important to choose an appropriate dataset for training. Although the COCO dataset [9] and PASCAL VOC dataset [35] have significant advantages in terms of object categories and dataset size, they are not suitable for small object detection tasks because the proportion of small objects in these datasets is relatively small and their distribution is uneven.
In this paper, we use the VisDrone2019-DET dataset [36] collected and produced by the AISKYEYE team at Tianjin University as the dataset for small object detection. This dataset includes aerial images captured by various styles of unmanned aerial vehicles in different cities. Some sample images from the dataset are shown in Figure 10.
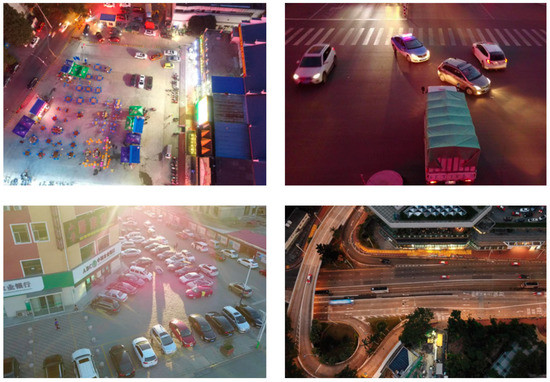
Figure 10.
Sample images from the dataset.
The VisDrone2019-DET dataset is composed of 10 distinct object categories, which include pedestrians, people, bicycles, cars, vans, trucks, buses, tricycles, motorized vehicles, and motorcycles. In order to more effectively distinguish between object sizes, the dataset has classified objects into three distinct categories, namely small, medium, and large, based on the size of the pixel side length within the image. Objects with a pixel side length less than 32 pixels are classified as small, while objects with a pixel side length between 32 and 96 pixels are categorized as medium. Objects with a pixel side length greater than 96 pixels are classified as large objects. Among these categories, small objects are the most prevalent in the dataset, accounting for up to 61% of the total objects. Medium and large objects account for 34% and 5% of the dataset, respectively. Upon analysis of the dataset, it can be observed that it is primarily composed of small objects, rendering it particularly well-suited for small object detection tasks. As such, this dataset holds high potential value in the development of accurate and efficient small object detection algorithms. The object count for each category is depicted in Figure 11.
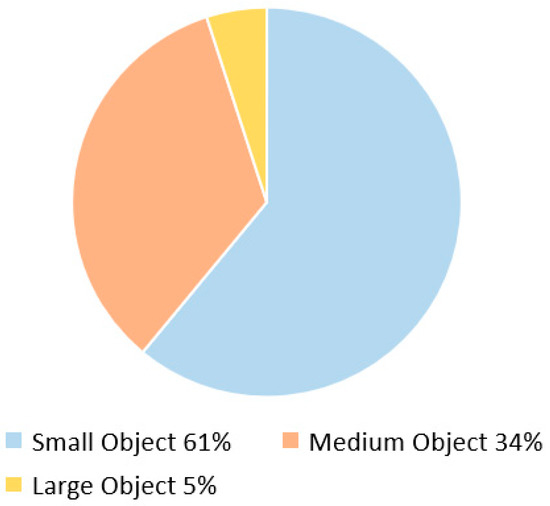
Figure 11.
Object count distribution diagram for the dataset.
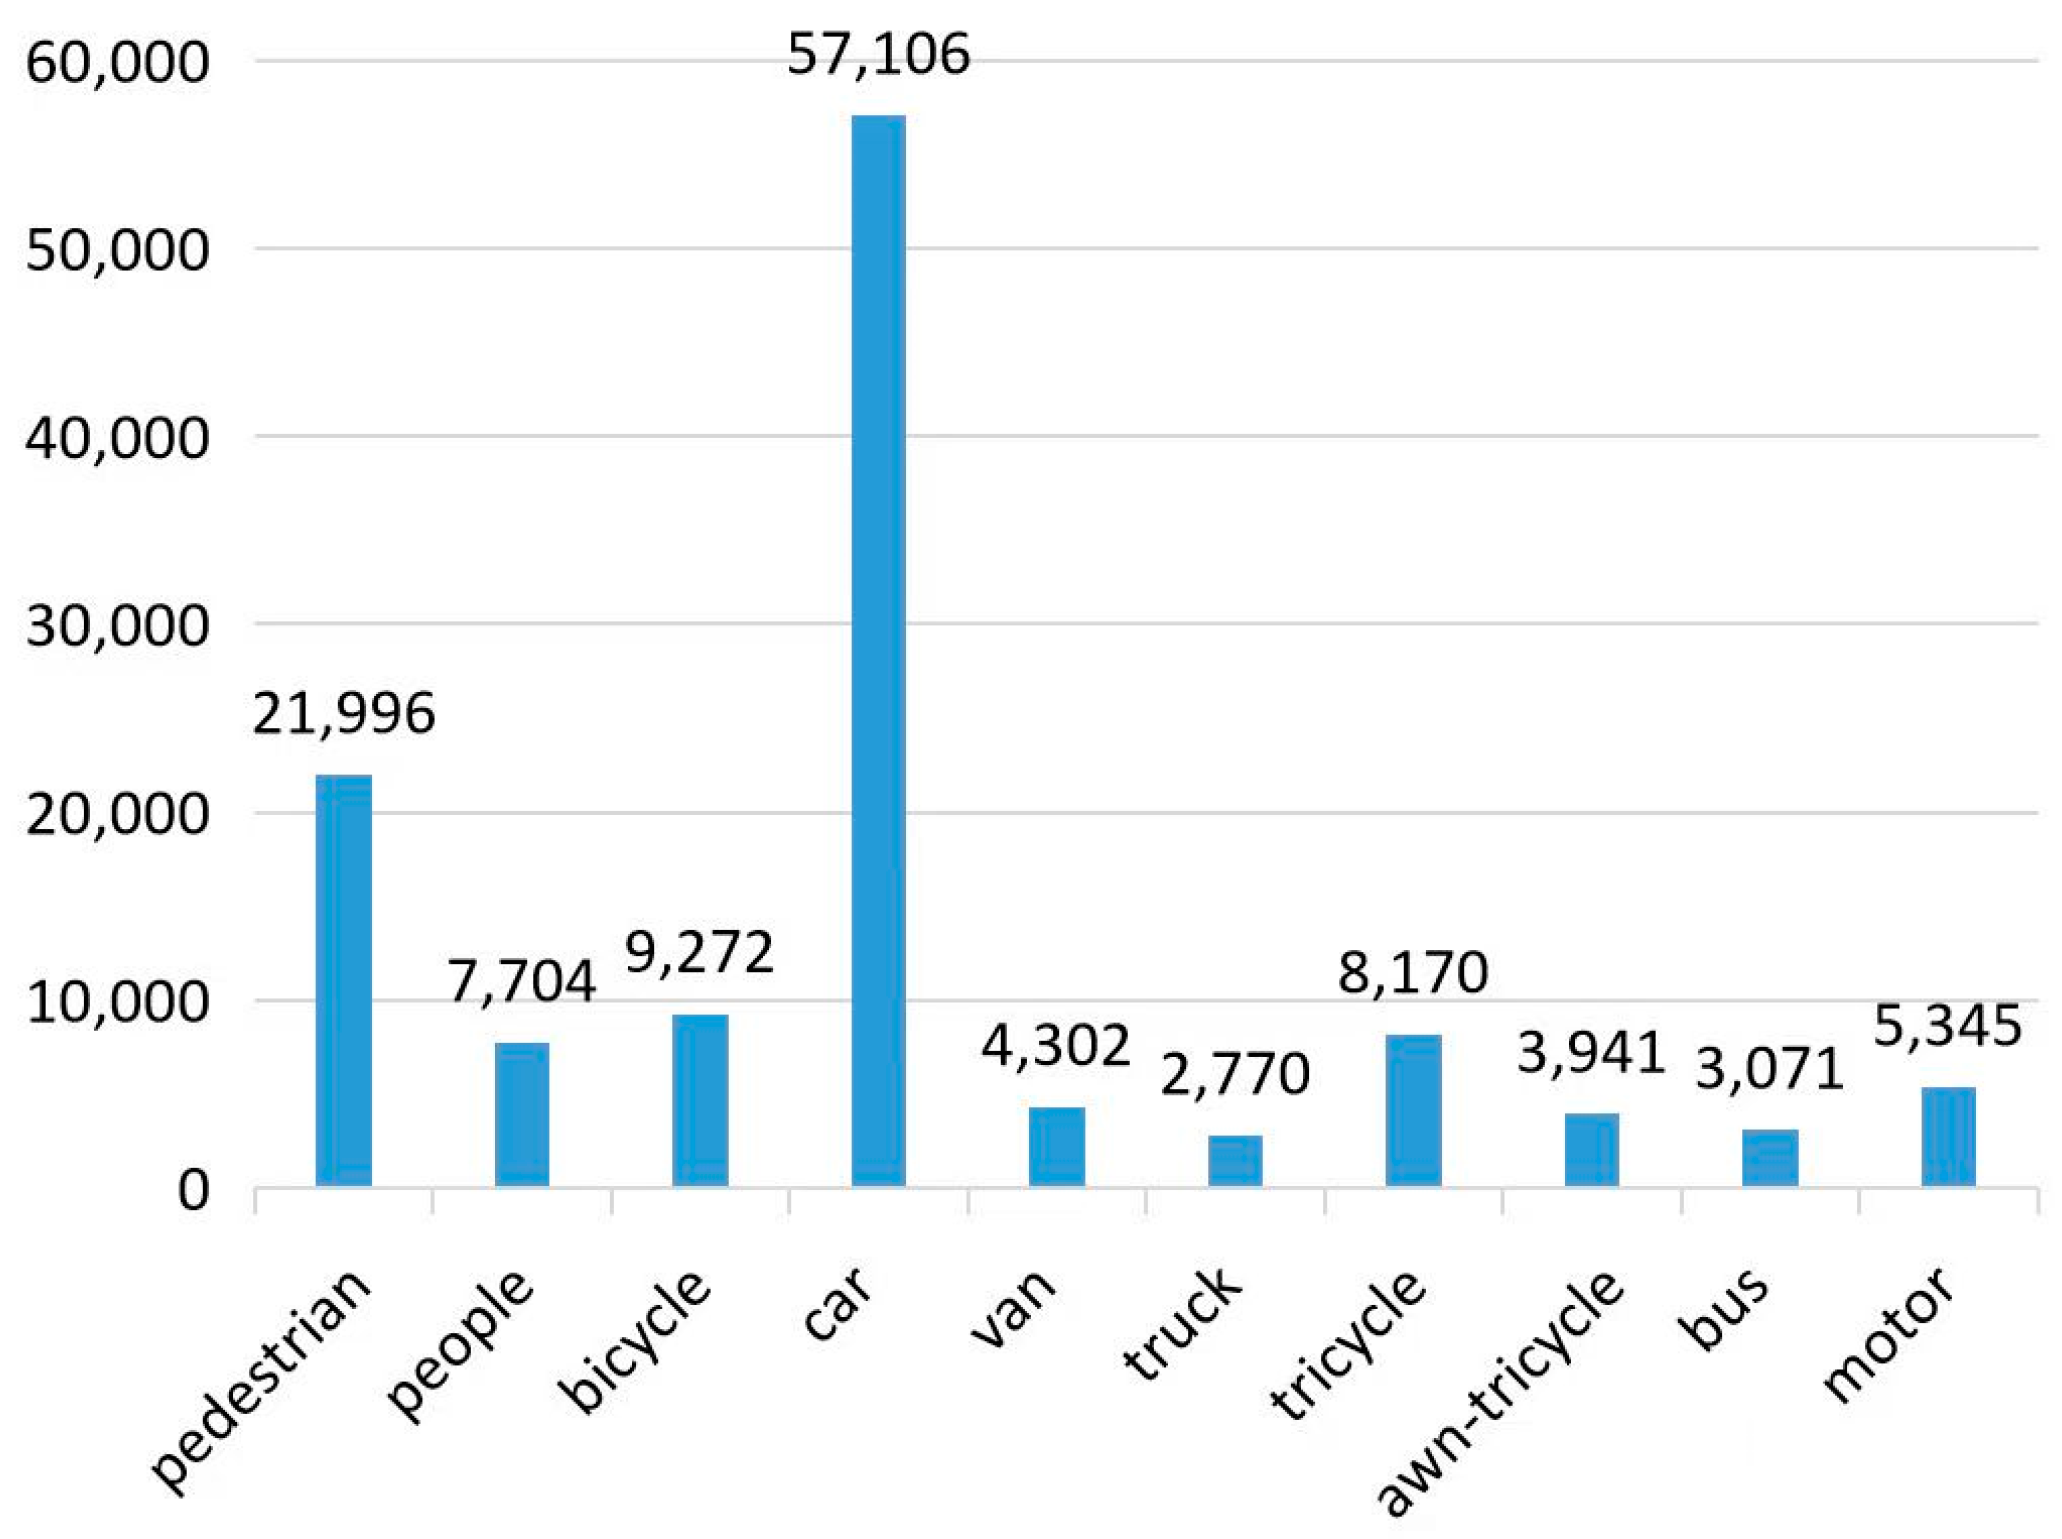
The VisDrone2019-DET dataset also has significant issues, one of which is the large discrepancy in the distribution of object categories. Specifically, the number of objects in the car and pedestrian categories is an order of magnitude higher than that in the truck, bus, and other categories. Such an imbalance in the number distribution may lead to a situation where the model’s detection performance for categories with fewer objects is inferior to that for categories with more objects in some object detection tasks. The distribution of object numbers in each category in the VisDrone2019-DET dataset is shown in Figure 12.
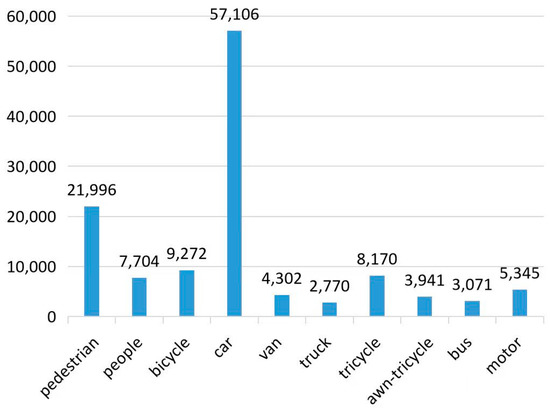
Figure 12.
Class count distribution diagram for the dataset.
4.2. Experimental Preparation
In object detection tasks, metrics such as precision, recall, average precision (AP), and mean average precision (mAP) are commonly used to evaluate the classification performance of algorithms.
The server used in this experiment runs on the Ubuntu 20.04 version of the Linux operating system. The training and testing GPUs are NVIDIA GeForce RTX3080 (10 GB); the CPU is an Intel @Core i7-11800H, and the memory is 32 GB. The experiment uses the PyTorch framework based on Torch, with a version of PyTorch 1.10 and Python version 3.9. The virtual environment required for the experiment is configured using Anaconda3, and scientific packages and dependencies are installed. By matching the versions of CUDA, CUDNN module, deep learning framework, and Python, the GPU is used to accelerate data processing and improve the efficiency of model training and testing.
4.3. Experimental Results and Analysis
4.3.1. Results and Analysis of Receptive Field Module
The main function of the spatial pyramid pooling module is to increase the receptive field of image features while maintaining image resolution, making the network more attentive to small objects with low resolution. In this paper, we introduced the receptive field module and built the YOLOv5_RFB model in the feature extraction network, which was compared and analyzed with the original model. The comparison of precision, recall, and mean average precision of the models is shown in Table 1. The YOLOv5_RFB model improved the mean average precision by 1.2% compared to the original model. The improvement in mean average precision is mainly due to the construction of receptive fields of different scales in the feature extraction process, which enables the network to extract features from objects of different sizes. The YOLOv5_RFB model can effectively enhance the attention to small objects with low resolution during the feature extraction process.

Table 1.
Performance comparison between the improved spatial pyramid pooling module and the original model (%).
4.3.2. Results and Analysis of Attention Mechanism Module
The addition of attention mechanism can optimize the problem of background interference to some extent, enabling the image to better focus on the information of small objects in the image features. In this section, we added the attention mechanism after the pyramid pooling layer in the feature extraction network and the last layer of the detection head network and built the YOLOv5_CA model. The CA attention mechanism considers the lightweight design principle based on the fusion of spatial and channel dimensions, resulting in a more balanced focus area.
The comparison of mean average precision shows that the YOLOv5_CA model improved by 2.5% compared to the original model. This improvement is attributed to the CA attention mechanism resolving the problem of long-range spatial dependencies and achieving higher recognition accuracy for various types of objects compared to the original model. In addition, the recall rate of the YOLOv5_CA model increased by 5.6% compared to the original model, indicating that the performance of the CA attention mechanism is superior to the original model in terms of missed objects. Therefore, the CA hybrid attention mechanism was selected to replace the original SE channel attention mechanism in the network. The performance comparison between YOLOv5_CA and the original model is shown in Table 2.
Table 2.
Performance comparison between the attention mechanism module and the original model (%).
4.3.3. Results and Analysis of Small Object Detection Layer
We introduced the K-means clustering algorithm and a genetically adaptive algorithm to update the anchor box data in the object dataset. At the same time, we added a 4x downsampled small object detection layer to compensate for the loss of small object details in the network after multiple downsampling operations. We built the YOLOv5_4P model with the 4× downsampled small object detection layer and compared its performance with the original model, as shown in Table 3. The data in the table show that the YOLOv5_4P model improved the mean average precision by 3.4% compared to the original model after introducing the small object detection layer, and the precision and recall rate increased by 3% and 7.1%, respectively. The 4x downsampled small object detection layer significantly improves the ability to extract small object features. In summary, the YOLOv5_4P model is helpful in improving the accuracy of the model and reducing false positives and false negatives.
Table 3.
Performance comparison between the small object detection layer module and the original model (%).
4.3.4. Results and Analysis of Decoupled Network
We improved the four-layer coupled network on the detection head into a decoupled network and built the YOLOv5_Decoupled model. The decoupled network divides the network into classification and prediction box regression branches according to different task functions. By improving the branch structure of the detection head network, we achieved an increase in mean average precision with a small increase in the number of model parameters. We also verified the impact of input image resolution on small object detection ability by changing the input image resolution. The performance comparison between YOLOv5_Decoupled model and the original model on the test set is shown in Table 4. The comparison of mean average precision shows that the YOLOv5_Decoupled model with input images of 640 pixels and 1280 pixels improved the mean average precision by 5.1% and 8%, respectively, compared to the original model. This indicates that improving the decoupled network can effectively improve the accuracy of small object detection. This also demonstrates that with the increase of input image resolution, the network will be more advantageous for the recognition of small objects. Introducing the decoupled network into the detection head can effectively improve the model’s detection accuracy.
Table 4.
Performance comparison of the decoupled detection head network on the datasets (%).
4.3.5. Results and Analysis of Boundary Box Loss Function and NMS Algorithm
By introducing the DIoU loss function on the basis of the GIoU loss function in the YOLOv5 model, the loss function can focus on the distance between the center points of the true box and the predicted box, as well as the impact of the diagonal lines of the two boxes on the loss calculation. The introduction of the CIoU loss function considers the overlapping area, center point distance, and aspect ratio in the geometric parameter dimension, which increases the calculation of the object aspect ratio loss in the loss function and greatly improves the recognition ability of edge objects. We constructed the YOLOv5_DIoU model and the YOLOv5_CIoU model for comparative analysis with the original model, but the effects of both models were not significant. The main reason is that most of the objects in the dataset are composed of medium and small objects, and there is still room for improvement in the prediction box filtering strategy. Therefore, we improved the NMS algorithm on the basis of the existing model and introduced the DIoU-NMS algorithm to construct the YOLOv5_CIoU_DIoU-NMS model. This new model can achieve good detection results in small objects with concentrated distribution and overlapping occlusion, avoiding the occurrence of missed detection. According to the experimental results, the YOLOv5_CIoU_D-NMS model improved the mean average precision by 4.2% compared to the original model, and the improvement of the loss function and NMS algorithm is shown in the performance comparison on the test set in Table 5.
Table 5.
Performance comparison of the improved loss function and NMS algorithm on the datasets (%).
4.3.6. Ablation Experiments and Results Analysis
Based on the YOLOv5 original model, we improved the spatial pyramid pooling module in the feature extraction network, the attention mechanism before and after the feature fusion network, and the detection head network. By combining the optimal models from each part of the previous experiments, we proposed the DMS-YOLOv5 model. We compared the performance of the DMS-YOLOv5 model with the original model and other models. The results of the comparison are shown in Table 6, where Method 1 to Method 5 represent each model improvement. The mean average precision of the DMS-YOLOv5 model improved by 12.1% compared to the original model. The precision has improved by 10% compared to the original model, leading to a significant enhancement in the recognition ability for various objects. The recall rate has also increased by 17.4% compared to the original model, reducing the occurrence of missed detections for different types of objects. The comparison of the three metrics, precision, recall, and mean average precision, can be clearly seen in Figure 13.
Table 6.
Performance comparison of ablation experiment results on the dataset (%).
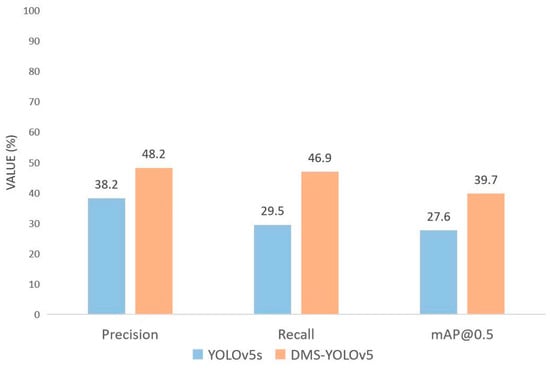
Figure 13.
Performance comparison between DMS-YOLOv5 and YOLOv5s.
After the improvement and analysis of each level of the network, we summarized the following rules:
- (1)
- The multi-scale receptive field in the feature extraction network can be used to achieve feature extraction tasks for different scale objects, especially for small object datasets, where multi-scale receptive field can give more attention to low-resolution small objects.
- (2)
- The introduction of the channel and spatial attention CA mechanism further reduces the parameter and computational complexity of the attention mechanism.
- (3)
- The introduction of the small object detection layer solves the problem of the loss of detailed information of low-resolution small objects due to the high sampling multiple in the downsampling process.
- (4)
- The decoupled network is introduced into the detection head network to achieve branch processing for classification and boundary box regression tasks, improving the detection accuracy and efficiency of the two tasks.
- (5)
- Improving the boundary box loss function and NMS algorithm can alleviate the problem of missed detection caused by the concentration of small objects and the mutual occlusion between objects.
In summary, the DMS-YOLOv5 model has shown good performance in mean average precision, precision, and recall.
4.4. Method Performance Demonstration
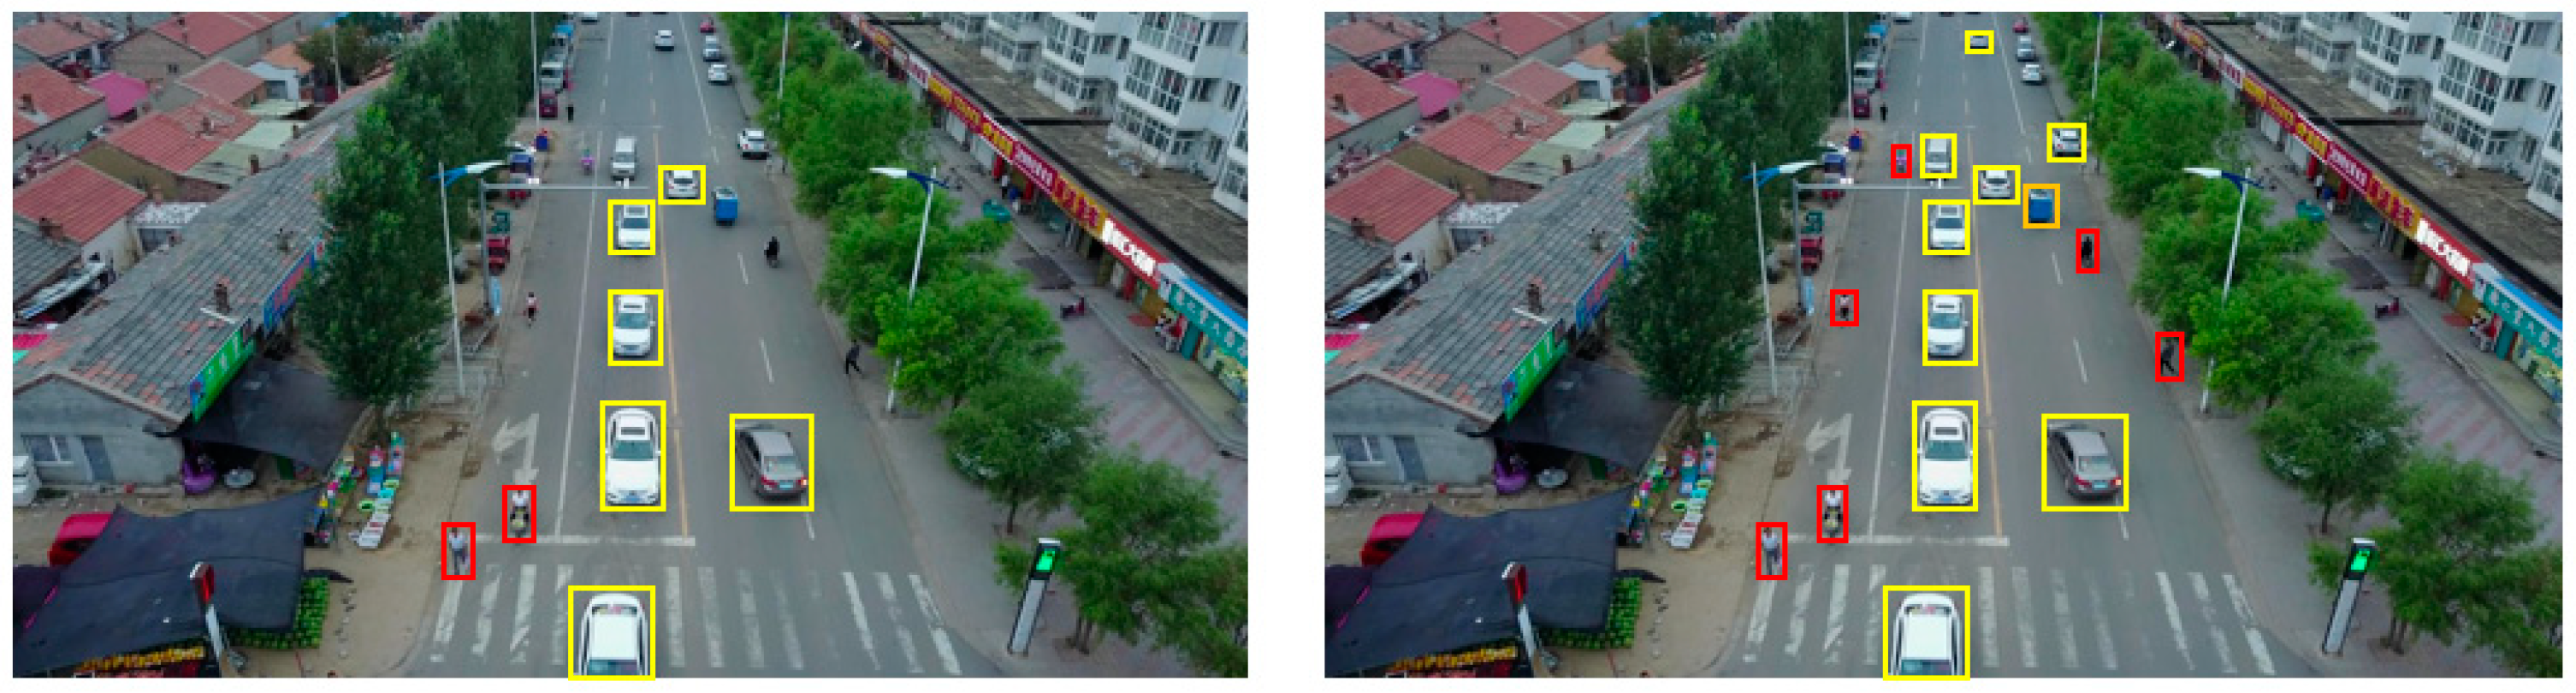
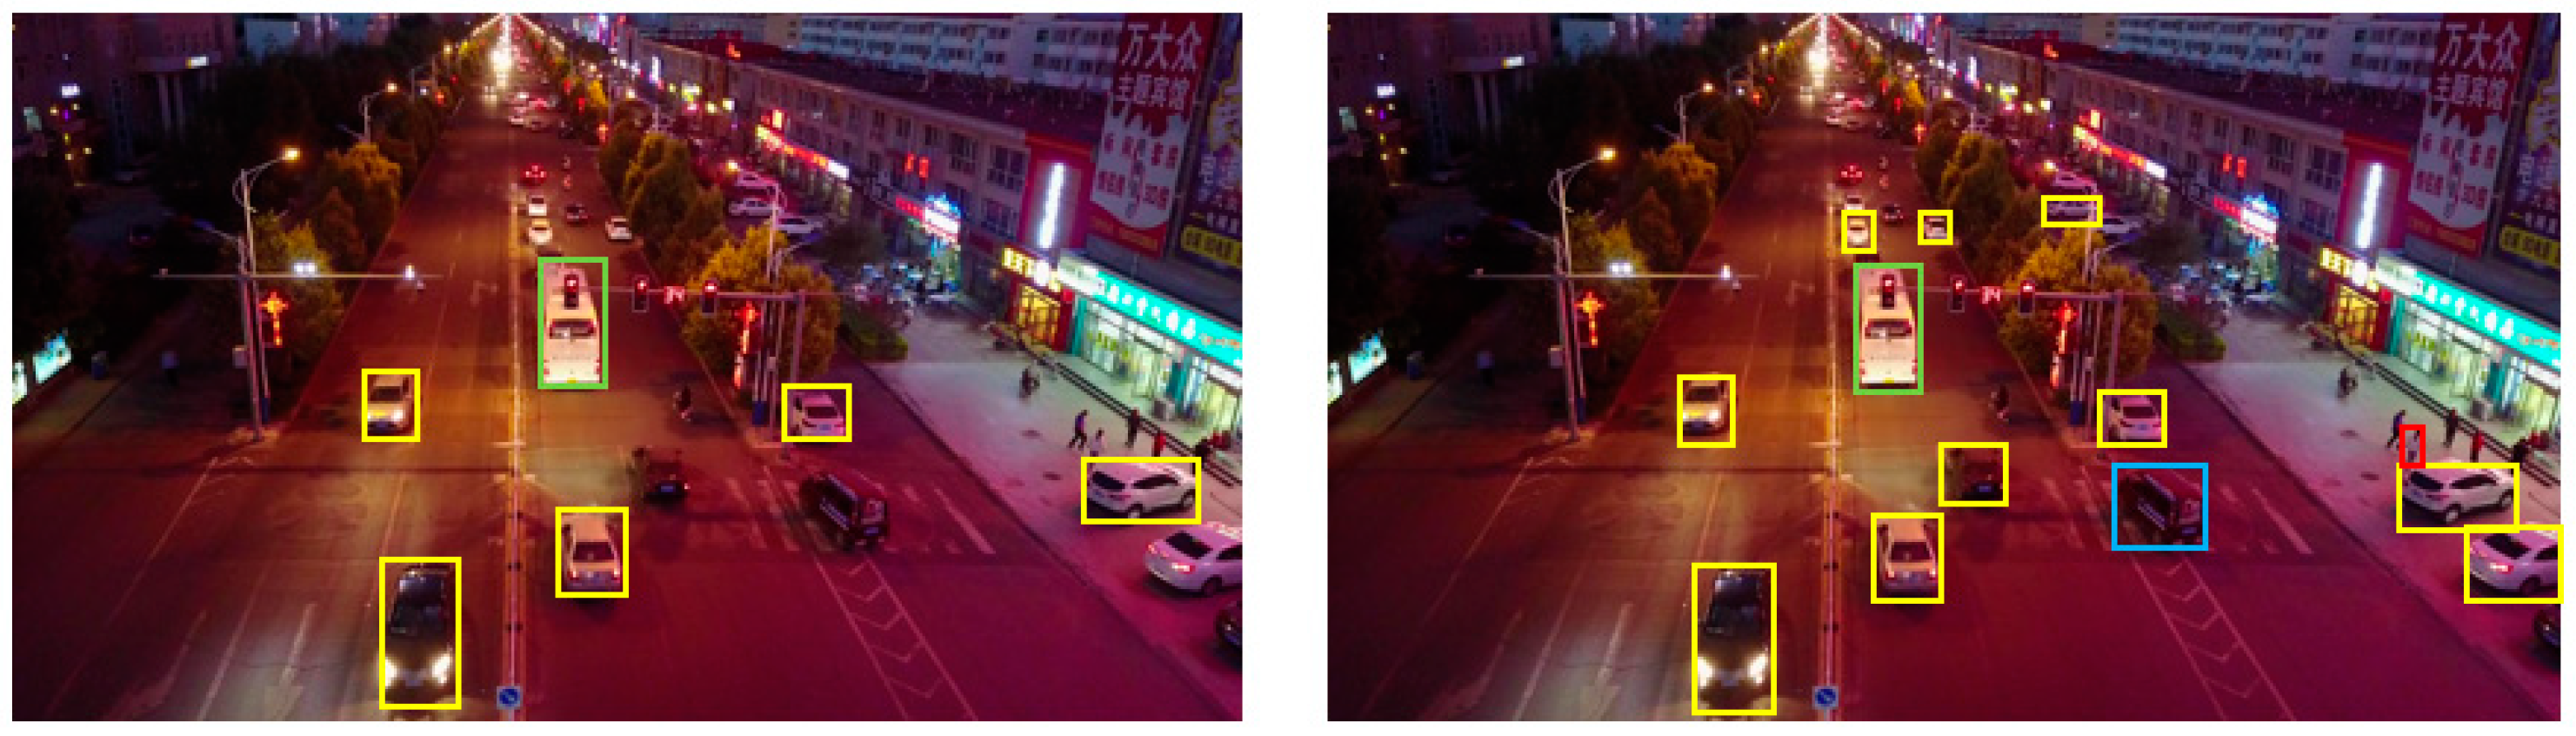
The detection performance of the DMS-YOLOv5 model and the original model on the VisDrone2019-DET dataset is shown in Figure 14, Figure 15 and Figure 16. The objects inside yellow boxes are cars, those inside red boxes are pedestrians, those inside orange boxes are tricycles, those inside blue boxes are vans, those inside light green boxes are buses, and those inside dark green boxes are trucks. By selecting images with adequate lighting conditions, images with insufficient nighttime lighting conditions, and dense small object images for comparative analysis of the two models, the actual effect of the model improvement can be intuitively judged through comparative testing of the same sample. In the original model, the recognition effect of small objects was poor due to insufficient attention to small objects in the feature extraction process and the high downsampling multiple of the detection head network. There were also serious missed detection cases, especially in low-resolution pedestrians and distant vehicles. Under the DMS-YOLOv5 model, the problem of missed detection of small objects has been improved. Another problem is the common problem of overlapping small objects in aerial images, which seriously affects the model’s detection of small objects. The original model lacks the ability to distinguish between foreground and background, often mixing foreground and background that are difficult to discriminate. By introducing the attention mechanism, the DMS-YOLOv5 model can obtain more attention to foreground information from both the spatial and channel dimensions, enabling the model to obtain more accurate classification information and prediction box location that is closer to the true box.
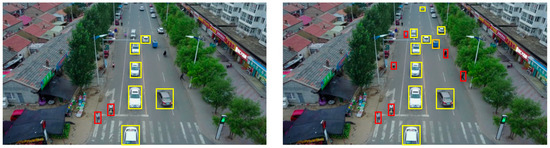
Figure 14.
Comparison diagram between the original model and the optimal model under sufficient lighting conditions.

Figure 15.
Comparison diagram between the original model and the optimal model under insufficient lighting conditions at night.
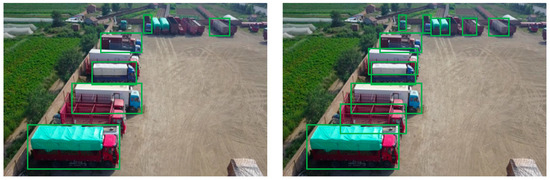
Figure 16.
Comparison diagram between the original model and the optimal model under dense distribution of small objects.
4.5. Comparative Experiments with Similar Methods
Using the test set of VisDrone2019-DET, we compared the performance of YOLOv3, YOLOv5, the newer single-stage object detection algorithm YOLOv7, and DMS-YOLOv5 models with input data of the same specification, 640×640 resolution. The comparison results on the datasets are shown in Table 7. According to the data in the table, the mean average precision of the DMS-YOLOv5 model is higher than that of YOLOv3, YOLOv5, and YOLOv7, by 14%, 12.1%, and 8.5%, respectively. The DMS-YOLOv5 model has better overall performance than the other models.
Table 7.
Performance comparison of different algorithms on the datasets (%).
On the VisDrone2019-DET dataset, the detection results of various object detection algorithms on the same images are shown in Figure 17. Through visual comparative analysis, it can be seen that the YOLOv3 and YOLOv5 models have poor detection performance for small objects and concentrated objects, and there are serious missed detection phenomena for pedestrians and distant vehicles. The YOLOv7 model benefits from the distribution advantage of the two-stage object detection algorithm, which performs bounding box regression before object classification, and the detection performance of objects in the image center region is more obvious. However, for objects in the edge region, the regression and classification performance of the YOLOv7 model is significantly weaker than that of the DMS-YOLOv5 model. The DMS-YOLOv5 model has better detection performance for small objects and concentrated objects than other models of the same type and has better overall detection performance.
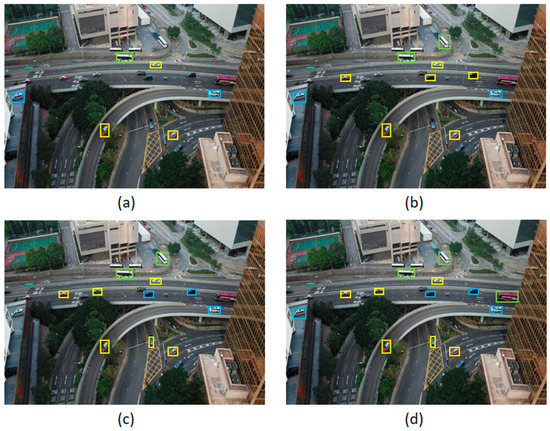
Figure 17.
Detection results of different algorithms in image examples. Subfigures show the detection results of (a) YOLOv3, (b) YOLOv5, (c) YOLOv7, and (d) DMS-YOLOv5 algorithms.
5. Conclusions
In this paper, we propose an improved YOLOv5 algorithm, named DMS-YOLOv5, to address the problem of insufficient semantic information extraction caused by small object sizes and low resolutions. The proposed method introduces the receptive field module in the feature extraction network. The CA attention mechanism, which combines spatial and channel attention information, is introduced in the feature extraction and feature fusion networks to reduce the interference of background information on object features and focus on the important information of the object. Additionally, a small object detection layer is added to compensate for the loss of small object information during multiple downsampling operations. Furthermore, the detection head network is improved using a decoupling network, which enhances the performance of the classification and bounding box regression tasks. Finally, the bounding box regression loss function and NMS algorithm are optimized to effectively alleviate missed detection caused by the concentration of small objects and mutual occlusion between objects. With these improvements, the proposed method achieves effective improvement in small object detection accuracy.
In the future, the detection performance of small objects will be significantly impacted by complex and diverse real-world scenarios. To mitigate the effects of sample distribution differences between datasets, transfer learning can be applied using small object datasets from various scenarios. Furthermore, when new domain-specific datasets become available, pre-trained models can be leveraged for efficient and rapid adaptation to the new dataset, thereby enhancing the detection performance of small objects in the new domain.
Author Contributions
Conceptualization, T.G. and M.W.; methodology, T.G.; software, T.G.; validation, T.G.; investigation, T.G.; resources, T.G.; writing—original draft preparation, T.G.; writing—review and editing, T.G., M.W. and G.T.; visualization, T.G.; project administration, T.G.; funding acquisition, M.W. and G.T. All authors have read and agreed to the published version of the manuscript.
Funding
This work was supported in part by the Natural Science Foundation of Autonomous Region under Grant 2021D01C118, and in part by the Autonomous Region High-Level Innovative Talent Project under Grant 042419006.
Institutional Review Board Statement
Not applicable.
Informed Consent Statement
Not applicable.
Data Availability Statement
The datasets we used in this paper are publicly available, including VisDrone2019-DET.
Conflicts of Interest
The authors declare no conflict of interest.
References
- Voulodimos, A.; Doulamis, N.; Doulamis, A.; Protopapadakis, E. Deep learning for computer vision: A brief review. Comput. Intell. Neurosci. 2018, 2018, 7068349. [Google Scholar] [CrossRef] [PubMed]
- Zou, Z.; Chen, K.; Shi, Z.; Guo, Y.; Ye, J. Object detection in 20 years: A survey. Proc. IEEE 2023, 111, 257–276. [Google Scholar] [CrossRef]
- Dalal, N.; Triggs, B. Histograms of oriented gradients for human detection. In Proceedings of the 2005 IEEE Computer Society Conference on Computer Vision and Pattern Recognition (CVPR’05), San Diego, CA, USA, 20 June 2005; IEEE: New York, NY, USA, 2005; Volume 1, pp. 886–893. [Google Scholar]
- Bay, H.; Ess, A.; Tuytelaars, T.; Van Gool, L. Speeded-up robust features (SURF). Comput. Vis. Image Underst. 2008, 110, 346–359. [Google Scholar] [CrossRef]
- Liu, Y.; Sun, P.; Wergeles, N.; Shang, Y. A survey and performance evaluation of deep learning methods for small object detection. Expert Syst. Appl. 2021, 172, 114602. [Google Scholar] [CrossRef]
- Li, K.; Wan, G.; Cheng, G.; Meng, L.; Han, J. Object detection in optical remote sensing images: A survey and a new benchmark. ISPRS J. Photogramm. Remote Sens. 2020, 159, 296–307. [Google Scholar] [CrossRef]
- Ramachandran, A.; Sangaiah, A.K. A review on object detection in unmanned aerial vehicle surveillance. Int. J. Cogn. Comput. Eng. 2021, 2, 215–228. [Google Scholar] [CrossRef]
- Hnewa, M.; Radha, H. Object detection under rainy conditions for autonomous vehicles: A review of state-of-the-art and emerging techniques. IEEE Signal Process. Mag. 2020, 38, 53–67. [Google Scholar] [CrossRef]
- Lin, T.Y.; Maire, M.; Belongie, S.; Hays, J.; Perona, P.; Ramanan, D.; Dollár, P.; Zitnick, C.L. Microsoft coco: Common objects in context. In Proceedings of the Computer Vision–ECCV 2014: 13th European Conference, Zurich, Switzerland, 6–12 September 2014; Springer International Publishing: Cham, Switzerland, 2014; pp. 740–755. [Google Scholar]
- Wang, P.; Bayram, B.; Sertel, E. A comprehensive review on deep learning based remote sensing image super-resolution methods. Earth-Sci. Rev. 2022, 232, 104110. [Google Scholar] [CrossRef]
- Gui, J.; Sun, Z.; Wen, Y.; Tao, D.; Ye, J. A review on generative adversarial networks: Algorithms, theory, and applications. IEEE Trans. Knowl. Data Eng. 2021, 35, 3313–3332. [Google Scholar] [CrossRef]
- Sun, Y.; Weng, Y.; Luo, B.; Li, G.; Tao, B.; Jiang, D.; Chen, D. Gesture recognition algorithm based on multi-scale feature fusion in RGB-D images. IET Image Process. 2023, 17, 1280–1290. [Google Scholar] [CrossRef]
- Wang, M.; Yang, W.; Wang, L.; Chen, D.; Wei, F.; KeZiErBieKe, H.; Liao, Y. FE-YOLOv5: Feature enhancement network based on YOLOv5 for small object detection. J. Vis. Commun. Image Represent. 2023, 90, 103752. [Google Scholar] [CrossRef]
- Jiang, W.; Schotten, H.D. Neural network-based fading channel prediction: A comprehensive overview. IEEE Access 2019, 7, 118112–118124. [Google Scholar] [CrossRef]
- Liu, T.; Luo, R.; Xu, L.; Feng, D.; Cao, L.; Liu, S.; Guo, J. Spatial Channel Attention for Deep Convolutional Neural Networks. Mathematics 2022, 10, 1750. [Google Scholar] [CrossRef]
- Sultana, F.; Sufian, A.; Dutta, P. A review of object detection models based on convolutional neural network. Intell. Comput. Image Process. Based Appl. 2020, 1157, 1–16. [Google Scholar]
- Du, L.; Zhang, R.; Wang, X. Overview of two-stage object detection algorithms. J. Phys. Conf. Ser. 2020, 1544, 012033. [Google Scholar] [CrossRef]
- Girshick, R.; Donahue, J.; Darrell, T.; Malik, J. Rich feature hierarchies for accurate object detection and semantic segmentation. In Proceedings of the IEEE Conference on Computer Vision and Pattern Recognition, Columbus, OH, USA, 23–28 June 2014; pp. 580–587. [Google Scholar]
- Girshick, R. Fast r-cnn. In Proceedings of the IEEE International Conference on Computer Vision, Washington, DC, USA, 7–13 December 2015; pp. 1440–1448. [Google Scholar]
- Ren, S.; He, K.; Girshick, R.; Sun, J. Faster R-CNN: Towards real-time object detection with region proposal networks. In Proceedings of the Advances in Neural Information Processing Systems 28: Annual Conference on Neural Information Processing Systems 2015, Montreal, QC, Canada, 7–12 December 2015. [Google Scholar]
- Lin, T.Y.; Dollár, P.; Girshick, R.; He, K.; Hariharan, B.; Belongie, S. Feature pyramid networks for object detection. In Proceedings of the IEEE Conference on Computer Vision and Pattern Recognition, Honolulu, HI, USA, 21–26 July 2017; pp. 2117–2125. [Google Scholar]
- Cai, Z.; Vasconcelos, N. Cascade r-cnn: Delving into high quality object detection. In Proceedings of the IEEE Conference on Computer Vision and Pattern Recognition, Salt Lake City, UT, USA, 18–22 June 2018; pp. 6154–6162. [Google Scholar]
- Lu, X.; Li, B.; Yue, Y.; Li, Q.; Yan, J. Grid r-cnn. In Proceedings of the IEEE/CVF Conference on Computer Vision and Pattern Recognition, Long Beach, CA, USA, 15–20 June 2019; pp. 7363–7372. [Google Scholar]
- Redmon, J.; Divvala, S.; Girshick, R.; Farhadi, A. You only look once: Unified, real-time object detection. In Proceedings of the IEEE Conference on Computer Vision and Pattern Recognition, Las Vegas, NV, USA, 26 June–1 July 2016; pp. 779–788. [Google Scholar]
- Liu, W.; Anguelov, D.; Erhan, D.; Szegedy, C.; Reed, S.; Fu, C.Y.; Berg, A.C. SSD: Single shot multibox detector. In Proceedings of the Computer Vision–ECCV 2016: 14th European Conference, Amsterdam, The Netherlands, 11–14 October 2016; Springer International Publishing: Cham, Switzerland, 2016; pp. 21–37. [Google Scholar]
- Redmon, J.; Farhadi, A. YOLO9000: Better, faster, stronger. In Proceedings of the IEEE Conference on Computer Vision and Pattern Recognition, Honolulu, HI, USA, 21–26 July 2017; pp. 7263–7271. [Google Scholar]
- Redmon, J.; Farhadi, A. YOLOv3: An incremental improvement. arXiv 2018, arXiv:1804.02767. [Google Scholar]
- Bochkovskiy, A.; Wang, C.Y.; Liao, H.Y.M. Yolov4: Optimal speed and accuracy of object detection. arXiv 2020, arXiv:2004.10934. [Google Scholar]
- Wang, J.; Chen, Y.; Dong, Z.; Gao, M. Improved YOLOv5 network for real-time multi-scale traffic sign detection. Neural Comput. Appl. 2022, 35, 7853–7865. [Google Scholar] [CrossRef]
- Li, C.; Li, L.; Jiang, H.; Weng, K.; Geng, Y.; Li, L.; Ke, Z.; Li, Q.; Cheng, M.; Nie, W.; et al. YOLOv6: A single-stage object detection framework for industrial applications. arXiv 2022, arXiv:2209.02976. [Google Scholar]
- Wang, C.Y.; Bochkovskiy, A.; Liao, H.Y.M. YOLOv7: Trainable bag-of-freebies sets new state-of-the-art for real-time object detectors. arXiv 2022, arXiv:2207.02696. [Google Scholar]
- Hou, Q.; Zhou, D.; Feng, J. Coordinate attention for efficient mobile network design. In Proceedings of the IEEE/CVF Conference on Computer Vision and Pattern Recognition, Nashville, TN, USA, 20 June–25 June 2021; pp. 13713–13722. [Google Scholar]
- Ciampiconi, L.; Elwood, A.; Leonardi, M.; Mohamed, A.; Rozza, A. A survey and taxonomy of loss functions in machine learning. arXiv 2023, arXiv:2301.05579. [Google Scholar]
- Zheng, Z.; Wang, P.; Liu, W.; Li, J.; Ye, R.; Ren, D. Distance-IoU loss: Faster and better learning for bounding box regression. In Proceedings of the AAAI Conference on Artificial Intelligence, New York, NY, USA, 7–12 February 2020; Volume 34, pp. 12993–13000. [Google Scholar]
- Everingham, M.; Eslami, S.A.; Van Gool, L.; Williams, C.K.; Winn, J.; Zisserman, A. The pascal visual object classes challenge: A retrospective. Int. J. Comput. Vis. 2015, 111, 98–136. [Google Scholar] [CrossRef]
- Du, D.; Zhu, P.; Wen, L.; Bian, X.; Ling, H.; Hu, Q.; Zheng, J.; Peng, T.; Wang, X.; Zhang, Y.; et al. VisDrone-SOT2019: The vision meets drone single object tracking challenge results. In Proceedings of the IEEE/CVF International Conference on Computer Vision Workshops, Seoul, Republic of Korea, 27 October–2 November 2019. [Google Scholar]


Disclaimer/Publisher’s Note: The statements, opinions and data contained in all publications are solely those of the individual author(s) and contributor(s) and not of MDPI and/or the editor(s). MDPI and/or the editor(s) disclaim responsibility for any injury to people or property resulting from any ideas, methods, instructions or products referred to in the content. |
© 2023 by the authors. Licensee MDPI, Basel, Switzerland. This article is an open access article distributed under the terms and conditions of the Creative Commons Attribution (CC BY) license (https://creativecommons.org/licenses/by/4.0/).