Article

SAR Image Aircraft Target Recognition Based on Improved YOLOv5

1
College of Electrical and Information Engineering, Changchun University of Science and Technology, Changchun 130022, China
2
College of Electrical and Information Engineering, Beihua University, Jilin 132013, China
3
Aerospace Information Research Institute, Chinese Academy of Sciences, Beijing 100045, China
*
Author to whom correspondence should be addressed.
Appl. Sci. 2023, 13(10), 6160; https://doi.org/10.3390/app13106160
Submission received: 17 April 2023 / Revised: 14 May 2023 / Accepted: 16 May 2023 / Published: 17 May 2023

Abstract

:
Synthetic aperture radar (SAR) is an active ground-surveillance radar system, which can observe targets regardless of time and weather. Passenger aircrafts are important targets for SAR, as it is of great importance for accurately recognizing the type of aircraft. SAR can provide dynamic monitoring of aircraft flights in civil aviation, which is helpful for the efficient management of airports. Due to the unique imaging characteristics of SAR, traditional target-detection algorithms have poor generalization ability, low detection accuracy, and a cumbersome recognition process. Target detection in high-resolution SAR images based on deep-learning methods is currently a major research hotspot. You Only Look Once v5 (YOLOv5) has the problems of missed detection and false alarms. In this study, we propose an improved version of YOLOv5. A multiscale feature adaptive fusion module is proposed to adaptively assign different weights to each scale of the feature layers, which can extract richer semantic and textural information. The SIOU loss function is proposed to replace the original CIOU loss function to speed up the convergence of the algorithm. The improved Ghost structure is proposed to optimize the YOLOv5 network to decrease the parameters of the model and the amount of computation. A coordinate attention (CA) module is incorporated into the backbone section to help extract useful information. The experimental results demonstrate that the improved YOLOv5 performs better in terms of detection without affecting calculation speed. The mean average precision (mAP) value of the improved YOLOv5 increased by 5.8% compared with the original YOLOv5.

1. Introduction

Synthetic aperture radar (SAR) is a radar system with remote sensing characteristics. It actively emits microwave signals, which can overcome the effects of illumination and harsh weather. Due to its unique advantages, it has broad application prospects. As passenger aircrafts are important civil targets, detecting them in SAR images has become an important research issue.
SAR images have many speckled areas, and the continuity of the aircraft target in an image is poor, which increases the difficulty of the detection task. Traditional aircraft-target-detection algorithms are mostly based on the target’s scattering and structural characteristics. Fu et al. [1] proposed a method for aircraft recognition in SAR images based on the structural features of scattering and template matching, which used the Gaussian mixture structure to model the scattering characteristics of the target and improved the efficiency of template matching through a sample decision-optimization algorithm. He et al. [2] proposed a mixed statistical-distribution-based multiple-component model for target detection in high-resolution SAR imagery, which took both the structural information and the statistical distribution into account to achieve a better effect with respect to SAR aircraft detection. Dou et al. [3] proposed an optimized target-attitude-estimation method, which used a multilayer neural network to obtain the prior shape information to reconstruct the SAR image. This method was designed to solve the problem of the rotation of the aircraft target and was capable of highly accurate detection. Feng et al. [4] proposed a hierarchical fusion method of complementary features for SAR images, which integrated the features of principal component analysis (PCA), attributed scattering centers (ASCs), and the target’s outline. An experiment proved that it was effective and robust. These traditional methods still have many shortcomings. The most severe problems are low accuracy, high missed detection rates or false alarm rates, and poor robustness of the algorithm [5].
With improvements in computing power and the emergence of advanced algorithms, artificial intelligence has achieved excellent performance in the field of computer vision. It is mainly used for the recognition, detection, segmentation, and reconstruction of the target in the image. In this study, our SAR-image-interpretation work aimed to recognize the specific type of aircraft in the SAR images. A target-recognition method based on a convolutional neural network (CNN) can solve the complicated problem of manual calculation and artificial feature extraction. With the continuous development and maturity of deep-learning theory, target-detection algorithms have achieved great results. The current mainstream detection algorithms are mainly divided into two categories: one-stage and two-stage detection.
Two-stage detection algorithms include the region convolutional neural network (R-CNN) algorithm [6], Fast R-CNN [7], Faster R-CNN [8], and Mask R-CNN [9]. These models first need to generate candidate boxes, then perform regression and classification operations. A candidate-box-prediction network is integrated into the deep network to realize end-to-end detection. It improves detection performance but reduces detection speed.
One-stage detection algorithms include the single-shot multibox detector (SSD) [10], Retina-Net [11], and YOLO [12]. These models do not utilize the intermediate candidate box prediction process and can obtain results directly from the picture. While ensuring recognition accuracy, the calculation demand of the algorithm is reduced, and the target can be detected more quickly.
Deep-learning target-detection algorithms are mostly used in optical images. In recent years, scholars from China and overseas have used different CNN architectures and deep-learning algorithms to study the interpretation of SAR images. Zhang et al. [13] proposed a cascaded three-look network, which combined the advantages of Faster R-CNN and residual units. It decreased false alarms and improved the detection precision. Guo et al. [14] proposed an improved YOLOv5 detection method using a convolutional block attention module (CBAM) [15] and a bidirectional feature pyramid network (BiFPN) [16]. It solved the problem of missed detection in multiscale targets. Xiao et al. [17] proposed an adaptive deformable network (ADN) to alleviate the problems of multiscale targets and attitude sensitivity. Extensive experiments have demonstrated that the average precision of aircraft target detection in SAR images is 89.34%, which is higher than that of other mainstream algorithms. However, these research methods are mainly used for target positioning and do not require recognition of the type of target.
The main research aim of this study was to recognize the type and position of passenger aircrafts in SAR images. There are seven categories of passenger aircraft in our dataset, including Boeing 787, A330, Boeing 737-800, A320/321, ARJ21, A220, and others. Being able to successfully recognize these aircraft targets in a timely way would help to achieve efficient airport management. Considering the requirements of speed and accuracy of algorithm detection, in this study we selected YOLOv5 as the basic framework. YOLOv5 is a typical one-stage detection network with the advantage of a fast detection speed, and it integrates current popular and effective algorithms with highly accurate detection. However, experiments have shown that YOLOv5 still has much room for improvement. In this study, we propose an improved YOLOv5 architecture. Our contributions can be summarized as follows.
(1)
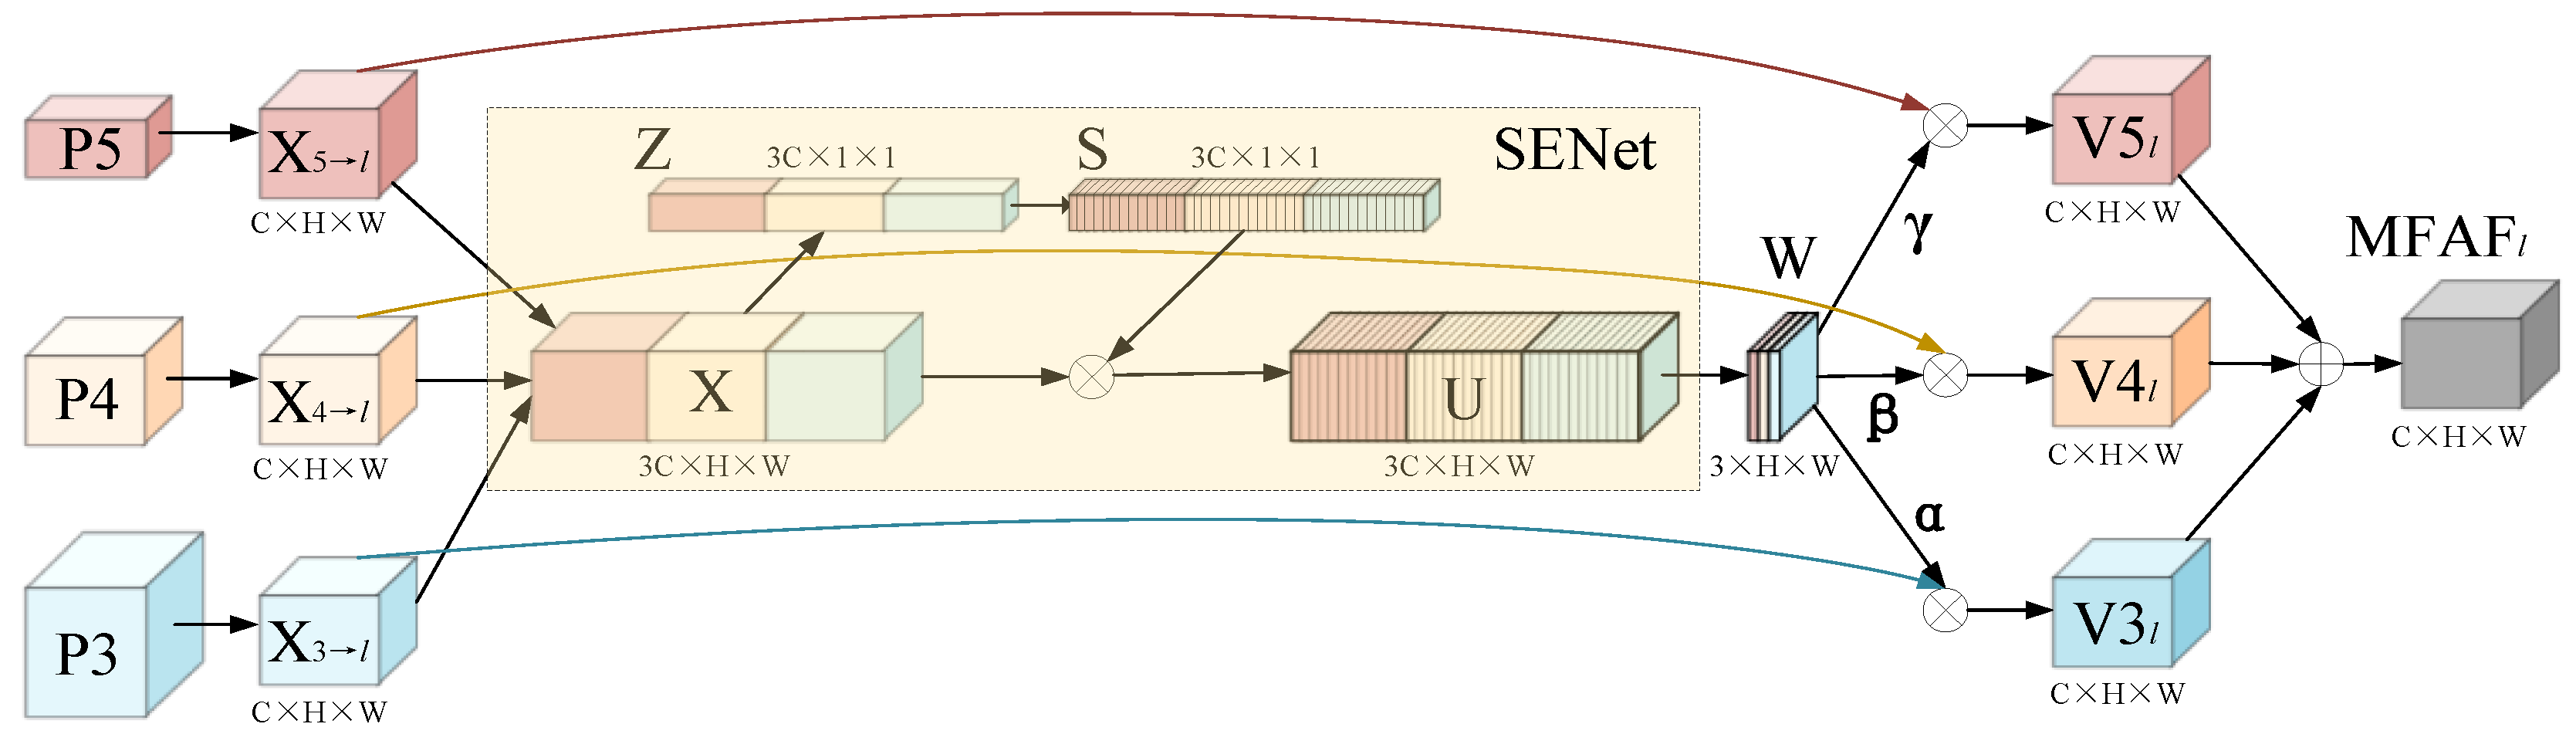
A multiscale feature adaptive fusion (MFAF) module is proposed to fuse feature layers with three different scales and to adaptively adjust the contribution of the shallow and deep feature layers. This is more conducive to extracting the feature information of multiscale targets.
(2)
We update the loss function from CIOU [18] to SIOU [19,20], which considers the angle factor. This effectively reduces the degrees of freedom of the regression, accelerates the convergence of the algorithm, and further improves the accuracy of the regression.
(3)
We use the improved Ghost [21,22] lightweight structure to optimize the network of YOLOv5. This method not only reduces the total number of network parameters and computational complexity but also improves the network’s calculating speed.
(4)
We use a coordinate attention (CA) [23] module as the backbone section of YOLOv5, which enhances the ability to extract features and improves the accuracy of aircraft recognition in SAR images.
The improved YOLOv5 was applied to the dataset of SAR images for the recognition of aircraft targets. It exhibited more precise recognition compared with the original YOLOv5.
The specific organization of this article is as follows. Section 2 describes the structure and function of each section of YOLOv5. Section 3 introduces the four improvement measures proposed in this study in detail. Section 4 introduces the experimental platform, the dataset, an analysis of the results, and the related ablation experiments. Section 5 summarizes our work and suggests potential directions for future research and improvements.

2. Related Work

In 2016, Redmon et al. proposed the YOLO algorithm, which utilized the idea of regression to complete the steps of target detection and recognition in one stage. Compared with other deep-learning algorithms, YOLO has the advantage of a rapid detection, which has high value for application in many fields. At present, YOLO has been developed to the fifth generation. Through continuous improvement, its performance and network structure have been optimized. In this study, we selected YOLOv5 as the baseline.
YOLOv5 is divided into four versions according to the size of the model: YOLOv5x, YOLOv5l, YOLOv5m, and YOLOv5s. YOLOv5s is the smallest, lightweight version and has the fastest detection speed. YOLOv5x is the largest version and has high feature extraction ability, fusion ability, and detection accuracy. The network structure of YOLOv5 is generally divided into four sections: the input, backbone, neck, and head.
  • Input: The images in the dataset are fed to the input section for training and validation. The input stage adopts the mosaic data augmentation method [24], which uses four images for random scaling, random clipping, and random layout, and then splices them into one image as training data. It can effectively enrich the dataset and improve the usage efficiency of a GPU. The input stage adopts the adaptive image scaling method to scale the original image to the standard size and sends it into the network for training. It can reduce the amount of calculation and improve the speed of detection. The input stage also adopts the adaptive anchor box method, which uses a K-means clustering algorithm for different datasets. It can calculate the best initial value of an anchor box for different training sets. It can also accelerate the convergence of the algorithm.
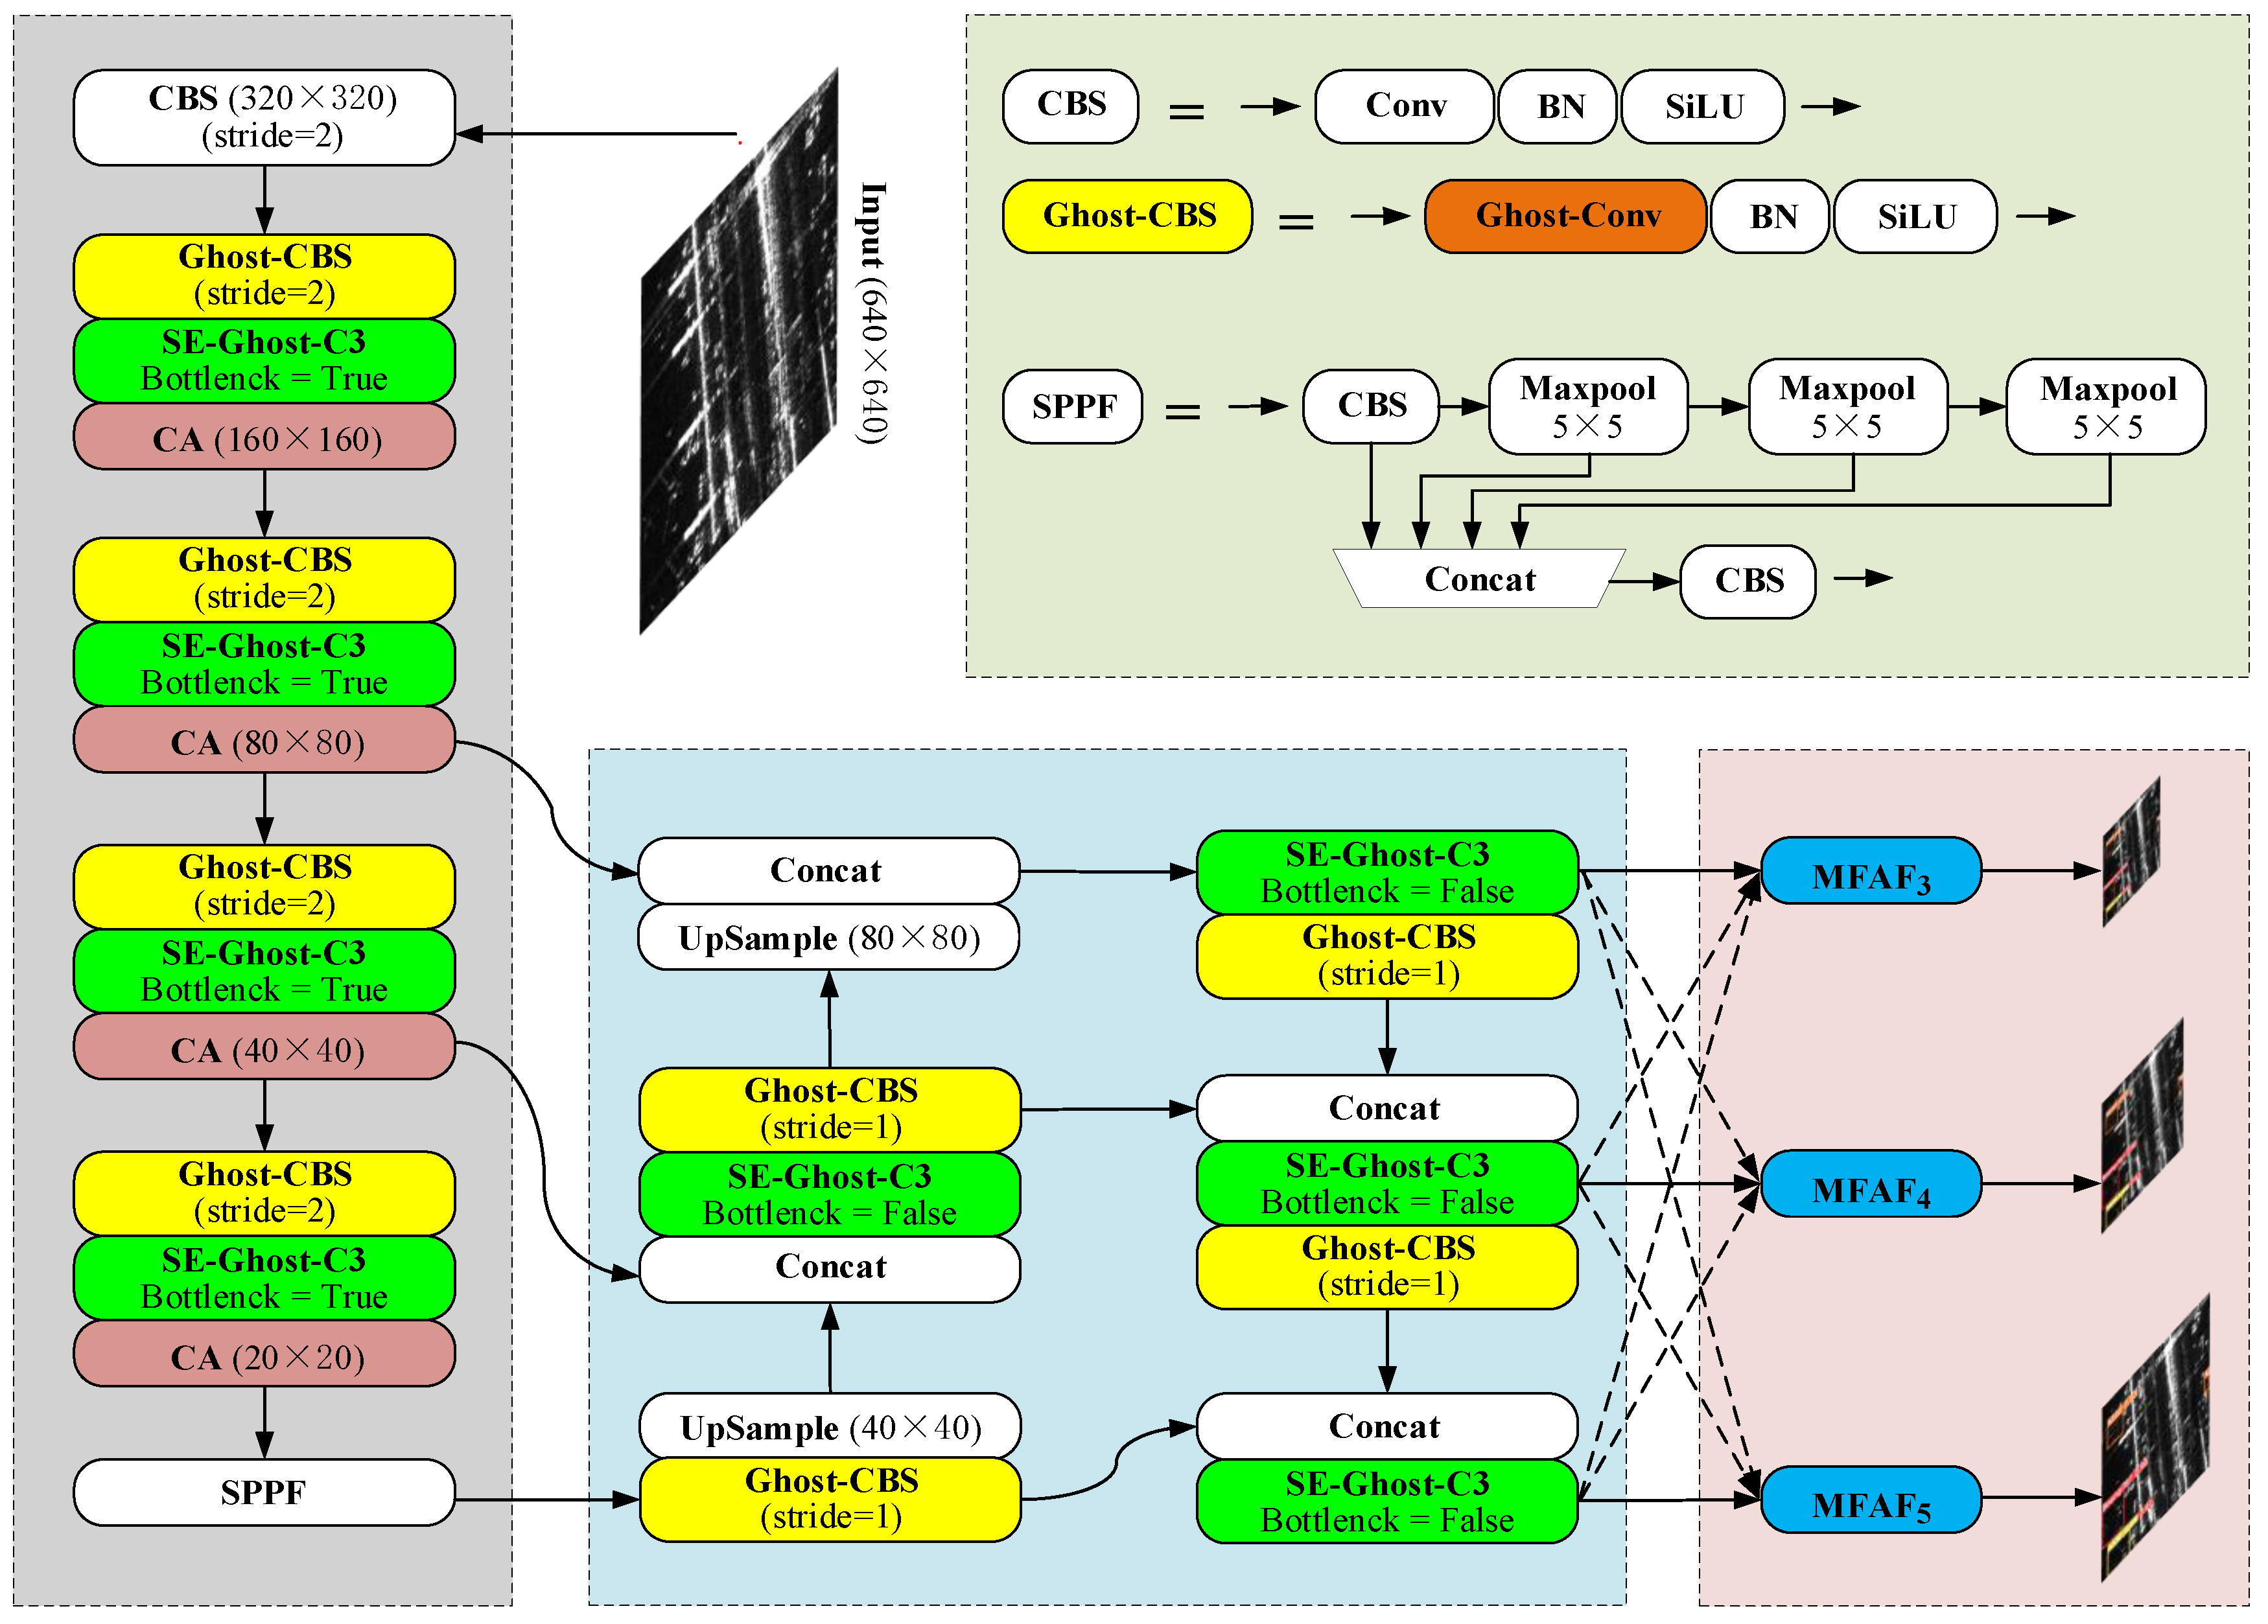
  • Backbone: This is used to extract feature maps of different receptive fields. The backbone is mainly composed of CBS, C3, and SPPF. CBS is a composite convolution module and is a basic component of many important models. CBS is composed of Conv2d, BN, and SiLU, which are used to extract the features. C3 is composed of several bottleneck residue modules, which improve the learning ability of the model, lighten the model, ensure the recognition accuracy of the network, and reduce the model’s cost and memory space. SPPF transmits the input serially through three max-pooling layers of the 5 × 5 convolution core and concatenates the output of each max-pooling layer together. It is used to extract the features and enhance the receptive field of the network. SPPF has the same function as SPP, but SPPF is more efficient and faster.
  • Neck: This is used to fuse the feature maps of different receptive fields. The neck combines the structure of feature pyramid networks (FPNs) [25] and the path aggregation networks (PANs) [26]. An FPN conveys semantic information from top to bottom, while a PAN conveys positioning information from bottom to top. The combination of the two improves the feature fusion capability of the network by aggregating the parameters of different receptive fields from different backbone layers. It can greatly improve the recognition accuracy for multiscale targets and the performance in terms of detecting dense targets.
  • Head: YOLOv5 has three detection heads, which are used to predict the passenger aircraft targets at different scales in SAR images. The head section mainly includes the bounding box loss function and non-maximal suppression (NMS) [27]. CIOU is used as the loss function in YOLOv5 and accounts for the geometric factors of the distance from the center, the overlapping area, and the aspect ratio. It can make the algorithm converge quickly. In the prediction stage, the weighted NMS operation is adopted to obtain the optimal target box from the numerous target boxes that appear, which can enhance the performance of the model in terms of recognition.

3. Materials and Methods

3.1. Design of the Multiscale Feature Adaptive Fusion Module

In the backbone of YOLOv5, when the resolution of the input image is 640 × 640, feature maps (C1, C2, C3, C4, C5) of different scales are extracted through multiple instances of convolutional downsampling. The resolutions of the feature maps C1, C2, C3, C4, and C5 are 320 × 320, 160 × 160, 80 × 80, 40 × 40, and 20 × 20, respectively, corresponding to 2-, 4-, 8-, 16-, and 32-fold downsampling. Shallow feature maps have more textural features of the target, which contain richly detailed information. Shallow feature maps are suitable for the detection of small targets. Deep feature maps have a larger receptive field, which can extract richer semantic information. Deep feature maps are suitable for the detection of large targets. The algorithm uses feature maps C3, C4, and C5 to predict multiscale targets (small, medium, and large, respectively). Feature maps C3, C4, and C5 are sent to the FPN and PAN for fusion of the multiscale features to obtain the feature maps P3, P4, and P5. FPN and PAN fuse feature maps with different scales with an equal weight, although, in fact, feature maps with different scales make different contributions to target recognition. Simple fusion weakens the performance of the network in terms of recognition.
In response to these problems, we designed an MFAF module based on the ASFF [28] module. Feature maps (P3, P4, P5) were the input of the MFAF module, which can assign different weights to the feature maps at each scale, adaptively adjust the contribution of shallow features and deep features, and strengthen the feature information required for the detection of targets of different sizes. Figure 1 shows the structure of the MFAF module.
The feature maps P3, P4, and P5 of YOLOv5 have different resolutions and the same number of channels. In order to fuse P3, P4, and P5, they need to be unified into feature maps with the same resolution. The feature map of layer l (l ∈ {3, 4, 5}) is represented by Xl. For the feature fusion of layer l, we resize the features at the other layer n (nl) to the same shape as that of Xl by adopting upsampling or downsampling strategies. The resized feature map is represented by Xn→l, whose size is C × H × W. We integrate the squeeze-and-excitation (SE) [29] mechanism into the ASFF framework. Firstly, the resized feature maps X3→l, X4→l, and X5→l are concatenated into the channel dimension to obtain X with size 3C × H × W. Each channel of X is subjected to global average pooling to obtain Z with size 3C × H × W, which is expressed as follows:
Z c = F s q ( X c ) = 1 H × W i = 1 H j = 1 W X c ( i , j )
where Xc represents the feature map of the cth channel of X; Zc represents the global feature of the cth channel of X; and Fsq represents the squeeze operation. Secondly, the non-linear relationship between each channel is learned through two FC operations and the ReLU activation function, then the sigmoid activation function is used to generate the weight of each channel to obtain S. The formula is expressed as follows:
S = F e x Z , W = σ W 2 δ W 1 Z
where Fex represents the excitation operation; W1 and W2 represent the two FC operations; W1 is used to compresses the features of the channels’ dimensions and capture the relationship between the channels; W2 is used to restore the channels’ dimensions; δ represents the ReLU activation function; σ represents the sigmoid activation function; and S represents the weight matrix. The output U is expressed as follows:
U c = S c · X c
where Uc represents the feature map of the cth channel of U and Sc represents the weight of the cth channel of U. The feature map U with the weight information in the channel dimension is obtained by the squeeze-and-excitation module, which strengthens the expression of the relevant information, weakens the interference of irrelevant information, and extracts the feature information efficiently. To further capture the spatial features and compute the weight scalar maps, U is convolved with a kernel of size 1 × 1, and the channels’ dimensions are compressed to obtain W with a size of 3 × H × W, which is composed of the weight scalar maps λα, λβ, and λγ. Finally, the softmax activation function is used to normalize the weight feature map W to obtain α, β, and γ [30], which are shared across all the channels. The expressions for α, β, and γ are as follows:
α i j = e λ a i j e λ a i j + e λ β i j + e λ γ i j ,   β i j = e λ β i j e λ a i j + e λ β i j + e λ γ i j ,   γ i j = e λ γ i j e λ a i j + e λ β i j + e λ γ i j
where λ α i j , λ β i j , and λ γ i j represent the pixel value of the ith row and jth column of W, which is learned through standard backpropagation; and αij, βij, and γij represent the pixel value of the ith row and jth column of α, β, and γ, which are defined by controlling the parameters λ α i j , λ β i j , and λ γ i j . In addition, αij, βij, and γij should fit the following formula:
α i j + β i j + γ i j = 1 α i j , β i j , γ i j [ 0,1 ]
Using this method, the MFAF module obtains the feature map of the fusion weight parameters at the layer l as follows:
M F A F l = V 3 l + V 4 l + V 5 l = α · X 3 l + β · X 4 l + γ · X 5 l
The features at all the layers are adaptively aggregated to obtain V 3 l , V 4 l , and V 5 l , which are used to recognize the passenger aircraft targets. When the detected target is a small target, the shallow feature map is given a higher weight. Through the reasonable distribution of the weight value of the shallow features and the deep features, the aircraft targets can be recognized more accurately.

3.2. Loss Function Update

The loss function of YOLOv5′s output terminal consists of three parts: classification loss, confidence loss, and bounding box loss. The bounding box loss adopts the CIOU loss function in the YOLOv5 network. The purpose of this is to make the predicted box closer to the ground truth box more quickly and accurately. The formula for CIOU loss is as follows:
C I O U _ L o s s = 1 C I O U = 1 I O U + ρ 2 b , b g t c 2 + α v
where IOU represents the intersection over the union of loss between the predicted box and the ground truth box; c represents the diagonal length of the minimum outside rectangle of the predicted box and the ground truth box; ρ represents the Euclidean distance of the center point between the predicted box and the ground truth box; and v and α are defined as follows:
v = 4 π 2 ( a r c t a n w g t h g t a r c t a n w h ) 2
α = v 1 I O U + v
where w and h represent the width and height of the predicted box and wgt and hgt represent the width and height of the ground truth box, respectively. CIOU loss considers three factors, namely the overlapping area, the distance from the center point, and the aspect ratio, but it does not consider the mismatch angle between the predicted box and the ground truth box. Therefore, we introduce SIOU loss as the position loss function of the regression for the bounding box. The formula for SIOU loss is as follows:
S I O U _ L o s s = 1 S I O U = 1 I O U + Ω + 2
where Ω represents the loss of shape, which is defined as follows:
Ω = t = w , h 1 e ω t θ
ω w = | w w g t | m a x ( w , w g t ) , ω h = | h h g t | m a x ( h , h g t )
where θ is an important parameter used to adjust the degree of attention to the loss of shape. The value of θ was set as 4 in our experiment. Here, △ represents the loss of distance, which is defined as follows:
= t = x , y ( 1 e γ ρ t )
ρ x = ( b c x g t b c x c w ) 2 , ρ y = ( b c y g t b c y c h ) 2 , γ = 2 Λ
where ( b c x , b c y ) and ( b c x g t , b c y g t ) represent the center coordinates of the predicted box and of the ground truth box, respectively; and c w and c h represent the width and height of the minimum outside rectangle of the predicted box and the ground truth box, respectively. Λ represents the angle loss factor, which is defined as follows:
Λ = 1 2 × s i n 2 ( arcsin x π 4 )
x = c h σ
σ = b c x g t b c x 2 + b c y g t b c y 2
c h = max b c y g t , b c y min b c y g t , b c y
where σ represents the distance of the center point from both the predicted box and the ground truth box; and c h represents the difference in the height of the center point between the predicted box and the ground truth box. SIOU redefines the loss function by introducing the angle loss factor, effectively reduces the degrees of freedom of the regression, accelerates the convergence of the network, and further improves the accuracy of detection.

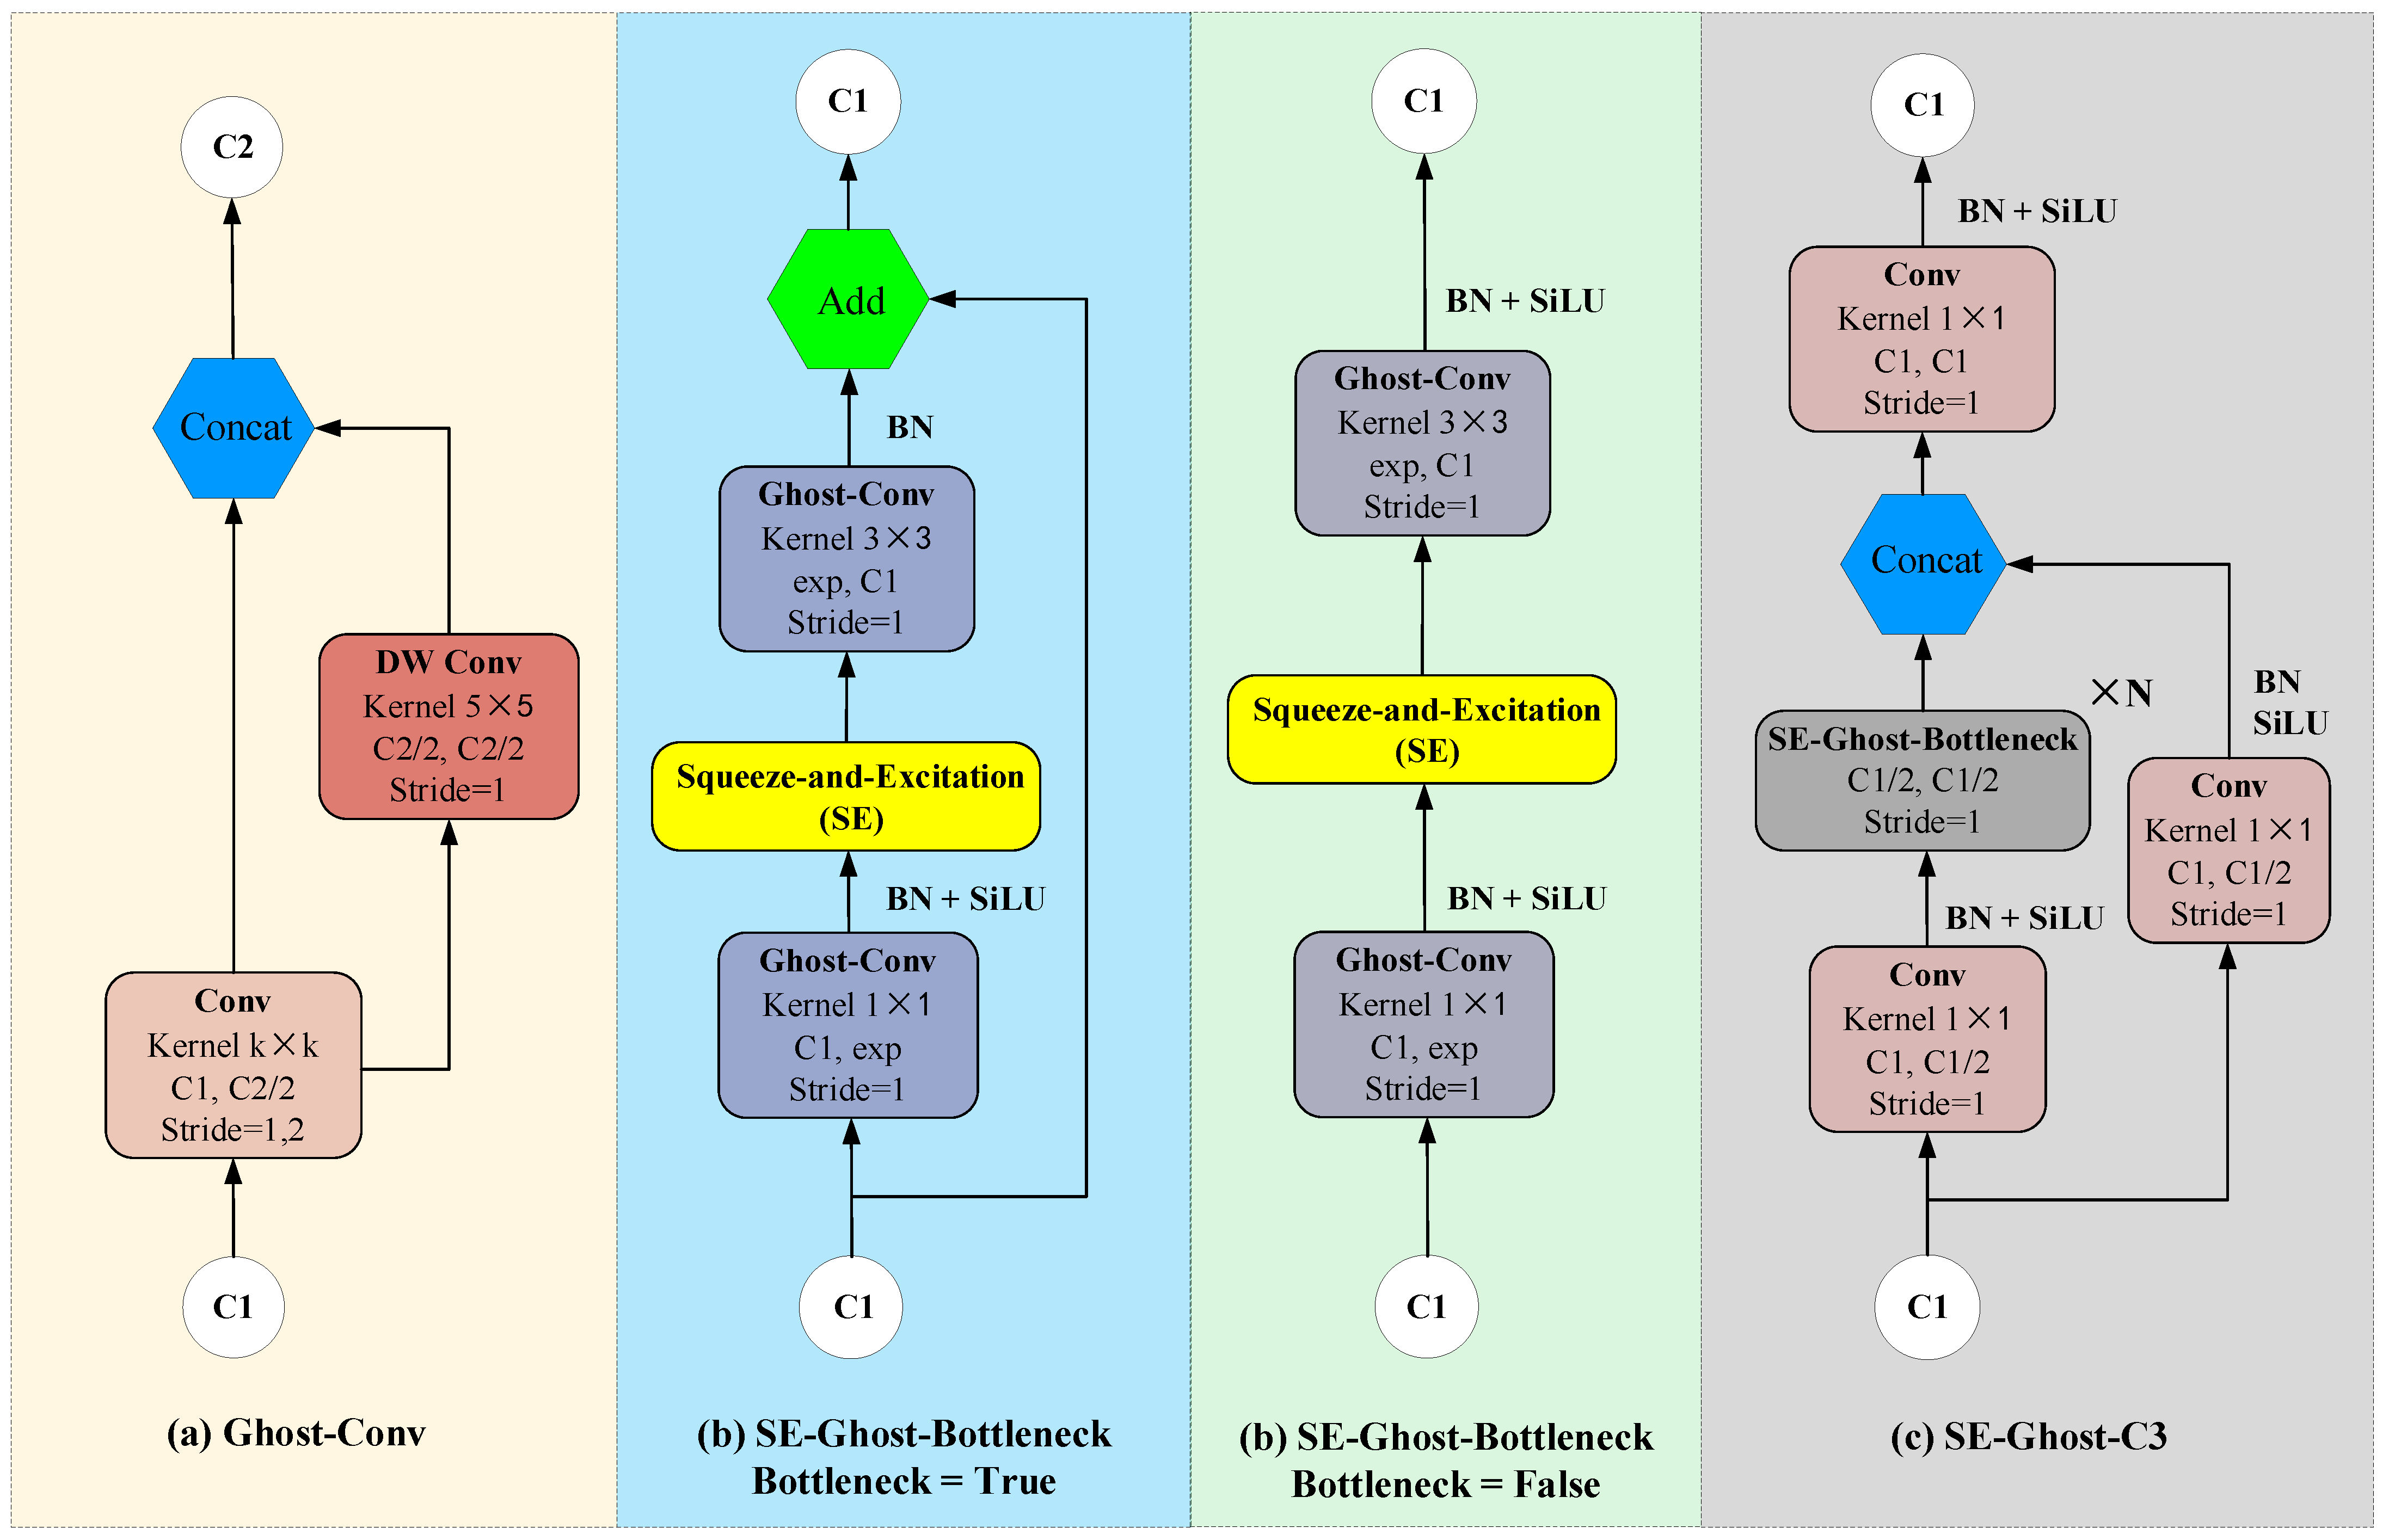
3.3. Design of the Ghost-Conv and SE-Ghost-C3 Lightweight Modules

The deep convolution neural network is composed of a large number of convolutions, which leads to large computational costs [31]. There are many redundant feature maps in the calculation process. This paper proposes the Ghost-Conv and SE-Ghost-C3 modules, which are capable of extracting features efficiently with a small amount of computational complexity.
C1 and C2 represent the dimensions of the feature maps. The core module is Ghost-Conv, which is shown in Figure 2a. The first convolution layer is used to generate intrinsic feature maps. The dimension of the output channel is half of C2. The other half of the dimension is obtained via a cheap operation. We adopted the depthwise (DW) convolution [32,33] operation to generate the other half dimension, which were set as redundant features. They were concatenated together as the output of the C2 dimension of Ghost-Conv. Under the same conditions, the computational cost of Ghost-Conv was reduced by one time compared with ordinary convolution. Ghost-Conv replaced ordinary Conv of the CBS module in the backbone and neck of YOLOv5. However, the settings of the stride, kernel size, and the number of input and output channels remained unchanged. The size of the model was greatly reduced.
To further compress the model, we designed the SE-Ghost-C3 module, which is shown in Figure 2c. It is composed of the SE-Ghost-Bottleneck module, which is shown in Figure 2b. The SE-Ghost-Bottleneck module consists of two stacked Ghost-Conv modules. The first Ghost-Conv module acts as a squeezing layer, reducing the number of channels. The second Ghost-Conv module recovers the number of channels to match the shortcut path. exp denotes the squeezing rate, which was set as 0.5 in our experiments. The SE attention mechanism is integrated between the two Ghost-Conv modules, which enables the feature map with more information to obtain a greater weight. This helps improve the efficiency of feature extraction. There are two (b) in Figure 2, which are distinguished by the bottleneck flag bit. When the bottleneck is true, SE-Ghost-Bottleneck configures the residual structure, which can increase the capacity to transmit the features in the network from shallow to deep layers and effectively alleviate the gradient-vanishing problem caused by ordinary convolution. The SE-Ghost-C3 module was used as the backbone of YOLOv5. When the bottleneck is false, SE-Ghost-Bottleneck does not configure the residual structure, which is used as the neck of YOLOv5. The SE-Ghost-C3 module can better fuse multiscale features. We designed the SE-Ghost-C3 module on the basis of the cross-stage partial network (CSPNet) [34]. The stacking of multiple bottleneck layers incurs great overhead costs. We adopted SE-Ghost-Bottleneck to replace the original bottleneck. This reduced the network operations and improved the efficiency of feature extraction. SE-Ghost-C3 enables the network to learn useful information, discard useless information, and effectively reduce the number of parameters without reducing the performance.

3.4. Integration of the Coordinate Attention Module

In order to avoid the lack of feature extraction capability caused by the use of the SE-Ghost-C3 lightweight network, we aimed to incorporate the attention mechanism with the backbone network of YOLOv5. The SE attention mechanism only pays attention to the interdependencies among the channels, ignoring the spatial information. The BAM [35] and CBAM mechanisms consider both the channel and spatial information, but they only capture local information. We adopted the CA mechanism, which better captures both the channels’ relationships and the long-range dependencies with precise positional information [23]. The CA mechanism can be plugged into our networks to improve the accuracy with little additional computing overhead. The structure of the CA mechanism is shown in Figure 3.
In Figure 3, X is the input feature map and Y is the output feature map with weights after the CA operation. In order to capture the precise spatial information, X is subjected to the X avg pool and Y avg pool of each channel to obtain z h and z w . The formula is as follows:
z c h ( h ) = 1 W 0 i W x c ( h , i )
z c w ( w ) = 1 H 0 i H x c ( j , w )
where z c h ( h ) represents the output of the cth channel at height h and z c w ( w ) represents the output of the cth channel at width w. Moreover, z h and z w are concatenated along the spatial dimension and sent into a shared convolution layer F 1 with a kernel size of 1 × 1 to compress the channels’ dimension to obtain F, whose dimension is reduced by r times. Following this, the batch-normalization (BN) operation and the ReLU non-linear activation function are used to obtain f, which is shown as follows:
f = δ ( F 1 ( [ z h , z w ] ) )
The feature map f is divided into two tensors along the spatial dimension to obtain f h and f w . Then, they are sent separately into the convolution layer F h and F w with a kernel size of 1 × 1 to recover the original dimensions. Following this, the sigmoid activation function is used to obtain the attention weights g h and g w , which are shown as follows:
g h = σ ( F h ( f h ) )
g w = σ ( F w ( f w ) )
Finally, the output Y of the CA mechanism can be written as follows:
y c ( i , j ) = x c ( i , j ) × g c h ( i ) × g c w ( j )
Due to the special imaging mechanism of SAR, the scattering points of aircraft targets in SAR images are highly discrete, and the correlation between each aircraft component is weak, as shown in Figure 4a. The environment of the airport is relatively complex, and structures such as vehicles and terminal buildings can easily form stronger scattering spots, which interfere with the scattering of aircraft targets, as shown in Figure 4b. These problems increase the difficulty in recognizing aircraft targets. The CA mechanism can effectively improve the accuracy of recognizing aircraft targets.

3.5. Improved YOLOv5 Structure

YOLOv5 has strong recognition ability, so in this study we chose it as the baseline. Based on the characteristics of the SAR images, we integrated the four aspects described above into the model of YOLOv5. Firstly, the designed MFAF module replaced the original detection head to help extract the feature information of multiscale targets. Secondly, the SIOU loss function replaced the original CIOU to accelerate the convergence of the network and improve the accuracy of detection. Thirdly, the designed Ghost-Conv and SE-Ghost-C3 modules replaced the original Conv and C3 modules, which reduced the size of the model. Finally, the CA mechanism was integrated into the backbone of YOLOv5 to improve the accuracy of recognizing targets in a complex background. The improved YOLOv5 structure is shown in Figure 5.

4. Experiments and Analysis

In this section, we describe a large number of experiments that proved that the improved YOLOv5 algorithm is effective. Firstly, we introduce our dataset. Secondly, we introduce our experimental environment. Thirdly, we introduce the method of evaluating the experimental results. Finally, we show how we verified the performance of the improved YOLOv5 algorithm through ablation experiments.

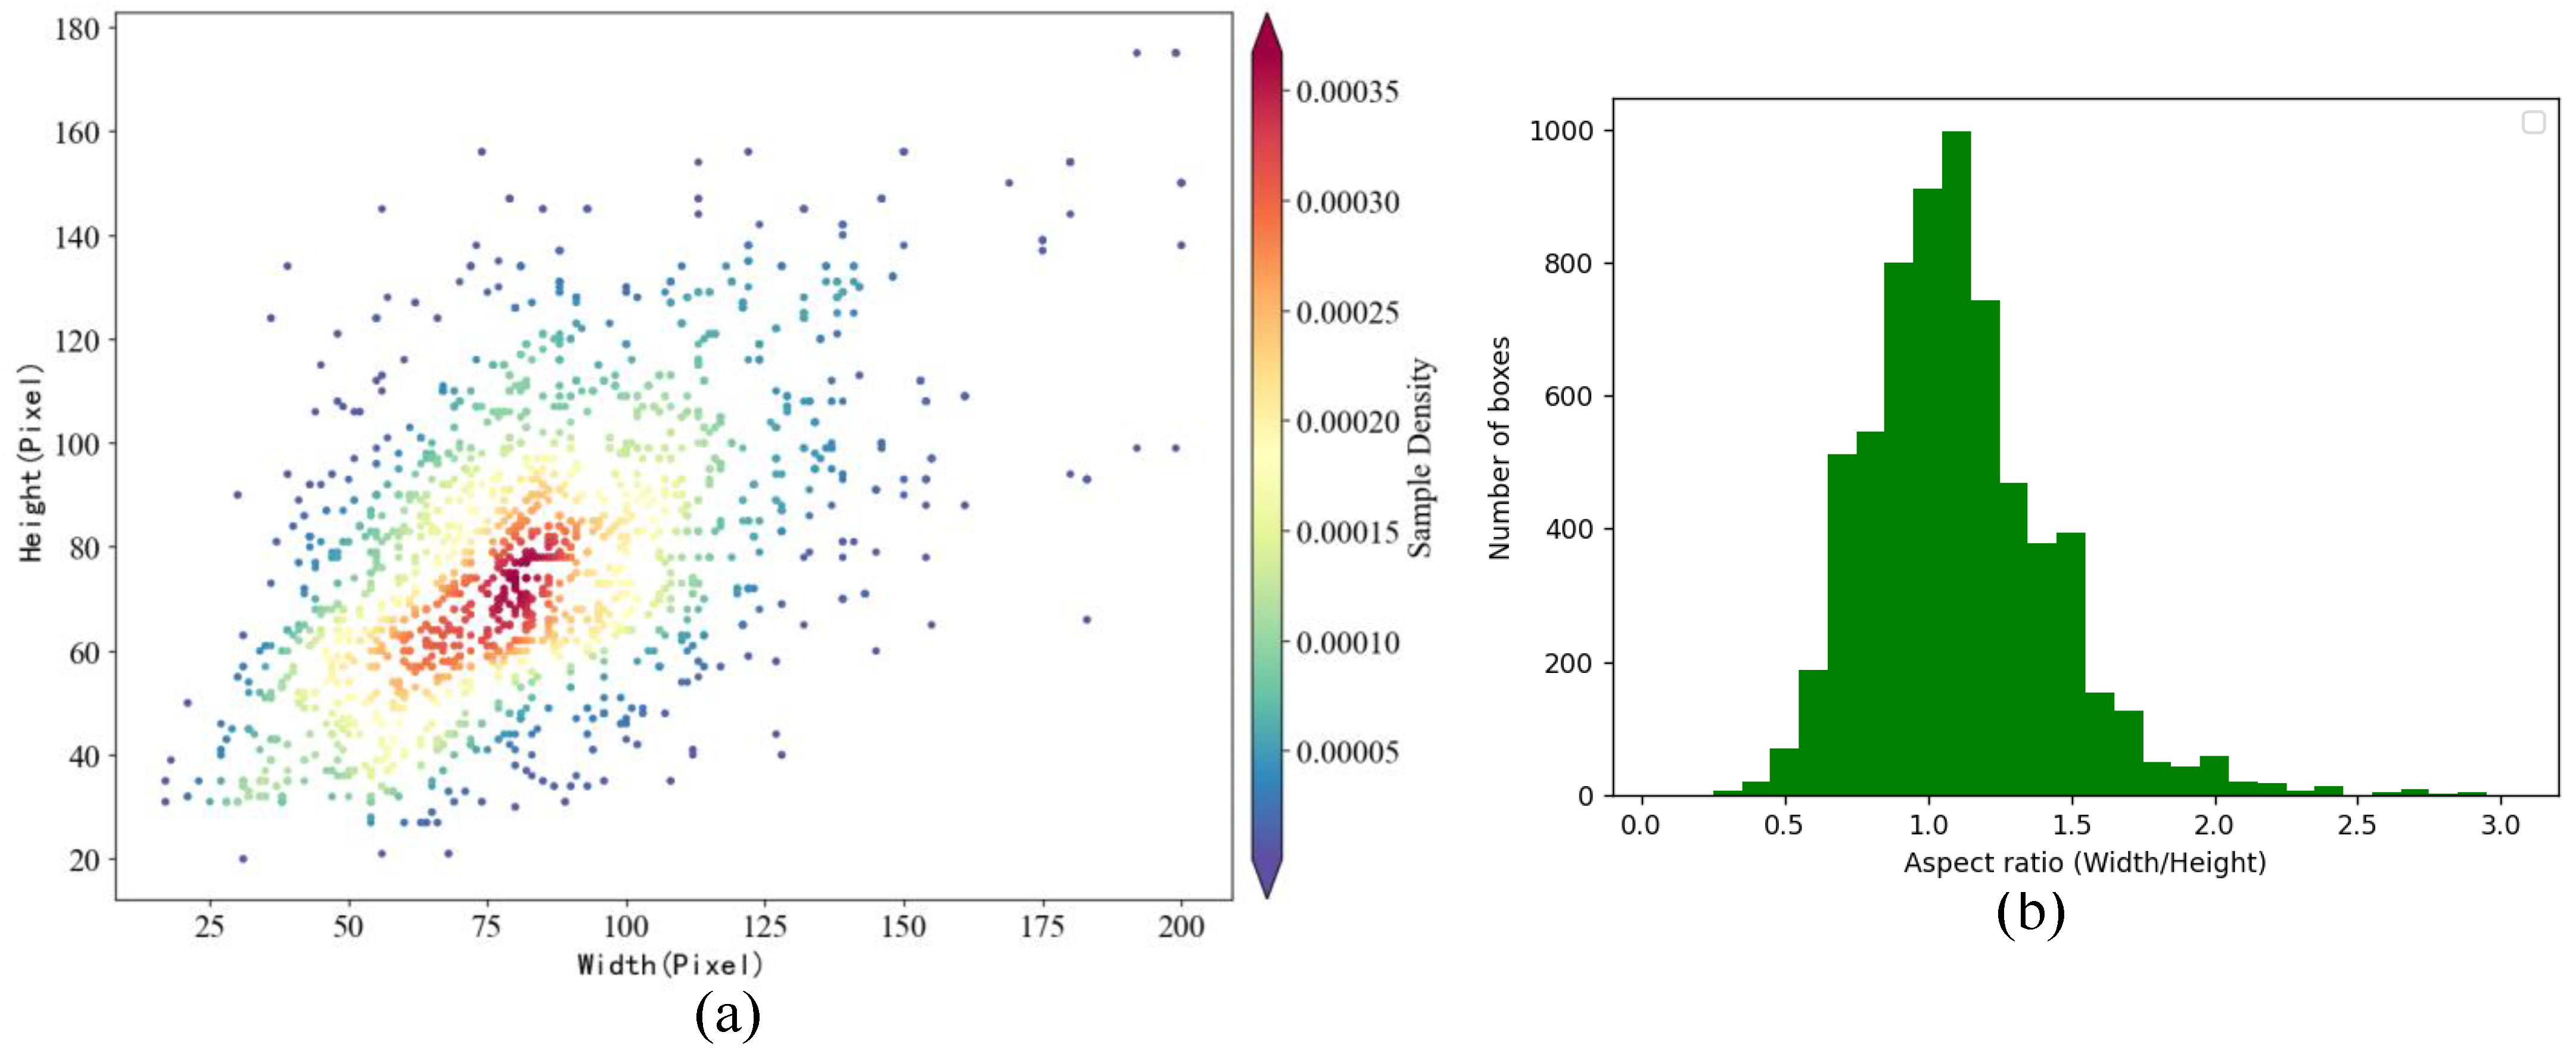
4.1. Description of the Dataset

The dataset was obtained using the GF-3 satellite [36]. The SAR images of the dataset contained multitemporal scenes of several common airports around the world. The resolution of the images was 1 m and there were 2000 images in total, including 6556 aircrafts. These images range in size from 600 × 600 pixels to 2048 × 2048 pixels. The dataset includes seven categories of aircraft (Boeing 787, A330, Boeing 737-800, A320/321, ARJ21, A220, and others), as shown in Figure 6. It can be seen from the picture that the scattering points of the aircraft targets were highly discrete, and there was a complex and cluttered background, which made it difficult to accurately recognize the aircraft target.
Figure 7a shows the distribution of the size of the bounding boxes. The horizontal axis is the width of the bounding box, and the vertical axis is the height of the bounding box. Figure 7b shows the distribution of the bounding boxes’ aspect ratios. The horizontal axis is the aspect ratio, and the vertical axis is the number of bounding boxes. The sizes and aspect ratios of the bounding boxes of different aircraft targets vary greatly, which further increases the difficulty in recognizing targets. In our experiment, the dataset was divided into the training set, validation set, and test set with proportions of 8:1:1.

4.2. Configuration of the Experimental Environment

The proposed YOLOv5 algorithm was run on a 64-bit Windows 10 computer system. The software versions and hyperparameters were configured as shown in Table 1.

4.3. Evaluation Indicators

To verify the performance of the algorithm, we used the mean average precision (mAP) as the evaluation indicator for all the experiments and used the average precision (AP) as the accuracy of recognizing a single category. mAP is the mean of all categories’ AP values. The higher the mAP value and AP value, the higher the recognition accuracy of the model. The mAP is expressed as follows:
m A P = 1 n i = 1 n A P i
where n represents the total number of categories (n = 7 in this dataset) and i represents the index of the category. The value of AP is the area of the PR (precision–recall) curve for each category. The AP is expressed as follows:
A P = 0 1 P ( R ) d R
where P represents the ratio of the number of true aircrafts detected to the total number of aircrafts detected, and R represents the ratio of the number of true aircrafts detected to all true aircrafts. These are expressed as follows:
P = T P T P + F P
R = T P T P + F N
where TP (true positive) indicates that the forecasted value is true and the actual value is true; FP (false positive) indicates that the forecasted value is true and the actual value is false; and FN (false negative) indicates that the forecasted value is false and the actual value is true. TP represents the number of correctly detected targets, FP represents the number of false alarms, and FN represents the number of missing targets.

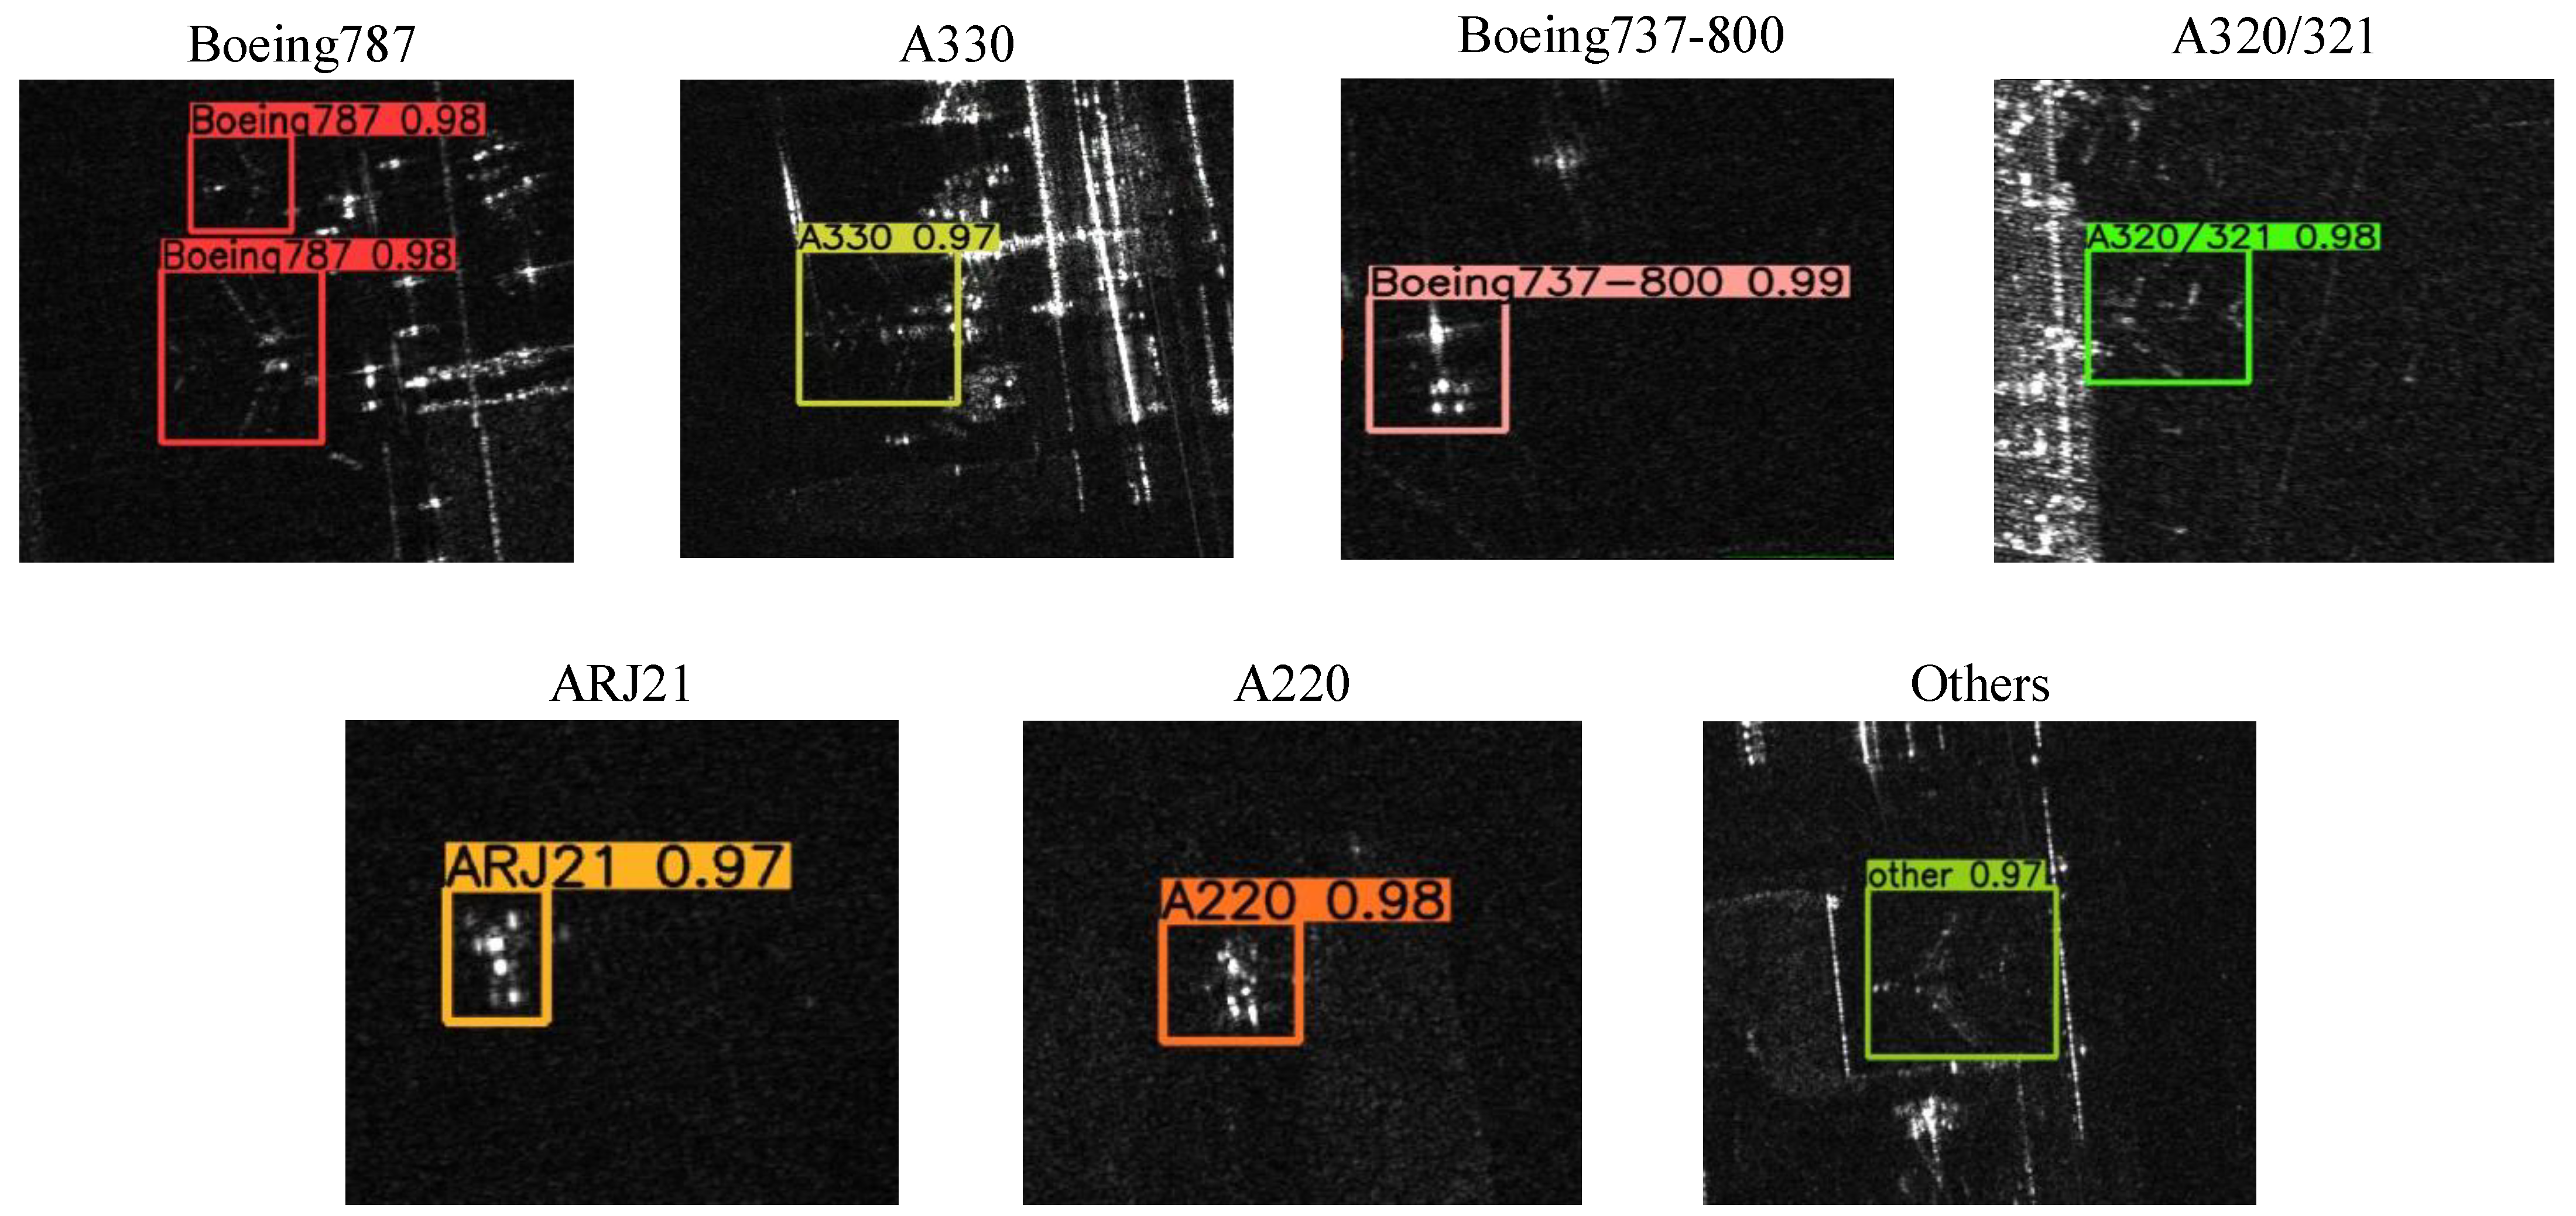
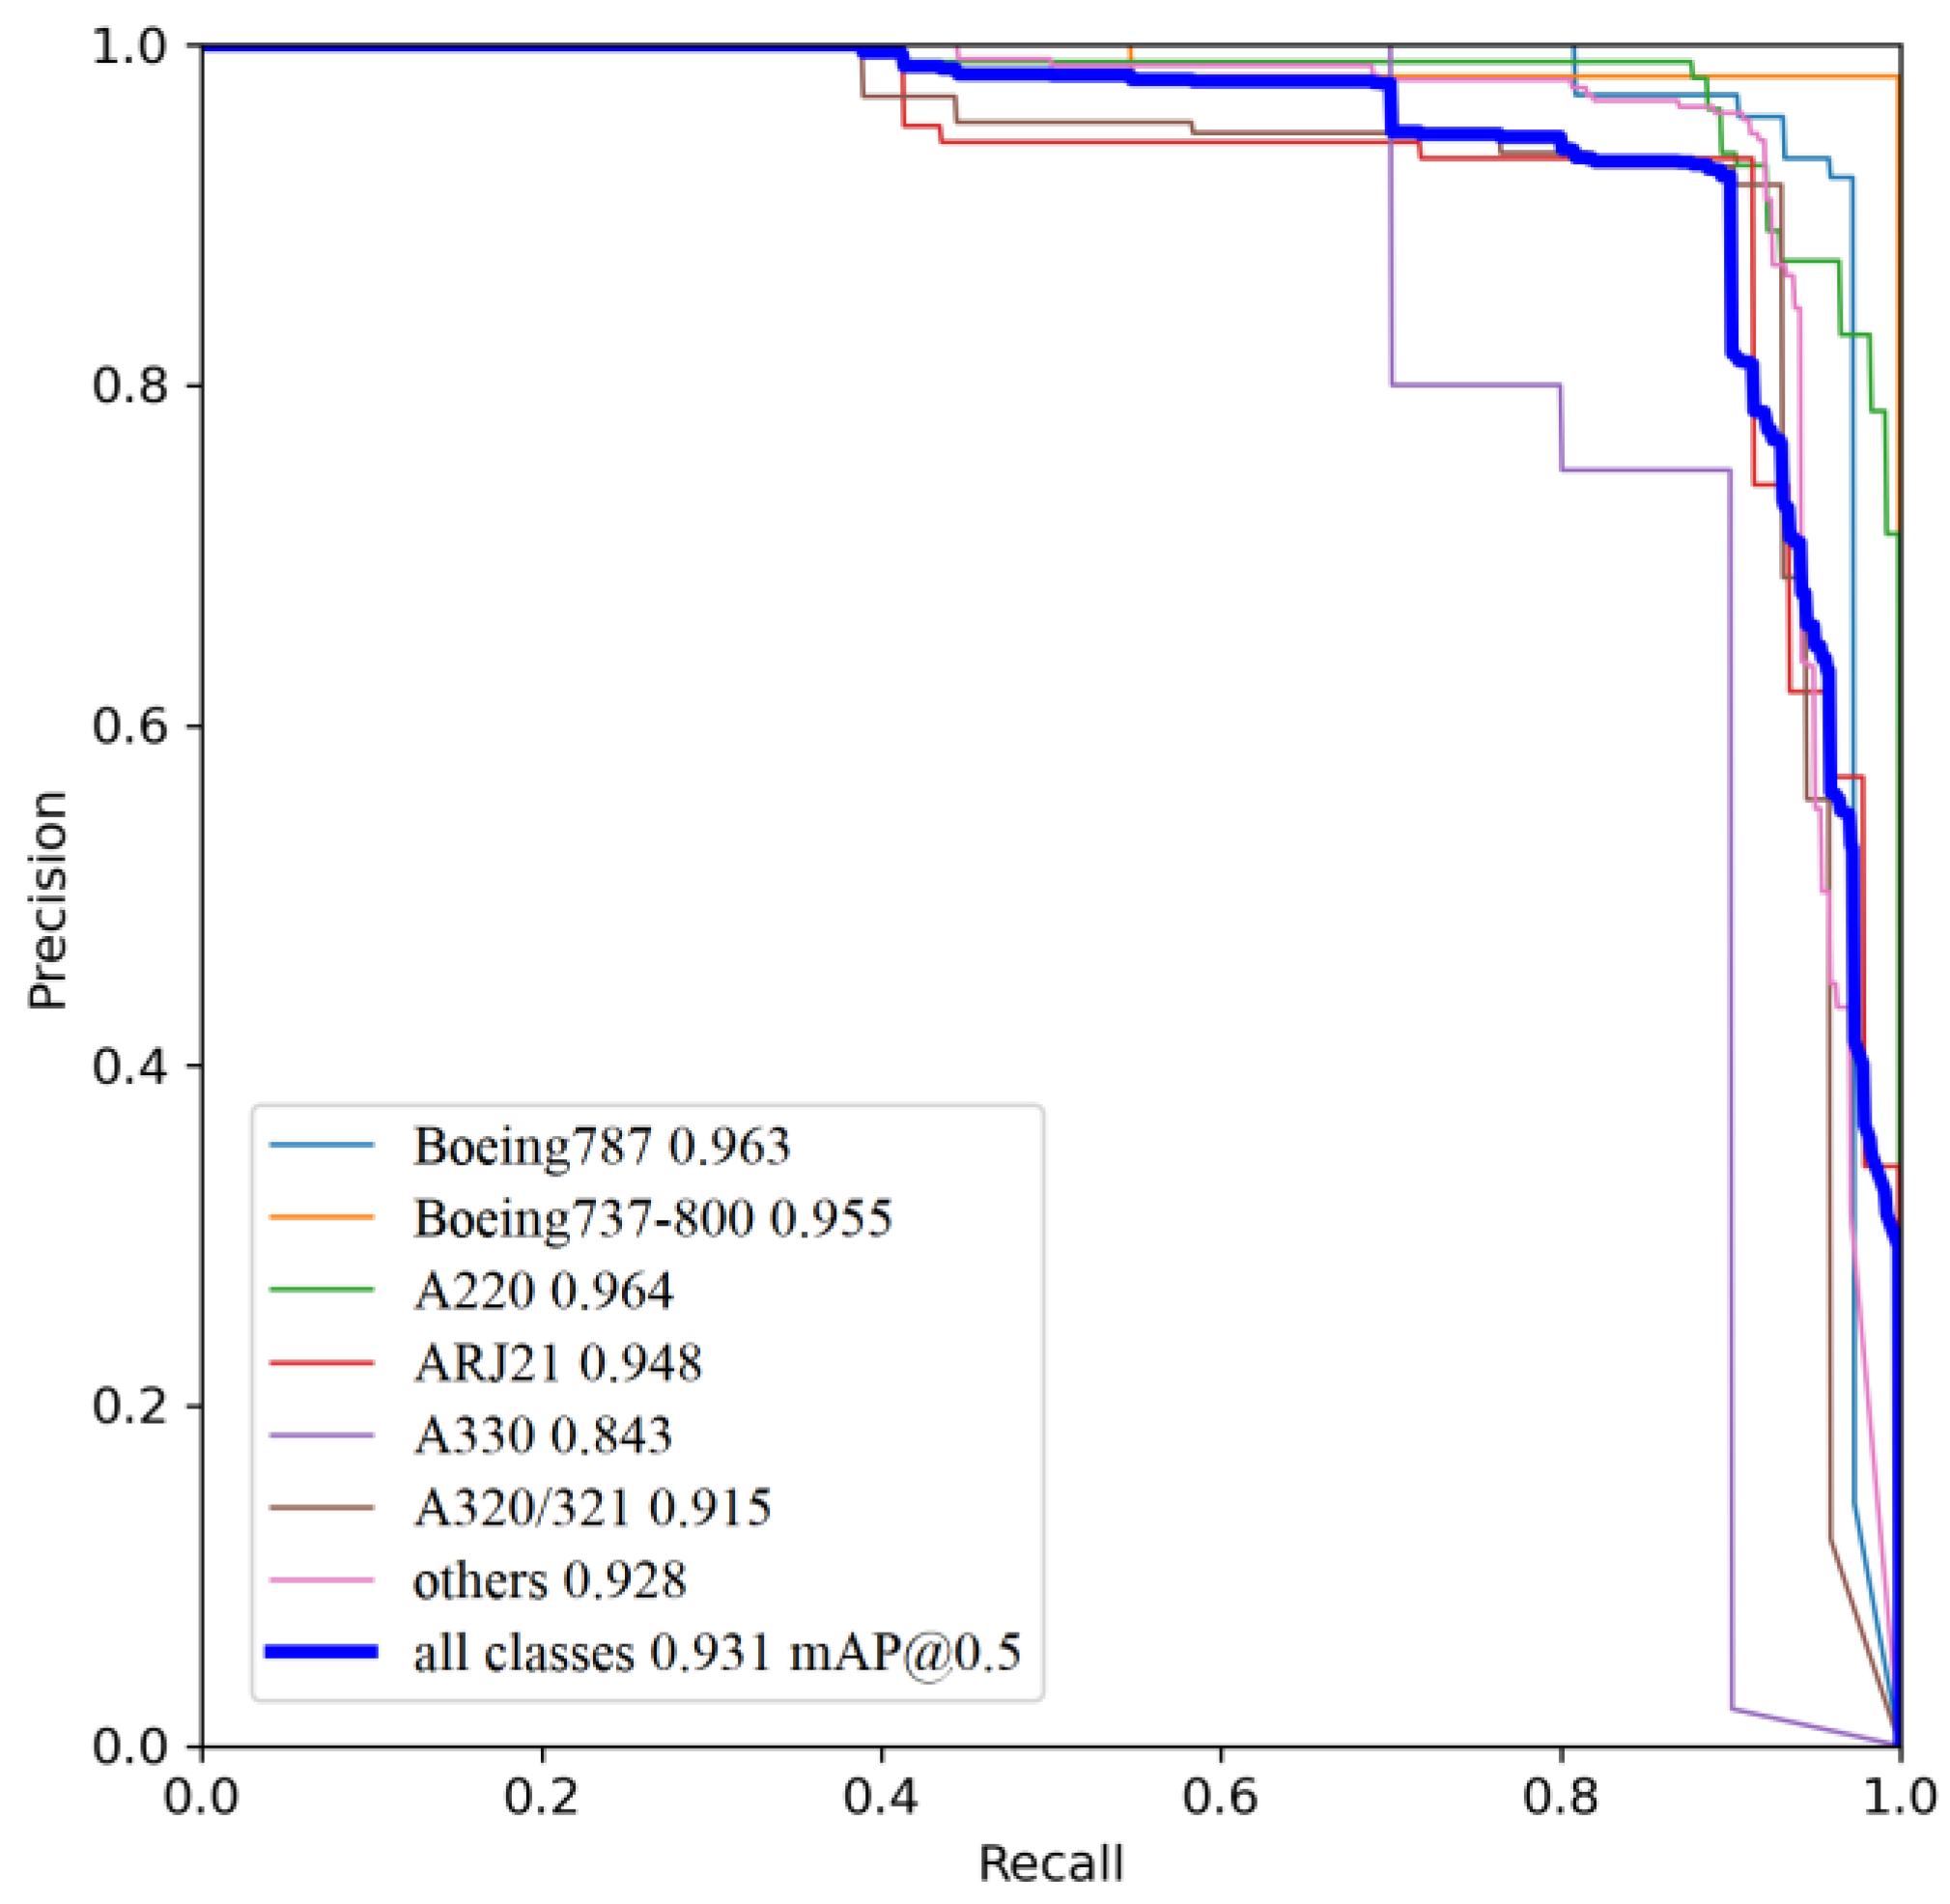
4.4. Analysis of the Experimental Results

Our improved YOLOv5 model was compared with other mainstream target-recognition algorithms, which include Faster R-CNN, Retina-Net, SSD, YOLOv3, and YOLOv5s. Table 2 lists the performance of these algorithms in terms of recognition.
The first column shows the algorithm used. The middle seven columns show the AP of prediction for each type of aircraft. The last column shows the mAP of prediction of all types. YOLOv5 has four network models: YOLOv5s, YOLOv5m, YOLOv5l, and YOLOv5x. Considering the requirement of detection speed, we chose YOLOv5s as the baseline. We proposed the four optimization methods described above based on YOLOv5s. From the data on the experiments shown in Table 2, we can see that our improved algorithm achieved the best recognition precision compared with the state-of-the-art algorithms. Compared with the original YOLOv5s algorithm, mAP also increased by 5.8%. The experiments demonstrated that the improved YOLOv5s algorithm is more suitable for recognizing aircraft targets of SAR images than the original YOLOv5 algorithm.
Figure 8 shows the PR curves of the improved YOLOv5s algorithm. The area covered by the PR curve is the predicted AP value. The larger the area, the better the performance of the algorithm in terms of detection. There are eight PR curves with different colors in the figure. The thinner curve represents the PR curve of the individual aircraft types. The thicker curve represents the average PR curve of all types, which was used to evaluate the precision of the algorithm’s detection.

4.5. Ablation Experiments

To further prove the progressiveness and superiority of our proposed method, we performed several groups of ablation experiments. All the improved models in the experiment used YOLOv5s as the baseline. “×” indicates that the corresponding improvement method was not used, and “√” indicates that the corresponding improvement method was used. In this study, mAP50, mAP75, and mAP50–95 were used to evaluate the recognition precision. In addition, we considered other ways to evaluate the performance: parameter size of the model (PARAM), giga floating-point operations per second (FLOPs), and detection frames per second (FPS). The results are shown in Table 3.
Experiment 1 used the original YOLOv5s model. The mAP50 was 0.873. To increase the precision of detection, experiment 2 incorporated the newly designed MAFA module, which improved the mAP50 to 0.912. However, the PARAM of the model was 11.5 M, which was higher than the original value (7.0 M), and the FPS was 111, which was slower than the original (116). Then, we considered how to improve the speed of detection and reduce the model’s size. Firstly, we proposed using the loss function SIOU to replace the CIOU to improve the speed of detection. The effect was quite obviously proved by comparative experiments 1 and 3, and experiments 2 and 4. Experiment 3 only optimized the loss function SIOU, and the FPS was 127. Experiment 4 combined the MAFA module and SIOU, and the FPS was 118. The precision of detection was also slightly improved. Secondly, we designed the Ghost-Conv and SE-Ghost-C3 lightweight network, which reduced the number of parameters of the model by about 3 M in comparative experiments 1 and 5, and experiments 4 and 6. Experiment 5 only used the designed lightweight network, and the PARAM of the model was 4.1 M. Experiment 6 combined the MAFA module, SIOU, and the lightweight network, and the PARAM of the model was 8.4 M. The precision and speed of detection were almost unaffected. Finally, to further improve the accuracy of detection, the CA mechanism was incorporated into the model. Experiments 7 and 8 verified that the accuracy of detection improved to a certain extent compared with the original model. We used the final improved YOLOv5s structure in experiment 8. The accuracy of detection reached 0.931, which was 0.058 higher than that of the original YOLOv5s network, and the performance in terms of detection was barely affected. Figure 9 shows the results.
Figure 9 shows four typical images in the results. The results based on the YOLOv5s algorithm had some false alarms and missed detections, which are marked by red circles in Figure 9b. Our improved YOLOv5s algorithm greatly improved these issues, as shown in Figure 9c. A large number of experiments have proven that our improved YOLOv5s algorithm has better performance in terms of detection.

5. Conclusions

We proposed an improved YOLOv5 structure to recognize aircraft targets in SAR images. To meet detection speed requirements, we chose YOLOv5s as the baseline. We designed the MFAF module, which was applied as the head section of YOLOv5s. The MFAF module could better fuse features with different scales, and it effectively improved the precision of detection. However, it increased the size of the model and reduced the speed of detection. To solve these problems, we designed the Ghost-Conv and SE-Ghost-C3 lightweight network structure and adopted the SIOU loss function. A large number of experiments proved that these methods were effective. To further improve the ability to extract features, we adopted the CA mechanism, which was embedded into the backbone of YOLOv5s. It also improved the precision of detection. Compared with original YOLOv5s, our algorithm effectively improved the precision of detection without affecting the model’s size and the speed of detection. Compared with current state-of-the-art algorithms, our improved algorithm also achieved the best performance in terms of detection.
SAR images contain a large amount of speckled noise. Moreover, the size of the aircraft targets in SAR images is also on multiple scales. These factors interfere with the recognition of aircraft targets. To further improve the precision of detection, future research should mainly focus on the following aspects. Firstly, we should consider how to preprocess SAR images to reduce the impact of speckled noise. Secondly, we should consider how to optimize the structure of the neck section to better fuse the multiscale features. Thirdly, there is currently only one publicly available dataset for recognizing aircraft targets in SAR images, so we should consider how to improve the generalizability of the improved model we designed here in different scenarios.

Author Contributions

Conceptualization, W.H. and X.W.; methodology, Y.L. and X.W.; software, X.W.; validation, D.H.; resources, Y.L. and P.X.; data curation, W.H.; writing—original draft preparation, X.W.; writing—review and editing, W.H. and Y.L.; supervision, W.H. All authors have read and agreed to the published version of the manuscript.

Funding

This research was funded by the key subject of the Ministry of Science and Technology of China (Grant No. 2022YFC2203901), Science and Technology Development Plan Project of Jilin Province, China (Grand No. 20230201099GX), Department of Education Science and Technology Research Project of Jilin Province, China (Grand No. JJKH20220053KJ).

Institutional Review Board Statement

Not applicable.

Informed Consent Statement

Not applicable.

Data Availability Statement

The dataset used in this research can be obtained from the 2021 Gaofen challenge on Automated High-Resolution Earth Observation Image Interpretation. Available online: http://gaofen-challenge.com (accessed on 1 October 2021).

Acknowledgments

The authors would like to thank the anonymous reviewers.

Conflicts of Interest

The authors declare no conflict of interest.

References

  1. Fu, K.; Dou, F.; Li, H.; Diao, W.; Sun, X.; Xu, G. Aircraft Recognition in SAR Images Based on Scattering Structure Feature and Template Matching. IEEE J. Sel. Top. Appl. Earth Obs. Remote Sens. 2018, 11, 4206–4217. [Google Scholar] [CrossRef]
  2. He, C.; Tu, M.; Liu, X.; Xiong, D.; Liao, M. Mixture Statistical Distribution Based Multiple Component Model for Target Detection in High Resolution SAR Imagery. ISPRS Int. J. Geo-Inf. 2017, 6, 336. [Google Scholar] [CrossRef]
  3. Dou, F.; Diao, W.; Sun, X.; Zhang, Y.; Fu, K. Aircraft reconstruction in high-resolution SAR images using deep shape prior. ISPRS Int. J. Geo-Inf. 2017, 6, 330. [Google Scholar] [CrossRef]
  4. Feng, B.; Tang, W.; Feng, D. Target Recognition of SAR images via Hierarchical Fusion of Complementary Features. Opt. Int. J. Light Electron Opt. 2020, 217, 164695. [Google Scholar] [CrossRef]
  5. Zhang, Y.; Hao, Y. A Survey of SAR Image Target Detection Based on Convolutional Neural Networks. Remote Sens. 2022, 14, 6240. [Google Scholar] [CrossRef]
  6. Girshick, R.; Donahue, J.; Darrell, T.; Malik, J. Rich feature hierarchies for accurate object detection and semantic segmentation. In Proceedings of the 2014 IEEE Conference on Computer Vision and Pattern Recognition (CVPR), Columbus, OH, USA, 23–28 June 2014; pp. 580–587. [Google Scholar] [CrossRef]
  7. Girshick, R. Fast r-cnn. In Proceedings of the 2015 IEEE Conference on Computer Vision and Pattern Recognition (CVPR), Boston, MA, USA, 8–10 June 2015; pp. 1440–1448. [Google Scholar] [CrossRef]
  8. Ren, S.; He, K.; Girshick, R.; Sun, J. Faster R-CNN: Towards Real-Time Object Detection with Region Proposal Networks. IEEE Trans. Pattern Anal. Mach. Intell. 2017, 39, 1137–1149. [Google Scholar] [CrossRef] [PubMed]
  9. He, K.; Gkioxari, G.; Dollár, P.; Girshick, R. Mask R-CNN. In Proceedings of the 2017 IEEE International Conference on Computer Vision (ICCV), Venice, Italy, 22–29 October 2017; pp. 2961–2969. [Google Scholar] [CrossRef]
  10. Liu, W.; Anguelov, D.; Erhan, D.; Szegedy, C. SSD: Single shot multibox detector. In Proceedings of the European Conference on Computer Vision, Amsterdam, The Netherlands, 11–14 October 2016; pp. 21–37. [Google Scholar] [CrossRef]
  11. Lin, T.; Goyal, P.; Girshick, R.; He, K.; Dollar, P. Focal loss for dense object detection. In Proceedings of the IEEE International Conference on Computer Vision (ICCV), Venice, Italy, 22–29 October 2017; pp. 2980–2988. [Google Scholar] [CrossRef]
  12. Redmon, J.; Divvala, S.; Girshick, R.; Farhadi, A. You only look once: Unified, real-time object detection. In Proceedings of the IEEE Conference on Computer Vision and Pattern Recognition, Las Vegas, NV, USA, 27–30 June 2016; pp. 779–788. [Google Scholar] [CrossRef]
  13. Zhang, L.; Li, C.; Zhao, L.; Xiong, B.; Kuang, G. A cascaded three-look network for aircraft detection in SAR images. Remote Sens. Lett. 2020, 11, 57–65. [Google Scholar] [CrossRef]
  14. Guo, Y.; Chen, S.; Zhan, R.; Wang, W.; Zhang, J. SAR Ship Detection Based on YOLOv5 Using CBAM and BiFPN. In Proceedings of the 2022 IEEE International Geoscience and Remote Sensing Symposium IGARSS, Kuala Lumpur, Malaysia, 17–22 July 2022; pp. 2147–2150. [Google Scholar] [CrossRef]
  15. Woo, S.; Park, J.; Lee, J.Y.; Kweon, I.S. CBAM: Convolutional block attention module. In Proceedings of the European Conference on Computer Vision (ECCV), Munich, Germany, 8–14 September 2018. [Google Scholar] [CrossRef]
  16. Tan, M.; Pang, R.; Le, Q.V. Efficientdet: Scalable and efficient object detection. In Proceedings of the IEEE/CVF Conference on Computer Vision and Pattern Recognition, Seattle, WA, USA, 13–19 June 2020; pp. 10781–10790. [Google Scholar] [CrossRef]
  17. Xiao, X.; Jia, H.; Xiao, P.; Wang, H. Aircraft Detection in SAR Images Based on Peak Feature Fusion and Adaptive Deformable Network. Remote Sens. 2022, 14, 6077. [Google Scholar] [CrossRef]
  18. Zheng, Z.; Wang, P.; Liu, W.; Li, J.; Ye, R.; Ren, D. Distance-IoU loss: Faster and better learning for bounding box regression. In Proceedings of the AAAI Conference on Artificial Intelligence 2020, New York, NY, USA, 7–12 February 2020; pp. 12993–13000. [Google Scholar] [CrossRef]
  19. Gevorgyan, Z. SIoU Loss: More Powerful Learning for Bounding Box Regression. arXiv 2022, arXiv:2205.12740. [Google Scholar] [CrossRef]
  20. Tian, Z.; Huang, J.; Yang, Y.; Nie, W. KCFS-YOLOv5: A High-Precision Detection Method for Object Detection in Aerial Remote Sensing Images. Appl. Sci. 2023, 13, 649. [Google Scholar] [CrossRef]
  21. Han, K.; Wang, Y.; Tian, Q.; Guo, J.; Xu, C.; Xu, C. Ghostnet: More features from cheap operations. In Proceedings of the 2020 IEEE/CVF Conference on Computer Vision and Pattern Recognition (CVPR), Seattle, WA, USA, 14–19 June 2020; pp. 1580–1589. [Google Scholar] [CrossRef]
  22. Hu, Y.; Liu, G.; Chen, Z.; Guo, J. Object Detection Algorithm for Wheeled Mobile Robot Based on an Improved YOLOv4. Appl. Sci. 2022, 12, 4769. [Google Scholar] [CrossRef]
  23. Hou, Q.; Zhou, D.; Feng, J. Coordinate Attention for Efficient Mobile Network Design. In Proceedings of the 2021 IEEE/CVF Conference on Computer Vision and Pattern Recognition (CVPR), Nashville, TN, USA, 20–25 June 2021; pp. 13708–13717. [Google Scholar] [CrossRef]
  24. Bochkovskiy, A.; Wang, C.Y.; Liao, H.Y.M. YOLOv4: Optimal Speed and Accuracy of Object Detection. arXiv 2020, arXiv:2004.10934. [Google Scholar] [CrossRef]
  25. Lin, Y.; Dollár, P.; Girshick, R.; He, K.; Hariharan, B.; Belongie, S. Feature Pyramid Networks for Object Detection. In Proceedings of the IEEE International Conference on Computer Vision, Venice, Italy, 22–29 October 2017; pp. 2117–2125. [Google Scholar] [CrossRef]
  26. Liu, S.; Qi, L.; Qin, H.; Shi, J.; Jia, J. Path Aggregation Network for Instance Segmentation. In Proceedings of the IEEE Conference on Computer Vision and Pattern Recognition, Salt Lake City, UT, USA, 18–23 June 2018; pp. 8759–8768. [Google Scholar] [CrossRef]
  27. Bodla, N.; Singh, B.; Chellappa, R.; Davis, L.S. Soft-NMS—Improving object detection with one line of code. In Proceedings of the IEEE International Conference on Computer Vision (ICCV), Venice, Italy, 22–29 October 2017; pp. 5561–5569. [Google Scholar] [CrossRef]
  28. Liu, S.; Huang, D.; Wang, Y. Learning Spatial Fusion for Single-Shot Object Detection. arXiv 2019, arXiv:1911.09516. [Google Scholar] [CrossRef]
  29. Jie, H.; Li, S.; Samuel, A.; Gang, S.; Enhua, W. Squeeze-and-Excitation Networks. IEEE Trans. Pattern Anal. Mach. Intell. 2020, 42, 2011–2023. [Google Scholar]
  30. Wang, G.; Wang, K.; Lin, L. Adaptively connected neural networks. In Proceedings of the IEEE/CVF Conference on Computer Vision and Pattern Recognition, Long Beach, CA, USA, 16–20 June 2019; pp. 1781–1790. [Google Scholar] [CrossRef]
  31. He, K.; Zhang, X.; Ren, S.; Sun, J. Deep Residual Learning for Image Recognition. In Proceedings of the 2016 IEEE/CVF Conference on Computer Vision and Pattern Recognition (CVPR), Las Vegas, NV, USA, 27–30 June 2016; pp. 770–778. [Google Scholar]
  32. Ihsanto, E.; Ramli, K.; Sudiana, D.; Gunawan, T.S. Fast and Accurate Algorithm for ECG Authentication Using Residual Depthwise Separable Convolutional Neural Networks. Appl. Sci. 2020, 10, 3304. [Google Scholar] [CrossRef]
  33. Howard, A.; Zhu, M.; Chen, B.; Kalenichenko, D.; Wang, W.; Weyand, T.; Andreetto, M.; Adam, H. MobileNets: Efficient Convolutional Neural Networks for Mobile Vision Applications. arXiv 2017, arXiv:1704.04861. [Google Scholar] [CrossRef]
  34. Wang, C.Y.; Liao, H.Y.M.; Wu, Y.H.; Chen, P.Y.; Hsieh, J.W.; Yeh, I.H. CSPNet: A new backbone that can enhance learning capability of CNN. In Proceedings of the IEEE/CVF Conference on Computer Vision and Pattern Recognition, Seattle, WA, USA, 14–19 June 2020; pp. 390–391. [Google Scholar] [CrossRef]
  35. Park, J.; Woo, S.; Lee, J.; Kweon, I.S. BAM: Bottleneck Attention Module. arXiv 2018, arXiv:1807.06514. [Google Scholar]
  36. 2021 Gaofen Challenge on Automated High-Resolution Earth Observation Image Interpretation. Available online: http://gaofen-challenge.com (accessed on 1 October 2021).
Figure 1. Structure of the MFAF module.
Applsci 13 06160 g001
Figure 2. Structure of the Ghost-Conv and SE-Ghost-C3 modules.
Applsci 13 06160 g002
Figure 3. Structure of the CA mechanism.
Applsci 13 06160 g003
Figure 4. Aircraft targets in SAR images. The green and yellow boxes represent aircraft targets and complex backgrounds, respectively. (a) Scattering points of the aircraft targets. (b) Interference of the complex background.
Applsci 13 06160 g004
Figure 5. Structure of the improved YOLOv5.
Applsci 13 06160 g005
Figure 6. Examples of seven categories of aircraft.
Applsci 13 06160 g006
Figure 7. Distribution of the bounding boxes of the aircraft targets in our dataset. (a) Distribution of the sizes of the bounding boxes. (b) Distribution of the bounding boxes’ aspect ratios.
Applsci 13 06160 g007
Figure 8. PR curves of the improved YOLOv5s algorithm.
Applsci 13 06160 g008
Figure 9. Comparison of the results for the original YOLOv5s and the improved YOLOv5s. (a) Bounding boxes of the SAR images in the dataset. (b) Results for the original YOLOv5s. (c) Results for the improved YOLOv5s.
Applsci 13 06160 g009
Table 1. Configuration of the computer software environment.
ParameterConfiguration
CPUInter(R) Core(TM) i7-7820X CPU @ 3.60 GHz
GPUNVIDIA TITAN Xp
AcceleratorCUDA 10.2
ArchitecturePytorch 1.9
LanguagePython 3.8
Epochs400
Batch size32
Learning rate0.01
OptimizerSGD
Mosaic 1.0
Flipud, Fliplr0, 0.5
Scale0.5
Table 2. Comparative analysis of performance in terms of recognition.
MethodBoeing 787Boeing 737A220ARJ21A330A320/321OthersAll
AP50AP50AP50AP50AP50AP50AP50mAP50
Faster R-CNN0.9110.8520.8490.8760.8010.8580.8670.859
Retina-Net0.8500.8150.8090.8430.7580.7960.8110.812
SSD0.8320.8050.7890.8670.7640.7830.7970.805
YOLOv30.8980.9110.8730.9160.7440.8520.8710.866
YOLOv5s0.8900.9060.8740.9140.8160.8540.8550.873
Improved YOLOv5s0.9630.9550.9640.9480.8430.9150.9280.931
Table 3. Comparative analysis of the ablation experiments.
NO.MFAFSIOUSE-GhostCAmAP50mAP75mAP50–95PARAMGFLOPsFPS
1××××0.8730.7350.6327.0M16.0116
2×××0.9120.8130.73311.5M16.0111
3×××0.8810.7470.6517.0M16.0127
4××0.9260.8430.75911.5M16.0118
5×××0.8700.7300.6284.1M12.1118
6×0.9220.8400.7538.4M12.1119
7×××0.8850.7560.6527.5M17.6116
80.9310.8560.7728.8M14.2118
Disclaimer/Publisher’s Note: The statements, opinions and data contained in all publications are solely those of the individual author(s) and contributor(s) and not of MDPI and/or the editor(s). MDPI and/or the editor(s) disclaim responsibility for any injury to people or property resulting from any ideas, methods, instructions or products referred to in the content.

