Article

Performance Analysis of Ambient Backscatter NOMA Systems

1
The Key Laboratory of Information and Communication Systems, Ministry of Information Industry, Beijing Information Science and Technology University, Beijing 100101, China
2
Key Laboratory of Modern Measurement & Control Technology, Ministry of Education, Beijing Information Science and Technology University, Beijing 100101, China
*
Author to whom correspondence should be addressed.
Appl. Sci. 2023, 13(10), 6166; https://doi.org/10.3390/app13106166
Submission received: 17 April 2023 / Revised: 5 May 2023 / Accepted: 12 May 2023 / Published: 18 May 2023

Abstract

:
This paper analyzed the performance of an ambient-backscatter-(AmBC)-assisted non-orthogonal multiple access (NOMA) system, where a backscatter device (BD) broadcasts its signal to numerous users. More specifically, the realistic assumptions of imperfect successive interference cancellation (ipSIC) and residual hardware impairments (RHIs) for AmBC–NOMA systems were taken into consideration. We further derived the closed-form and asymptotic expressions of outage probability for the BD and the d-th user. Based on the asymptotic expressions, the diversity orders of the BD and the d-th user were obtained in the high SNR regime. Furthermore, throughput and energy efficiency are further discussed for AmBC-assisted orthogonal multiple access (OMA) systems in the delay-limited transmission model. The numerical results revealed that: (i) AmBC–NOMA systems have the ability to achieve better outage behavior than AmBC–OMA; (ii) due to the existence of the backscatter link, the error floors of outage probability for the BD and the d-th user appear at a high signal-to-noise ratio; (iii) AmBC–NOMA systems are able to achieve higher energy efficiency and throughput than AmBC–OMA systems.

1. Introduction

Given the explosion of connected wireless devices and data traffic, human society has evolved into the age of the internet of things (IoT), the ubiquitous and intelligent connectivities between people, machines, and things [1,2]. According to predictions, the number of mobile terminals accessing networks worldwide will exceed 125 billion by 2030 [3]. Such a large number of connected devices poses two challenges for future mobile communications. Firstly, the limited availability of wireless frequency resources is an important bottleneck, which prevents wireless communications’ further development [4]. Non-orthogonal multiple access (NOMA), with its high spectrum utilization, is the solution to enabling large-scale transmission networks for the IoT [5]. Secondly, energy efficiency (EE) is a key factor in the sustainability of mobile transmission networks. Backscatter technology enables low-power communication, by absorbing the energy of surrounding radio frequency (RF) signals [6].
NOMA enables multi-user connectivity through a non-orthogonal resource allocation method. Compared to orthogonal multiple access (OMA), NOMA is characterized by superior spectral efficiency, link density, and user fairness [7,8,9]. The fundamental tenet of NOMA lies in transmitting the superposed signals to numerous users within the same time/frequency resource blocks, so that the receivers can then distinguish various signals by utilizing successive interference cancellation (SIC) technology [10,11,12]. The authors in [13] optimized the performance of the distributed uplink NOMA, by finding the optimal decoding order. In [14], the authors surveyed the achievable rate region, by analyzing the outage probability (OP) of NOMA users, and proved the optimal SIC order. Considering the vulnerability of signals in wireless channels to eavesdropping, the authors of [15] examined cooperative NOMA networks’ effectiveness, in terms of secrecy, at providing valuable security properties.
On a parallel avenue, backscatter communication is capable of absorbing energy from nearby RF signals. It has evolved into a potential remedy for the problem of energy limitation of wireless communication networks [16]. Traditional backscatter communication networks consist of one reader and a backscatter device (BD) [17]. It is worth pointing out that a BD has no extra active components (i.e., oscillators and amplifiers). The typical commercial application of the BD is radio frequency identification [18]. The BD allows wireless devices to transmit data passively, and modulates the RF signal through mismatched antenna impedance [19]. The authors of [20] investigated a relay collaboration scheme that maximized system throughput by optimizing time allocation. However, traditional backscatter communications may not be suitable for IoT devices, as these devices consume energy in active transmission mode [21].
To resolve this issue, in [22], the authors evaluated a new transmission scheme: the ambient backscattering (AmBC) system. The RF signal of AmBC can make use of the signal from the surrounding environment (e.g., bluetooth signal or cellular signals) as the source of the RF, instead of the unmodulated RF signals [23,24]. In [23], the authors surveyed a system model of two devices utilizing ambient RF as the sole power source for communication and a prototype of an ambient BD. The authors in [24] studied the adoption of AmBC for RF power, where a secondary receiver receives data from a secondary transmitter via an AmBC signal. To further reduce power consumption, the authors of [25] considered the combination of both backscatter communication and wireless communication technologies. In [26], the authors proposed a collaborative AmBC system based on spread spectrum and spectrum sharing, which allowed the reader to decode information from the BD. To increase the system’s actual performance gain, the authors of [27] optimized the BD’s reflection coefficient, to improve the system throughput. In [28], the authors researched the adoption of frequency division multiplexed signals as carriers on AmBC systems, and analyzed the effect of receiving antenna count on system performance.
The previous works have caused significant delays to BDs, due to the short time it takes for a BD to transmit information. To reduce system latency and improve system performance gains, collaboration between the AmBC and NOMA technologies was studied in [29,30,31]. In [29], the authors derived the OP expressions in the AmBC-assisted NOMA systems, and the asymptotic OP expressions of the system were further obtained. In addition, the authors of [30] analyzed the effective throughput of two downlink NOMA users and a BD. The sum rate of the system maximization algorithm of AmBC–NOMA was surveyed in [31], with the consideration of both the transmitting power and the reflecting coefficients. In [32], the authors investigated the performance analysis of combined NOMA and AmBC, which improved the spectral efficiency and EE of the systems. The authors of [33] studied two transceiver design approaches to achieving different trade-offs in performance gain and complexity for AmBC–NOMA systems. To facilitate efficient sharing of backscattered carrier spectrum resources, the authors in [34] proposed a hierarchical multiple access plan that allowed multiple access between groups, based on the spatial division of beamforming. In [35], the authors introduced the transmission scheme of the AmBC–NOMA system, which enabled simultaneous energy and spectrum cooperation between uplink and downlink users. Additionally, the authors of [36] evaluated the outage of the AmBC systems, by taking into account the in-phase and uneven quadrature phase characteristics.

1.1. Motivations and Contributions

The above studies provide an excellent basis for AmBC-assisted NOMA systems. RF components are susceptible to damage from phase imbalance, phase noise, and other defects in actual scenes [37], yet there is little research on the impact of residual hardware impairments (RHIs) on system performance. The effects of imperfect successive interference cancellation (ipSIC) on system performance need to be investigated, considering that there are residential interference and SIC process quantization errors, which will lead to incomplete decoding. Inspired by these, we examined the impact of RHIs and ipSIC on the OP, throughput, and EE for AmBC–NOMA systems. The major contributions are outlined as follows:
  • We suggest a model of the AmBC–NOMA system, with the channel modeled as a multi-user ordering of the Rayleigh channel. We derived the closed-form and asymptotic expressions for the OP of the d-th user and for a BD with ipSIC/perfect successive interference cancellation (pSIC), respectively. On this basis, we calculated the diversity order of the d-th user, which was heavily influenced by the level of residential interference and RHIs;
  • We show that AmBC–NOMA systems have better outage behavior than AmBC–OMA systems. In addition, due to the existence of the ipSIC and RHIs, the error floors of OP for a BD and the d-th user appear in the high signal-to-noise ratio (SNR) regime;
  • We investigated the throughputs of users and BD with ipSIC/pSIC, respectively. Furthermore, we analyzed the impact of the ipSIC and reflection coefficients on the throughputs for the users and the BD. We observed that the throughput of the far users in the AmBC–NOMA systems was lower than in the AmBC–OMA systems.
  • We evaluated the EE of the AmBC–NOMA systems with ipSIC/pSIC in the delay-limited transmission mode, where the performance of AmBC–NOMA systems under pSIC was better than that of its counterpart. Moreover, we examined the effect of RHIs on AmBC–NOMA systems’ EE.

1.2. Organization and Notations

The remaining sections in this paper are structured as follows: a system model and specific signal representation for multi-user sequencing are presented in Section 2; Section 3 analyzes the OP and throughput of the AmBC–NOMA systems; the EE performance of AmBC–NOMA systems is studied in Section 4; the analysis and verification of the simulation results are in Section 5; Section 6 provides conclusions. The specific derivations of the formulae are included in the Appendix A and Appendix B.
The main notations used in this paper are shown as follows: E { · } denotes expectation operation; f X · and F X · denote the probability density function (PDF) and the cumulative distribution function (CDF) of a random variable X, respectively.

2. System Model

We considered an AmBC–NOMA system, as depicted in Figure 1: the fixed base station (BS) sent a data signal x ( t ) to the downlink users D i ( 1 i D ) and to the BD. Furthermore, as the data signal x ( t ) excited the circuitry of the uplink BD, the BS and the BD simultaneously transmitted signals to the NOMA users. We assumed that all nodes of the AmBC–NOMA systems were fitted with an antenna. As the BD was a passive component, we assumed that the information processing delay of the BD and the power consumption of the circuit had a negligible effect on the reflected signal. Due to the complex radio environment in urban districts, all the channels in Figure 1 were assumed to obey Rayleigh fading. In order to simplify the analysis, all the nodes were considered a single antenna in the AmBC–NOMA systems. Our future work will consider complicated scenarios (e.g., multi-antenna and multi-cell scenarios). On the premise of not losing generality, the fading channel gains ordering between the BS and the users were h 1 2 h d 2 h D 2 , where g i indicates the efficient channels gains from the BD to users, i 1 , D . Considering that the channels between the BD and the users were heavily attenuated, SIC technology was adopted for users to extract desired signals: specifically, the user first decoded its signal from the superimposed signal, and then decoded the backscatter signal c ( t ) afterwards.

2.1. Signal Model

The data signal x ( t ) at the BS was represented as x ( t ) = i = 1 D a i P s x i ( t ) , where x i ( t ) was the unit power signal of the i-th user, and satisfied E { x i 2 ( t ) } = 1 . To ensure user fairness, the corresponding power allocation factor a i met the relationship a 1 a d a D , with i = 1 D a i = 1 . P s denoted the normalized transmission power [38].
Next, the BS sent data signals to the downlink users. In addition, the data signals were used to excite circuits in the uplink BD, which generated and sent a backscatter signal c ( t ) to the NOMA users, with E c i 2 ( t ) = 1 . Hence, all users were capable of receiving signals from both the backscatter links and the direct links, where the received signal at the i-th user was formulated as
y i = h i x ( t ) + η s i + β f g i x ( t ) c ( t ) + η s i + n i ( t ) .
We expressed h i C N 0 , λ h , i , f C N 0 , λ f , and g i C N 0 , λ g , i as the channel coefficients between the BS and the i-th user, between the BS and the BD, and between the BD and the i-th user, respectively. β was the reflected coefficient at the BD, which was used to send different signals, and to normalize the signal c ( t ) . The additive white Gaussian noise of the radio link at the i-th user was denoted by n i C N 0 , σ 2 . The impairment factor of the hardware facilities among the BS, the users, and the BD was indicated by η s i C N 0 , κ s i 2 P S , κ s i 2 [37]. Due to the large fading of the backscatter links, the farthest user was decoded first, and then the other signals were decoded with the assistance of the SIC; therefore, for the d-th user, the received signal-plus-interference-to-noise ratio (SINR) for detecting the q-th user’s information is written as
γ d q = ρ h d 2 a d ρ h d 2 ϑ d + ρ β 2 f 2 g d 2 τ d + w ¯ ρ h I 2 + 1 ,
where τ d = ( 1 + κ s d 2 ) , ϑ d = i = q + 1 D a i + κ s d 2 , ρ = P s N 0 represented the transmitting SNR at the BS. The residual interference level for SIC was w ¯ [ 0 , 1 ] . More specifically, w ¯ = 0 and w ¯ 0 indicated the switchover between pSIC and ipSIC, respectively. On the premise of not losing generality, since Rayleigh channel fading was anticipated for the channel in the case of ipSIC, the corresponding channel fading coefficient was expressed as h I C N 0 , λ I . The SIC technique was adopted at the D-th user, to remove the signals from the previous ( D 1 ) user before analyzing its signal. The received SINR of the D-th user was provided by
γ D = ρ h D 2 a D ρ h D 2 κ S D 2 + ρ β 2 f 2 g D 2 τ D + w ¯ ρ h I 2 + 1 .
Leveraging the SIC technology, the backscatter signal could be decoded by the D-th user. The SINR of the BD can be written as
γ B D = ρ β 2 f 2 g D 2 ρ h D 2 κ S D 2 + w ¯ ρ h I 2 + 1 .

2.2. OMA

For this subsection, we analyzed the expressions for the received signal and the SINR with the OMA transmission scheme, which were regarded as benchmarks. The BD sent signal c ( t ) modulated on the data signal x(t). Under this assumption, the received signal at the d-th user is shown as
y d = h d x t + β f g d x t c t + n d ( t ) .
According to the OMA guidelines, the received SINR expressions for the user and the BD can be obtained from (5). Hence, the received SINR of the d-th user can be expressed as
γ d O M A = ρ h d 2 ρ β 2 f 2 g d 2 + 1 .
The SINR of the BD can be given by
γ B D O M A = ρ β 2 f 2 g D 2 ρ h D 2 + 1 .

3. OP Analysis

This section evaluates the OP performance of AmBC–NOMA systems. Considering the assumption of no interference between channels, we analyzed the outage behavior of the d-th user and the BD, whose asymptotic outage probability expressions were further obtained.

3.1. OP Expressions for the d-th User

An outage event happens if the d-th user is unable to detect the previous q-th data signal. As a result, the OP expression of the d-th user in the case of ipSIC in the AmBC–NOMA systems can be represented as
P d = 1 Pr γ d 1 > γ t h 1 , , γ d d > γ t h d ,
where R q is the threshold rate of the d-th user, with γ t h q = 2 R q 1 , and there is no ipSIC case (i.e., no self-interference) in (8), because the first user does not operate the SIC operations.
Theorem 1.
The closed-form OP expression of the d-th user in the case of ipSIC for AmBC–NOMA systems is given by
P d i p S I C = ϕ d l = 0 D d D d l 1 l d + l r = 1 d + l C d + l r 1 r + 1 × e Ψ d r λ h d Q d e Q d E i Q d 1 λ h I ζ 1 + 1 ,
where ϕ d = D ! D d ! D 1 ! , ψ d = max ψ 1 , , ψ d and ψ d = r t h d ρ ( a d r t h d i = q + 1 D a i + κ s d 2 ) , ψ D = r t h D ρ a D + κ S D 2 , with a d > r t h d ( i = q + 1 D a i + κ s d 2 ) , r t h d = 2 R d 1 with R d to detect the goal rate at the d-th user. ζ 1 = ψ d w ¯ ρ λ h I r + λ h d λ h d λ h I , Q d = λ h d ( a d r t h d i = q + 1 D a i + κ s d 2 ) λ f λ g d β 2 1 + κ s d 2 r t h q r . E i ( x ) is a function of exponential integral and E i ( x ) = x e t t d t [39], where t denotes the variable.
Proof. 
Refer to Appendix A. □
Corollary 1.
For ϖ = 0 , the closed-form OP expression of the d-th user in the case of pSIC for AmBC–NOMA systems is written as
P d p S I C = ϕ d l = 0 D d D d l 1 l d + l r = 1 d + l C d + l r × 1 r + 1 e ψ d r λ h d Q d e Q d E i Q d + 1 .
For AmBC–OMA systems, the outage event appears when the instantaneous SNR is below the threshold SNR. The OP of the d-th user is defined as
P d O M A = Pr γ d O M A < γ t h d O M A ,
where r t h d O M A = 2 R O M A 1 , with R O M A being the threshold rate of the user. Based on the following inference, by removing the order operation, we can get the closed-form OP expression in the AmBC–OMA systems.
Corollary 2.
The closed-form OP expression for AmBC–OMA systems is given by
P d O M A = 1 + e r t h d O M A ρ λ h d Q d O M A e Q d O M A E i Q d O M A ,
where Q d O M A = λ h d λ f λ g d r t h d O M A β 2 .

3.2. OP Expression for the BD

The backscatter signal c ( t ) from the BD will fail to be decoded unless the data signal x ( t ) is decoded correctly; therefore, the OP expression for the BD can be written as
P o u t B D = 1 Pr γ D > γ t h D , γ B D > γ t h B D ,
where γ t h B D is the threshold rate of the BD.
Theorem 2.
The approximate OP expression of BDs for AmBC–NOMA systems can be derived as
P B D i p S I C 1 + ϕ D l = 0 D d r = 1 D D d l 1 l d + l C D r 1 r + 1 e τ 1 Δ b 1 ε 1 e τ 2 Δ b 2 ε 2 π φ y N λ f λ g d n = 1 N ε 1 e ξ 1 ε 2 e ξ 2 D 0 Λ b 1 x n 2 ,
where ε 1 = 1 λ h I ς b 1 , ε 2 = 1 λ h I ς b 2 , Λ b = 2 x n + 1 φ y λ f λ g d , τ 1 = ψ d r λ h d , τ 2 = 1 λ h d ρ κ s d 2 , Δ b 1 = Q b 1 e Q b 1 E i Q b 1 , Δ b 2 = Q b 2 e Q b 2 E i Q b 2 , x n = cos 2 n 1 2 N π , and N is a balance parameter of accuracy and complexity. Q b 1 = λ h d λ f λ g d ψ d ρ β 2 1 + κ s d 2 r , ς b 1 = ψ d ϖ ρ λ h I r + λ h d λ h d λ h I , ξ 1 = 1 λ h d ρ κ s d 2 r x n + 1 φ y 2 λ h d ψ B D ρ κ s d 2 , Q b 2 = λ h d ψ B D ρ κ s d 2 λ f λ g k r , ξ 2 = 2 ψ d r + ψ d ρ β 2 1 + κ s d 2 r x n + 1 φ y 2 λ h d , ς b 2 = λ h d ρ κ s d 2 λ h I λ h I λ h d ρ κ s d 2 , φ y = ψ B D ρ κ s d 2 ψ D + ψ B D 1 ψ B D ρ κ s d 2 ψ D ρ β 2 1 + κ s d 2 , ψ B D = r t h B D ρ β 2 r t h B D β 2 κ s d 2 , r t h B D = 2 R B D 1 , and R B D represents the threshold rate of the BD. K 0 · is the second-kind modification of the zero-order Bessel function.
Proof. 
Refer to Appendix B. □
Corollary 3.
When ϖ = 0 , the approximate OP expression of the BD in the case of pSIC for the AmBC–NOMA systems is given by
P B D p S I C 1 + ϕ D l = 0 D d r = 1 D D d l 1 l d + l C D r 1 r + 1 e τ 1 Δ b 1 e τ 2 Δ b 2 π φ y N λ f λ g d n = 1 N e ξ 1 e ξ 2 K 0 Λ b 1 x n 2 .

3.3. Diversity Analysis

For deeper insight, we obtained the diversity order of the OP in the AmBC–NOMA systems, which described the rate at which the OP decreased with increasing SNR. Hence, the diversity orders D n , n d , B D can be defined as
D n = lim ρ log 2 P n ρ log 2 ρ ,
where P n ρ denotes the OP for the n-th user at high SNRs. The asymptotic outage behaviors for users and BD were analyzed.
Corollary 4.
The diversity order of the d-th user is calculated by (9); when ρ , the asymptotic OP expression of the d-th user in the case of ipSIC for AmBC–NOMA systems is shown as
P d , i p S I C = ϕ d l = 0 D d D d l 1 l d + l r = 1 d + l C d + l r × 1 r + 1 Q d e Q d E i Q d 1 λ h I ζ 1 + 1 .
Corollary 5.
When ϖ = 0 and ρ , the asymptotic OP expression of the d-th user in the case of pSIC for AmBC–NOMA systems is given by
P d , p S I C = ϕ d l = 0 D d D d l 1 l d + l × r = 1 d + l C d + l r 1 r + 1 Q d e Q d E i Q d + 1 .
Remark 1.
By substituting (17) and (18) into (16), the diversity orders for the d-th user with the ipSIC/pSIC in the AmBC–NOMA systems are equal to zero.
Corollary 6.
Similar to the procedure in (5), the asymptotic OP expression of the orthogonal user for the AmBC–OMA systems can be expressed as
P d , O M A = 1 + Q d O M A e Q d O M A E i Q d O M A .
Corollary 7.
At high SNRs, the asymptotic OP expression of the BD in the case of ipSIC for AmBC–NOMA systems can be given by
P B D , i p S I C = 1 + ϕ D l = 0 D d r = 1 D D d l 1 l d + l C D r × 1 r + 1 e τ 1 Δ b 1 ε 1 Δ b 2 π φ y N λ f λ g d × n = 1 N ε 1 e ξ 1 ε 2 e ξ 2 K 0 Λ b 1 x n 2 .
Corollary 8.
For ϖ = 0 , the asymptotic OP expression of the BD in the case of pSIC for the AmBC–NOMA systems can be derived as
P B D , p S I C = 1 + ϕ D l = 0 D d r = 1 D D d l 1 l d + l C D r × 1 r + 1 e τ 1 Δ b 1 Δ b 2 π φ y N λ f λ g d × n = 1 N 1 e ξ 2 K 0 Λ b 1 x n 2 .
Remark 2.
Substituting (20) and (21) into (16), the diversity order of the BD for AmBC–NOMA systems is zero, which is due to the residential interference from ipSIC/pSIC.
Remark 3.
According to Corollaries 4 and 5, and Corollaries 7 and 8, we can determine that RHIs and ipSIC increase the OP of AmBC–NOMA systems, which has a detrimental effect on the performance of the system. The OP of the d-th user and the BD gradually resembles a constant, as the transmitting SNR rises. The system has a diversity order of zero, which leads to the appearance of error floors. Therefore, the diversity orders of users and the BD in AmBC–NOMA systems can be formulated as
D d i p S I C = D d p S I C = D B D i p S I C = D B D p S I C = 0 .

3.4. Delay-Limited Transmission

In delay-limited transmission mode, the BS transmits data at a steady rate. In addition, outage events appear easily in AmBC–NOMA systems, due to the existence of channel fading [40]. Based on the OP’s expressions, the throughput [41] of AmBC–NOMA systems can be written as
R d , d l = 1 P d ξ R d ,
where ξ i p S I C , p S I C , P d ξ can be obtained from (9) and (10). It is worth pointing out that (23) can be calculated from the EE expression of AmBC–NOMA systems in the delay-limited transmission mode.

4. Energy Efficiency Analysis

EE is an important index by which to evaluate system performance. This section analyzes the EE of AmBC–NOMA systems, which can be [42] expressed as
η E E = Total speed of data Total energy consumption .
In AmBC–NOMA systems, the total energy consumption is equal to the sum of energy consumption among the BS, BD, users, and hardware static power, which can be given by
P t o t a l = κ P S + P B S + P B D + d = 1 D P U E , d ,
where κ = ν 1 , ν demonstrates the effectiveness of the transmitting power amplifier, P S denotes the BS’s power transmission consumption, P B S = κ μ P B S d and P B D represent the total power consumed by the hardware devices of the BS and the BD, respectively, and P U E , d indicates the power consumed by the hardware device at the users. Based on the above evaluation, the EE of AmBC–NOMA systems can be written as
η E E = R d , d l P t o t a l .

5. Numerical Results

In this section, the numerical simulation results verify the accuracy of the above expressions. The simulation results were analyzed, to determine the outage performance of the AmBC–NOMA systems. The number of Monte Carlo repeated was set to 10 6 iterations. The particular simulation settings are set in Table 1 [31,37], where BPCU denotes the abbreviation for bit per channel use. The fading channel parameters were as follows: λ h 1 = 5 , λ h 2 = 8 ; λ h 3 = 10 , λ g 1 = 3 , λ g 2 = 4 ; λ g 3 = 5 ; λ f = 5 . The parameters in EE were set as follows: P S = 5 dBw, P U E , d = 10 dBm; P B S d = 10 dBw; and P B D = 10 dBm [38]. In addition, the AmBC–OMA systems were examined for this paper, as a comparative benchmark.
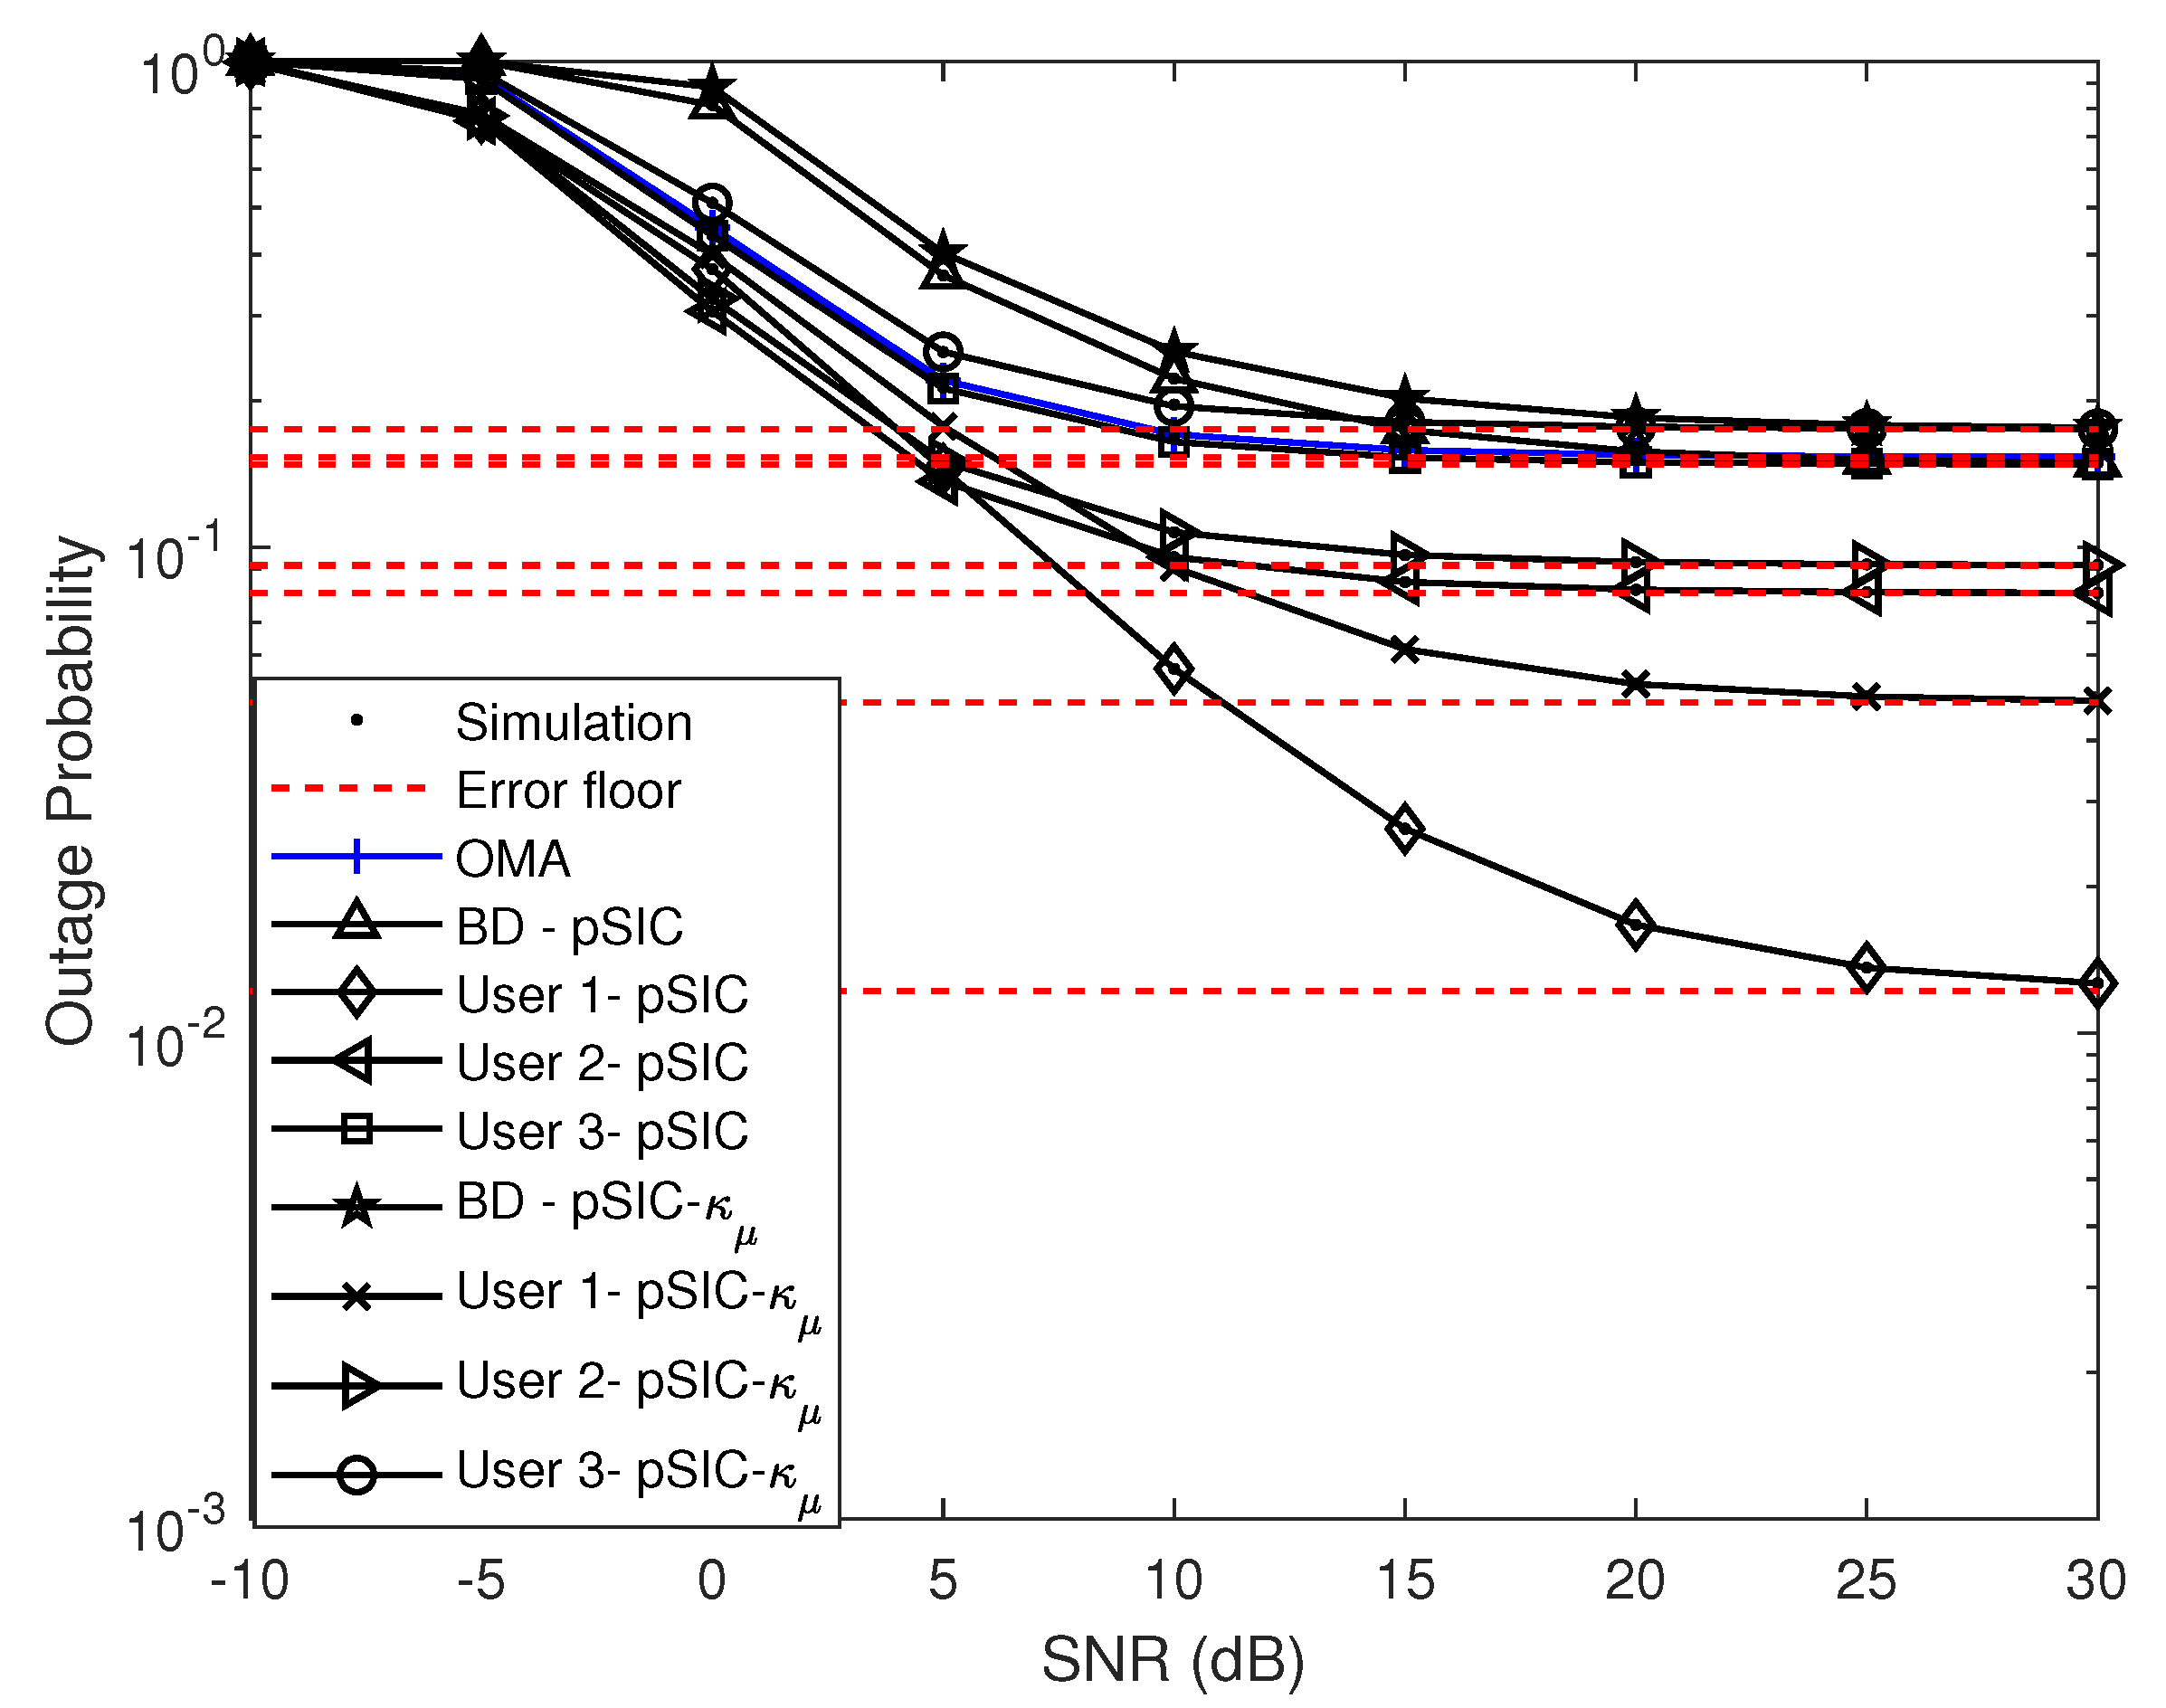
Figure 2 shows the OP versus the transmitting SNR for three users and the BD, with R 1 = 0.4 , R 2 = 0.5 , R 3 = 0.6 , R B D = 0.009 BPCU, and β = 0.17 . The OP curves for users in the case of pSIC in the AmBC–NOMA systems were plotted according to (10). The theoretical analysis of the OP is in good accord with the numerical simulation, thus verifying the correctness of the OP expressions in the AmBC–NOMA systems. The asymptotic OP curves of the user were plotted by (18). It can be seen that the asymptotic curves are close to the exact curves of the OP in the high SNR regime. As the transmitting SNR rises, the OP of the user with pSIC gradually converges to an error floor, due to the user suffering hardware impairments and backscatter links in decoding their signals. This is because, as the SNR increases, the received SNR decreases, and decoding becomes difficult for the user. The results listed above support the analysis in Remark 3. As demonstrated in this figure, the farthest user (d = 1) had lower OP compared to the nearest user (D = 3), which can be explained by the property that NOMA achieves user fairness (i.e., the farthest user is allocated a higher power allocation factor). The OP curve of the BD in the case of pSIC was plotted according to (15). The figure demonstrates the agreement between the analytical results and the numerical simulations. Furthermore, the asymptotic analysis curve for the BD was plotted by (21). The OP curve of the AmBC–OMA systems was based on (12), and the curve in the figure is consistent with the simulation results. It is indicated that the outage behavior of AmBC–NOMA systems is better than that of AmBC–OMA systems. Additionally, the OP for both the users and the BD increased with the hardware damage.
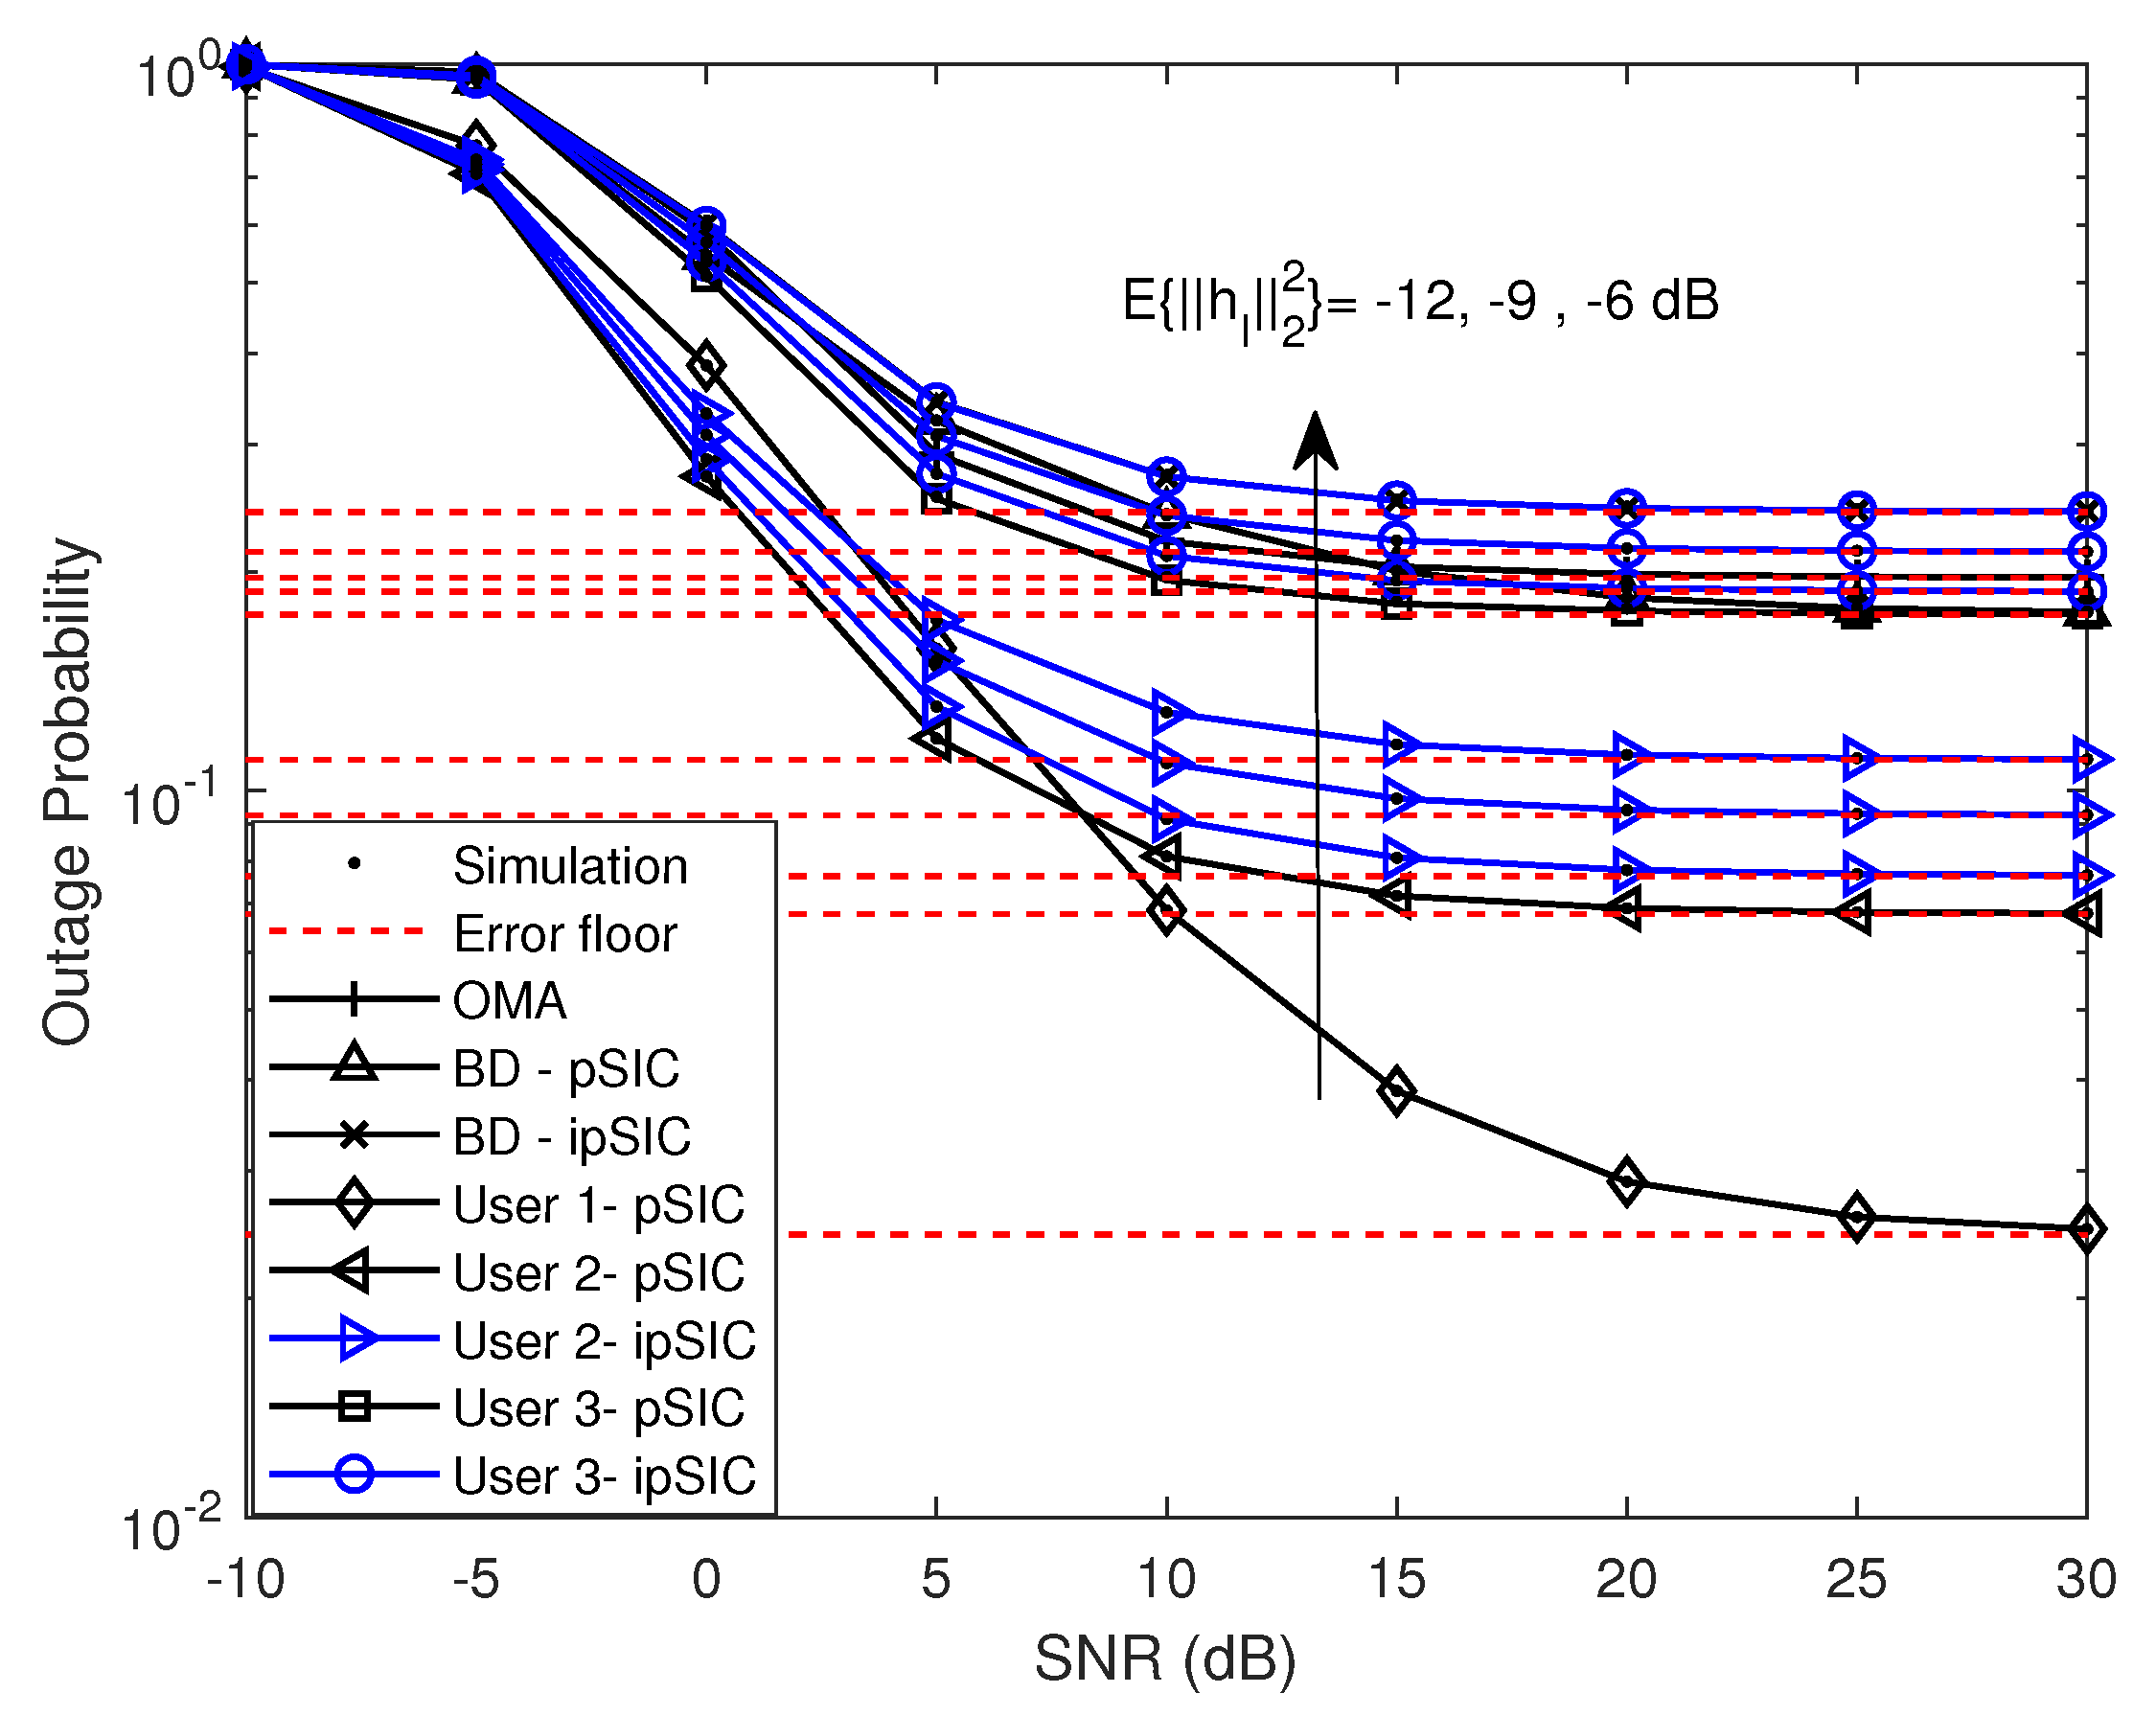
Figure 3 plots the OP for three users and the BD versus the transmitting SNR for different residual interference, with R 1 = 0.4 , R 2 = 0.5 , R 3 = 0.6 , R B D = 0.009 BPCU, β = 0.17 and ϖ = 1 . The OP curves and asymptotic OP curves for users under the pSIC scheme were plotted according to (9) and (17), respectively. By the nature of SIC technology, the user with the stronger signal was decoded first, so that the user (d = 1) did not need to perform SIC operations. We observed that the NOMA systems with ipSIC achieved better outage behavior than the AmBC–OMA systems [38]. This may mean that AmBC–NOMA can achieve better multi-user user fairness than AmBC–OMA. Unlike the already existing work on backscatter [43], we further analyzed the performance of AmBC–NOMA systems. We found that the outage behavior of AmBC–NOMA systems gradually deteriorates as the residual interference value increases: this is because the SNR received by the user decreases as the SNR increases and decoding becomes difficult; therefore, the impact of ipSIC is crucial to the performance of AmBC–NOMA systems.
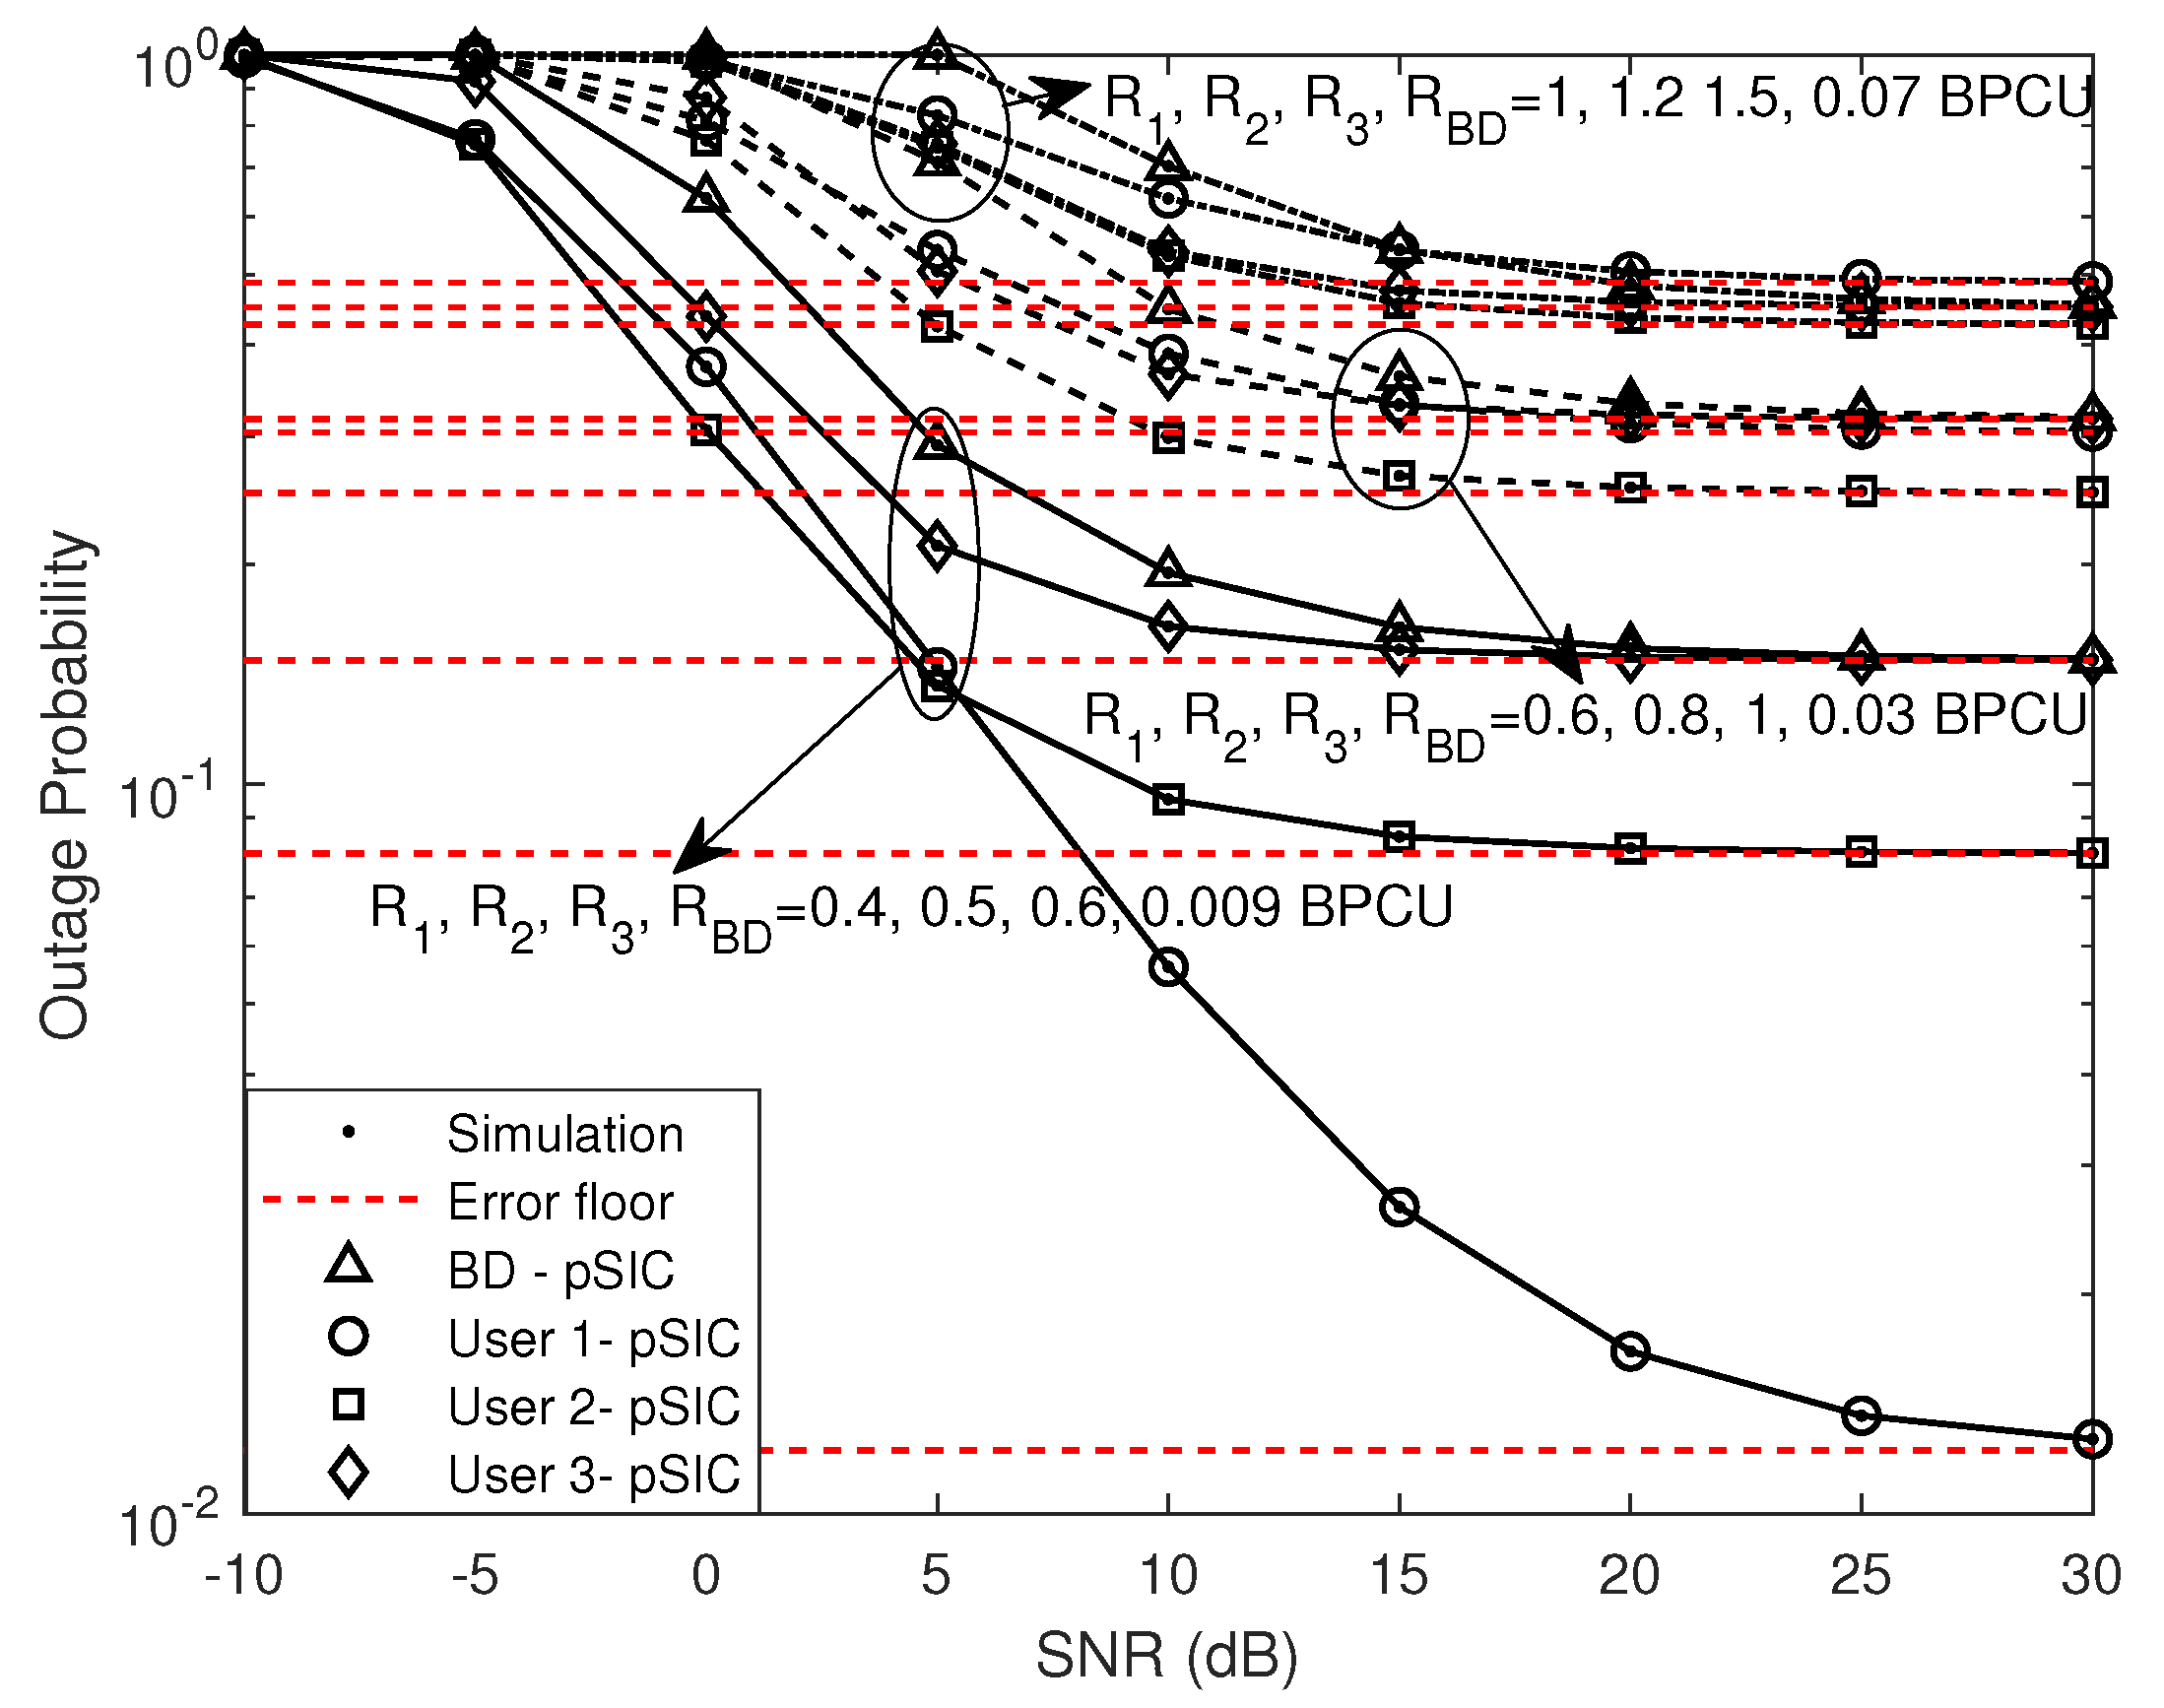
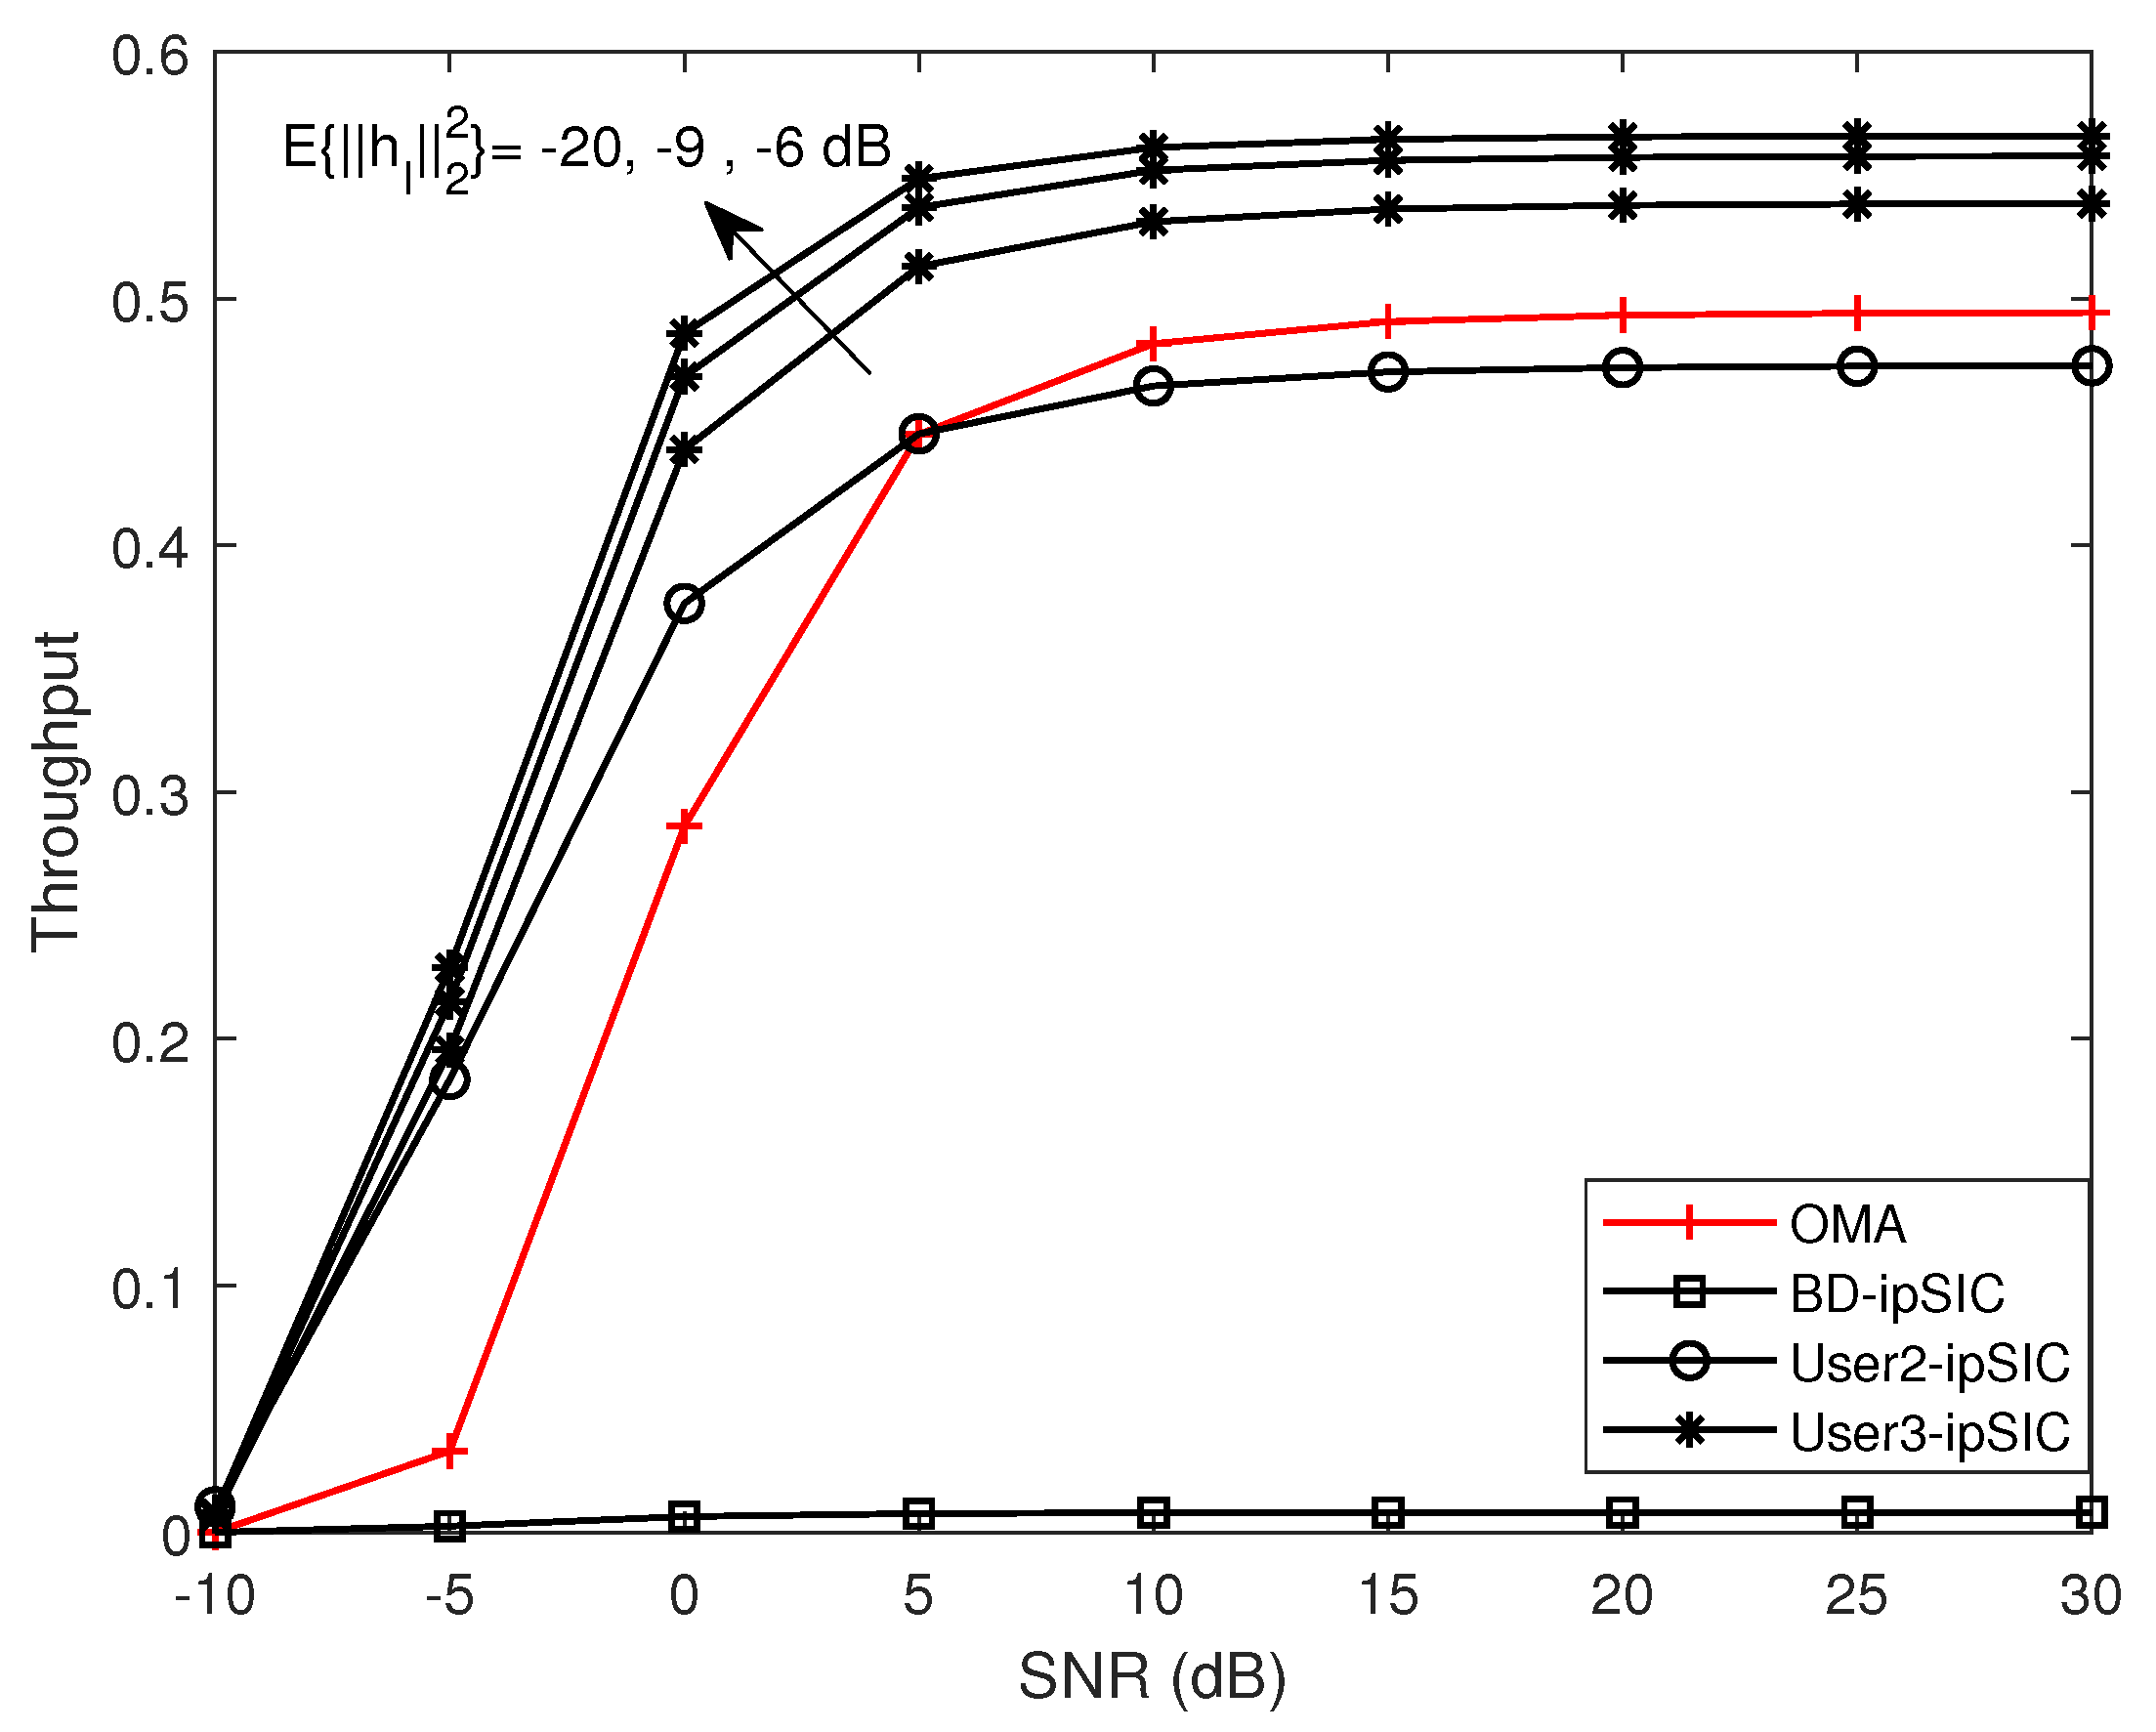
Figure 4 plots the OP for three users and the BD at different threshold rates versus the transmitting SNR. We observed that by increasing the threshold rate, the outage behavior of the AmBC–NOMA systems became worse. This was consistent with the characteristics of the traditional NOMA network. Figure 5 illustrates the throughputs of different users and the BD versus the transmitting SNR in the delay-limited transmission mode. The throughput curves were plotted according to (23). The figure demonstrates that as the transmitting SNR rose, the throughputs of the users and the BD gradually increased and converged to a constant, which was due to the self-interference generated by ipSIC and backscattered link interference that limited the performance of the AmBC–NOMA systems. Compared to traditional AmBC–OMA systems, AmBC–NOMA achieves greater system throughput. For example, the throughput of intermediate users gradually decreased with increasing interference. This was because as the interference rose, the OP was higher, which led to a decrease in throughput. The throughput of users in the AmBC–NOMA systems was substantially better than in the AmBC–OMA systems.
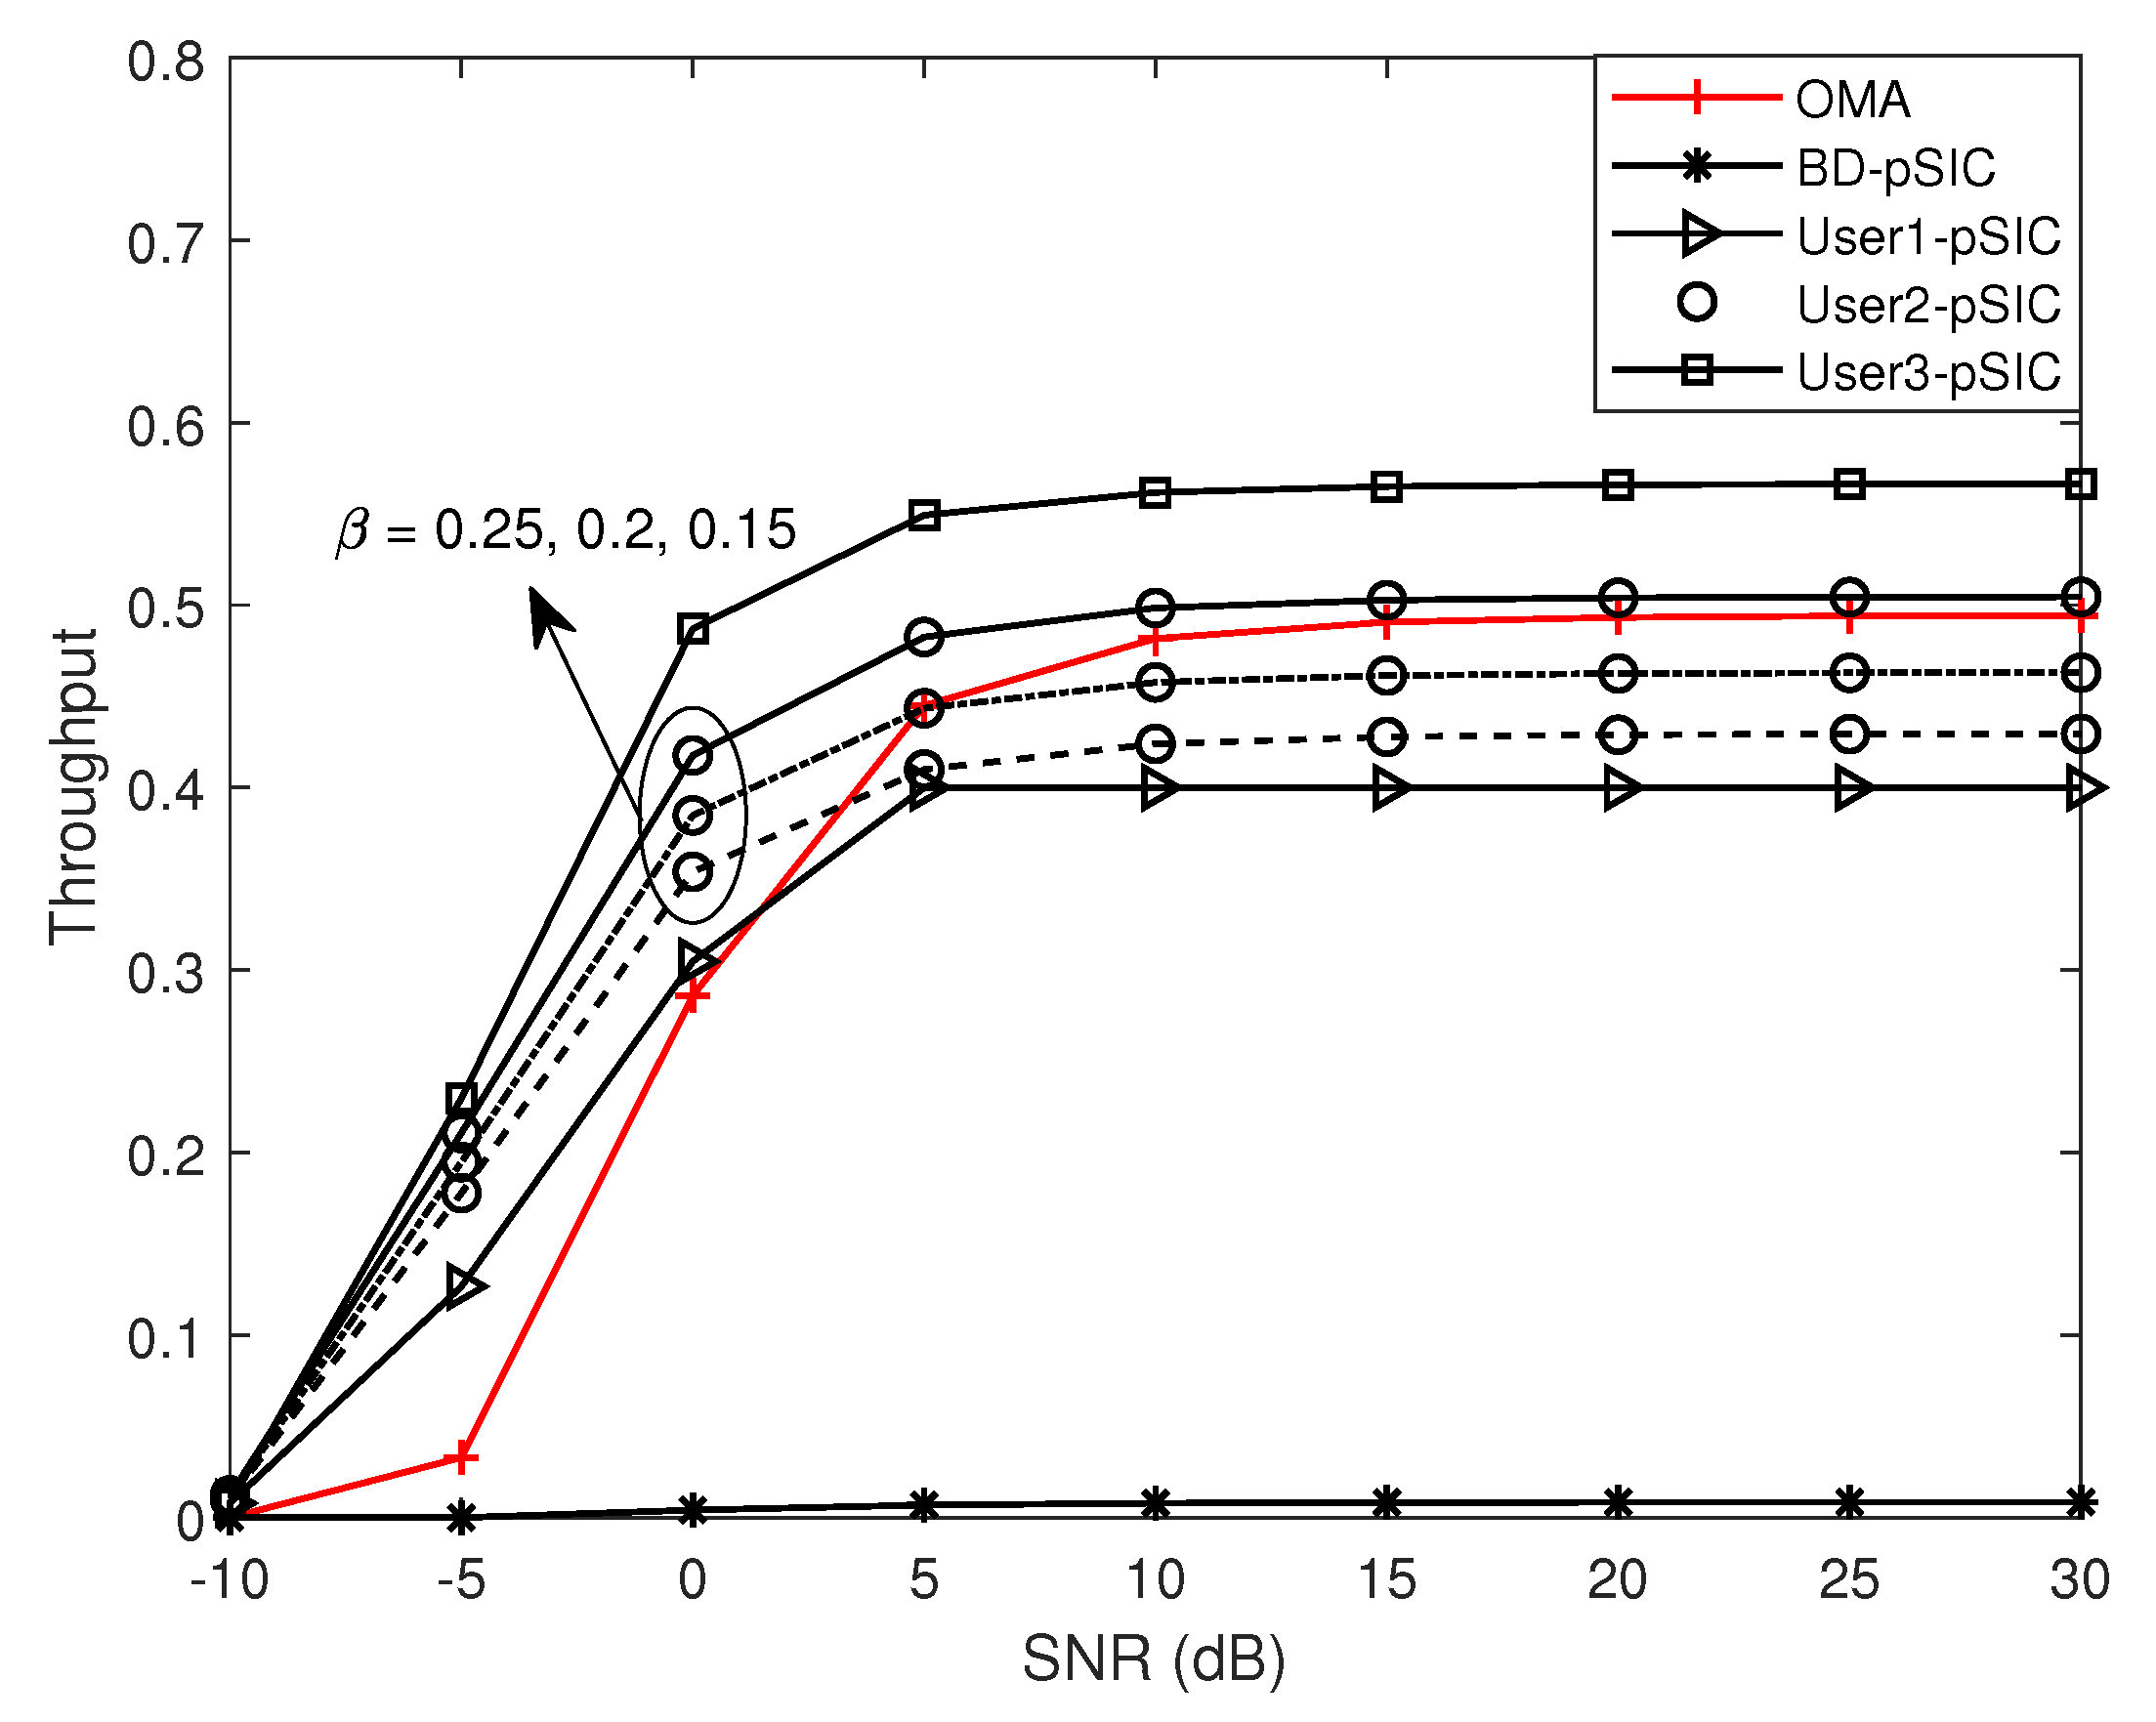
Figure 6 plots the throughputs of different users and the BD for different reflection coefficients β versus the transmitting SNR. It is evident from the figure that the throughput of the user decreased significantly with the increasing reflection coefficient. With β rises, the outage behavior of the user deteriorated. As a result, the reflection coefficient β reduced the throughput of the system.
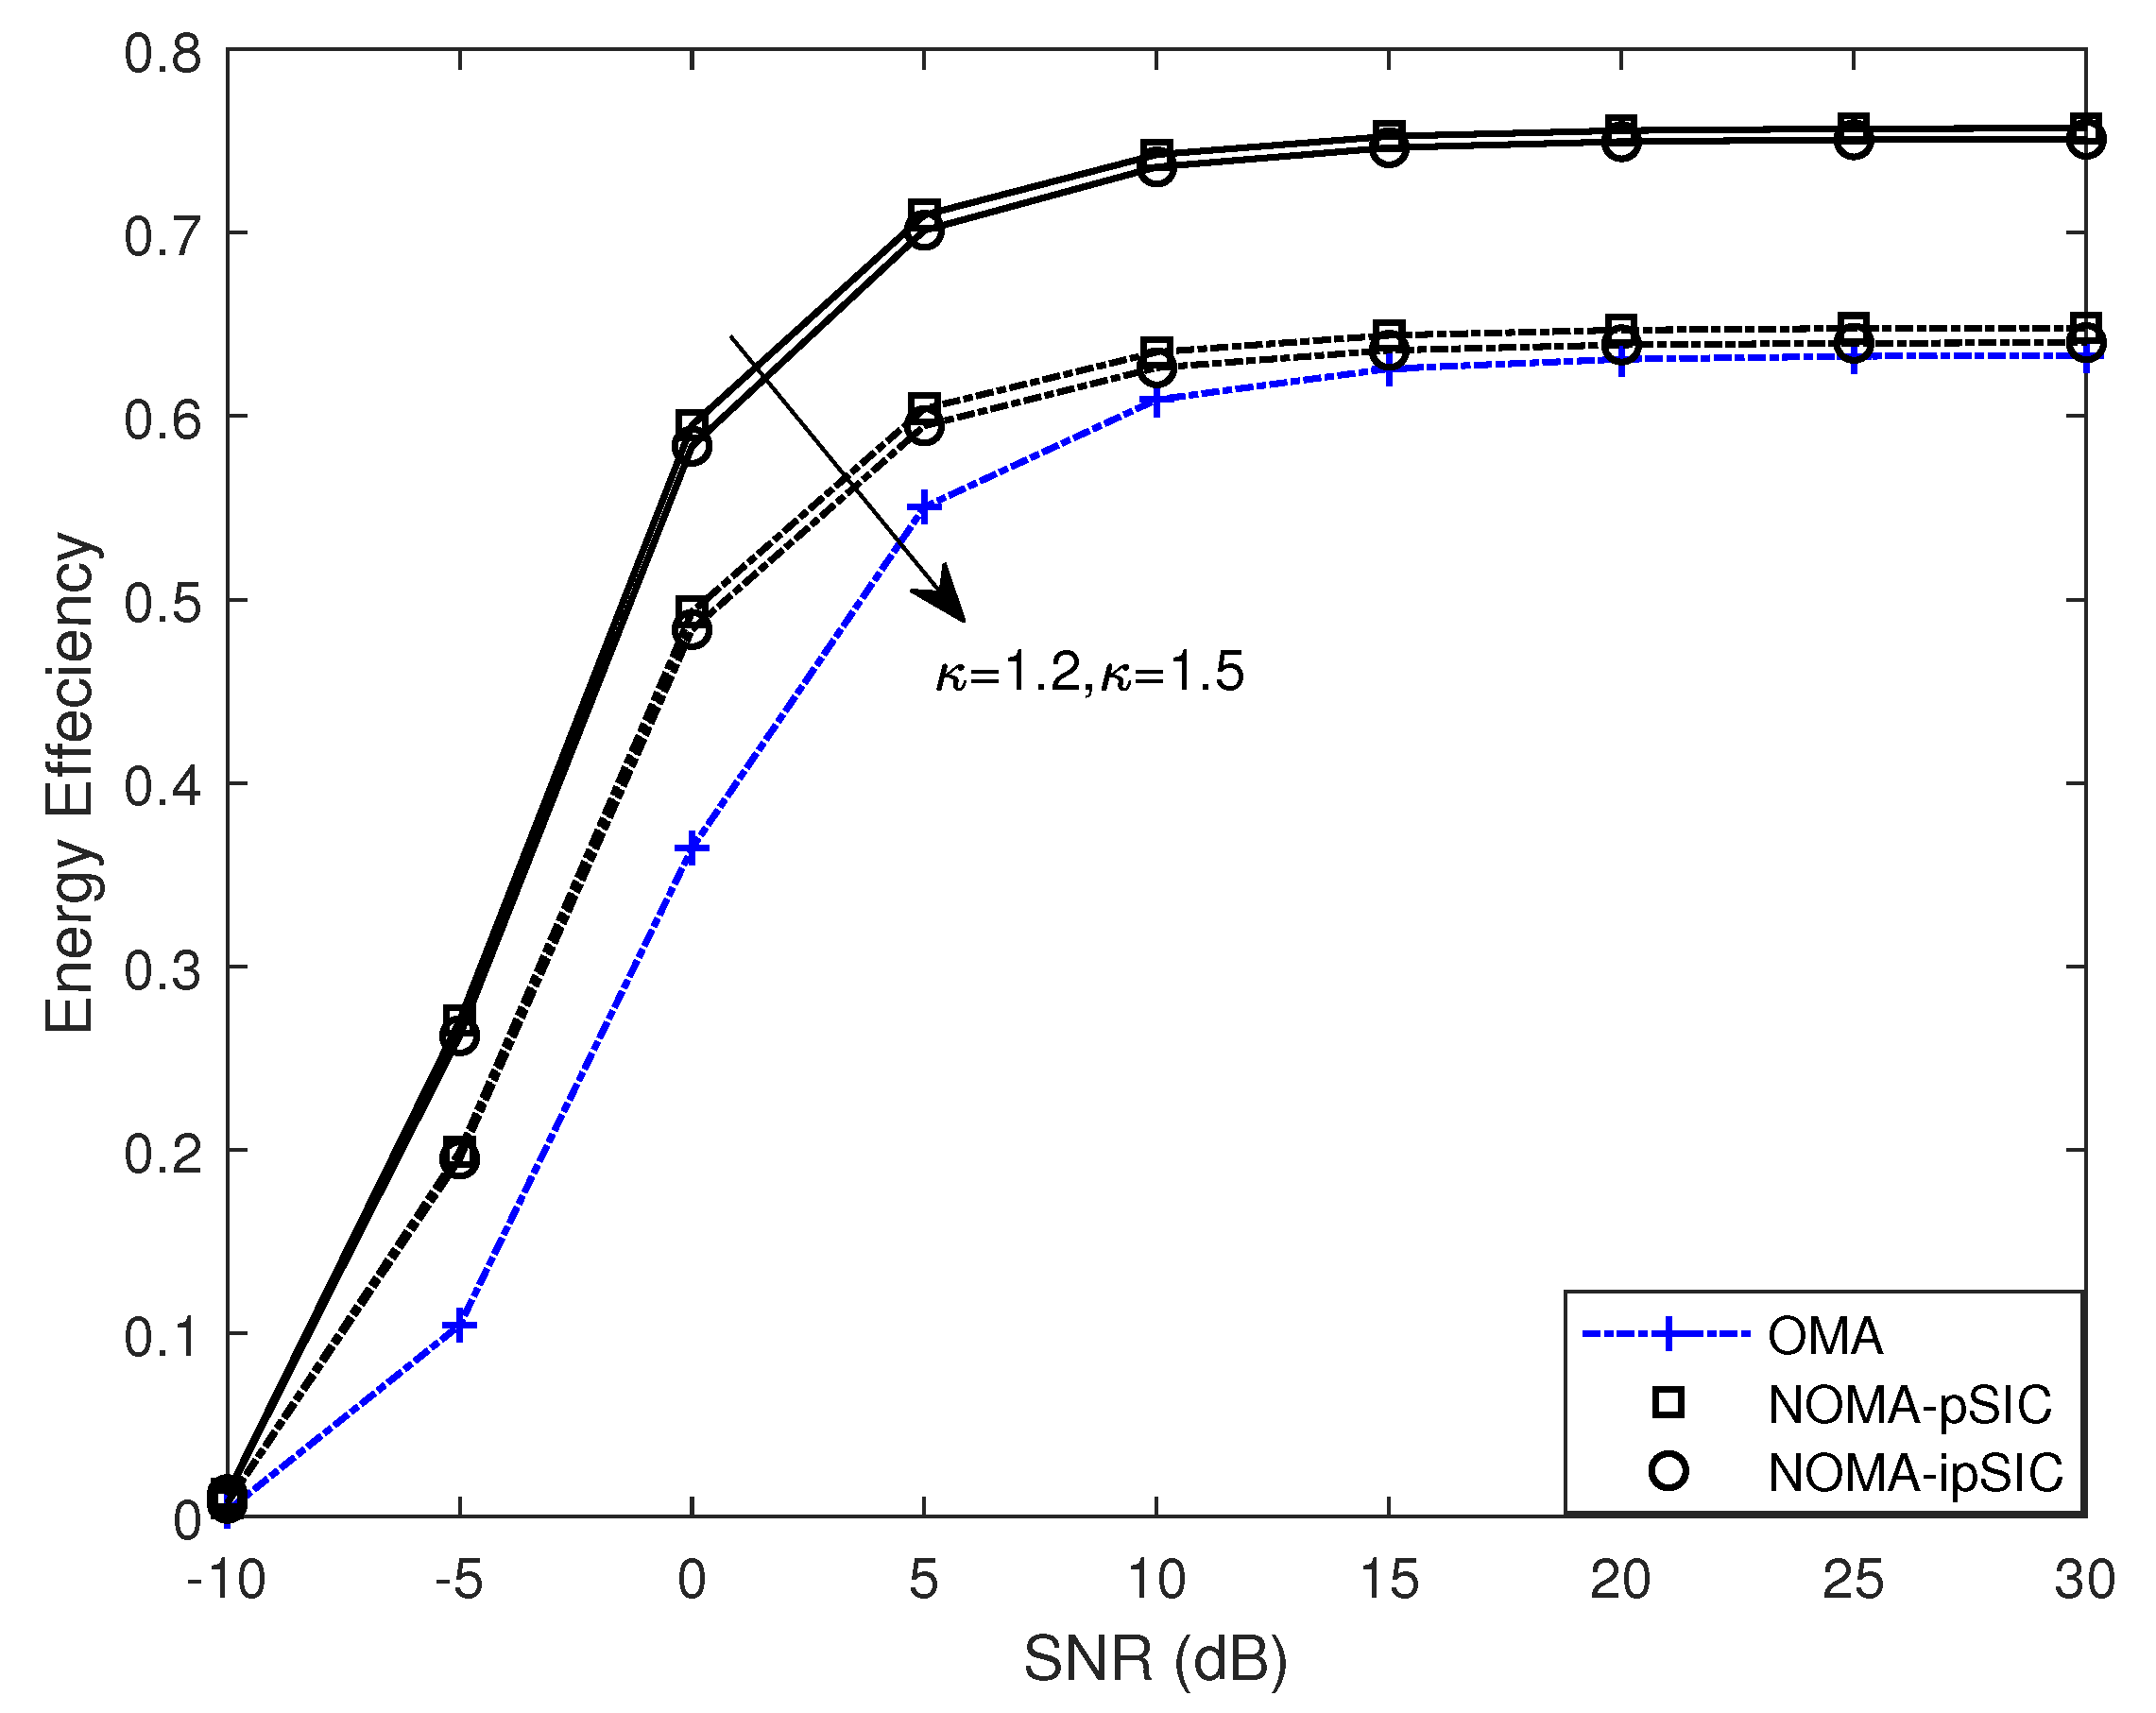
Figure 7 plots the EE of the users and the BD at different κ versus the transmitting SNR with P S = 5 dBw, P U E , d = 10 dBm, P B S d = 10 dBw, and P B D = 10 dBm. The EE curves were plotted according to (26). According to this figure, the curve of the AmBC–NOMA systems’ EE with pSIC was higher than that of the AmBC–OMA systems. In contrast to existing work on backscatter, we considered the adverse effects of ipSIC on the performance of the AmBC–NOMA system. Furthermore, it was indicated that the curve of the AmBC–NOMA systems’ EE in the case of ipSIC was lower than that of the AmBC–OMA systems. This was because the system was subject to greater interference with ipSIC. The AmBC–NOMA systems’ EE steadily declined as κ rose, which was due to a decrease in the EE of the transmitting amplifier, and a rise in energy usage.
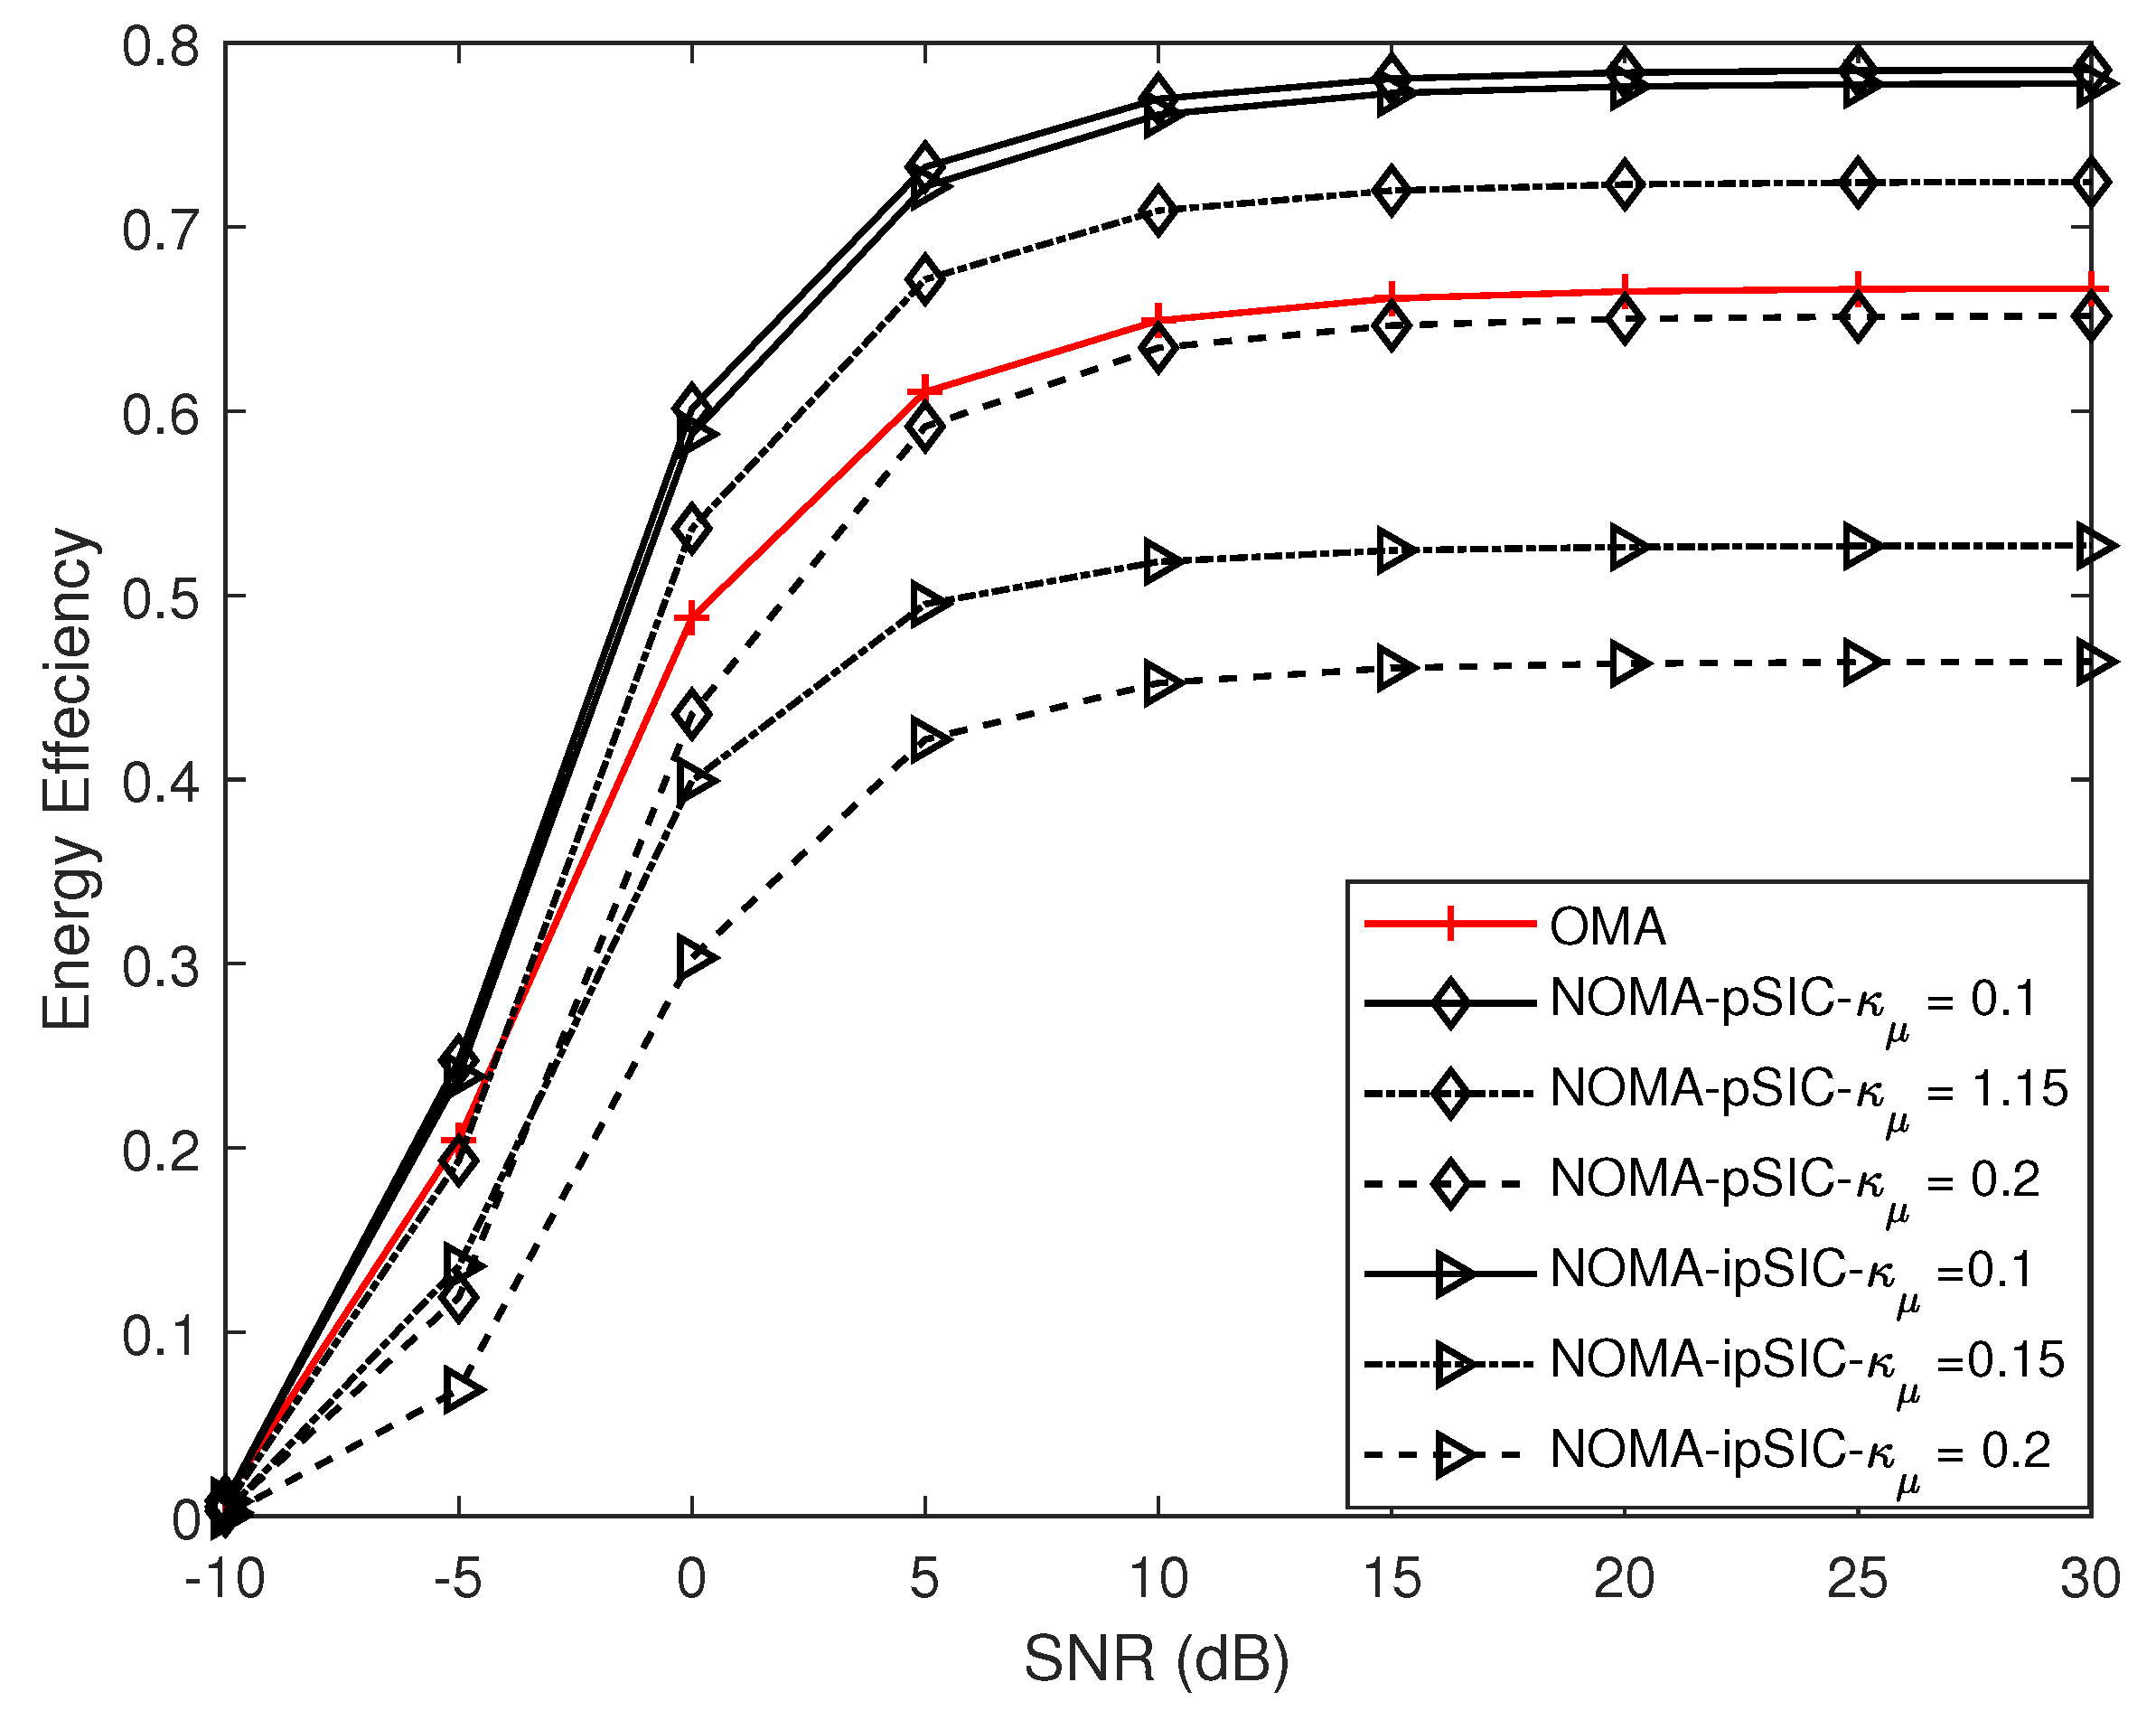
Figure 8 plots the EE of different users and the BD at different hardware damage coefficients versus the transmitting SNR. The results show that the EE curve of the AmBC–NOMA systems decreased with increasing hardware damage factors. This can be explained by a rise in the hardware damage factor, which led to worse outage behavior for both the user and the BD, as well as to a decrease in EE for the AmBC–NOMA systems. In addition, we considered the energy efficiency of the AmBC–NOMA systems with ipSIC. We observed that the energy efficiency of the AmBC–NOMA systems with pSIC was higher than in the case of ipSIC. This was because the SNR received by the user with ipSIC was lower than the SNR received with pSIC, so decoding became difficult. Therefore, the impact of ipSIC on the performance of the system is worth considering.

6. Conclusions

This paper studied the impacts of RHIs and ipSIC on the performance of AmBC–NOMA systems in detail. The OP and asymptotic OP expressions of the users and the BD with ipSIC/pSIC were derived. The diversity orders of the users and the BD were obtained, utilizing asymptotic analysis, which equaled 0 for the users as well as the BD. It can be interpreted that the self-interference generated by ipSIC and backscatter links had become the main reason for limiting the further improvement of system performance in the high SNR interval. More particularly, the reliability of the user decreased as β increased. Simulation results demonstrated that the AmBC–NOMA systems exhibited superior outage behavior than the AmBC–OMA systems. The fairness of the NOMA system was also reflected in the lower OP that could be achieved by the far user. Finally, we discussed the AmBC–NOMA system’s throughput and EE in delay-limited transmission mode. We observe that the AmBC–NOMA systems outperformed the AmBC–OMA system in terms of throughput and energy efficiency.

Author Contributions

Conceptualization, C.Z., X.Y., Y.Y. and X.L.; methodology, C.Z.; software, C.Z. and X.Y.; validation, C.Z.; formal analysis, C.Z.; investigation, C.Z. and Y.Y.; data curation, C.Z. and X.L.; writing—original draft preparation, C.Z., X.Y., Y.Y. and X.L.; writing—review and editing, C.Z. and X.Y.; visualization, C.Z.; supervision, X.L.; project administration, X.Y. All authors have read and agreed to the published version of the manuscript.

Funding

National Natural Science Foundation of China: Grant 62071052; Project of Cultivation for young top-motch Talents of Beijing Municipal Institutions: Grant BPHR202203228; Beijing Natural Science Foundation: Grant L222004.

Institutional Review Board Statement

Not applicable.

Informed Consent Statement

Not applicable.

Data Availability Statement

Not applicable.

Conflicts of Interest

The authors declare no conflict of interest.

Appendix A. Proof of Theorem 1

Based on (8), the OP of the d-th user is written as
P d = 1 Pr h d 2 > ψ d ρ β 2 f 2 g d 2 τ d + ϖ ρ h I 2 + 1 = Pr h d 2 < ψ d ρ β 2 f 2 g d 2 τ d + ϖ ρ h I 2 + 1 ,
where τ d = ( 1 + κ s d 2 ) , ϖ = 1 , ψ d = max ψ 1 , ψ 2 ψ d , ψ d = r t h d ρ ( a d r t h d i = q + 1 D a i + κ s d 2 ) , ψ D = r t h D ρ a D + κ S D 2 , with a d > r t h d ( i = q + 1 D a i + κ s d 2 ) , f h I 2 z = 1 λ h I e z λ h I . The channel cascade PDF is f f 2 g d 2 y , which can be derived by [44]. K 0 x is the zero-order Bessel function modified for the second kind:
f f 2 g d 2 y = 2 λ f λ g d K 0 2 y λ f λ g d .
The effective channel gain ordering among the BS and the users, which obeys the Rayleigh distribution, is h 1 2 h d 2 h D 2 . We analyze the key functions of the CDF F h d 2 x .
We define X = h d 2 , and that X follows an exponential distribution function. The CDF F h d 2 x of channel gain as a function of f h ˜ d 2 x is as follows:
F h d 2 x = ϕ d l = 0 D d D d l 1 l d + l F h ˜ d 2 x d + l ,
where F h ˜ d 2 x denotes the CDF of the unordered channel gain. f h ˜ d 2 x is the PDF of the channel between BS and users, which can be calculated from (A4):
f h ˜ d 2 x = 1 λ h d e x λ h d ,
where f h ˜ d 2 x denotes the PDF of the unordered gain in the channel. Based on the above analysis, the channel gain CDF F h ˜ d 2 x can be written as
F h ˜ d 2 x = 1 e x λ h d .
Upon substituting (A5) into (A3), then the effective channel gain F h d 2 x can be expressed as
F h d 2 x = ϕ d l = 0 D d D d l 1 l d + l 1 e x λ h d d + l .
Combining (A1), (A2), and (A6), the proof for the d-th user’s P d with ipSIC can be further given by
P d = 0 0 ϕ d l = 0 D d D d l 1 l d + l 1 e ψ d ρ β 2 τ d y + w ¯ ρ z + 1 λ h d d + l × 2 λ f λ g d K 0 2 y λ f λ g d 1 λ h I e z λ h I d y d z .
Based on (A7), we can obtain
P d = 0 0 ϕ d l = 0 D d D d l 1 l d + l r = 1 d + l C d + l r 1 r e ψ d r λ h d e ψ d ρ β 2 1 + κ s d 2 r y λ h d × e ψ d * w ¯ ρ z λ h d + 1 2 λ f λ g d K 0 2 y λ f λ g d 1 λ h I e z λ h I d y d z ,
where the integral can be resolved by [44].
0 e α x K 0 ( 2 θ x ) d x = e θ 2 α 2 α E i ( θ 2 α ) .
Thus, (9) can be obtained by substituting (A9) into (A8). The proof is finished.

Appendix B. Proof of Theorem 2

Substituting (3) and (4) into (13), the OP of the BD can be expressed as follows:
P B D i p S I C = 1 Pr r D > r t h D , r B D > r t h B D I b ,
I b is counted as (A11), which was shown at the top of the page.
I b = Pr ψ D ρ β 2 f 2 g d 2 1 + κ S D 2 + ϖ ρ h I 2 + 1 < h D 2 < f 2 g D 2 ψ B D ρ κ S D 2 ϖ ρ h I 2 + 1 ρ κ S D 2 = 0 0 ϕ D l = 0 D d D d l 1 l d + l 1 e 1 ψ B D ρ κ S D 2 y ϖ ρ z + 1 ρ κ S D 2 λ h d d + l 2 λ f λ g d K 0 2 y λ f λ g d 1 λ h I e z λ h I d y d z I b 1 0 0 ϕ D l = 0 D d D d l 1 l d + l 1 e ψ D ρ β 2 y 1 + κ S D 2 + ϖ ρ z + 1 λ h d d + l 2 λ f λ g d K 0 2 y λ f λ g d 1 λ h I e z λ h I d y d z I b 2 + 0 0 φ y ϕ D l = 0 D d D d l 1 l d + l 1 e ψ D ρ β 2 y 1 + κ S D 2 + ϖ ρ z + 1 λ h d d + l 2 λ f λ g d K 0 2 y λ f λ g d 1 λ h I e z λ h I d y d z I b 3 0 0 φ y ϕ D l = 0 D d D d l 1 l d + l 1 e 1 ψ B D ρ κ S D 2 y ϖ ρ z + 1 ρ κ S D 2 λ h d d + l 2 λ f λ g d K 0 2 y λ f λ g d 1 λ h I e z λ h I d y d z I b 4 .
By using some mathematical manipulations, I b 1 can be further given by
I b 1 = 0 0 ϕ d l = 0 D d D d l 1 l d + l r = 1 d + l C d + l r 1 r × e Ψ d r λ h d e Ψ d ρ β 2 1 + κ S D 2 r y λ h d e ψ d ϖ ρ z λ h d + 1 × 2 λ f λ g d K 0 2 y λ f λ g d 1 λ h I e z λ h I d y d z .
On the basis of (A12), I b 1 is given by
I b 1 = ϕ D l = 0 D d D d l ( 1 ) l d + l [ r = 1 d + l C d + l r ( 1 ) r + 1 e ψ d r λ h d × Q b 1 e Q b 1 E i ( Q b 1 ) 0 e ψ d ϖ ρ z λ h d 1 λ h I e z λ h I d z + 1 ] = ϕ D l = 0 D d D d l ( 1 ) l d + l [ r = 1 d + l C d + l r ( 1 ) r + 1 × e ψ d r λ h d Q b 1 e Q b 1 E i ( Q b 1 ) 1 λ h I ς b 1 + 1 ] .
Based on the above calculation, I b 2 can be respectively written as
I b 2 = ϕ D l = 0 D d D d l 1 l d + l r = 1 d + l C d + l r 1 r + 1 × e 1 λ h d ρ κ S D 2 Q b 2 e Q b 2 E i Q b 2 1 λ h I ς b 2 + 1 .
I b 3 = ϕ D l = 0 D d D d l 1 l d + l r = 1 d + l C d + l r 1 r 2 λ f λ g d 0 0 φ y e ψ d r λ h d e ψ d ρ β 2 1 + κ S D 2 r y λ h d × e ψ d ϖ ρ z λ h d K 0 2 y λ f λ g d d y d z ,
where I b 3 can be calculated using the Gauss–Chebyshev integral function. Therefore, (A15) is shown as
I b 3 = ϕ D l = 0 D d D d l 1 l d + l r = 1 d + l C d + l r 1 r π φ y N λ f λ g d n = 1 N e ψ d ρ β 2 1 + κ S D 2 r x n + 1 φ y 2 λ h d K 0 2 x n + 1 φ y λ f λ g D × e ψ d r λ h d 1 x n 2 0 e ψ d w ¯ ρ z λ h d 1 λ h I e z λ h I d z .
According to the operation method of (A16), I b 4 is given by
I b 4 = ϕ D l = 0 D d D d l 1 l d + l r = 1 d + l C d + l r 1 r π φ y N λ f λ g d λ h I ς b 2 n = 1 N e 1 λ h d ρ κ S D 2 e r x n + 1 φ y 2 λ h d ψ B D ρ κ S D 2 × K 0 2 x n + 1 φ y λ f λ g D 1 x n 2 .
The proof is finished.

References

  1. Hwang, J.; Nkenyereye, L.; Sung, N.; Kim, J.; Song, J. IoT Service Slicing and Task Offloading for Edge Computing. IEEE Internet Things J. 2021, 8, 11526–11547. [Google Scholar] [CrossRef]
  2. Frustaci, M.; Pace, P.; Aloi, G.; Fortino, G. Evaluating Critical Security Issues of the IoT World: Present and Future Challenges. IEEE Internet Things J. 2018, 5, 2483–2495. [Google Scholar] [CrossRef]
  3. Giordani, M.; Polese, M.; Mezzavilla, M.; Rangan, S.; Zorzi, M. Toward 6G networks: Use cases and technologies. IEEE Commun. 2020, 58, 55–61. [Google Scholar] [CrossRef]
  4. Khan, W.U.; Liu, J.; Jameel, F.; Sharma, V.; Jantti, R.; Han, Z. Spectral Efficiency Optimization for Next Generation NOMA-Enabled IoT Networks. IEEE Trans. Veh. Technol. 2020, 69, 15284–15297. [Google Scholar] [CrossRef]
  5. Shahini, A.; Ansari, N. NOMA Aided Narrowband IoT for Machine Type Communications with User Clustering. IEEE Internet Things J. 2019, 6, 7183–7191. [Google Scholar] [CrossRef]
  6. Yang, G.; Xu, X.; Liang, Y.-C. Resource Allocation in NOMA-Enhanced Backscatter Communication Networks for Wireless Powered IoT. IEEE Wirel. Commun. Lett. 2020, 9, 117–120. [Google Scholar] [CrossRef]
  7. Janghel, K.; Prakriya, S. Performance of Adaptive OMA/Cooperative-NOMA Scheme with User Selection. IEEE Commun. Lett. 2018, 22, 2092–2095. [Google Scholar] [CrossRef]
  8. Ding, Z.; Zhao, Z.; Peng, M.; Poor, H.V. On the spectral efficiency and security enhancements of NOMA assisted multicast-unicast streaming. IEEE Trans. Commun. 2017, 65, 3151–3163. [Google Scholar] [CrossRef]
  9. Yue, X.; Liu, Y.; Kang, S.; Nallanathan, A.; Ding, Z. Exploiting Full/Half-Duplex User Relaying in NOMA Systems. IEEE Trans. Commun. 2018, 66, 560–575. [Google Scholar] [CrossRef]
  10. Ding, Z.; Liu, Y.; Choi, J.; Sun, Q.; Elkashlan, M.; Chih-Lin, I.; Poor, H.V. Application of non-orthogonal multiple access in LTE and 5G networks. IEEE Commun. 2017, 55, 185–191. [Google Scholar] [CrossRef]
  11. Sun, Y.; Ding, Z.; Dai, X. On the Outage Performance of Network NOMA (N-NOMA) Modeled by Poisson Line Cox Point Process. IEEE Trans. Veh. Technol. 2021, 70, 7936–7950. [Google Scholar] [CrossRef]
  12. Arfaoui, M.A.; Ghrayeb, A.; Assi, C.; Qaraqe, M. CoMP-Assisted NOMA and Cooperative NOMA in Indoor VLC Cellular Systems. IEEE Commun. 2022, 70, 6020–6034. [Google Scholar] [CrossRef]
  13. Diamantoulakis, P.D.; Karagiannidis, G.K. Performance Analysis of Distributed Uplink NOMA. IEEE Commun. Lett. 2021, 25, 788–792. [Google Scholar] [CrossRef]
  14. Tang, Z.; Wang, J.; Wang, J.; Song, J. On the Achievable Rate Region of NOMA Under Outage Probability Constraints. IEEE Commun. Lett. 2019, 23, 370–373. [Google Scholar] [CrossRef]
  15. Lei, R.; Xu, D.; Ahmad, I. Secrecy Outage Performance Analysis of Cooperative NOMA Networks with SWIPT. IEEE Wirel. Commun. Lett. 2021, 10, 1474–1478. [Google Scholar] [CrossRef]
  16. Lu, X.; Niyato, D.; Jiang, H.; Kim, D.I.; Xiao, Y.; Han, Z. Ambient Backscatter Assisted Wireless Powered Communications. IEEE Wirel. Commun. 2018, 25, 170–177. [Google Scholar] [CrossRef]
  17. Kuai, X.; Yuan, X.; Liang, Y.-C. Message-Passing Receiver Design for Multiuser Multi-Backscatter-Device Symbiotic Radio Communications. IEEE Trans. Wirel. Commun. 2022, 21, 4563–4578. [Google Scholar] [CrossRef]
  18. Amato, F.; Torun, H.M.; Durgin, G.D. RFID Backscattering in Long-Range Scenarios. IEEE Trans. Veh. Commun. 2018, 17, 2718–2725. [Google Scholar] [CrossRef]
  19. Boyer, G.C.; Roy, S. Invited paper-Backscatter communication and RFID: Coding energy and MIMO analysis. IEEE Trans. Commun. 2014, 62, 770–785. [Google Scholar] [CrossRef]
  20. Lyu, B.; Yang, Z.; Guo, H.; Tian, F.; Gui, G. Relay Cooperation Enhanced Backscatter Communication for Internet-of-Things. IEEE Internet Things J. 2019, 6, 2860–2871. [Google Scholar] [CrossRef]
  21. Lu, X.; Niyato, D.; Jiang, H.; Hossain, E.; Wang, P. Ambient Backscatter-Assisted Wireless-Powered Relaying. IEEE Trans. Commun. 2019, 3, 1087–1105. [Google Scholar] [CrossRef]
  22. Zhao, W.; Wang, G.; Atapattu, S.; He, R.; Liang, Y.-C. Channel Estimation for Ambient Backscatter Communication Systems with Massive-Antenna Reader. IEEE Trans. Veh. Technol. 2019, 68, 8254–8258. [Google Scholar] [CrossRef]
  23. Liu, V.; Parks, A.; Talla, V.; Gollakota, S.; Wetherall, D.; Smith, J.R. Ambient backscatter: Wireless communication out of thin air. ACM SIGCOMM Comput. Commun. Rev. 2013, 43, 39–50. [Google Scholar] [CrossRef]
  24. Hoang, C.T.; Niyato, D.; Wang, P.; Kim, D.I.; Han, Z. Ambient Backscatter: A New Approach to Improve Network Performance for RF-Powered Cognitive Radio Networks. IEEE Trans. Commun. 2017, 65, 3659–3674. [Google Scholar] [CrossRef]
  25. Lu, X.; Jiang, H.; Niyato, D.; Kim, D.I.; Han, Z. Wireless-Powered Device-to-Device Communications with Ambient Backscattering: Performance Modeling and Analysis. IEEE Trans. Wirel. Commun. 2018, 17, 1528–1544. [Google Scholar] [CrossRef]
  26. Yang, G.; Zhang, Q.; Liang, Y.-C. Cooperative Ambient Backscatter Communications for Green Internet-of-Things. IEEE Internet Things J. 2018, 5, 1116–1130. [Google Scholar] [CrossRef]
  27. Yang, G.; Yuan, D.; Liang, Y.-C.; Zhang, R.; Leung, V.C.M. Optimal Resource Allocation in Full-Duplex Ambient Backscatter Communication Networks for Wireless-Powered IoT. IEEE Internet Things J. 2019, 6, 2612–2625. [Google Scholar] [CrossRef]
  28. ElMossallamy, M.A.; Pan, M.; Jantti, R.; Seddik, K.G.; Li, G.Y.; Han, Z. Noncoherent Backscatter Communications Over Ambient OFDM Signals. IEEE Trans. Commun. 2019, 67, 3597–3611. [Google Scholar] [CrossRef]
  29. Zhang, Q.; Zhang, L.; Liang, Y.-C.; Kam, P.-Y. Backscatter-NOMA: A Symbiotic System of Cellular and Internet-of-Things Networks. IEEE Access 2019, 7, 20000–20013. [Google Scholar] [CrossRef]
  30. Li, X.; Liu, H.; Li, G.; Liu, Y.; Zeng, M.; Ding, Z. Effective Capacity Analysis of AmBC-NOMA Communication Systems. IEEE Trans. Veh. Technol. 2022, 71, 11257–11261. [Google Scholar] [CrossRef]
  31. Khan, W.U.; Li, X.; Zeng, M.; Dobre, O.A. Backscatter-Enabled NOMA for Future 6G Systems: A New Optimization Framework Under Imperfect SIC. IEEE Trans. Commun. 2021, 25, 1669–1672. [Google Scholar] [CrossRef]
  32. Le, C.B.; Do, D.T.; Silva, A.; Khan, W.U.; Khalid, W.; Yu, H.; Nguyen, N.D. Joint Design of Improved Spectrum and Energy Efficiency with Backscatter NOMA for IoT. IEEE Access 2022, 7504–7519. [Google Scholar] [CrossRef]
  33. Ding, Z.; Poor, H.V. Advantages of NOMA for Multi-User BackCom Networks. IEEE Commun. Lett. 2021, 25, 3408–3412. [Google Scholar] [CrossRef]
  34. Li, L.; Huang, X.; Fang, Y. Hierarchical Multiple Access for Spectrum-Energy Opportunistic Ambient Backscatter Wireless Networks. IEEE Trans. Mobile Comput. 2021. early access. [Google Scholar] [CrossRef]
  35. Ding, Z.; Poor, H.V. On the Application of BAC-NOMA to 6G umMTC. IEEE Wirel. Commun. Lett. 2021, 25, 2678–2682. [Google Scholar] [CrossRef]
  36. Li, X.; Zhao, M.; Liu, Y.; Li, L.; Ding, Z.; Nallanathan, A. Secrecy Analysis of Ambient Backscatter NOMA Systems Under I/Q Imbalance. IEEE Trans. Veh. Technol. 2020, 69, 12286–12290. [Google Scholar] [CrossRef]
  37. Li, X.; Zhao, M.; Zeng, M.; Mumtaz, S.; Menon, V.G.; Ding, Z.; Dobre, O.A. Hardware Impaired Ambient Backscatter NOMA Systems: Reliability and Security. IEEE Trans. Commun. 2021, 69, 2723–2736. [Google Scholar] [CrossRef]
  38. Yue, X.; Liu, Y. Performance Analysis of Intelligent Reflecting Surface Assisted NOMA Networks. IEEE Trans. Wirel. Commun. 2022, 21, 2623–2636. [Google Scholar] [CrossRef]
  39. Abramowitz, M.; Stegun, I.A. Handbook of Mathematical Functions with Formulas, Graphs, and Mathematical Tables; Academic Press: New York, NY, USA, 1972. [Google Scholar]
  40. Nasir, A.A.; Zhou, X.; Durrani, S.; Kennedy, R.A. Relaying Protocols for Wireless Energy Harvesting and Information Processing. IEEE Trans. Wirel. Commun. 2013, 12, 3622–3636. [Google Scholar] [CrossRef]
  41. Yue, X.; Liu, Y.; Kang, S.; Nallanathan, A.; Ding, Z. Spatially Random Relay Selection for Full/Half-Duplex Cooperative NOMA Networks. IEEE Trans. Commun. 2018, 66, 3294–3308. [Google Scholar] [CrossRef]
  42. Huang, G.C.A.M.D.C.; Zappone, A.; Yuen, C. Reconfigurable intelligent surfaces for energy efficiency in wireless communication. IEEE Trans. Wirel. Commun. 2018, 18, 4157–4170. [Google Scholar] [CrossRef]
  43. Elsayed, M.; Samir, A.; El-Banna, A.A.A.; Li, X.; ElHalawany, B.M. When NOMA Multiplexing Meets Symbiotic Ambient Backscatter Communication: Outage Analysis. IEEE Trans. Veh. Technol. 2022, 71, 1026–1031. [Google Scholar] [CrossRef]
  44. Gradshteyn, I.S.; Ryzhik, I.M. Table of Integrals, Series, and Products; Academic Press: New York, NY, USA, 2007. [Google Scholar]
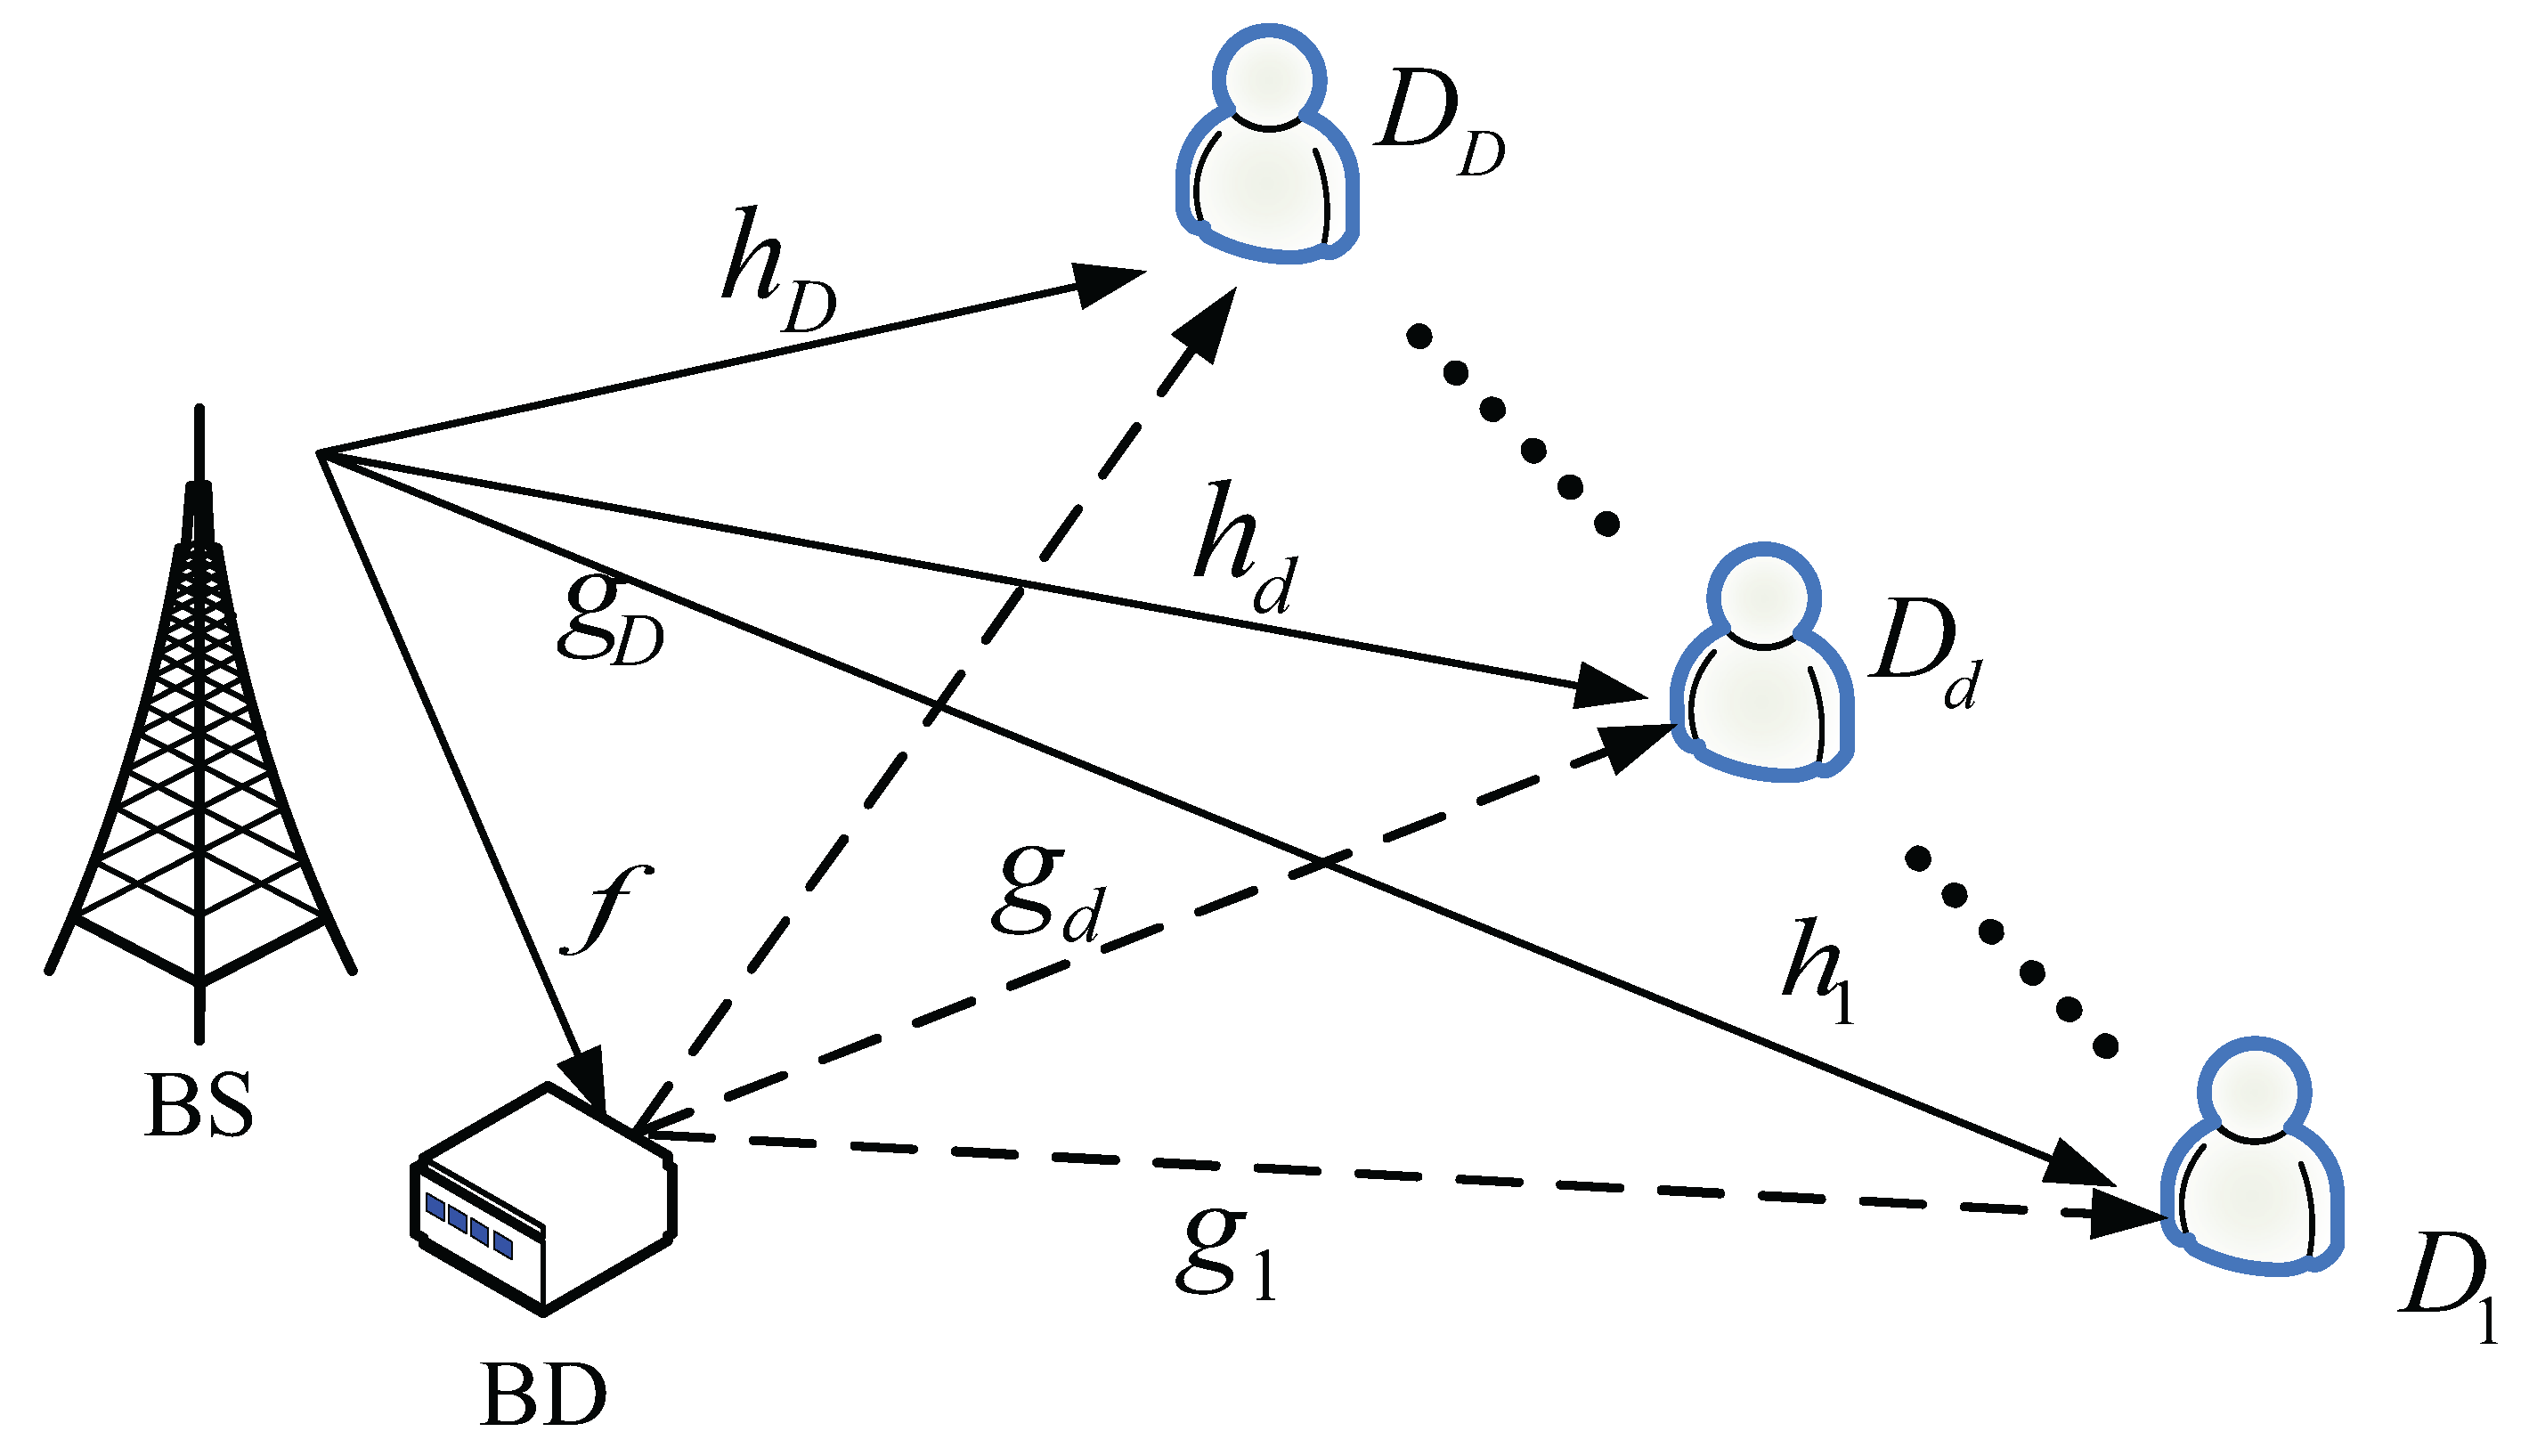
Figure 1. The system model of AmBC-assisted downlink NOMA.
Applsci 13 06166 g001
Figure 2. OP versus the transmitting SNR, with R 1 = 0.4 , R 2 = 0.5 , R 3 = 0.6 , R B D = 0.009 BPCU, and β = 0.17 .
Applsci 13 06166 g002
Figure 3. OP at different residual interference versus the transmitting SNR, with ϖ = 1 , β = 0.17 .
Applsci 13 06166 g003
Figure 4. OP at different threshold rate versus the transmitting SNR, with E h I 2 = 10 dB , β = 0.17 .
Applsci 13 06166 g004
Figure 5. Throughput versus, at different residual interference, the transmitting SNR, with R 1 = 0.4 , R 2 = 0.5 , R 3 = 0.6 , and R B D = 0.009 BPCU, β = 0.17 .
Applsci 13 06166 g005
Figure 6. Throughput at different reflection coefficient β versus the transmitting SNR, with R 1 = 0.4 , R 2 = 0.5 , R 3 = 0.6 , and R B D = 0.009 BPCU.
Applsci 13 06166 g006
Figure 7. EE at different κ versus the transmitting SNR, with P S = 5 dBw and P U E , d = 10 dBm.
Applsci 13 06166 g007
Figure 8. EE at different hardware damage coefficients versus the transmitting SNR with P S = 5 dBw and P U E , d = 10 dBm.
Applsci 13 06166 g008
Table 1. The Simulation Parameters.
Monte Carlo simulation of repeated values 10 6 iterations
Power distribution factor a 1 = 0.7
a 2 = 0.2
a 3 = 0.1
reflection coefficient β = 0.17
RHIs parameter κ s d 2 = κ μ 2 = 0.03
Gaussian white noise power N 0 = 5 dB
ipSIC parameter w ¯ = 1
Threshold data rates R 1 = 0.4 BPCU
R 2 = 0.5 BPCU
R 3 = 0.6 BPCU
R B D = 0.009 BPCU
Disclaimer/Publisher’s Note: The statements, opinions and data contained in all publications are solely those of the individual author(s) and contributor(s) and not of MDPI and/or the editor(s). MDPI and/or the editor(s) disclaim responsibility for any injury to people or property resulting from any ideas, methods, instructions or products referred to in the content.