1. Introduction
The volume of data on the performance of tennis players on the court, with the advancement of technology, increases over the years. There are multiple ways to collect information related to tennis performance. Modern technology provides the ability to collect and analyze a large volume of data in a short time. This type of data collection represents an objective way of recording indicators of sports performance and competitive performance in situational conditions [
1]. The information obtained is of great importance for the analysis of statistical parameters and sports performance [
2], as well as for improvement in technical and tactical performance [
3,
4].
High-quality and precise data collection requires efficient applications for the automatic notation of performances. Newer sensors, due to their smaller size, allow data to be collected without interfering with the performance of the activity itself [
5]. Increased use of different sensors induced the development of smartphones and portable devices to analyze sports performance. Modern smartphones are equipped with various sensor devices such as accelerometers, gyroscopes, and magnetometers [
6] and can therefore be applied in research in the field of sports activities [
7]. Sensors collecting movement data can be used in applications that are intended for the analysis of everyday activities and the automatic video notation of the performance of various sports [
8]. The authors of [
9] explored the possibility of using wearable sensors with gyroscopes to evaluate and improve serve performance in tennis. Furthermore, in a previous study [
10], it was surmised that sensors with gyroscopes could be used to assess and acquire the skills of performing the first serve in tennis. Earlier research [
11] showed that tennis players benefit from the classification of strokes and the recognition of the type of rotation based on sensors. This represents objective feedback to coaches and players, which allows for the evaluation of the training process.
Tennis-specific portable sensors provide data on the external and internal load of tennis players [
12]. Additionally, they can be divided into (A) those that are part of the racket, which connect to the grip of the racket, and (B) those that are worn around individual parts of the body, most often around the wrist [
4,
13]. The greatest difference between this group of sensors is that the sensors in the (A) category are attached to the grip of the racket and have no contact with the tennis player’s hand, while the sensors in the (B) category are fixed to the wrist or worn as a watch or bracelet. Sensors provide information on kinematic parameters, tennis-specific parameters (stroke type, speed, power, and tempo) [
10,
14,
15,
16], the point of contact of the ball and the racket, the force transferred to the hand after contact [
15,
17,
18], the duration of the active and passive time of the game, and the functional variables (heart rate variability and energy expenditure) of players. Due to the position and movement of the sensor itself, they are subject to measurement errors and can affect sports performance [
9]. As wearable sensors can have a negative impact on players’ technique, there is a need to develop systems that can track specific tasks without any influence on game parameters.
In addition to sensors that enable motion detection and define the kinematic parameters of the body, racket, and ball, applications for the analysis of certain situational parameters have emerged. These applications use artificial intelligence (AI) and algorithms to identify the type and speed of impacts. Regarding the automated assessments of these parameters, it is necessary to determine whether the applications or algorithms used in the analysis accurately measure the observed variables.
One such software package is the SwingVision (SV) mobile application. SV uses video analysis to automatically process and recognize specific movements in situational conditions. SV enables impact monitoring and video analysis of technical and tactical performance in real time. Given that the number of repetitions of a particular element is extremely important in the training process, by applying video analysis, it is possible to correct the technical performance and create a detailed training plan and program. Additionally, the transfer of information from the training process to the competitive match represents an important segment of the development of every athlete. Using the application simplifies the collection and processing of data and thus can more effectively affect the development process of players. Given that numerous applications have emerged in the market, it is necessary to determine their metric characteristics or whether their application in practice is justified. The SV application, which is used by tennis players at recreational and professional levels around the world, has not yet been the subject of scientific research for the purpose of testing metric characteristics. In the near future, the innovators of this application will announce the possibility of its use on other mobile systems, as well as in other racket sports such as badminton, pickleball, and padel.
Therefore, the aim of this research is to determine the validity of the SwingVision mobile application for monitoring speed, rotation, and placement parameters when performing serve and other strokes.
2. Materials and Methods
2.1. Sample
The sample of participants (n = 5) consisted of elite male junior tennis players (mean age 15.6 ± 0.35 years, mean height 179.16 ± 5.71 cm, and mean weight 72.62 ± 3.89 kg). The inclusion criterion was that only players that participated in national-level (Croatian) tournaments and did not have injuries in the previous 6 months could participate in the testing procedure. All players are ranked on the national rankings in the under-18 category (mean ranking 20.6 ± 5.5). All the participants were right-handed, their dominant hand was right, and were having two-handed backhand strokes. All the participants were in a regular training process. Prior to testing, the participants were given detailed information on the testing procedure, the benefits, and the potential risks of measurement. Additionally, they were asked to refrain from high-intensity exercises to avoid the impact of fatigue and physical load on testing results. Prior to the research, participants’ parents/guardians gave their consent for the implementation of measurements and the use of data.
As the main focus of this research was to determine the measurement of participants’ performance, the sample for analysis consisted of 60 serves and 100 shots played per player.
2.2. Instruments
For the purpose of measuring variables, the SwingVision app (v.9.8.3.) was used. SV provides, in a simple way, a quality and reliable notation analysis of tennis play. It is intended for all levels of players, from amateurs to professional tennis players. The app tracks the movements of players and balls using an iOS mobile device or iPad on iPad OS. For the recording of movements, the iPhone 14 pro max was used. The application used in this study is only compatible with iOS systems (iOS 13). Based on the analysis of a recorded match or training session, the application shows situational indicators of player performance. It has the ability to track the number, rotation, speed, and success of played shots. Furthermore, it provides insight into the place where the shots are played and the position of the player when playing on the court. All of the above variables can be separately observed for basic shots (serve, forehand, backhand, and volleys). The application also displays the percentage of points played according to the rally length of the changes in the point, automatically monitors the score, and provides the ability to judge whether the ball is IN or OUT. It can track the development trend of players’ games by comparing recorded video clips with other videos in the database. A Stalker ATSII (manufacturer: Stalker Sport, TX, USA) radar was used to measure serve ball speed.
2.3. Measurement Procedure
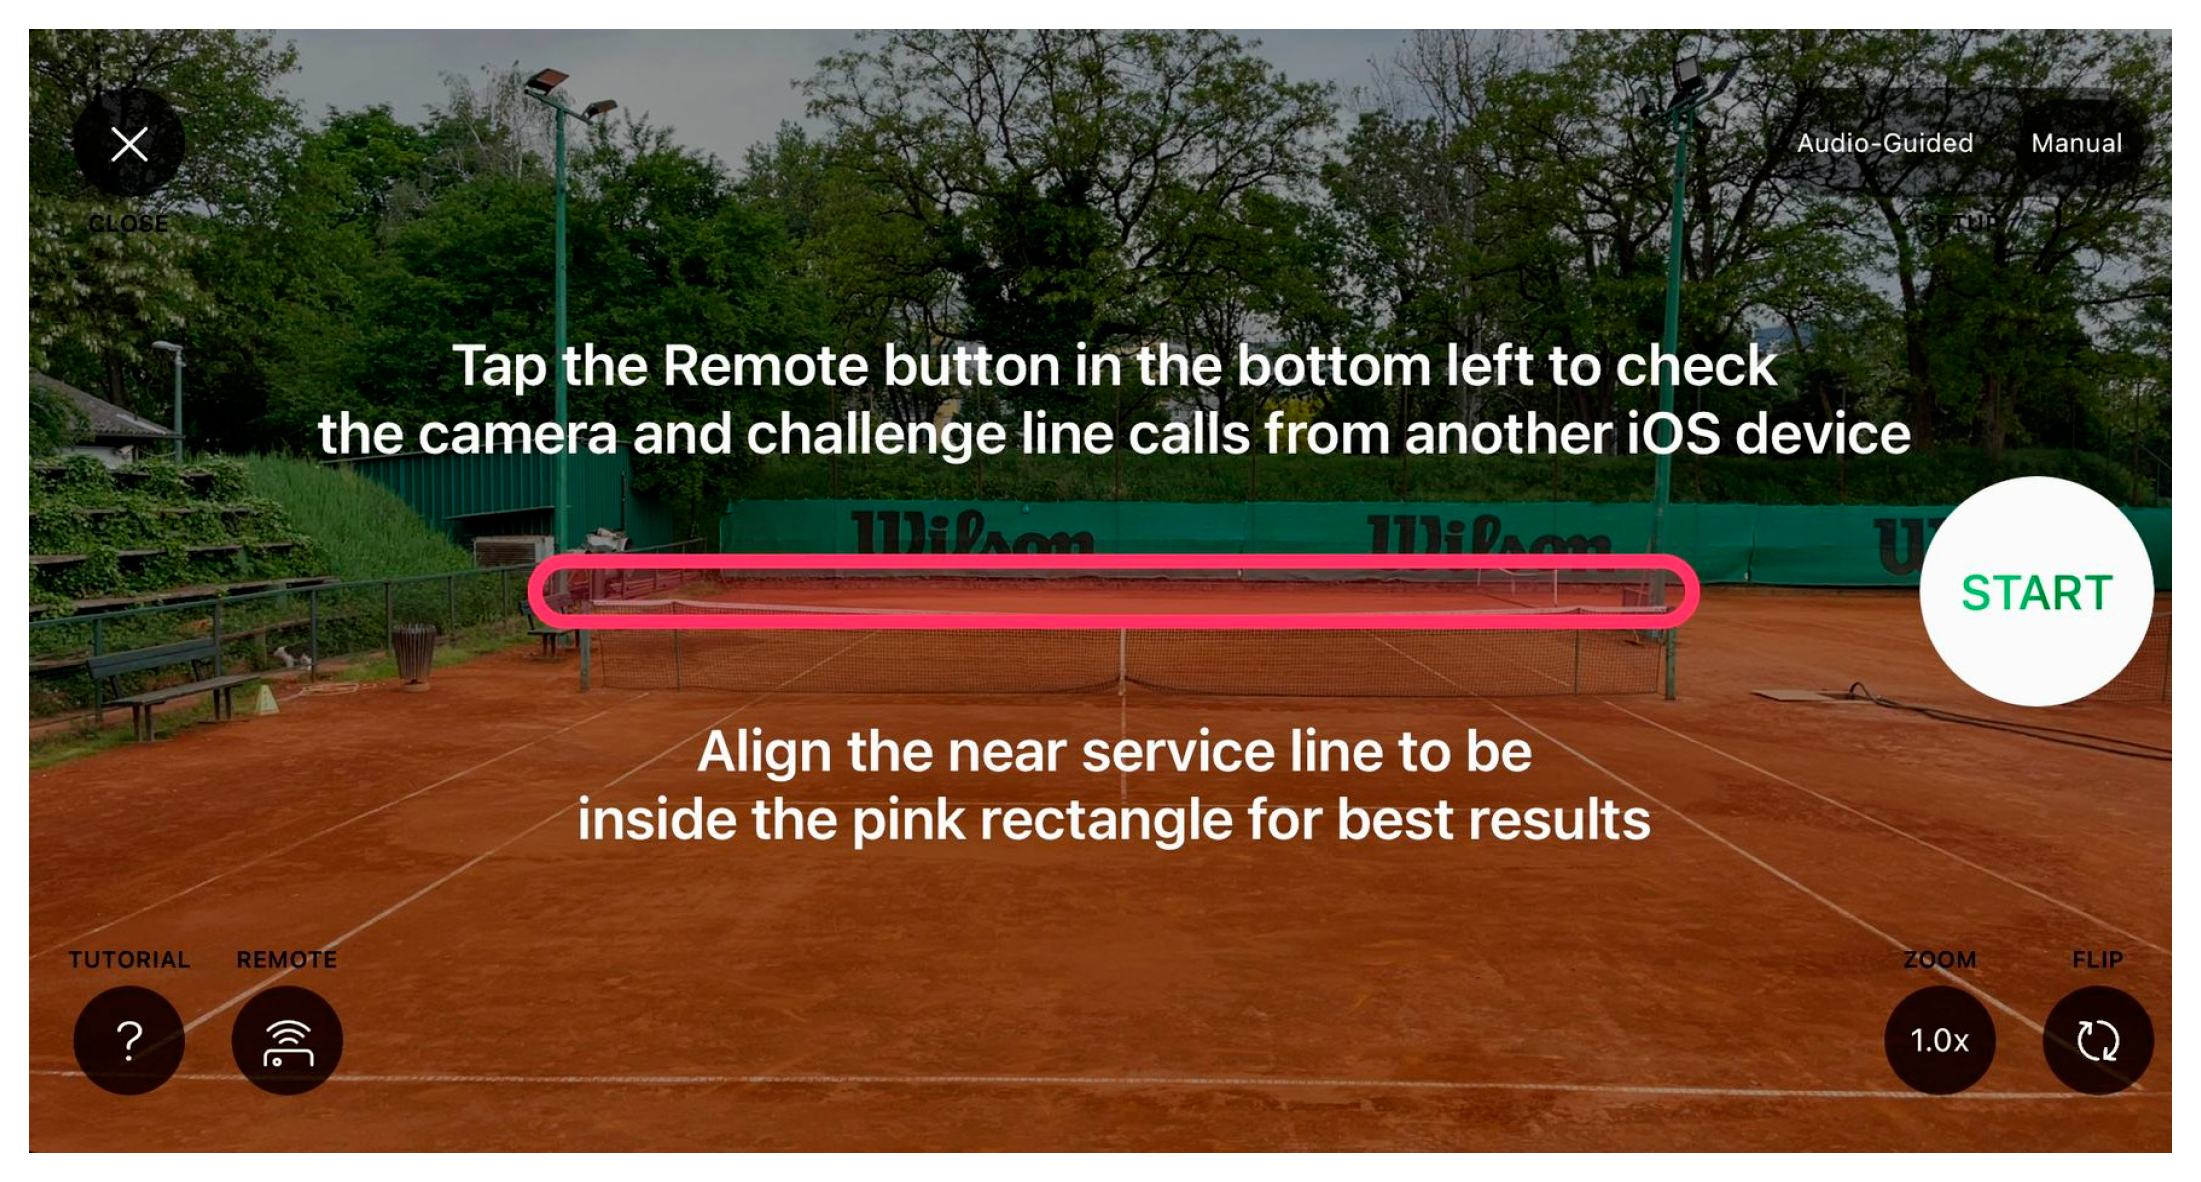
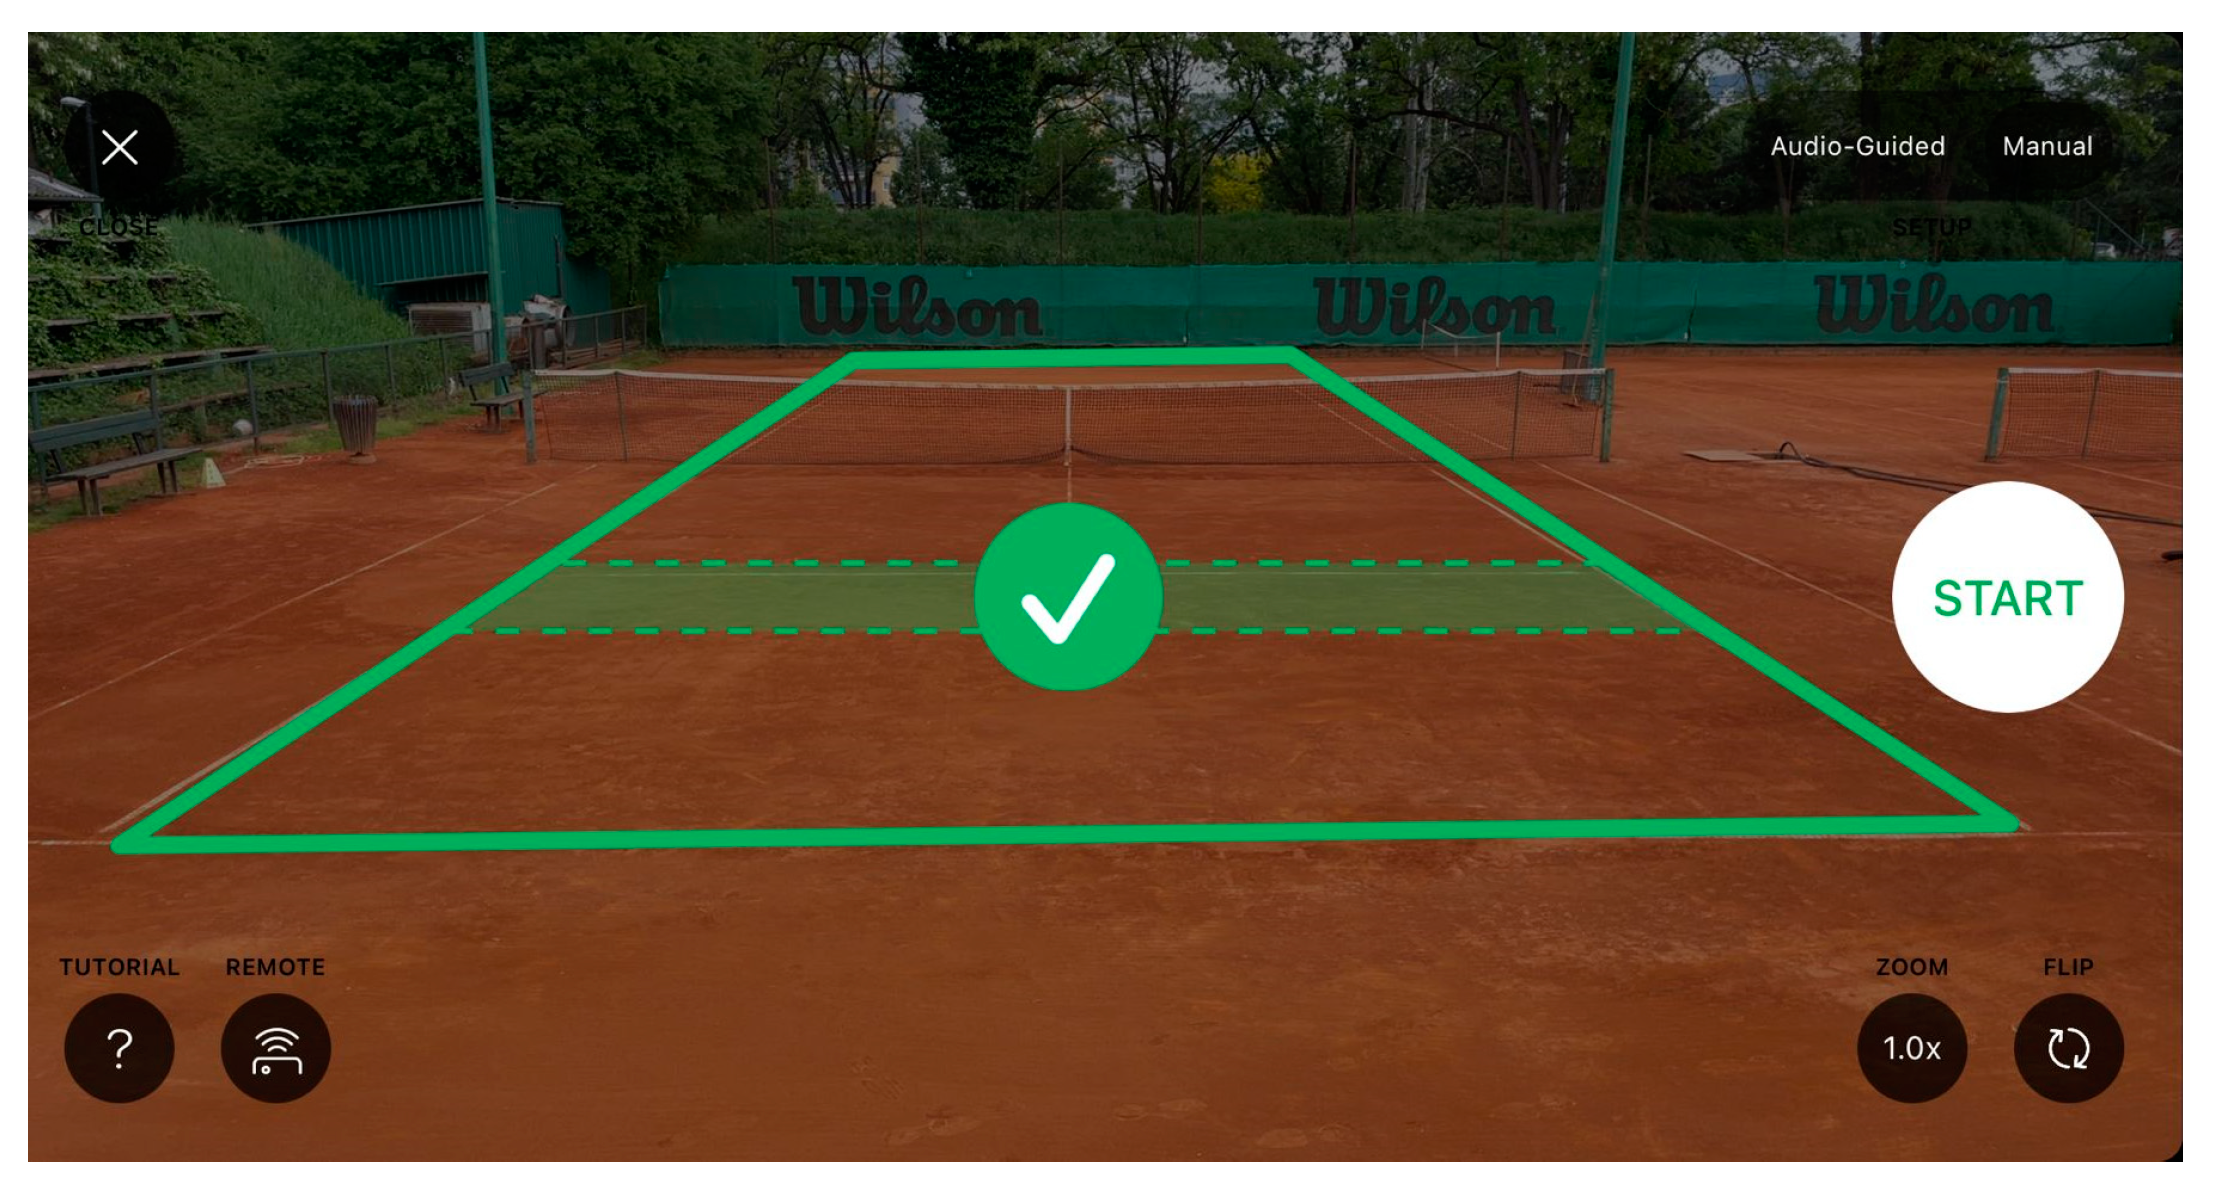
The testing procedure was conducted on an outdoor clay court. Weather conditions during testing were typical for the summer part of the tennis season on a clay surface. The test was conducted in the morning hours, and the temperature was 26 degrees, with no wind. Prior to the start of the measurement, the participants performed a standardized 20 min warm-up consisting of basic (off-court) and specific (on-court) tennis warm-up drills. After finishing the warm-up protocol, the players were instructed to serve 60 times (30 on the deuce side and 30 on the advantage side). Overall, 150 serves were observed on each serving side. The participants were instructed to serve the first serve anywhere in the service box, as they would serve during a competitive match. Upon the completion of the serving procedure, players were asked to play a training match. The first 100 shots (overall 500 shots) played were used for further analysis to determine SV validity. The observed shots in terms of the type of strokes consisted of forehand, backhand, serve, forehand volley, backhand volley, and overhead shot. Strokes in terms of spin type consisted of a kick serve, as well as slice, flat, and topspin shots. A kick serve is performed by generating a significant amount of topspin by hitting up on the ball and snapping the wrist when contacting the ball. Slice shots are characterized by adding sidespin with a low bounce of the ball after hitting the ground. Flat shots are hit without spin and are characterized by the high speed of the ball. Lastly, for topspin shots, it is necessary to swing up and brush the back of the ball when making contact. Before starting the SV application, attention should be paid to the correct placement of the mobile phone. It is recommended to place the mobile phone high enough that a few feet behind each baseline is visible. and that the top of the net does not overlap with the far service/baseline. Furthermore, for optimal accuracy, it is recommended to zoom in as close to the court while still keeping all corners of the singles court visible on screen. The phone was placed on the mount at 3 m height on the fence. The position was calibrated and aligned with the use of in-built software calibration, as presented in
Figure 1 and
Figure 2.
According to manufacturer instructions, radar settings were set at range 4, with low speed set to 70 km/h and high speed set at 250 km/h to avoid unnecessary movements around the court. Speed was measured on serve behind the player at the level of impact on the ball. The service box was divided into three equal zones from the “T“ line to the wide line of the service box. Each zone was 1.37 m wide (
Figure 3). A fourth zone represented missed shots (net or outside the service box). The server position from the deuce and advantage sides on the baseline was displayed (Δ). A video camera (Panasonic Lumix DC-GH5 II) was placed next to the service box that recorded every contact of the ball with the surface after the service. The authors of this paper used this camera to record the location of the contact of the ball with the surface and compared it with the recorded video via the application (
Figure 4). For the additional verification of the actual point of contact, the ball’s bounce was assessed on the court after each serve, checking its trace, and this was possible because the test was conducted on a clay surface, and thus the ball left a clear mark on the surface upon contact.
2.4. Variables
Variables retrieved from SwingVision were the ball speed in deuce and advantage sides on serve (SV_ball_V_De; SV_ball_V_Ad); the placement of serve in deuce and advantage sides (SV_ball_place_De; SV_ball_place_Ad); the type of stroke shot (SV_stroke); and the spin shot (SV_spin). The radar variables were the ball speed (km/h) in deuce and advantage sides (Ball_V_De; Ball_V_Ad). Video analysis variables were the placement of serve in deuce and advantage sides (Ball_place_De; Ball_place_Ad), the type of stroke shot (Stroke), and the spin shot (Spin).
2.5. Statistical Analysis
The collected data were analyzed using the statistical program Statistica 13.4. For quantitative data measured with the speed radar, basic descriptive indicators (arithmetic mean, minimum, maximum, and standard deviation) were calculated. Qualitative data presented as the placement of the serve shot and the performed spin and stroke shots were calculated and analyzed as frequencies. For the purpose of comparing the application and real analysis data, a validity test was performed in the Statistica program with the use of validity/reliability item statistics and presented as an average inter-item correlation. Inter-item correlation coefficients (ICCs) were used to determine the positive or negative relationship between the two measuring devices [
19]. An ICC value of less than 0.5 indicates low validity, between 0.5 and 0.75 medium validity, from 0.75 to 0.90 good validity, and 0.90 and more excellent validity [
20].
3. Results
The basic descriptive indicators (N, Mean, Min, Max, and St.Dev.) and validity parameters (ICCs) were calculated (
Table 1) for the speed of the serve shot.
The mean values calculated for the shot’s speed were highest when the serve shot was performed on the advantage side with radar measurement (145.60 km/h). Moreover, the highest (191.00 km/h) and lowest speed rates (102.00 km/h) were also recorded with the radar in Speed_AD. The lowest mean values of serve speed were determined in Speed_DE with SV. ICC values for speed validation were 0.76 for the deuce side and 0.80 for the advantage side of the court. Cronbach’s α coefficients were the same for both variables (0.86).
The largest number of serves on both sides was played in Zone 4 (
Table 2). Zone 4 presents missed serve, which on the AD side was (VA = 48%; SV = 44.67%) of the shots and on the DE side was 40% of all serves. On the advantage side, the application recorded fewer (67) missed serves than that found using video analysis (72). The largest number of serves was played in Zone 2, i.e., in the middle of the service box. A greater number of serves were played in Zone 3 than in Zone 1 when the subjects served from the deuce side, and vice versa when they served on the advantage side. ICC results determined good validity for both Place_DE (0.83) and Place_AD (0.87) variables.
Table 3 shows the distribution of strokes according to their type. Forehand shots were played the most (VA = 44.80%/SV = 44.60%), while the next most common shot was backhand (VA = 28.60%/SV = 28.40%). A total of VA = 127/SV = 128 serve shots were played, which amounts to VA = 25.40%/SV = 25.60% of all the shots played. The lowest number of strokes was recorded in the game on the net (volleys and smash). Regarding the validity between video analysis and SwingVision, the ICC showed excellent validity (0.97).
Video analysis and SV application recorded the highest number of topspin (VA = 46.80%/SV = 42.60%) and flat shots (VA = 34.80%/SV = 38.20%) (
Table 4.). The lowest number of shots was played via kick rotation (VA = 7.40%/SV = 6.80%), and this applied only to playing serve shots. The ICC value showed good validity (0.76) between the VA and SV analysis of the spin shots.
4. Discussion
The most important findings of this research are the results that support the purpose of using the application among tennis players. In the conducted research on the tested variables in situational conditions, the application shows good results in the metric characteristics of validity. For validity analysis, the number and characteristics of the shots collected with SV were compared with the number of shots collected from the video camera during the tennis match and comfort serve drill.
When analyzing the serve shot directed from the deuce side of the court, it can be concluded that the detection of placement had good validity (ICC = 0.83). Likewise, placement_AD also had good validity (ICC = 0.87). When analyzing the placement zones individually, it can be noted that the most similar results were between VA and SV in Zones 1, 2, and 3 on the AD side, while on the DE side, in Zone 4, there was a greater match in the results. The good validity coefficients of placement variables prove that the SV app has a quality algorithm for identifying shot placement on the service box. It is not clear why the results on the advantage side are more related than those on the deuce side of the court. In the instructions for the use of the application, when mounting a mobile phone on the court fence and when calibrating the application, it is not clearly indicated whether there are differences if the mobile phone is placed on the left or right side from the central longitudinal line.
When comparing the speed calculated from the application and detected with the speed radar, the results had good validity. The highest correlation of the results was obtained when the serve shot was performed in Speed_AD (ICC = 0.80). This result presents good validity for serves that are performed in the mean range of 136.00 to 145.60 km/h. The assumption is that the lowest serve speed would have greater validity, whereas serves over 200 km/h would have lower validity results. As presented in
Table 1, the results of the minimum speed did not differ more than 6 km/h, but the results of the maximum speed in Speed_AD had an 11 km/h difference in speed detection. Accordingly, the measured results showed good validity in the Speed_AD and Speed_DE variables. Monitoring the speed of service in major competitions takes place during each point. With SwingVision, which validly measures service speed, this is also possible at each point in real time. In previous research [
21], a correlation was observed between strength and serve speed when participants had a serve speed of 170.22 ± 15.18. In relation to this study, the presented results of serving speed are, on average, 30 km/h slower than others in the same age category. Since it is proved that serve speed is highly related to sport level [
22] determined by the national team score, the presented results showed a medium sport level in the performance of serve speed.
Moreover, when analyzing the stroke calculated from the application, very good validity was observed (ICC = 0.97). The above finding indicates the high accuracy of the application in recognizing the type of stroke shot in the changing conditions of tennis play. For example, in terms of the forehand shots, VA recognized a total of 224, compared with SV’s total of 223. In other analyzed shots (backhand, serve, FH volley, BH volley, and overhead), the results also revealed excellent validity. In a previous study [
23], where they used a portable sensor that monitored data on the total number of shots, the validity of the results was very good (ICC = 0.90). Comparing all the results that most sensors can offer [
4,
13], in this parameter, the results are the most reliable.
In the tested variable of spin shots, a good validity (ICC = 0.76) could also be observed. For example, VA detected a total of 234 shots with topspin rotation, while SV recognized a total of 213 shots. Of all the observed shots (topspin, flat, slice, and kick), the detection of the topspin shot was the least valid (ICC = 0.76), which represents good validity results. As the rotations of the player and racquet are very extreme, individual characteristics in some conditions can highly affect the detection of the technique and type of shot. Accurately obtained data for these parameters are extremely important. The ability to play shots with different rotations represents the quality of an individual tennis player. The above is important for developing technical and tactical assumptions of the game for tennis players. This is crucial to follow through different age categories, to gain insight into the total number of strokes and type of spin shots during training or match.
Based on these findings, we can conclude that the SV application can predict the actual number of shots during a tennis match with good-to-excellent validity. Following this information, one of the possible uses of the SV app can be to define the total number of individual shots played in tennis during a game, which can help coaches plan and program the entire training load. In addition, this application can be used for testing procedures and as a practical tool for tennis coaches. In addition, SV can use tennis umpires in lower-level tournaments as a helping tool to check the results if there is a miscalculation in counting or if players do not know the current results, which can be checked on the application.
Tennis players during a match perform numerous movements, such as stopping, picking up, or tapping the ball [
24]. This application does not recognize these movements, which is its advantage, because it only recognizes tennis shots during the play. Comparing the other devices mentioned in the introduction of this article, this is one of the greatest practical benefits for the player, as the sensor has no contact with the player’s body or racket. In a conversation with players who conducted tests with portable devices on their wrists or rackets, disturbance during playing was cited as the greatest drawback of the observed device. In the future, an increasing number of such applications are expected to emerge, which will offer even more parameters and higher accuracy of the obtained data due to the overall development of the mobile industry.
One of the study limitations is possible measurement errors that can exist during the visual review of the video of the play. The small number of variables and parameters is one of the limiting factors that cannot give a complete analysis of players’ performance. Furthermore, different weather conditions could affect the detection of different strokes. Additionally, the application is currently only compatible with iOS mobile devices, which narrows the range of potential users. In addition, the problem of accurate shot recognition is one of the most important features of automated systems for quantifying external hitting load in tennis [
16]. The external load that SwingVision can monitor consists of the parameters of the total number of shots played and the duration of the practice or match. Obtaining precise data on external load parameters represents a great benefit of the application for practical purposes. In addition, the knowledge obtained about this application in this research is of significant practical importance because it was found that the application provides accurate results of the observed parameters to every tennis player, regardless of individual (morphological, motor, and functional) differences.


 ) and accuracy zones (1, 2, 3, 4).

