
Seismic Risk in Alborz: Insights from Geological Moment Rate Estimation and Fault Activity Analysis

 ,
, 
Abstract
:1. Introduction
2. Tectonic Setting and Seismicity
3. Results and Discussion
4. Conclusions
Author Contributions
Funding
Institutional Review Board Statement
Informed Consent Statement
Data Availability Statement
Acknowledgments
Conflicts of Interest
References
- Mazzotti, S.; Leonard, L.J.; Cassidy, J.F.; Rogers, G.C.; Halchuk, S. Seismic Hazard in Western Canada from GPS Strain Rates versus Earthquake Catalog. J. Geophys. Res. Solid. Earth 2011, 116. [Google Scholar] [CrossRef]
- Pancha, A.; Anderson, J.G.; Kreemer, C. Comparison of Seismic and Geodetic Scalar Moment Rates across the Basin and Range Province. Bull. Seismol. Soc. Am. 2006, 96, 11–32. [Google Scholar] [CrossRef]
- D’Agostino, N.; Mantenuto, S.; D’Anastasio, E.; Avallone, A.; Barchi, M.; Collettini, C.; Radicioni, F.; Stoppini, A.; Fastellini, G. Contemporary Crustal Extension in the Umbria–Marche Apennines from Regional CGPS Networks and Comparison between Geodetic and Seismic Deformation. Tectonophysics 2009, 476, 3–12. [Google Scholar] [CrossRef]
- Derakhshani, R.; Eslami, S.S. A New Viewpoint for Seismotectonic Zoning. Am. J. Environ. Sci. 2011, 7, 212–218. [Google Scholar] [CrossRef]
- Delvaux, D.; Maddaloni, F.; Tesauro, M.; Braitenberg, C. The Congo Basin: Stratigraphy and Subsurface Structure Defined by Regional Seismic Reflection, Refraction and Well Data. Glob. Planet. Change 2021, 198, 103407. [Google Scholar] [CrossRef]
- Déprez, A.; Doubre, C.; Masson, F.; Ulrich, P. Seismic and Aseismic Deformation along the East African Rift System from a Reanalysis of the GPS Velocity Field of Africa. Geophys. J. Int. 2013, 193, 1353–1369. [Google Scholar] [CrossRef]
- Stevens, V.L.; Avouac, J.P. Millenary Mw > 9.0 Earthquakes Required by Geodetic Strain in the Himalaya. Geophys. Res. Lett. 2016, 43, 1118–1123. [Google Scholar] [CrossRef]
- Bos, A.G.; Spakman, W. Kinematics of the Southwestern US Deformation Zone Inferred from GPS Motion Data. J. Geophys. Res. Solid. Earth 2005, 110. [Google Scholar] [CrossRef]
- Palano, M.; Imprescia, P.; Agnon, A.; Gresta, S. An Improved Evaluation of the Seismic/Geodetic Deformation-Rate Ratio for the Zagros Fold-and-Thrust Collisional Belt. Geophys. J. Int. 2018, 213, 194–209. [Google Scholar] [CrossRef]
- Javidfakhr, B.; Bellier, O.; Shabanian, E.; Siame, L.; Léanni, L.; Bourlès, D.; Ahmadian, S. Fault Kinematics and Active Tectonics at the Southeastern Boundary of the Eastern Alborz (Abr and Khij Fault Zones): Geodynamic Implications for NNE Iran. J. Geodyn. 2011, 52, 290–303. [Google Scholar] [CrossRef]
- Rashidi, A. Geometric and Kinematic Characteristics of the Khazar and North Alborz Faults: Links to the Structural Evolution of the North Alborz-South Caspian Boundary, Northern Iran. J. Asian Earth Sci. 2021, 213, 104755. [Google Scholar] [CrossRef]
- Nazari, H.; Ritz, J.-F.; Burg, J.-P.; Shokri, M.; Haghipour, N.; Vizheh, M.M.; Avagyan, A.; Nashli, H.F.; Ensani, M. Active Tectonics along the Khazar Fault (Alborz, Iran). J. Asian Earth Sci. 2021, 219, 104893. [Google Scholar] [CrossRef]
- Hessami, K.; Mobayyen, F.; Tabassi, H. The Map of Active Faults of Iran; International Institute of Earthquake Engineering and Seismology Tehran: Tajrish, Iran, 2013. [Google Scholar]
- Sheykholeslami, M.R.; Javadi, H.R.; Asadi, M. Iran Fault Map on Provincial Subdivisions; Geological Survey & Mineral Explorations of Iran (GSI): Tehran, Iran, 2013. [Google Scholar]
- Rashidi, A.; Derakhshani, R. Strain and Moment Rates from GPS and Seismological Data in Northern Iran: Implications for an Evaluation of Stress Trajectories and Probabilistic Fault Rupture Hazard. Remote Sens. 2022, 14, 2219. [Google Scholar] [CrossRef]
- Trifonov, V.G.; Hessami, K.; Popov, S.V.; Zelenin, E.A.; Trikhunkov, Y.I.; Frolov, P.D.; Golovina, L.A.; Simakova, A.N.; Rashidi, A.; Latyshev, A.V. Development of the Southern Coastal Area of the Caspian Sea during the Pliocene–Quaternary According to Biostratigraphic and Magnetostratigraphic Data. Stratigr. Geol. Correl. 2022, 30, 273–291. [Google Scholar] [CrossRef]
- Nikpeyman, Y.; Nikpeyman, V.; Derakhshani, R.; Raoof, A. Assessment of a Multi-Layer Aquifer Vulnerability Using a Multi-Parameter Decision-Making Method in Mosha Plain, Iran. Water 2022, 14, 3397. [Google Scholar] [CrossRef]
- Rashidi, A.; Kianimehr, H.; Shafieibafti, S.; Mehrabi, A.; Derakhshani, R. Active Faults in the West of the Lut Block (Central Iran). Geophys. Res. 2021, 22, 70–84. [Google Scholar] [CrossRef]
- Rashidi, A.; Kianimehr, H.; Yamini-Fard, F.; Tatar, M.; Zafarani, H. Present Stress Map and Deformation Distribution in the NE Lut Block, Eastern Iran: Insights from Seismic and Geodetic Strain and Moment Rates. Pure Appl. Geophys. 2022, 179, 1887–1917. [Google Scholar] [CrossRef]
- Ezati, M.; Rashidi, A.; Gholami, E.; Mousavi, S.M.; Nemati, M.; Shafieibafti, S.; Derakhshani, R. Paleostress Analysis in the Northern Birjand, East of Iran: Insights from Inversion of Fault-Slip Data. Minerals 2022, 12, 1606. [Google Scholar] [CrossRef]
- Ezati, M.; Gholami, E.; Mousavi, S.M.; Rashidi, A.; Derakhshani, R. Active Deformation Patterns in the Northern Birjand Mountains of the Sistan Suture Zone, Iran. Appl. Sci. 2022, 12, 6625. [Google Scholar] [CrossRef]
- Kamali, Z.; Nazari, H.; Rashidi, A.; Heyhat, M.R.; Khatib, M.M.; Derakhshani, R. Seismotectonics, Geomorphology and Paleoseismology of the Doroud Fault, a Source of Seismic Hazard in Zagros. Appl. Sci. 2023, 13, 3747. [Google Scholar] [CrossRef]
- Mehrabi, A.; Pirasteh, S.; Rashidi, A.; Pourkhosravani, M.; Derakhshani, R.; Liu, G.; Mao, W.; Xiang, W. Incorporating Persistent Scatterer Interferometry and Radon Anomaly to Understand the Anar Fault Mechanism and Observing New Evidence of Intensified Activity. Remote Sens. 2021, 13, 2072. [Google Scholar] [CrossRef]
- Ambraseys, N.N.; Melville, C.P. A History of Persian Earthquakes; Cambridge University Press: Cambridge, UK, 1982; ISBN 0521021871. [Google Scholar]
- Berberian, M. Natural Hazards and the First Earthquake Catalog of Iran, Volume 1: Historical Hazards in Iran Prior to 1900. Int. Institue Earthq. Eng. Seismol. 1994, 1, 603. [Google Scholar]
- Berberian, M.; Yeats, R.S. Contribution of Archaeological Data to Studies of Earthquake History in the Iranian Plateau. J. Struct. Geol. 2001, 23, 563–584. [Google Scholar] [CrossRef]
- Berberian, M.; Yeats, R.S. Patterns of Historical Earthquake Rupture in the Iranian Plateau. Bull. Seismol. Soc. Am. 1999, 89, 120–139. [Google Scholar] [CrossRef]
- Tchalenko, J.S. Seismotectonic Framework of the North Tehran Fault. Tectonophysics 1975, 29, 411–420. [Google Scholar] [CrossRef]
- Gutenberg, B.; Richter, C.F. Magnitude and Energy of Earthquakes. Ann. Geophys. 1956, 9, 795. [Google Scholar] [CrossRef]
- Nowroozi, A.A.; Ahmadi, G. Analysis of Earthquake Risk in Iran Based on Seismotectonic Provinces. Tectonophysics 1986, 122, 89–114. [Google Scholar] [CrossRef]
- Pourkermani, M.; Arian, M. Seismotectonics; Dez Ab Consulting Engineers Company Press: Tehran, Iran, 1997. [Google Scholar]
- Trifunac, M.D.; Brady, A.G. On the Correlation of Seismic Intensity Scales with the Peaks of Recorded Strong Ground Motion. Bull. Seismol. Soc. Am. 1975, 65, 139–162. [Google Scholar]
- Tocher, D. Movement on Faults. In Proceedings of the Second World Conference on Earthquake Engineering, Tokyo, Japan, 11–18 July 1960; Volume 1, pp. 551–564. [Google Scholar]
- Nowroozi, A.A.; Mohajer-Ashjai, A. Fault Movements and Tectonics of Eastern Iran: Boundaries of the Lut Plate. Geophys. J. Int. 1985, 83, 215–237. [Google Scholar] [CrossRef]
- Donovan, N.C. A Statistical Evaluation of Strong Motion Data: Including the February 9, 1971 San Fernando Earthquake; Dames & Moore: San Francisco, CA, USA, 1973. [Google Scholar]
- Campbell, K. Near-Source Attenuation of Peak Horizontal Acceleration. Bull. Seismol. Soc. Am. 1981, 71, 2039–2070. [Google Scholar]
- Zolfaghari, M.R. Geodetic Deformation vs. Seismic Strain Deduced by Historical Earthquakes across the Alborz Mountains. J. Seismol. 2009, 13, 647–663. [Google Scholar] [CrossRef]
- Rizza, M.; Mahan, S.; Ritz, J.F.; Nazari, H.; Hollingsworth, J.; Salamati, R. Using Luminescence Dating of Coarse Matrix Material to Estimate the Slip Rate of the Astaneh Fault, Iran. Quat. Geochronol. 2011, 6, 390–406. [Google Scholar] [CrossRef]
- Nazari, H.; Ritz, J.F.; Walker, R.T.; Salamati, R.; Rizza, M.; Patnaik, R.; Hollingsworth, J.; Alimohammadian, H.; Jalali, A.; Kaveh Firouz, A.; et al. Palaeoseismic Evidence for a Medieval Earthquake, and Preliminary Estimate of Late Pleistocene Slip-Rate, on the Firouzkuh Strike-Slip Fault in the Central Alborz Region of Iran. J. Asian Earth Sci. 2014, 82, 124–135. [Google Scholar] [CrossRef]
- Ritz, J.-F.; Nazari, H.; Ghassemi, A.; Salamati, R.; Shafei, A.; Solaymani, S.; Vernant, P. Active Transtension inside Central Alborz: A New Insight into Northern Iran–Southern Caspian Geodynamics. Geology 2006, 34, 477–480. [Google Scholar] [CrossRef]
- Nazari, H.; Ritz, J.-F.; Salamati, R.; Shafei, A.; Ghassemi, A.; Michelot, J.-L.; Massault, M.; Ghorashi, M. Morphological and Palaeoseismological Analysis along the Taleghan Fault (Central Alborz, Iran). Geophys. J. Int. 2009, 178, 1028–1041. [Google Scholar] [CrossRef]
- Ritz, J.F.; Nazari, H.; Balescu, S.; Lamothe, M.; Salamati, R.; Ghassemi, A.; Shafei, A.; Ghorashi, M.; Saidi, A. Paleoearthquakes of the Past 30,000 Years along the North Tehran Fault (Iran). J. Geophys. Res. Solid. Earth 2012, 117. [Google Scholar] [CrossRef]
- Vernant, P.; Nilforoushan, F.; Chéry, J.; Bayer, R.; Djamour, Y.; Masson, F.; Nankali, H.; Ritz, J.F.; Sedighi, M.; Tavakoli, F. Deciphering Oblique Shortening of Central Alborz in Iran Using Geodetic Data. Earth Planet. Sci. Lett. 2004, 223, 177–185. [Google Scholar] [CrossRef]
- Djamour, Y.; Vernant, P.; Bayer, R.; Hatam, Y.; Ritz, J.F.; Hinderer, J.; Luck, B.; Nankali, H.; Le Moigne, N.; Sedighi, M. Geodetic Signatures of Present-Day Tectonic Deformation in Central Alborz and Tehran Region (Iran). Geophys. J. Int. 2010, 183, 1287–1301. [Google Scholar] [CrossRef]
- Ghassemi, M.R.; Fattahi, M.; Landgraf, A.; Ahmadi, M.; Ballato, P.; Tabatabaei, S.H. Kinematic Links between the Eastern Mosha Fault and the North Tehran Fault, Alborz Range, Northern Iran. Tectonophysics 2014, 622, 81–95. [Google Scholar] [CrossRef]
- Nazari, H.; Ritz, J.F.; Salamati, R.; Solaymani, S.; Balescu, S.; Michelot, J.L.; Ghassemi, A.; Talebian, M.; Lamothe, M.; Massault, M. Paleoseismological Analysis in Central Alborz, Iran. In Proceedings of the Conference Commemorating the 50th Anniversary of the 1957 Gobi-Altay Earthquake, Ulaanbaatar, Mongolia, 25 July–8 August 2007. [Google Scholar]
- Ward, S.N. On the Consistency of Earthquake Moment Rates, Geological Fault Data, and Space Geodetic Strain: The United States. Geophys. J. Int. 1998, 134, 172–186. [Google Scholar] [CrossRef]


| Fault Name | T | L (Km) | R (m) | Fault Name | T | L (Km) | R (m) |
|---|---|---|---|---|---|---|---|
| Sangavar | Earthquake Fault | 81 | 360 | F2 = Hokm Abad-Baba Cheshmeh | Quaternary Fault | 152 | 366 |
| Masuleh | Active, Thrust and Reverse | 105 | 253 | Jajarm | Active, Thrust and Reverse | 78 | 435 |
| F33 = Rudbar fault branch | Earthquake Fault | 10 | 252 | F36 = Siah Kuh | Quaternary Fault | 100 | 392 |
| Talesh | Active and Relative Fault | 250 | 250 | Rabat Garbil | Quaternary Fault | 119 | 382 |
| F33 = Rudbar fault branch | Earthquake, Thrust and Reverse | 30 | 219 | Sfarayen | Active Fault | 40 | 512 |
| Rudbar | Strike-Slip | 37 | 178 | Sabzevar | Active, Thrust and Reverse | 7 | 498 |
| F32 = Kabatteh fault branch | Active Fault | 42 | 190 | Doruneh1 | Active Fault | 31 | 481 |
| Lahijan | Active Fault | 42 | 217 | Doruneh2 | Active, Strike-Slip | 35 | 477 |
| F31 = North Alborz fault branche | Active Fault | 45 | 196 | Torud | Active Fault | 80 | 241 |
| North Rudbar | Quaternary Fault | 100 | 162 | F8 = Qods | Active Fault | 23 | 280 |
| Bonan | Active Fault | 76 | 112 | F9 = Alikhan | Active Fault | 64 | 277 |
| Alamutrud | Active, Thrust and Reverse | 133 | 78 | F10 = Mehrkardu | Active, Strike-Slip | 33 | 348 |
| F21 = Daryasar-Dikin | Active Fault | 19 | 118 | F11 = Mozaffar Abad | Active, Thrust and Reverse | 69 | 336 |
| F22 = Veneda-Veres | Active Fault | 37 | 85 | Ghachab | Quaternary, Thrust and Reverse | 40 | 158 |
| F23 = North of Ghazvin | Active Fault | 10 | 105 | Pishva | Quaternary Fault | 35 | 50 |
| F24 = Gharib Mazraeh-Veres | Active Fault | 21 | 111 | Garmsar | Active, Thrust and Reverse | 70 | 65 |
| North Ghazvin | Active, Thrust and Reverse | 64 | 129 | Eyvanaki | Thrust and Reverse | 94 | 9 |
| Zanjan | Quaternary Fault | 104 | 196 | Kahrizak | Active, Thrust and Reverse | 4 | 21 |
| F35 = Gomrokan | Quaternary Fault | 15 | 193 | South Tehran | Active, Thrust and Reverse | 21 | 14 |
| F34–F33 = Baghestan-Qeshlagh-Aldaghlu-Shinin | Quaternary Fault | 25 | 170 | Siah Kuh | Quaternary, Thrust and Reverse | 38 | 62 |
| Soltanieh | Quaternary, Thrust and Reverse | 116 | 216 | F27 = Abdareh-Khar Rud | Quaternary Fault | 41 | 147 |
| F25 = Hasan Abad | Active, Thrust and Reverse | 6 | 111 | Parandak | Quaternary Fault | 42 | 111 |
| Kandovan | Quaternary, Thrust and Reverse | 80 | 51 | F28 = Avaj-Ahmad Abad-Karvansara | Quaternary Fault | 47 | 190 |
| F19 = Kajur-Khachak | Quaternary, Thrust and Reverse | 75 | 74 | F29 = Indes Ardmin | Quaternary Fault | 7 | 185 |
| F14 = Ghasre Firozeh | Quaternary Fault | 12 | 7 | Kushk-e Nosrat | Quaternary Fault | 116 | 105 |
| F15 = Sorkhe Hesar | Quaternary Fault | 12 | 12 | F29 = Indes-Aremin | Quaternary Fault | 31 | 151 |
| F16 = Niavaran-North of Tehran | Quaternary Fault | 16 | 15 | F30 = Dokhan-Nobaran | Quaternary Fault | 50 | 176 |
| F17 = Telo-Pajen | Active Fault | 12 | 9 | Indes | Active, Thrust and Reverse | 28 | 150 |
| North Tehran | Active Fault | 176 | 11 | South Parandak | Quaternary Fault | 107 | 78 |
| Taleghan | Active, Thrust and Reverse | 59 | 52 | North Parandak | Earthquake fault, Strike-Slip | 74 | 96 |
| North Alborz | Active, Thrust and Reverse | 463 | 87 | Eshtehard | Active, Thrust and Reverse | 67 | 50 |
| Gorgan | Active Fault | 85 | 268 | Ipak | Active, Thrust and Reverse | 52 | 76 |
| Khazar | Active, Thrust and Reverse | 314 | 99 | F12 = Darin | Quaternary Fault | 43 | 44 |
| F13 = Allahabad | Active Fault | 85 | 95 | F26 = Vanedar | Active Fault | 10 | 131 |
| F7 = Anjilu | Quaternary Fault | 102 | 237 | Bozgush | Quaternary Fault | 73 | 398 |
| F5 = Chashm-Astaneh | Quaternary Fault | 176 | 139 | Mosha | Active, Strike-Slip | 235 | 22 |
| Damghan | Active and Relative | 83 | 224 | F18 = Ememzadeh Davood | Active, Strike-Slip | 11 | 14 |
| Astaneh | Active Fault | 66 | 244 | Meyamey | Quaternary Fault | 137 | 316 |
| F4 = Amiran | Quaternary Fault | 53 | 314 | F1 = Abr | Active, Relative Fault | 38 | 324 |
| Semnan | Quaternary, Thrust and Reverse | 26 | 221 | Shavar | Active, Thrust and Reverse | 42 | 285 |
| F6 = Attari | Quaternary Fault | 60 | 224 | Kushke Nosrat | Quaternary Fault | 127 | 91 |
| F3 = Ramishan-Sabzevar | Quaternary Fault | 57 | 418 | Atary | Quaternary Fault | 165 | 134 |
| Jagatai | Quaternary Fault | 64 | 446 | F20 = Taleghan-Kahar | Active, Thrust and Reverse Fault | 78 | 29 |
| No. | Date | Lat. | Long. | M | q | i0 | r | r′ | Ref. |
|---|---|---|---|---|---|---|---|---|---|
| 1 | c.1.8 Ma | 36.11 | 50.78 | >7 | c | >IX | - | - | B |
| 2 | c. 38,500–10,000 Bp | 35.82 | 52.11 | >6.5 | c | >VIII | - | - | B |
| 3 | c. 4500 Bp | 36.7 | 49.98 | >6.5 | c | >VIII | - | - | B |
| 4 | c. 4000–3000 Bp | 35.6 | 49.9 | - | - | - | - | - | A |
| 5 | c. 4000–3350 Bp | 34.45 | 47.92 | - | b | - | - | - | B |
| 6 | c. 2400–2300 Bp | 35.5 | 51.8 | 7.6 | - | 1 | - | - | A |
| 7 | c. 4th cent. | 35.5 | 51.8 | 7.6 | - | 1 | - | - | A |
| 8 | 743 | 35.3 | 52.2 | 7.2 | c | 2 | 30 | - | A |
| 9 | 855 | 35.6 | 51.5 | 7.1 | b | 2 | - | 540 | A |
| 10 | January 864 | 35.7 | 51 | 5.3 | c | 3 | - | - | A |
| 12 | 23 February 958 | 36 | 51.1 | 7.7 | b | 1 | 50 | 700 | A |
| 13 | 27 April 1008 | 34.6 | 47.4 | 7 | c | 1+ | - | - | A |
| 14 | 1052 | 36.6 | 50.3 | 6.8 | b | >VII+ | - | 400 | B |
| 15 | 10 December 1119 | 35.7 | 49.9 | 6.5 | c | 2 | - | - | A |
| 16 | May 1177 | 35.92 | 50.83 | 7.2 | c | - | - | 650 | B |
| 17 | 15 October 1485 | 36.7 | 50.5 | 7.2 | a | 2 | 28 | 650 | A |
| 18 | 3 July 1486 | 36.43 | 50.45 | - | c | - | - | - | B |
| 19 | 20 April 1608 | 36.4 | 50.5 | 7.6 | b | 1 | 26 | 600 | A |
| 20 | 1665 | 35.75 | 52.08 | 6.5 | c | 2 | - | - | B |
| 21 | 1687 | 36.3 | 52.6 | 6.5 | e | 2 | - | - | A |
| 22 | July 1721 | 35.68 | 50.2 | - | d | - | - | - | B |
| 23 | 1805 | 36.2 | 52.4 | - | c | 2 | - | 100 | A |
| 24 | 26 June 1808 | 35.3 | 54.5 | 6.6 | b | 2 | - | 320 | A |
| 25 | 9 October 1808 | 36.2 | 52.4 | - | d | 5 | - | - | A |
| 26 | 16 December 1808 | 36.4 | 50.3 | 5.9 | b | - | - | 200 | A |
| 27 | 1809 | 36.3 | 52.5 | 6.5 | b | 2 | 15 | 290 | A |
| 28 | June 1815 | 35.9 | 52.2 | - | d | 4 | 30 | - | A |
| 29 | 1825 | 36.1 | 52.6 | 6.7 | b | 2 | 24 | 360 | A |
| 30 | 27 March 1830 | 35.7 | 52.5 | 7.1 | b | 2 | 37 | 570 | A |
| 31 | 6 April 1830 | 35.73 | 52.6 | 5.3 | b | 3 | - | - | B |
| 32 | 1 November 1854 | - | - | - | - | VI | - | - | B |
| 33 | 18 April 1857 | - | - | - | - | VI | - | - | B |
| 34 | 1868 | 34.9 | 52.5 | 6.4 | c | - | - | 300 | A |
| 35 | 20 October 1876 | 35.8 | 49.8 | 5.7 | b | 2 | 19 | 150 | A |
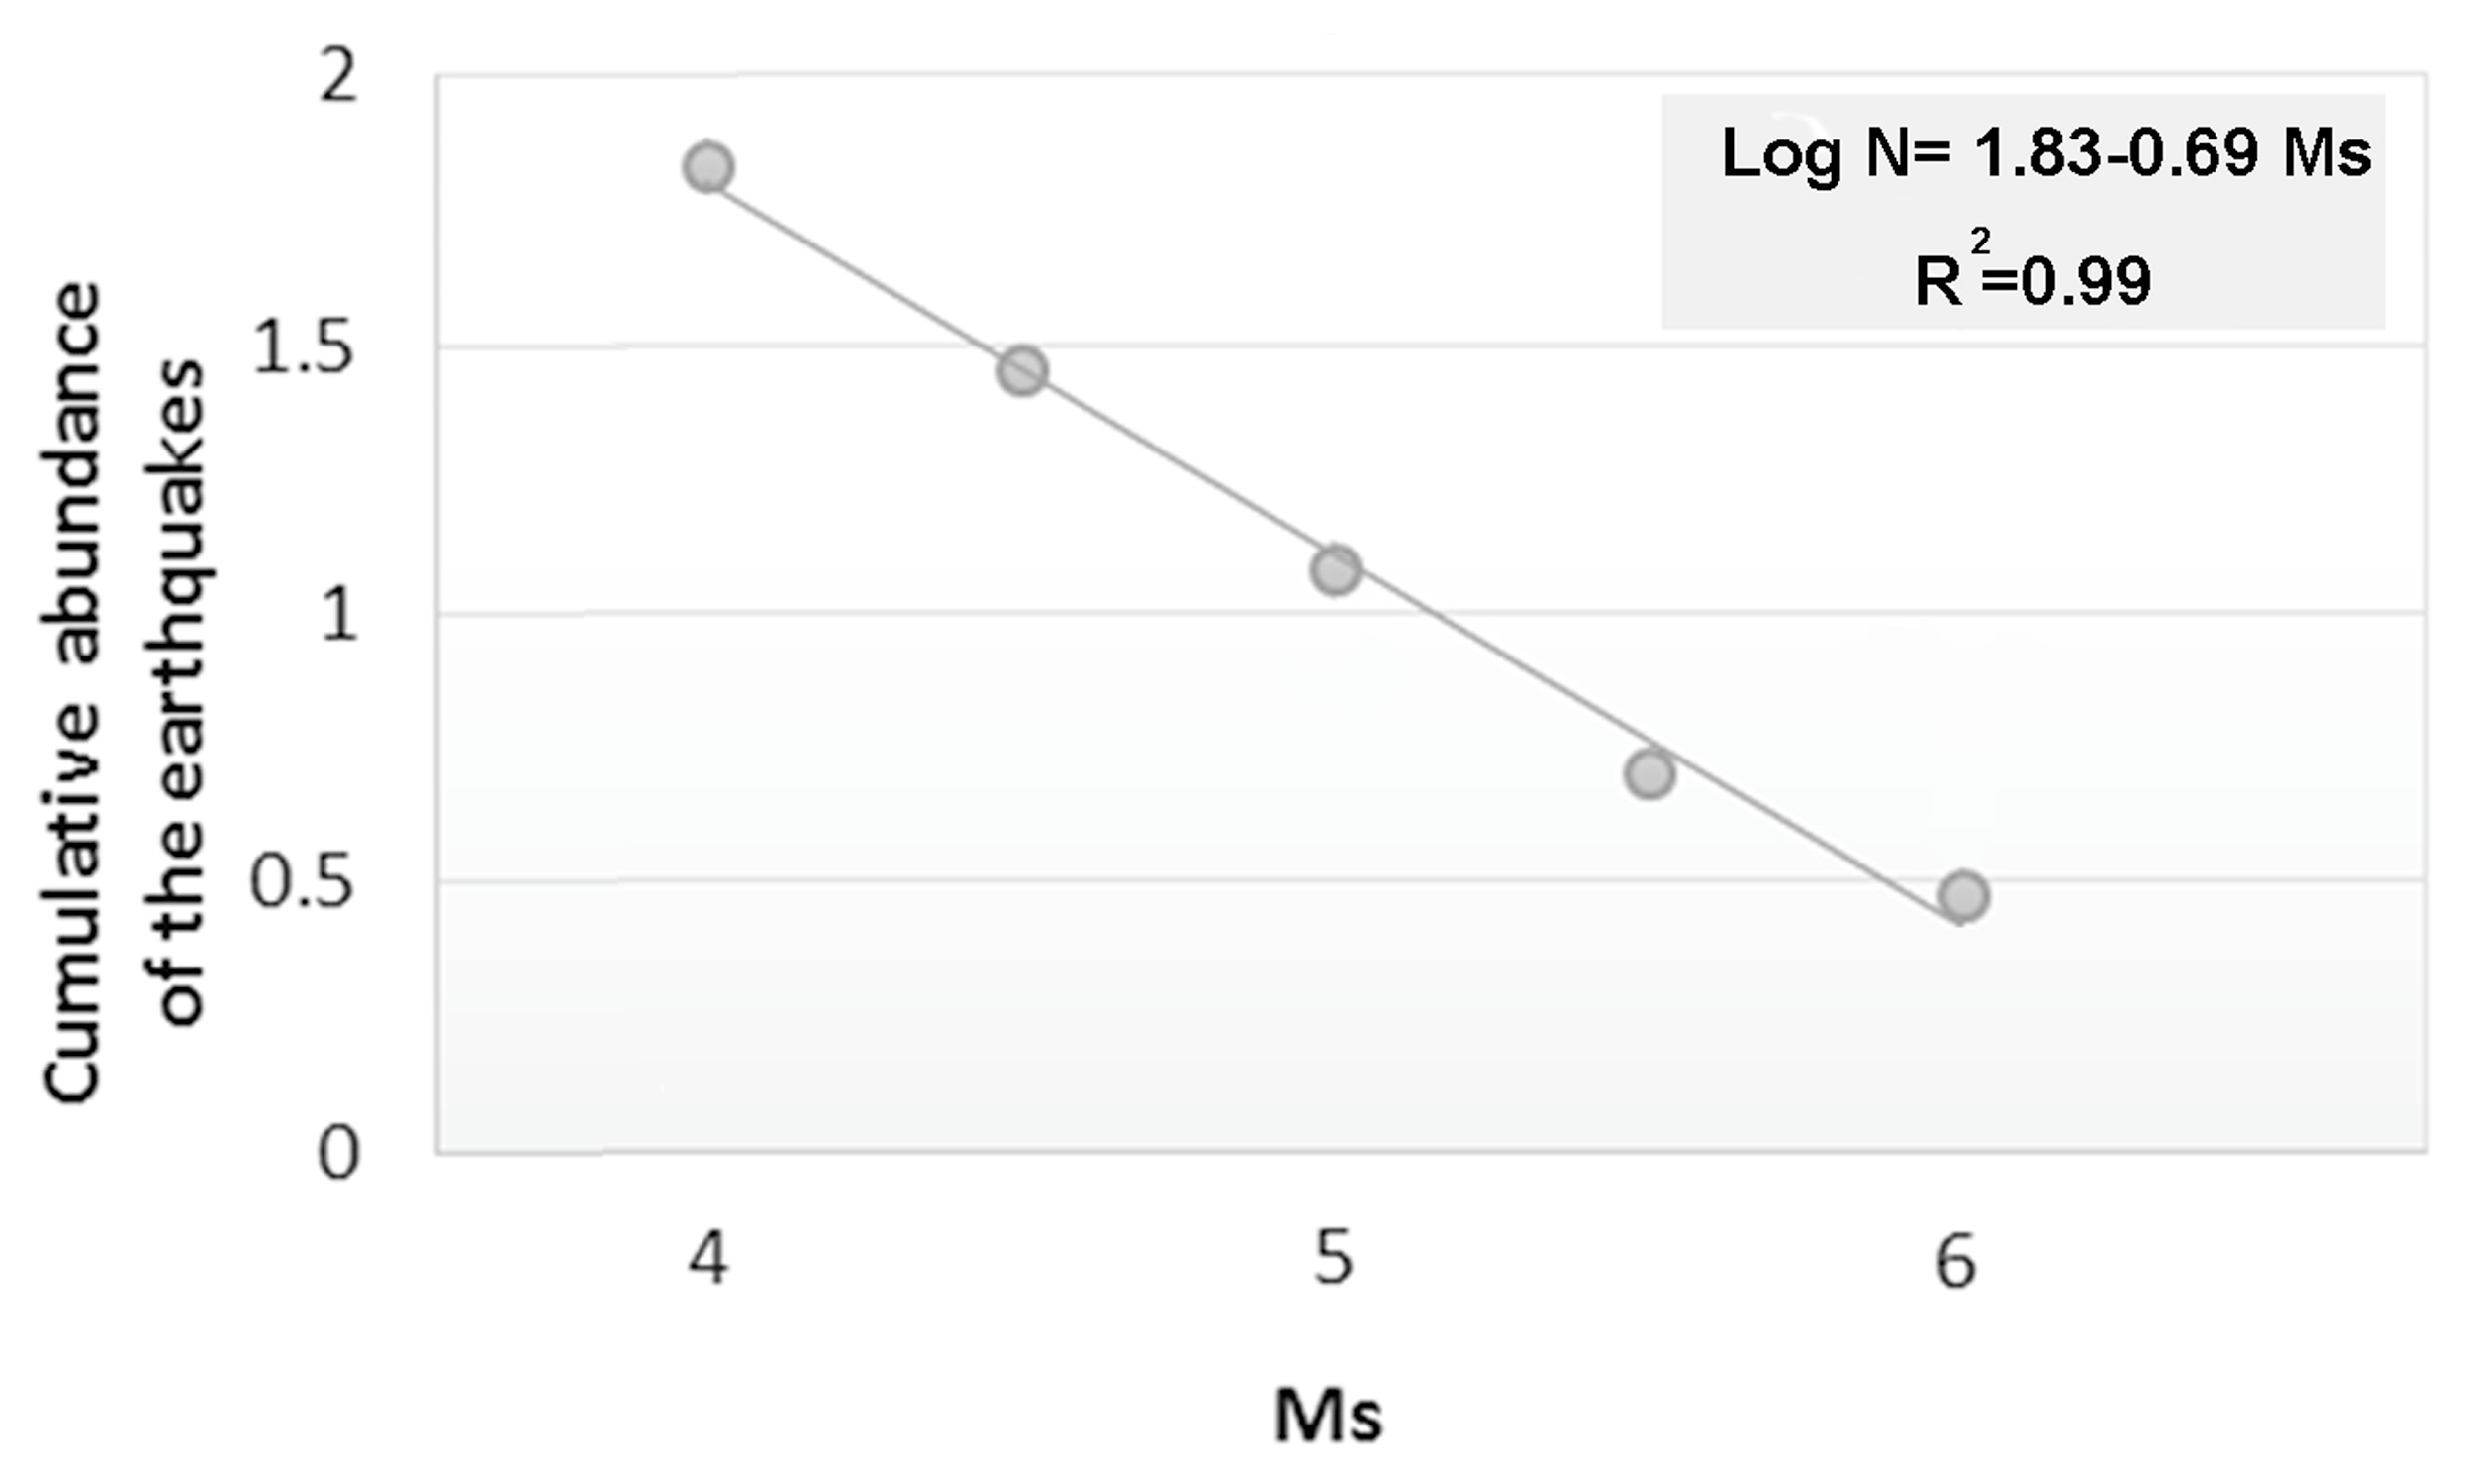
| a | b | Ms | log N | N | T (Year) |
|---|---|---|---|---|---|
| 1.832508913 | 0.6918 | 3 | −0.255856 | 0.55481 | 1.8 |
| 3.2 | −0.394216 | 0.403445 | 2.4 | ||
| 3.4 | −0.532576 | 0.293376 | 3.4 | ||
| 3.6 | −0.670936 | 0.213336 | 4.6 | ||
| 3.8 | −0.809296 | 0.155133 | 6.4 | ||
| 4 | −0.947656 | 0.112809 | 8.8 | ||
| 4.4 | −1.224376 | 0.059652 | 16.7 | ||
| 4.6 | −1.362736 | 0.043377 | 23.0 | ||
| 4.8 | −1.501096 | 0.031543 | 31.7 | ||
| 5 | −1.639456 | 0.022937 | 43.5 | ||
| 5.2 | −1.777816 | 0.01668 | 59.9 | ||
| 5.4 | −1.916176 | 0.012129 | 82.4 | ||
| 5.6 | −2.054536 | 0.00882 | 113.3 | ||
| 5.8 | −2.192896 | 0.006414 | 155.9 | ||
| 6 | −2.331256 | 0.004664 | 214.4 | ||
| 6.2 | −2.469616 | 0.003391 | 294.8 | ||
| 6.4 | −2.607976 | 0.002466 | 405.4 | ||
| 6.6 | −2.746336 | 0.001793 | 557.6 | ||
| 6.8 | −2.884696 | 0.001304 | 766.8 | ||
| 7.2 | −3.161416 | 0.00069 | 1450.1 | ||
| 7.4 | −3.299776 | 0.000501 | 1994.2 | ||
| 7.6 | −3.438136 | 0.000365 | 2742.4 | ||
| 7.7 | −3.507316 | 0.000311 | 3216.0 |
| a | b | MS | Earthquake Return Period | Useful Life (T) | DBE (R = 64%) | MCE (R = 90%) |
|---|---|---|---|---|---|---|
| 1.832509 | 0/6918 | 3 | 1.8 | 10 | 4.08 | 5.51 |
| 3.2 | 2.4 | 20 | 4.52 | 5.94 | ||
| 3.4 | 3.4 | 30 | 4.77 | 6.2 | ||
| 3.6 | 4.6 | 40 | 4.95 | 6.38 | ||
| 3.8 | 6.4 | 50 | 5.09 | 6.52 | ||
| 4 | 8.8 | 60 | 5.21 | 6.63 | ||
| 4.4 | 16.7 | 70 | 5.3 | 6.73 | ||
| 4.6 | 23.0 | 80 | 5.39 | 6.81 | ||
| 4.8 | 31.7 | 90 | 5.46 | 6.89 | ||
| 5 | 43.5 | 100 | 5.53 | 6.95 | ||
| 5.2 | 59.9 | 110 | 5.59 | 7.01 | ||
| 5.4 | 82.4 | 120 | 5.64 | 7.07 | ||
| 5.6 | 113.3 | 130 | 5.69 | 7.12 | ||
| 5.8 | 155.9 | 140 | 5.74 | 7.16 | ||
| 6 | 214.4 | 150 | 5.78 | 7.21 | ||
| 6.2 | 294.8 | 160 | 5.82 | 7.25 | ||
| 6.4 | 405.4 | 170 | 5.86 | 7.29 | ||
| 6.6 | 557.6 | 180 | 5.9 | 7.32 | ||
| 6.8 | 766.8 | 190 | 5.93 | 7.36 | ||
| 7.2 | 1450.1 | 200 | 5.96 | 7.39 | ||
| 7.4 | 1994.2 | 210 | 5.99 | 7.42 | ||
| 7.6 | 2742.4 | 220 | 6.02 | 7.45 | ||
| 7.7 | 3216.0 | 230 | 6.05 | 7.48 |
| Fault Name | Ms (Av) | SRL lr | WR | AR | Fault Name | Ms (Av) | SRL lr | WR | AR |
|---|---|---|---|---|---|---|---|---|---|
| Sangavar | 7.24 | 0.204 | 0.564 | 0.267 | Jagatai | 7.02 | 0.194 | 0.554 | 0.257 |
| Masuleh | 7.33 | 0.208 | 0.568 | 0.272 | F2 | 7.56 | 0.218 | 0.578 | 0.282 |
| F33 | 5.91 | 0.143 | 0.496 | 0.199 | Jajarm | 7.14 | 0.2 | 0.56 | 0.262 |
| Talesh | 7.86 | 0.231 | 0.59 | 0.296 | F36 | 7.31 | 0.207 | 0.567 | 0.27 |
| F33 | 6.58 | 0.174 | 0.533 | 0.234 | Rabat Garbil | 7.41 | 0.212 | 0.572 | 0.276 |
| Rudbar | 6.7 | 0.179 | 0.538 | 0.24 | Sfarayen | 6.75 | 0.182 | 0.541 | 0.243 |
| F32 | 6.77 | 0.183 | 0.542 | 0.244 | Sabzevar | 5.69 | 0.132 | 0.482 | 0.186 |
| Lahijan | 6.77 | 0.182 | 0.542 | 0.244 | Doruneh1 | 6.6 | 0.175 | 0.534 | 0.235 |
| F31 | 6.86 | 0.187 | 0.546 | 0.248 | Doruneh2 | 6.74 | 0.181 | 0.541 | 0.242 |
| North Rudbar | 7.36 | 0.209 | 0.57 | 0.273 | Torud | 7.23 | 0.203 | 0.564 | 0.267 |
| Bonan | 7.2 | 0.202 | 0.562 | 0.265 | F8 | 6.5 | 0.17 | 0.529 | 0.23 |
| Alamutrud | 7.47 | 0.214 | 0.574 | 0.278 | F9 | 7.02 | 0.194 | 0.554 | 0.257 |
| F21 | 6.34 | 0.163 | 0.52 | 0.222 | F10 | 6.7 | 0.179 | 0.539 | 0.24 |
| F22 | 6.78 | 0.183 | 0.543 | 0.244 | F11 | 7.14 | 0.199 | 0.56 | 0.262 |
| F23 | 5.95 | 0.144 | 0.498 | 0.201 | Ghachab | 6.75 | 0.182 | 0.541 | 0.243 |
| F24 | 6.36 | 0.163 | 0.521 | 0.222 | Pishva | 6.74 | 0.181 | 0.541 | 0.242 |
| North Ghazvin | 7.03 | 0.194 | 0.554 | 0.257 | Garmsar | 7.14 | 0.2 | 0.56 | 0.262 |
| Zanjan | 7.32 | 0.208 | 0.568 | 0.271 | Eyvanaki | 7.32 | 0.208 | 0.568 | 0.271 |
| F35 | 6.17 | 0.155 | 0.511 | 0.212 | Kahrizak | 6.84 | 0.186 | 0.546 | 0.247 |
| F34 | 6.47 | 0.169 | 0.527 | 0.228 | South Tehran | 6.44 | 0.167 | 0.525 | 0.227 |
| Soltanieh | 7.4 | 0.211 | 0.571 | 0.275 | Siah Kuh | 6.8 | 0.184 | 0.544 | 0.245 |
| F25 | 5.71 | 0.133 | 0.484 | 0.188 | F27 | 6.76 | 0.182 | 0.542 | 0.243 |
| Kandovan | 7.18 | 0.201 | 0.561 | 0.264 | Parandak | 6.77 | 0.183 | 0.542 | 0.244 |
| F19 | 7.2 | 0.202 | 0.562 | 0.265 | F28 | 6.85 | 0.186 | 0.546 | 0.248 |
| F14 | 6.03 | 0.148 | 0.503 | 0.205 | F29 | 5.83 | 0.139 | 0.491 | 0.194 |
| F15 | 6.01 | 0.147 | 0.502 | 0.204 | Kushk-e Nosrat | 7.4 | 0.211 | 0.571 | 0.275 |
| F16 | 6.19 | 0.156 | 0.512 | 0.214 | F29 | 6.59 | 0.174 | 0.533 | 0.235 |
| F17 | 6.01 | 0.147 | 0.502 | 0.204 | F30 | 6.89 | 0.188 | 0.548 | 0.25 |
| North Tehran | 7.69 | 0.224 | 0.583 | 0.288 | Indes | 6.55 | 0.173 | 0.531 | 0.233 |
| Taleghan | 6.99 | 0.192 | 0.552 | 0.255 | South Parandak | 7.34 | 0.208 | 0.569 | 0.272 |
| North Alborz | 8.23 | 0.247 | 0.604 | 0.313 | North Parandak | 7.19 | 0.201 | 0.562 | 0.265 |
| Gorgan | 7.2 | 0.202 | 0.562 | 0.265 | Eshtehard | 7.12 | 0.199 | 0.559 | 0.262 |
| Khazar | 7.99 | 0.237 | 0.595 | 0.303 | Ipak | 6.98 | 0.192 | 0.552 | 0.254 |
| F13 | 7.2 | 0.202 | 0.562 | 0.265 | F12 | 6.85 | 0.186 | 0.546 | 0.248 |
| F7 | 7.32 | 0.207 | 0.567 | 0.271 | F26 | 6.04 | 0.149 | 0.503 | 0.205 |
| F5 | 7.64 | 0.222 | 0.581 | 0.286 | Bozgush | 7.11 | 0.198 | 0.558 | 0.261 |
| Damghan | 7.19 | 0.202 | 0.562 | 0.265 | Mosha | 7.82 | 0.229 | 0.588 | 0.294 |
| Astaneh | 7.05 | 0.196 | 0.556 | 0.258 | F18 | 5.96 | 0.145 | 0.499 | 0.201 |
| F4 | 6.98 | 0.192 | 0.552 | 0.254 | Meyamey | 7.48 | 0.214 | 0.575 | 0.279 |
| Semnan | 6.58 | 0.174 | 0.533 | 0.234 | F1 | 6.73 | 0.181 | 0.54 | 0.242 |
| F6 | 7 | 0.193 | 0.553 | 0.255 | Shavar | 6.77 | 0.182 | 0.542 | 0.244 |
| F3 | 6.97 | 0.192 | 0.552 | 0.254 | Kushk-e Nosrat North | 7.44 | 0.213 | 0.573 | 0.277 |
| Atary | 7.61 | 0.22 | 0.58 | 0.285 | F20 | 7.21 | 0.203 | 0.563 | 0.266 |
| Fault Name | Fault Length (km) | DT (km) | Ms (Av) | PGA (Av) | Fault Name | Fault Length (km) | DT (km) | Ms (Av) | PGA (Av) |
|---|---|---|---|---|---|---|---|---|---|
| Sangavar | 81 | 359/2 | 7/2 | 0/0132 | F2 | 152 | 365/9 | 7/6 | 0/0133 |
| Masuleh | 105 | 252/7 | 7/3 | 0/0204 | Jajarm | 78 | 434/5 | 7/1 | 0/0104 |
| F33 | 10 | 251/7 | 5/9 | 0/0246 | Sfarayen | 40 | 511/8 | 6/7 | 0/0086 |
| Talesh | 250 | 250/7 | 7/9 | 0/0222 | Sabzevar | 7 | 497/9 | 5/7 | 0/0110 |
| F33 | 30 | 219/4 | 6/6 | 0/0253 | Doruneh1 | 31 | 481/1 | 6/6 | 0/0094 |
| Rudbar | 37 | 178/3 | 6/7 | 0/0321 | Doruneh2 | 35 | 476/5 | 6/7 | 0/0094 |
| F32 | 42 | 190/4 | 6/8 | 0/0293 | Torud | 80 | 240/6 | 7/2 | 0/0215 |
| Lahijan | 42 | 217/3 | 6/8 | 0/0249 | F8 | 23 | 279/6 | 6/5 | 0/0189 |
| F31 | 45 | 195/7 | 6/9 | 0/0281 | F9 | 64 | 276/8 | 7/0 | 0/0182 |
| North Rudbar | 100 | 161/8 | 7/4 | 0/0348 | F10 | 33 | 348/1 | 6/7 | 0/0140 |
| Bonan | 76 | 111/8 | 7/2 | 0/0535 | F11 | 69 | 336/3 | 7/1 | 0/0143 |
| Alamutrud | 133 | 77/9 | 7/5 | 0/0800 | Ghachab | 40 | 158/3 | 6/7 | 0/0368 |
| F21 | 19 | 118/5 | 6/3 | 0/0556 | Pishva | 35 | 50/2 | 6/7 | 0/1326 |
| F22 | 37 | 84/9 | 6/8 | 0/0756 | Garmsar | 70 | 64/9 | 7/1 | 0/0978 |
| F23 | 10 | 105/0 | 5/9 | 0/0702 | Eyvanaki | 94 | 8/9 | 7/3 | 0/4400 |
| F24 | 21 | 111/2 | 6/4 | 0/0597 | Kahrizak | 42 | 21/0 | 6/8 | 0/2789 |
| North Ghazvin | 64 | 128/7 | 7/0 | 0/0458 | South Tehran | 21 | 14/0 | 6/4 | 0/3863 |
| Zanjan | 104 | 195/7 | 7/3 | 0/0277 | Siah Kuh | 38 | 62/0 | 6/8 | 0/1059 |
| F35 | 15 | 192/5 | 6/2 | 0/0322 | F27 | 41 | 147/4 | 6/8 | 0/0400 |
| F34 | 25 | 170/2 | 6/5 | 0/0352 | Parandak | 42 | 111/0 | 6/8 | 0/0557 |
| Soltanieh | 116 | 215/9 | 7/4 | 0/0247 | F28 | 46 | 189/7 | 6/8 | 0/0292 |
| F25 | 6 | 111/2 | 5/7 | 0/0701 | F29 | 7 | 185/3 | 5/8 | 0/0368 |
| Kandovan | 81 | 50/6 | 7/2 | 0/1261 | Kushk-e Nosrat | 116 | 104/6 | 7/4 | 0/0577 |
| F19 | 76 | 74/4 | 7/2 | 0/0843 | F29 | 31 | 151/3 | 6/6 | 0/0397 |
| F14 | 12 | 7/3 | 6/0 | 0/5723 | F30 | 49 | 176/1 | 6/9 | 0/0318 |
| F15 | 12 | 12/1 | 6/0 | 0/4561 | Indes | 27 | 150/2 | 6/6 | 0/0403 |
| F16 | 16 | 14/7 | 6/2 | 0/3927 | South Parandak | 107 | 78/0 | 7/3 | 0/0798 |
| F17 | 12 | 8/6 | 6/0 | 0/5364 | North Parandak | 74 | 95/6 | 7/2 | 0/0639 |
| North Tehran | 176 | 11/2 | 7/7 | 0/3878 | Eshtehard | 67 | 50/2 | 7/1 | 0/1274 |
| Taleghan | 59 | 51/9 | 7/0 | 0/1247 | Ipak | 52 | 75/9 | 7/0 | 0/0837 |
| North Alborz | 463 | 87/2 | 8/2 | 0/0785 | F12 | 43 | 443/9 | 6/9 | 0/0102 |
| Gorgan | 85 | 268/1 | 7/2 | 0/0189 | F26 | 10 | 131/1 | 6/0 | 0/0529 |
| Khazar | 314 | 99/2 | 8/0 | 0/0652 | Bozgush | 73 | 398/2 | 7/1 | 0/0116 |
| F13 | 85 | 94/8 | 7/2 | 0/0645 | Mosha | 235 | 22/4 | 7/8 | 0/2535 |
| F7 | 102 | 237/2 | 7/3 | 0/0220 | F18 | 11 | 13/8 | 6/0 | 0/4275 |
| F5 | 176 | 139/3 | 7/6 | 0/0423 | Meyamey | 136 | 316/0 | 7/5 | 0/0157 |
| Damghan | 83 | 224/4 | 7/2 | 0/0234 | F1 | 38 | 324/1 | 6/7 | 0/0153 |
| Astaneh | 66 | 243/7 | 7/1 | 0/0212 | Shavar | 42 | 284/6 | 6/8 | 0/0179 |
| F4 | 53 | 314/2 | 7/0 | 0/0156 | Kushk-e Nosrat North | 127 | 91/4 | 7/4 | 0/0672 |
| Semnan | 26 | 220/9 | 6/6 | 0/0251 | Atary | 165 | 134/1 | 7/6 | 0/0440 |
| F6 | 60 | 223/6 | 7/0 | 0/0236 | F20 | 78 | 29/2 | 7/2 | 0/2083 |
| F3 | 57 | 418/3 | 7/0 | 0/0109 | Jagatai | 64 | 445/7 | 7/0 | 0/0101 |
| Fault Name | Fault Length (KM) | Mechanism | Dip | cos (Dip) | Vertical Movement (mm/y) | Horizontal Movement (mm/y) | Average Geological Moment |
|---|---|---|---|---|---|---|---|
| Khazar | 550 | T | 35 | −0.904 | 2.5 | 3.05 | 1.00239 × 10¹⁸ |
| North Alborz | 350 | T | 50 | 0.965 | 1 | 1.5 | 2.93793 × 10¹⁷ |
| Kashachal | 190 | SS | 80 | −0.110 | 1 | 1 | 9.29455 × 10¹⁷ |
| Kandovan | 85 | SS | 50 | 0.965 | 1 | 1 | 4.75664 × 10¹⁶ |
| Taleqan | 90 | N | 55 | 0.022 | 1.3 | 2.85537 × 10¹⁸ | |
| Mosha-S | 50 | SS | 70 | 0.633 | 2.3 | 2.3 | 9.80548 × 10¹⁶ |
| Apic | 95 | T | 45 | 0.525 | 1 | 1.4 | 1.36716 × 10¹⁷ |
| North Tehran | 125 | T | 45 | 0.525 | 0.7–1.0 | 1.4 | 1.7989 × 10¹⁷ |
| Mosha | 70 | SS | 70 | 0.633 | 2.3 | 2.3 | 1.37277 × 10¹⁷ |
| Firuz Kuh | 45 | SS | 70 | 0.633 | 2.3 | 8.82493 × 10¹⁶ | |
| Chashm | 35 | SS-T | 70 | 0.633 | 2.3 | 6.86384 × 10¹⁶ | |
| Astaneh | 60 | SS | 90 | −0.448 | 2.3 | 2.3 | 1.66312 × 10¹⁷ |
| Shahrud | 100 | SS-T | 45 | 0.525 | 1.3–2.3 | 3.2 | 3.28941 × 10¹⁷ |
| Bastam | 110 | SS-T | 45 | 0.525 | 1.0–4.0 | 1.4 | 1.58303 × 10¹⁷ |
| Maraveh Tappeh | 250 | T | 45 | 0.525 | 1 | 1.4 | 3.59779 × 10¹⁷ |
| Takal Kuh | 125 | T | 45 | 0.525 | 1.5 | 2.1 | 2.69835 × 10¹⁷ |
| Kurkhud | 135 | SS-T | 70 | 0.633 | 0.75 | 1 | 1.15108 × 10¹⁷ |
| Shoqa | 150 | SS-T | 70 | 0.633 | 1 | 1.5 | 1.91846 × 10¹⁷ |
| Jajarm | 120 | SS-T | 80 | −0.110 | 0.75 | 1 | 5.87024 × 10¹⁷ |
| Eshqabad | 230 | SS | 80 | −0.110 | 5.0–8.0 | 5 | 5.62565 × 10¹⁸ |
| C. Eshkabad | 80 | T-SS | 70 | 0.633 | 2 | 5 | 3.4106 × 10¹⁷ |
| N. Kopehdagh | 315 | T | 45 | 0.525 | 1 | 1.4 | 4.53322 × 10¹⁷ |
| Baghan-Garmab | 155 | RS | 90 | −0.448 | 4 | 4 | 7.47199 × 10¹⁷ |
| Shirvan | 90 | RS | 90 | −0.448 | 2 | 2 | 2.16929 × 10¹⁷ |
| Naveh | 90 | RS | 90 | −0.448 | 1 | 1 | 1.08464 × 10¹⁷ |
| Gareh Dagh-Khademan | 130 | RS | 90 | −0.448 | 1.3 | 1.3 | 2.03672 × 10¹⁷ |
| Kashafrud | 165 | RS-T | 80 | −0.110 | 1 | 1 | 8.07158 × 10¹⁷ |
| Amrudak | 150 | RS | 90 | −0.448 | 1.4 | 1.4 | 2.53083 × 10¹⁷ |
| Eshtehard | 190 | T | 50 | 0.965 | 1 | 1.5 | 1.59487 × 10¹⁷ |
| Kushk-e Nosrat | 250 | T | 45 | 0.525 | 1 | 1.4 | 3.59779 × 10¹⁷ |
| Indes | 145 | T | 45 | 0.525 | 1 | 1.4 | 2.08672 × 10¹⁷ |
| Qom | 140 | T-RS | 45 | 0.525 | 1 | 1.4 | 2.01476 × 10¹⁷ |
| Robatkarim-Siahkuh | 180 | T-RS | 60 | −0.952 | 1 | 1.5 | 1.53085 × 10¹⁷ |
| Kahrizak-Garmasar | 190 | T | 45 | 0.525 | 1 | 1.4 | 2.73432 × 10¹⁷ |
| N. Semnan-Atari | 90 | SS-T | 80 | −0.110 | 1 | 1 | 4.40268 × 10¹⁷ |
| Torud | 50 | SS | 80 | −0.110 | 0.5 | 0.5 | 1.22297 × 10¹⁷ |
| Dochah | 65 | SS | 90 | −0.448 | 0.5 | 0.5 | 3.91677 × 10¹⁶ |
| Mayamey | 175 | SS | 80 | −0.110 | 2.5 | 2.5 | 2.14019 × 10¹⁸ |
| N-Sabzevar | 130 | T | 45 | 0.525 | 2.5 | 3.5 | 4.67713 × 10¹⁷ |
| Samghan | 130 | SS-T | 90 | −0.448 | 0.5 | 0.5 | 7.83353 × 10¹⁶ |
| Rivand | 150 | T | 45 | 0.525 | 0.5 | 0.7 | 1.07934 × 10¹⁷ |
| Esfarayen | 125 | T | 45 | 0.525 | 0.6 | 0.8 | 1.02794 × 10¹⁷ |
| Doruneh | 700 | SS | 85 | −0.984 | 1.5–2.5 | 2.5 | 9.59998 × 10¹⁷ |
Disclaimer/Publisher’s Note: The statements, opinions and data contained in all publications are solely those of the individual author(s) and contributor(s) and not of MDPI and/or the editor(s). MDPI and/or the editor(s) disclaim responsibility for any injury to people or property resulting from any ideas, methods, instructions or products referred to in the content. |
© 2023 by the authors. Licensee MDPI, Basel, Switzerland. This article is an open access article distributed under the terms and conditions of the Creative Commons Attribution (CC BY) license (https://creativecommons.org/licenses/by/4.0/).
Share and Cite
Mohammadi Nia, A.; Rashidi, A.; Khatib, M.M.; Mousavi, S.M.; Nemati, M.; Shafieibafti, S.; Derakhshani, R. Seismic Risk in Alborz: Insights from Geological Moment Rate Estimation and Fault Activity Analysis. Appl. Sci. 2023, 13, 6236. https://doi.org/10.3390/app13106236
Mohammadi Nia A, Rashidi A, Khatib MM, Mousavi SM, Nemati M, Shafieibafti S, Derakhshani R. Seismic Risk in Alborz: Insights from Geological Moment Rate Estimation and Fault Activity Analysis. Applied Sciences. 2023; 13(10):6236. https://doi.org/10.3390/app13106236
Chicago/Turabian StyleMohammadi Nia, Ali, Ahmad Rashidi, Mohammad Mahdi Khatib, Seyed Morteza Mousavi, Majid Nemati, Shahram Shafieibafti, and Reza Derakhshani. 2023. "Seismic Risk in Alborz: Insights from Geological Moment Rate Estimation and Fault Activity Analysis" Applied Sciences 13, no. 10: 6236. https://doi.org/10.3390/app13106236