
A New Stochastic Model for the Aedes aegypti Life Cycle and the Dengue Virus Transmission


Abstract
:1. Introduction
2. Materials and Methods
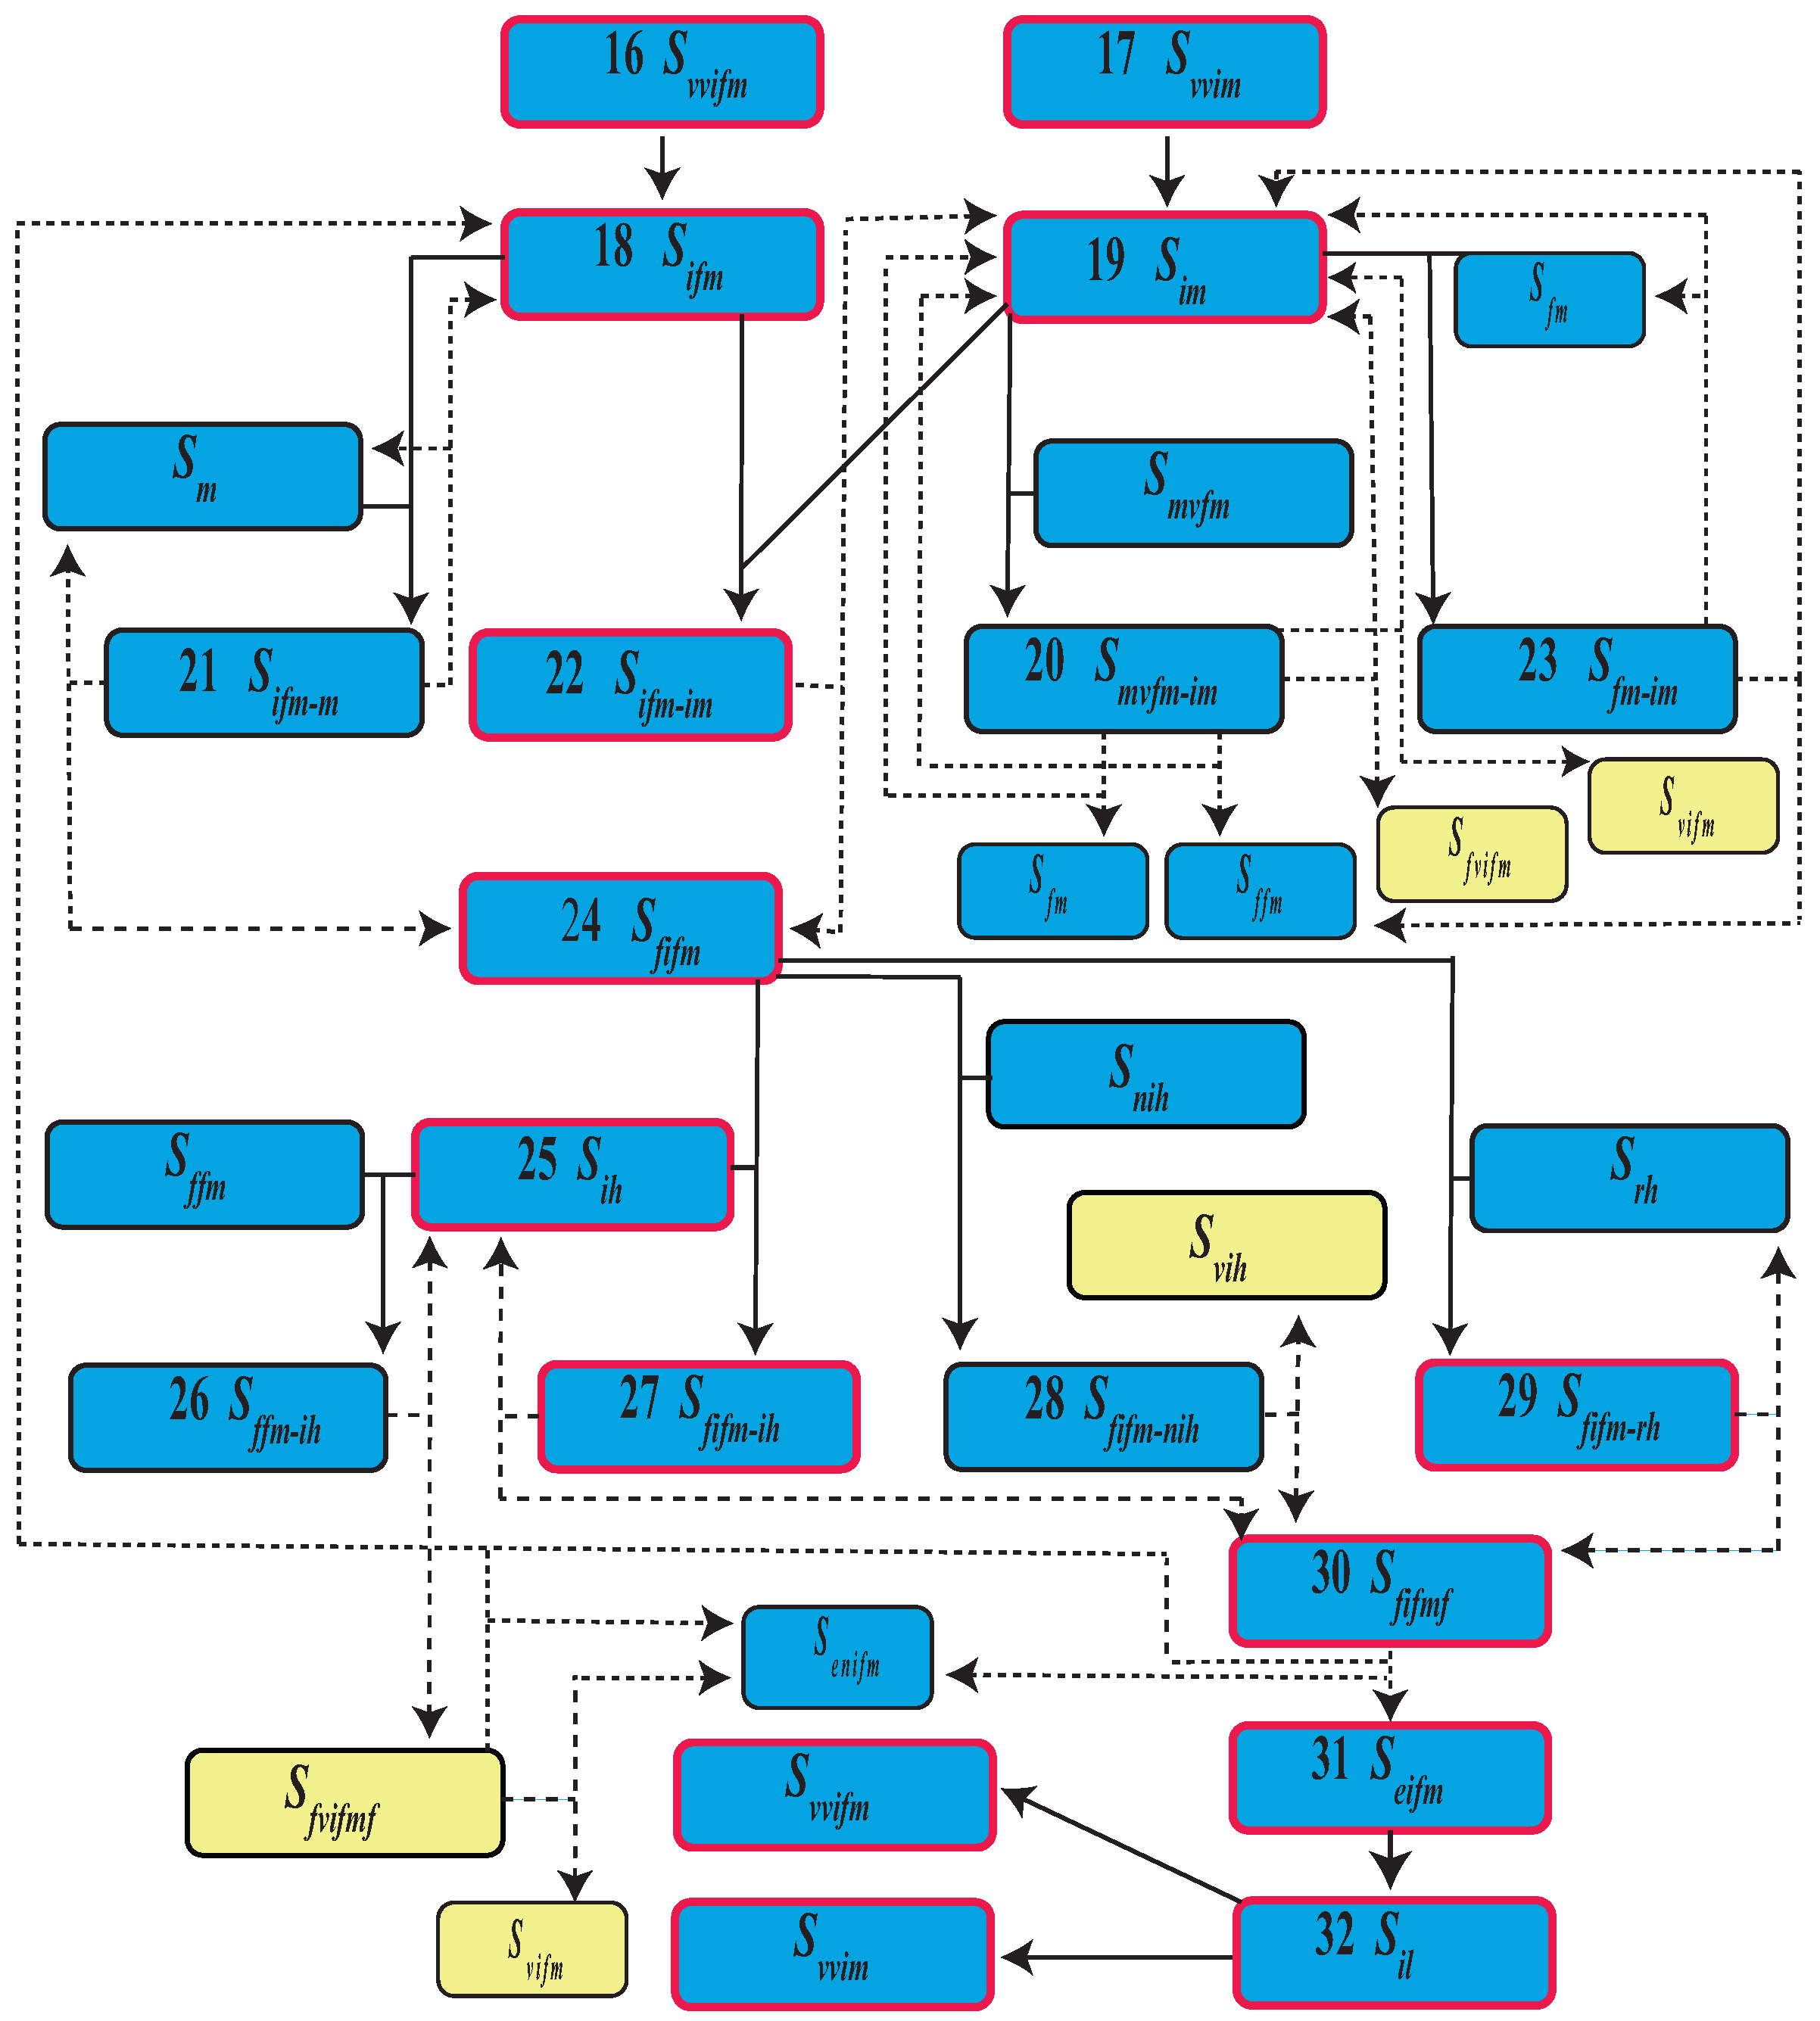
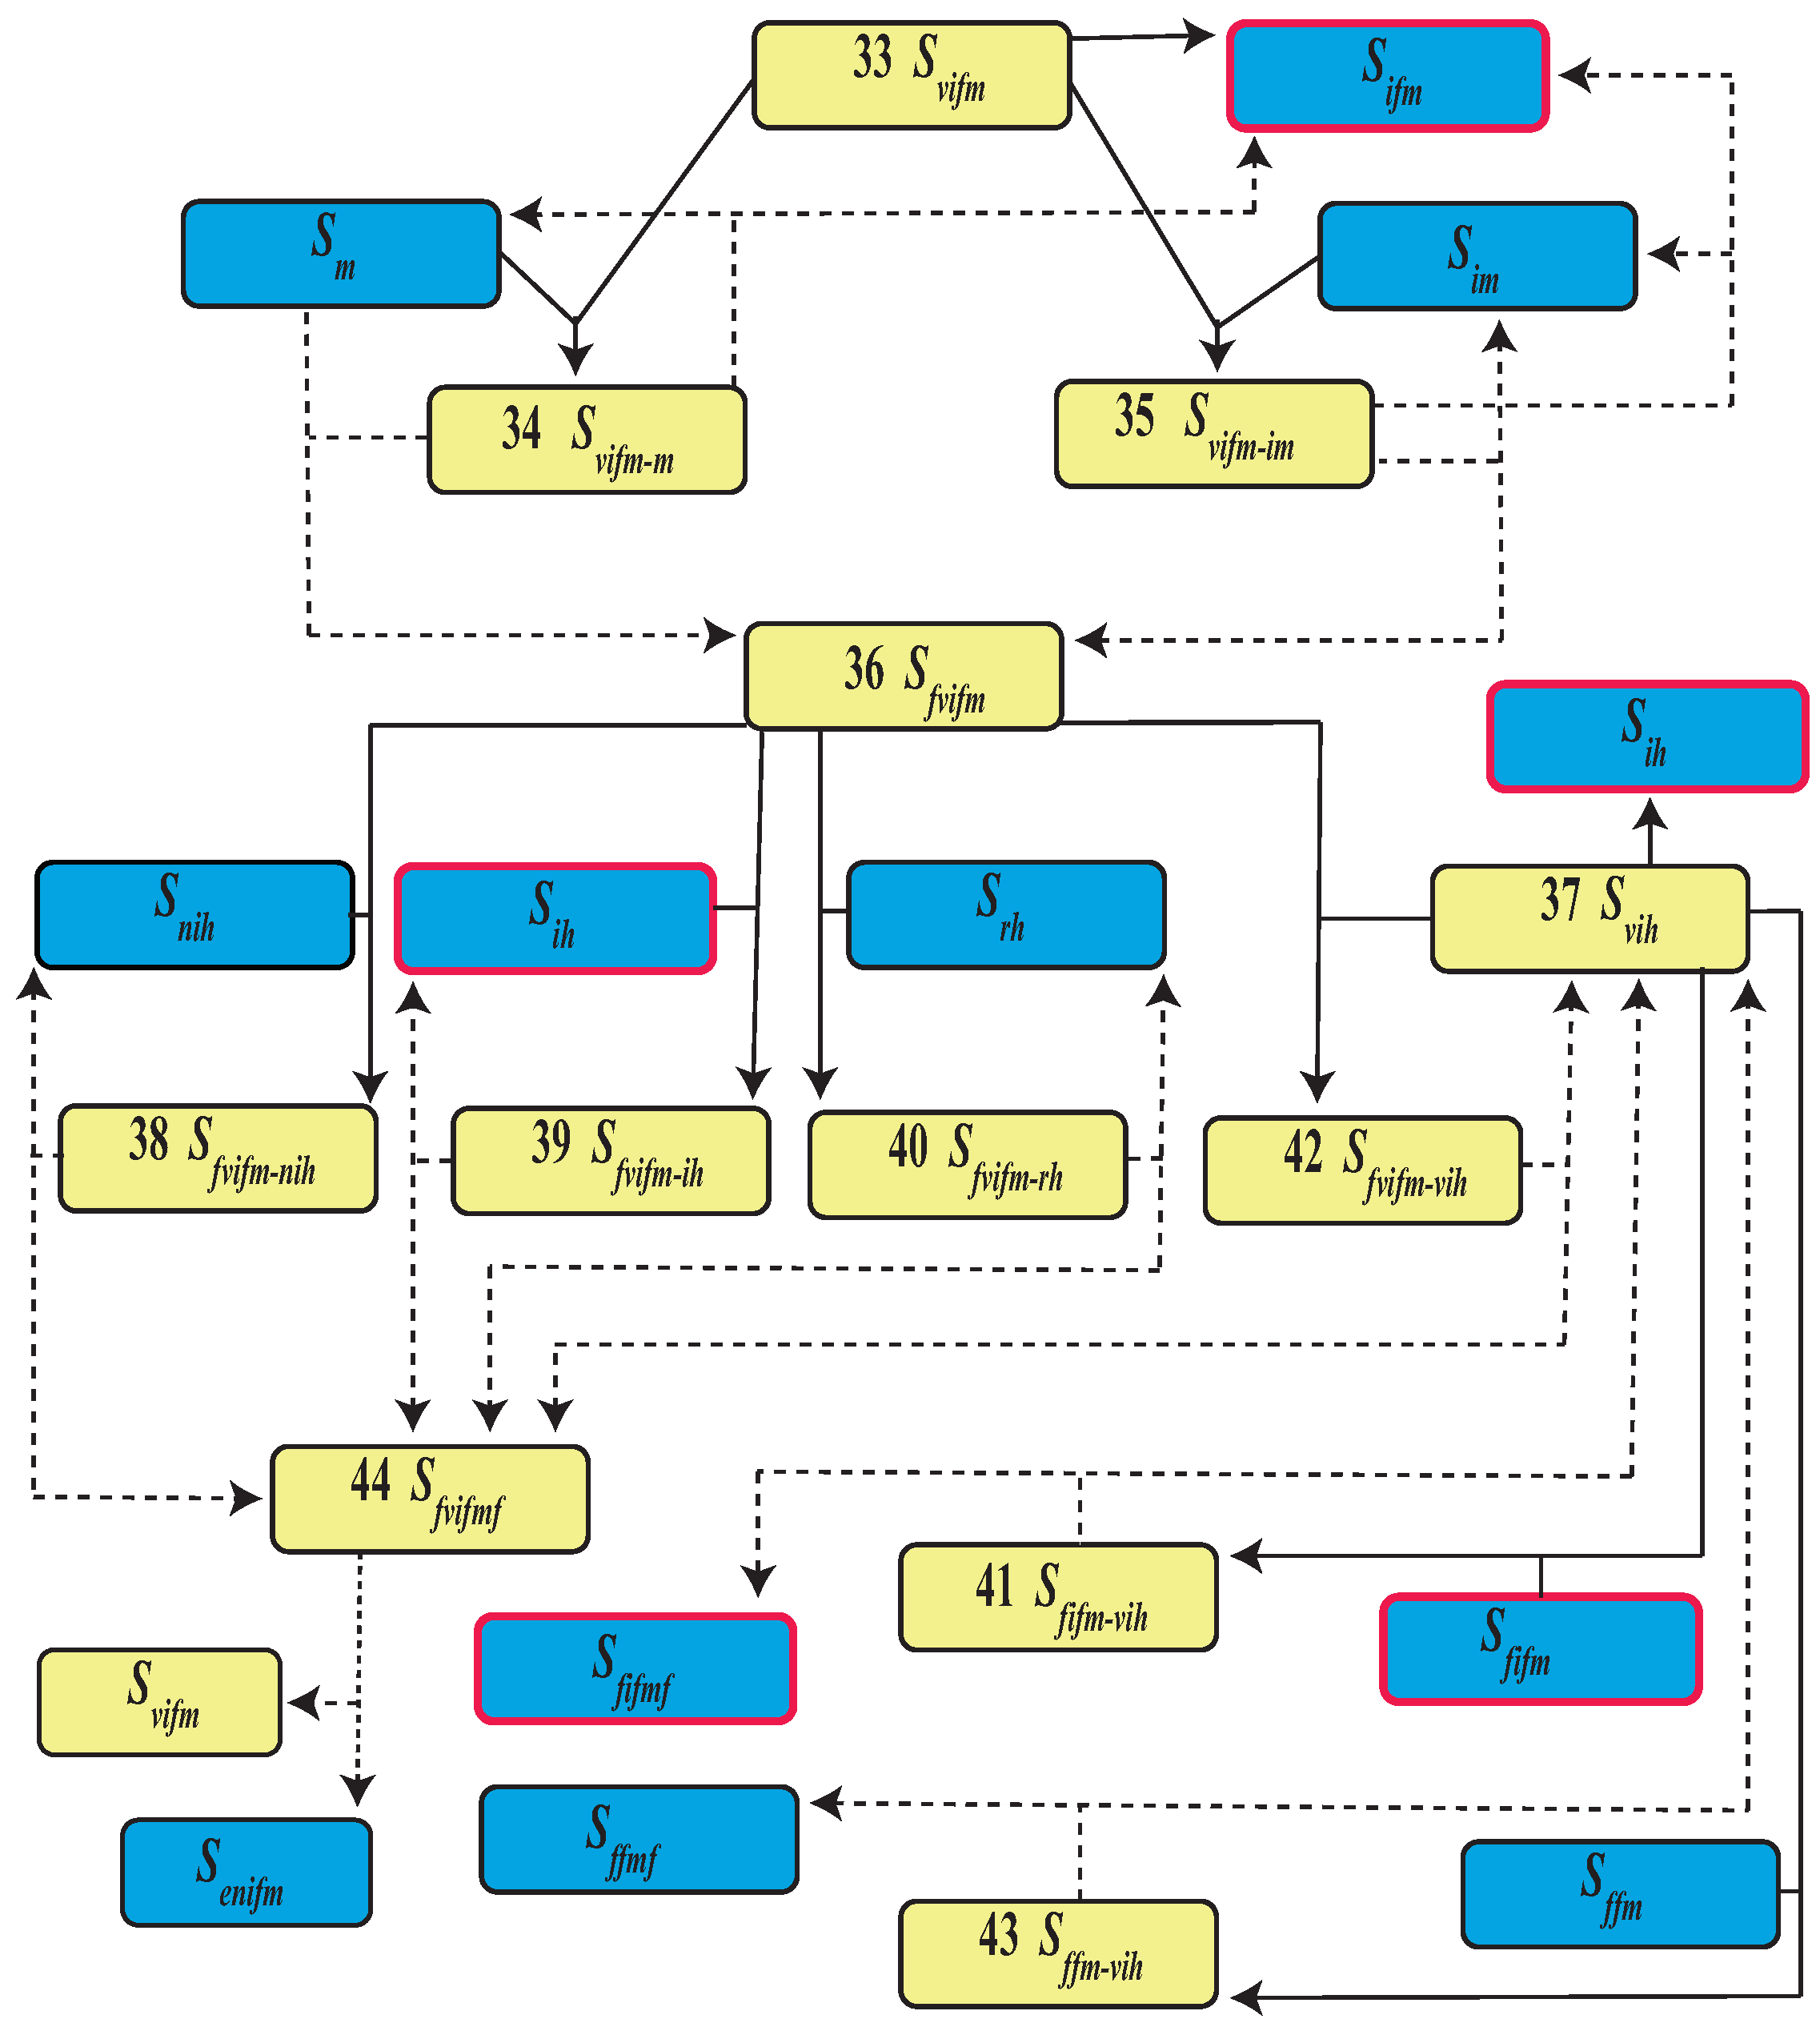
2.1. Mathematical Model
- Calculate the transition rates and their sum (denoted by ).
- Calculate two random numbers ( and ) and calculate the time and the j index of the next event:j must satisfy:
- Update the time and the system state by making the j-th event occur.
- Iterate from step 2 or finish the simulation.

| Parameter | Representation | Value (1/Day) | Reference |
|---|---|---|---|
| Transition to sexual maturity | [33] | ||
| Copulation | [34] | ||
| Decoupling | [14] | ||
| Bite | [19] | ||
| 1/Blood sucking time | [35] | ||
| Oviposition | [20] | ||
| Egg to larva | [36] | ||
| Egg mortality | [37] | ||
| Mosquitoes natural mortality | [15] | ||
| Larva density mortality | [20] | ||
| Transition to being infectious | [38] | ||
| Recovery human | [37] | ||
| Population human growth | 2.1%/year | [39] | |
| Mosquitoes fumigate mortality | [40] | ||
| Fraction of Breeding Sites |
| Probability | Representation | Value | Reference |
|---|---|---|---|
| Probability of being female | [30] | ||
| Probability of being male | [30] | ||
| Infective biting probability | [41] | ||
| Probability of being impregnated | [14] | ||
| Probability of virus dissemination (VT) | [28] | ||
| Probability of virus venereal transmission (VNT) | [28] |
2.2. Parameters
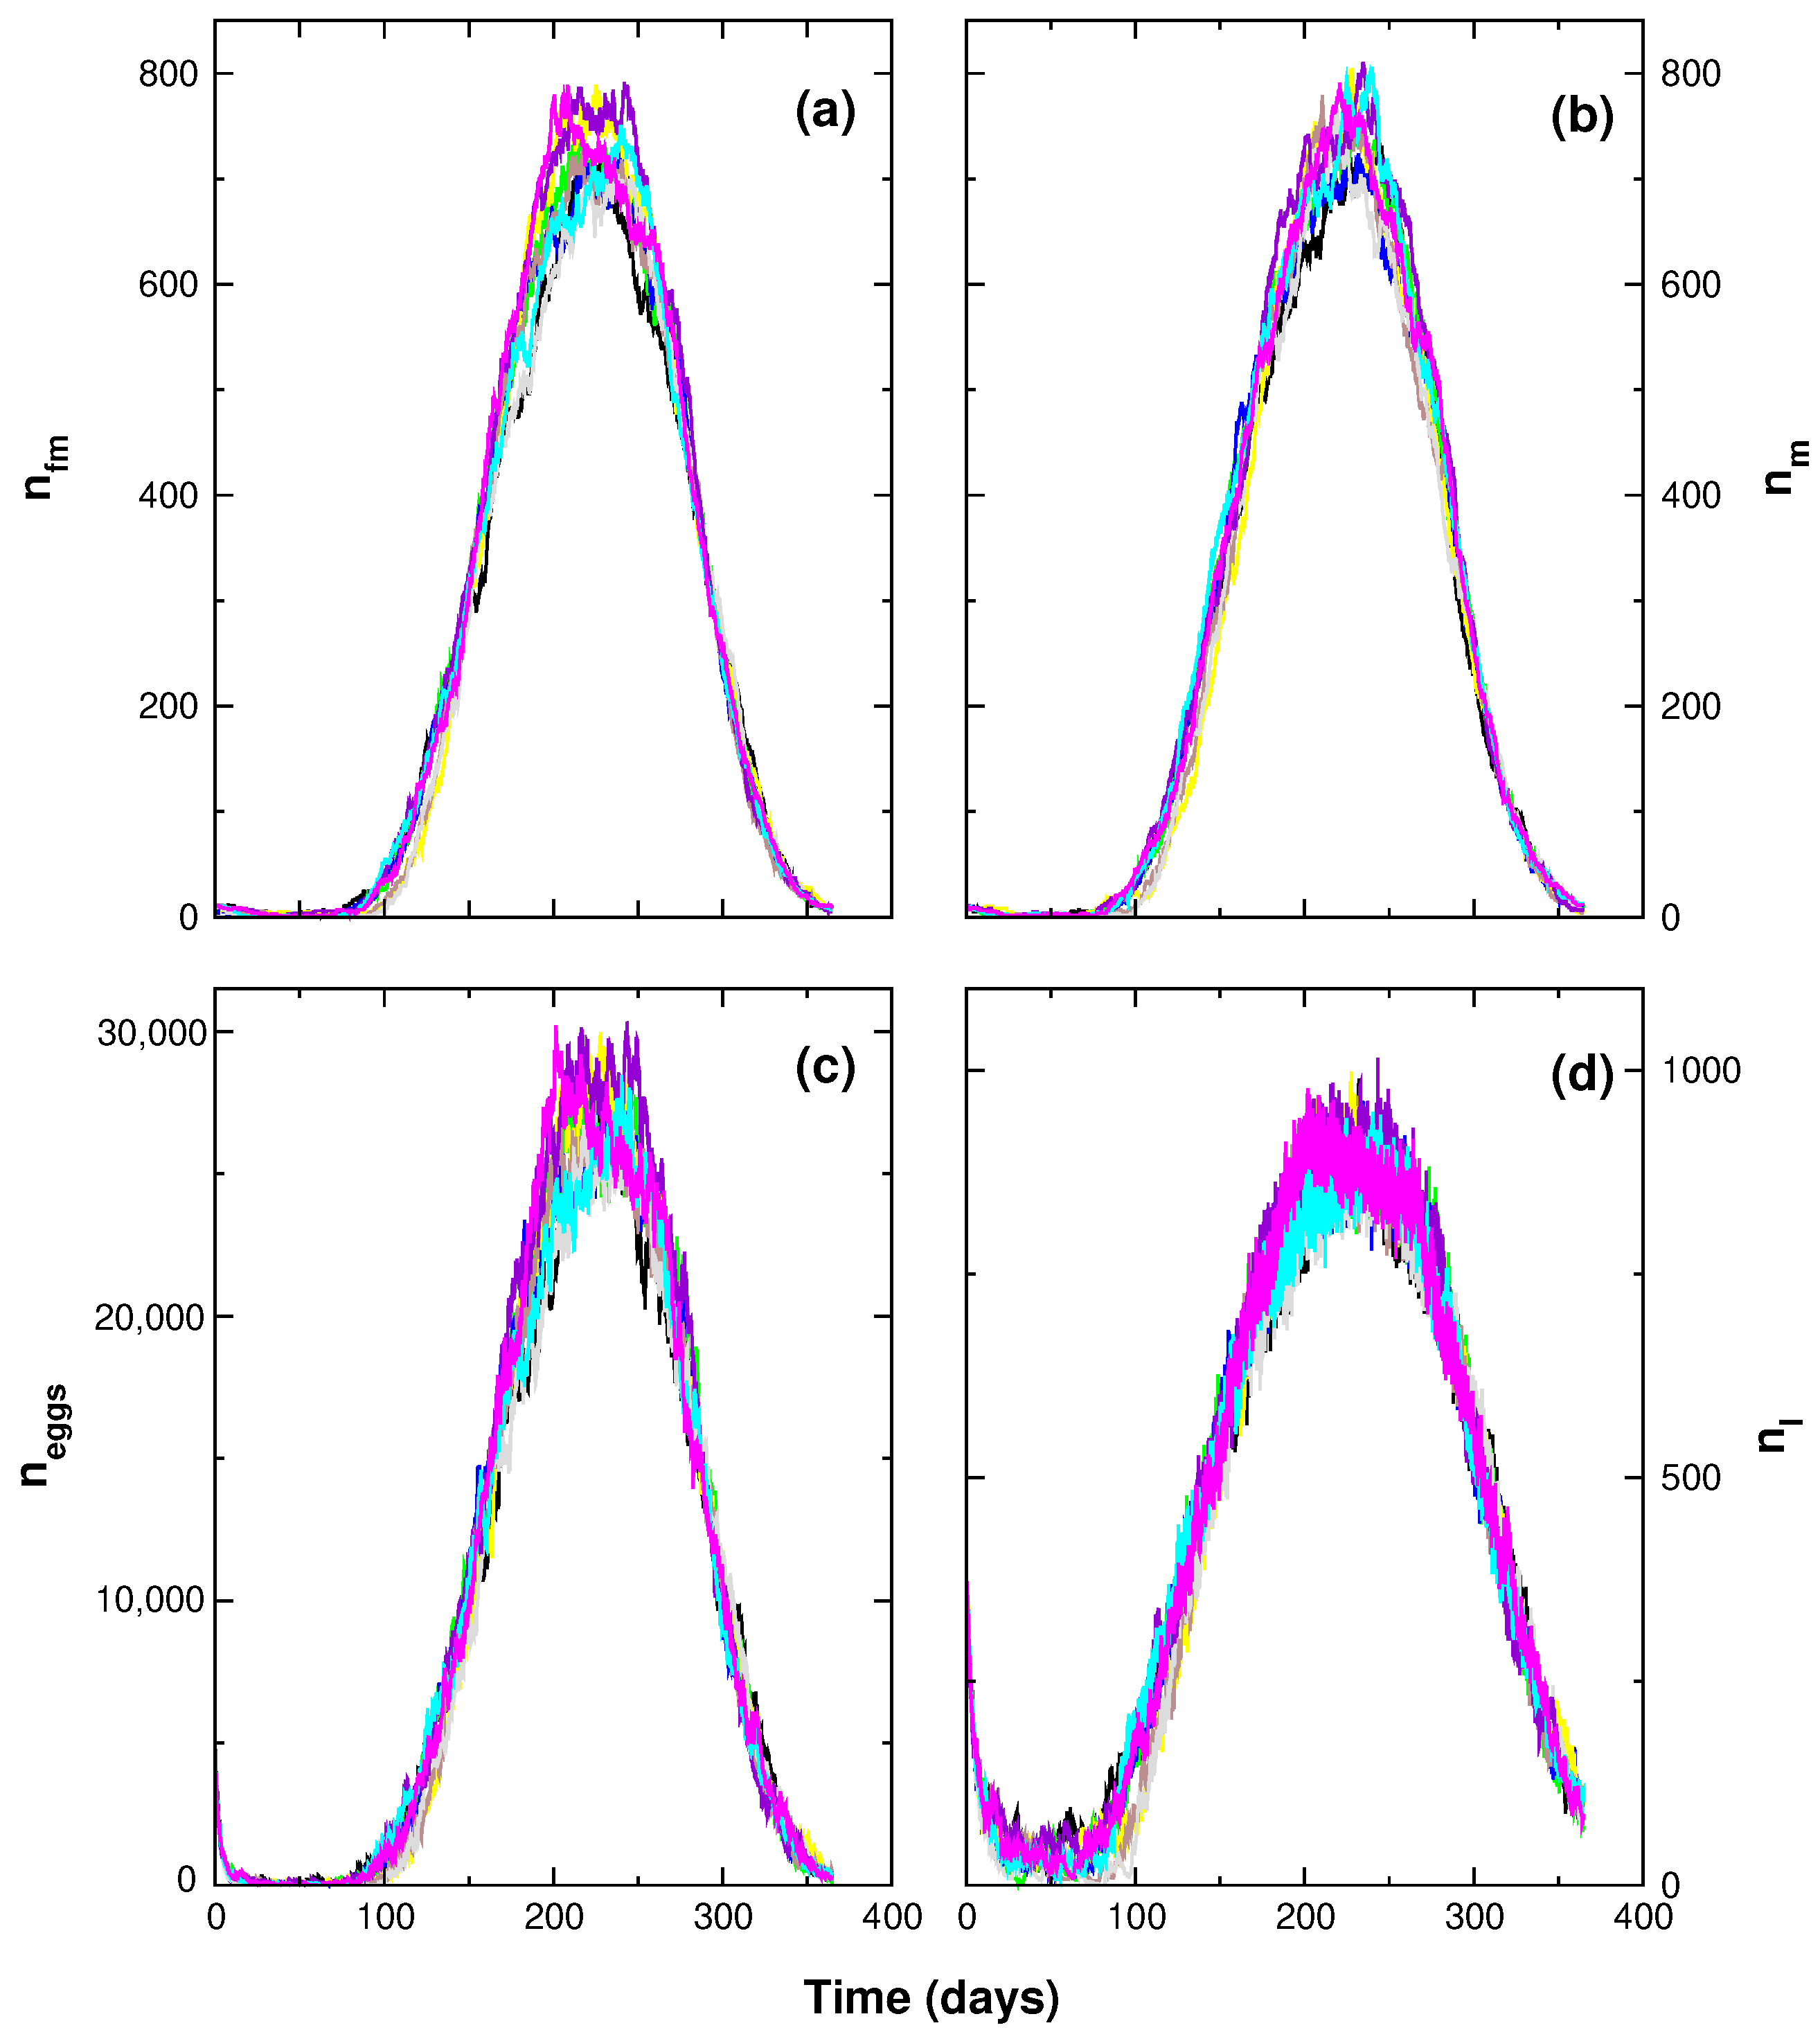
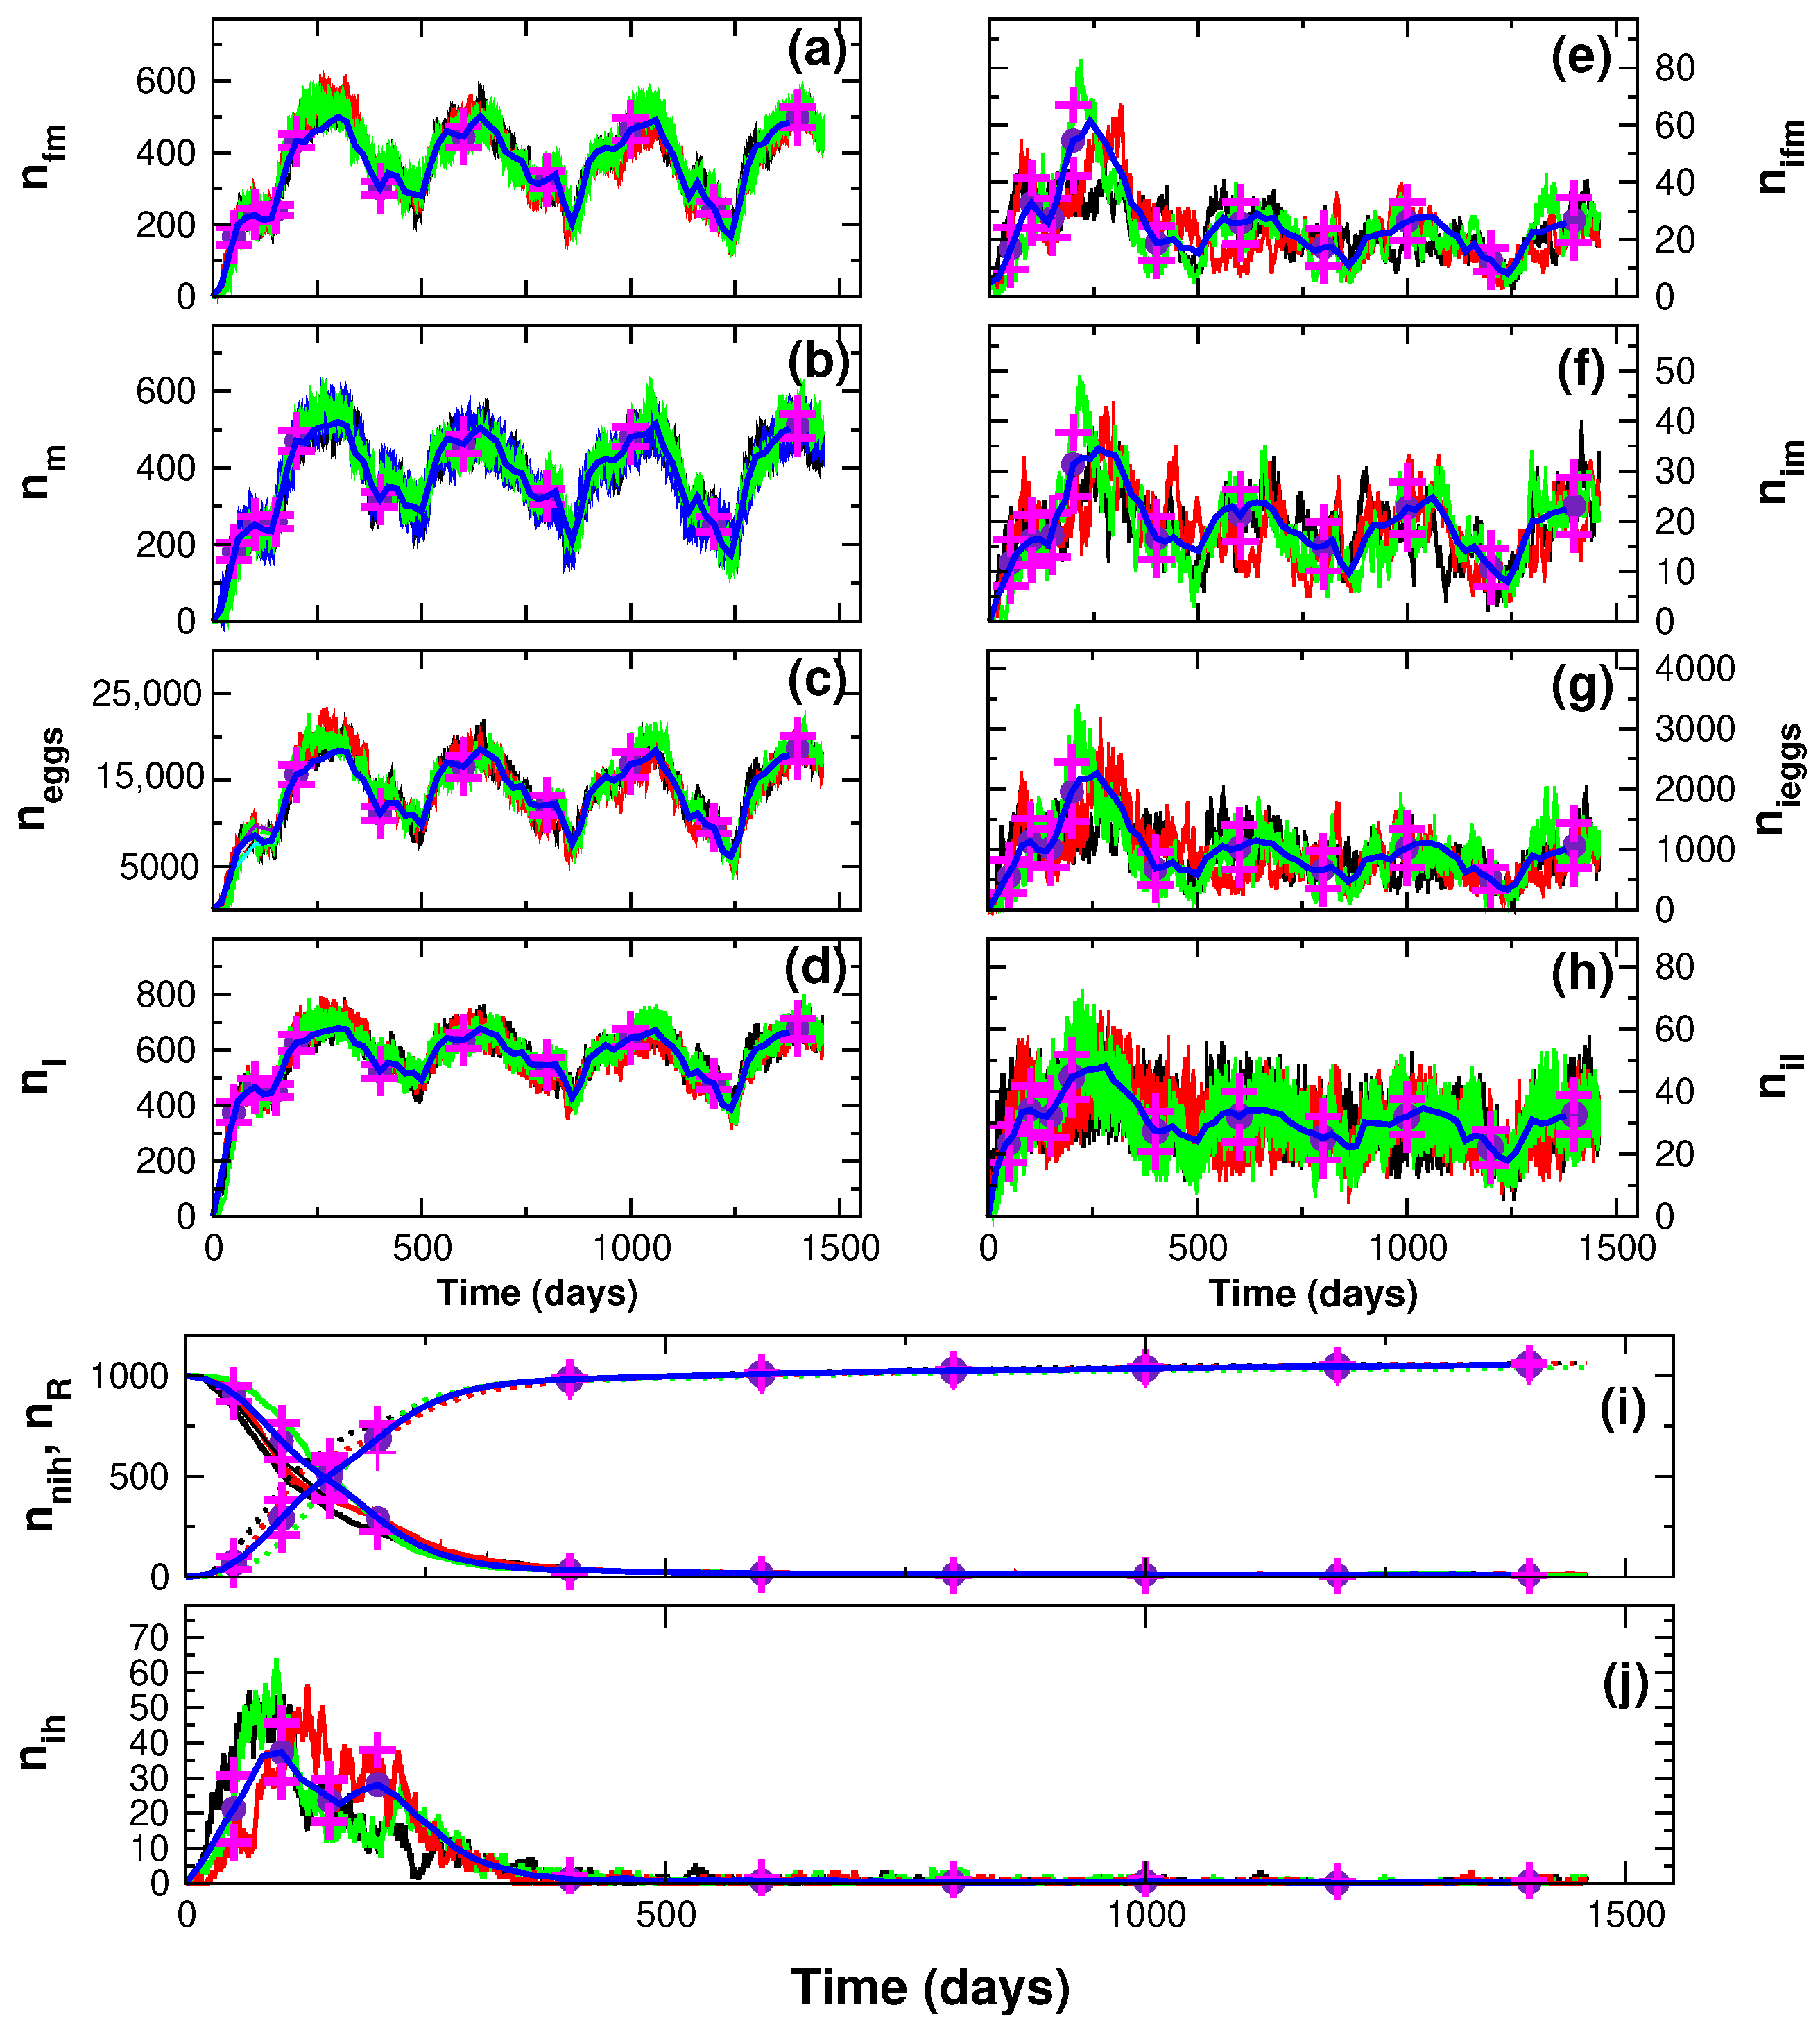
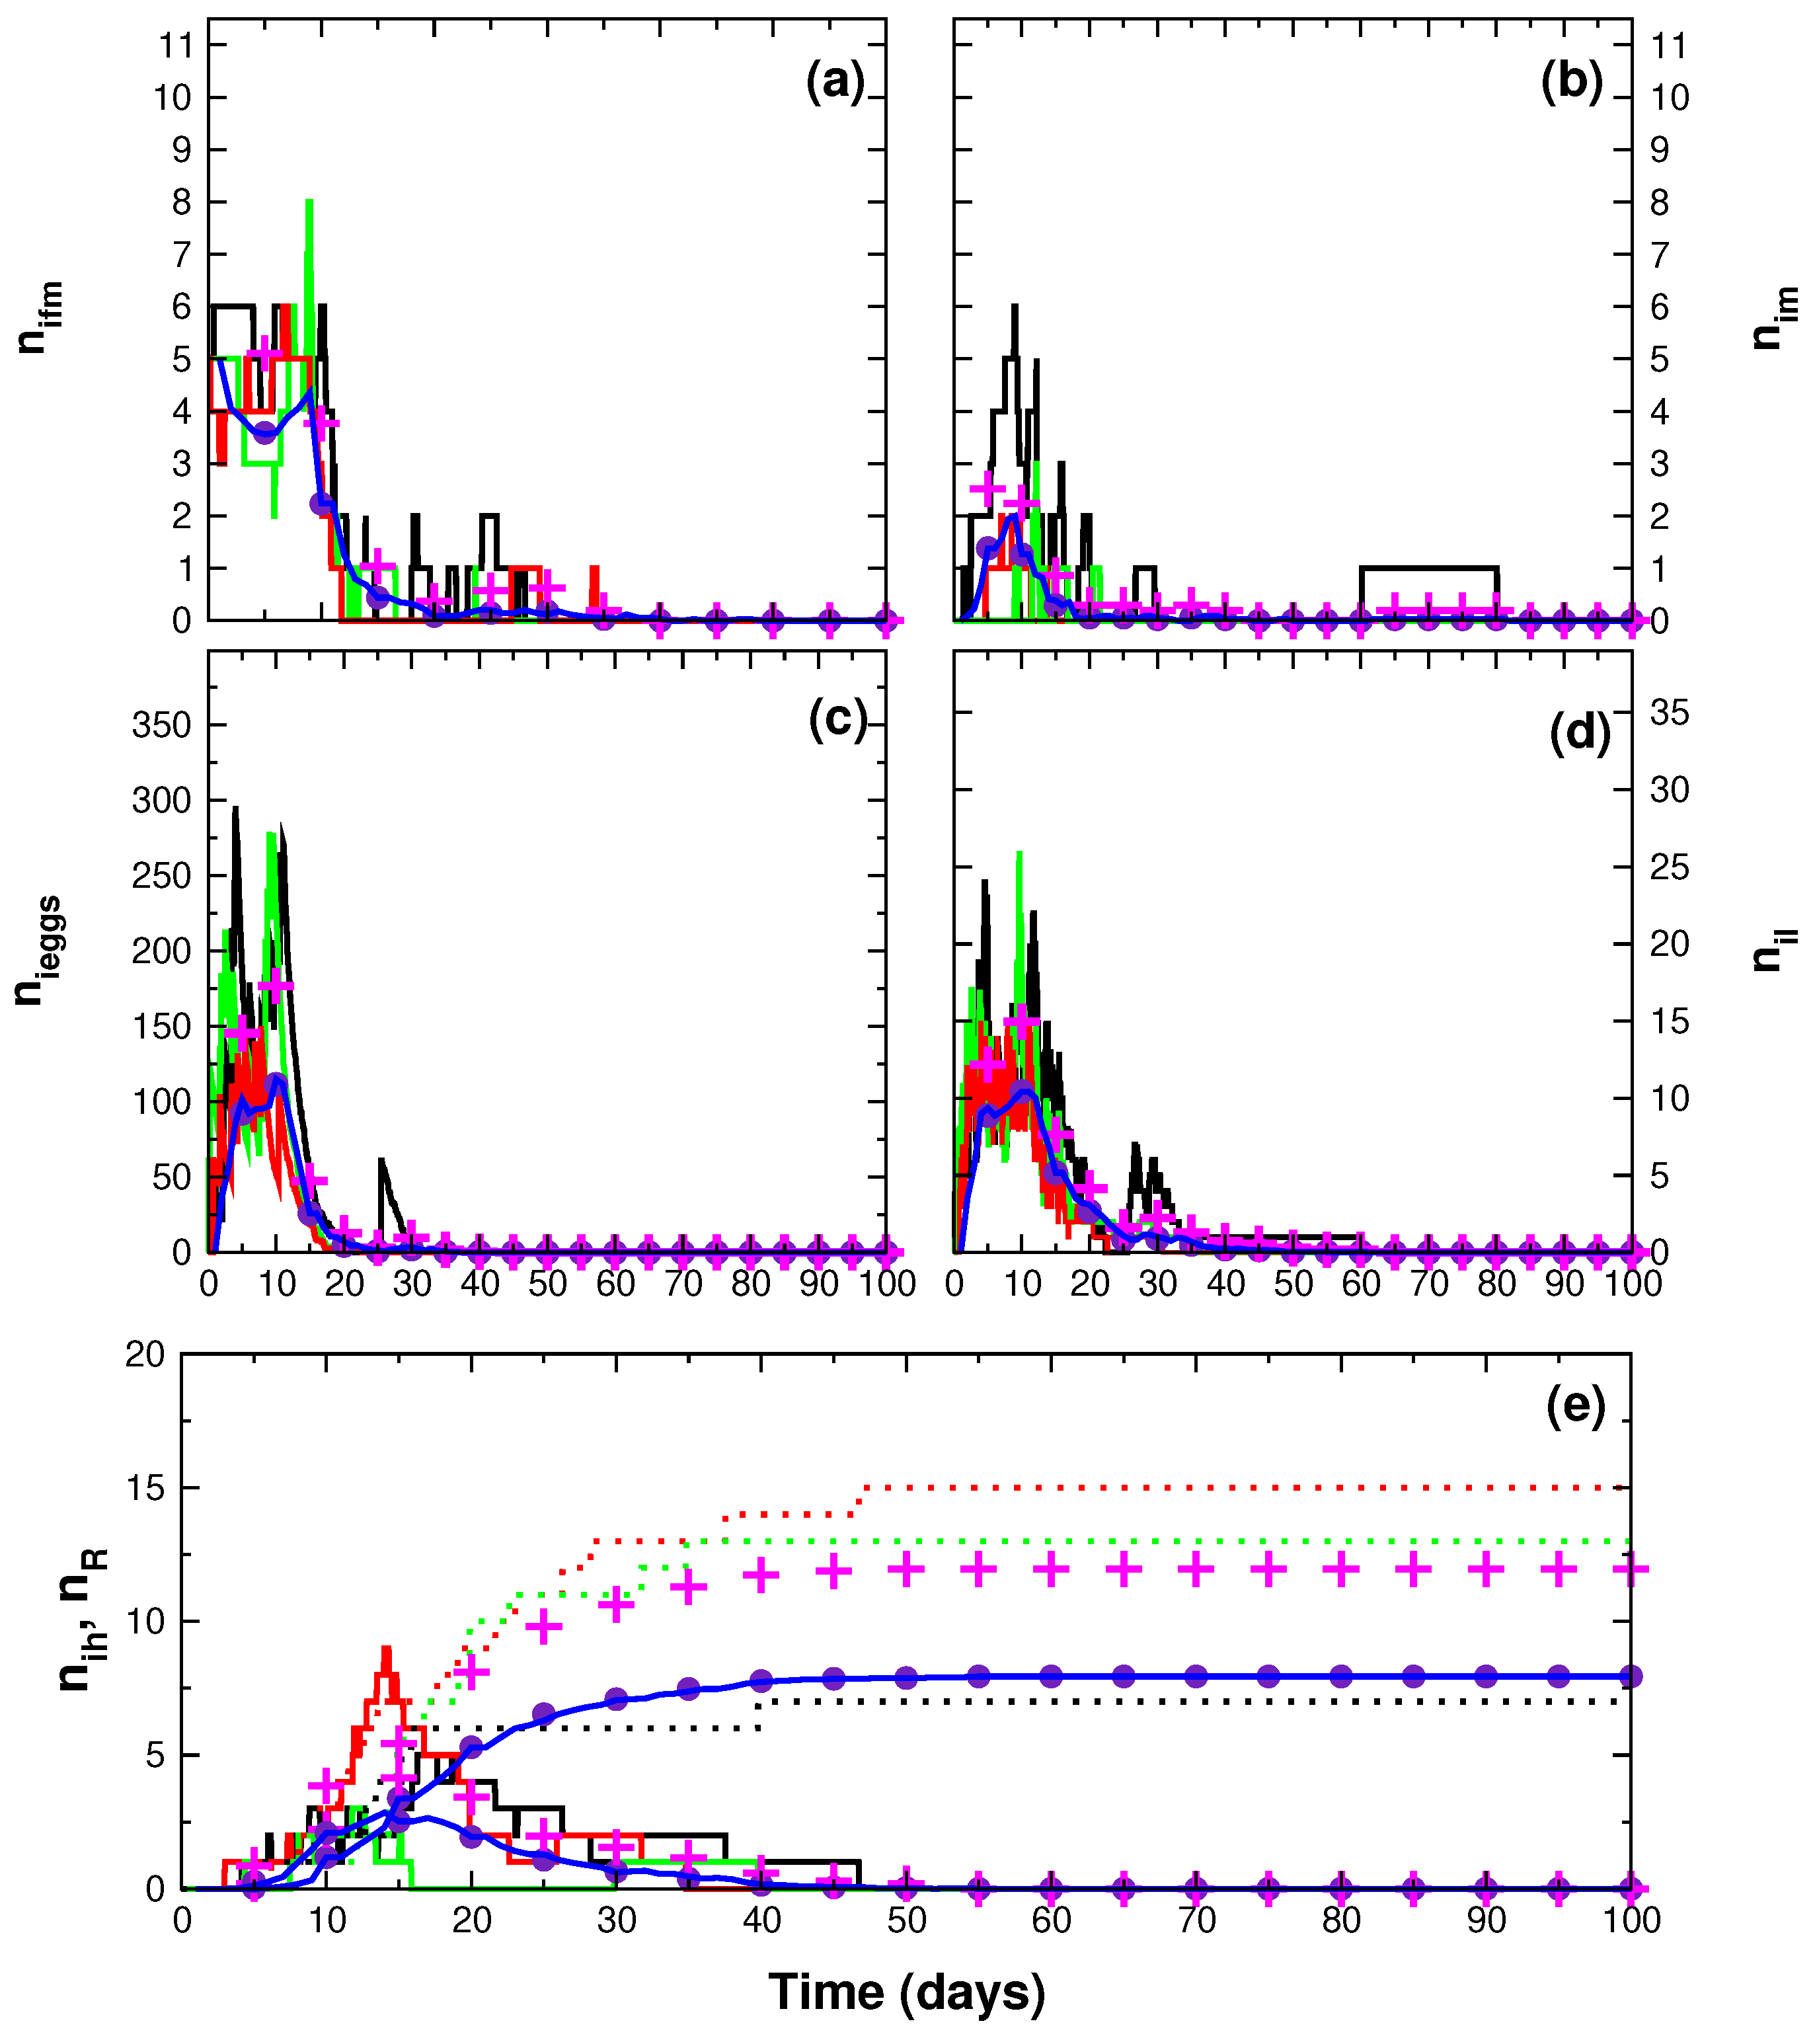
3. Results
4. Discussion
Author Contributions
Funding
Institutional Review Board Statement
Informed Consent Statement
Data Availability Statement
Acknowledgments
Conflicts of Interest
References
- Samui, P.; Mondal, J.; Khajanchi, S. A mathematical model for COVID-19 transmission dynamics with a case study of India. Chaos Solitons Fractals 2020, 140, 110173. [Google Scholar] [CrossRef] [PubMed]
- Shah, K.; Abdeljawad, T.; Mahariq, I.; Jarad, F. Qualitative analysis of a mathematical model in the time of COVID-19. BioMed Res. Int. 2020, 2020, 5098598. [Google Scholar] [CrossRef] [PubMed]
- Tuan, N.H.; Mohammadi, H.; Rezapour, S. A mathematical model for COVID-19 transmission by using the Caputo fractional derivative. Chaos Solitons Fractals 2020, 140, 110107. [Google Scholar] [CrossRef] [PubMed]
- Whitehead, S.S.; Blaney, J.E.; Durbin, A.P.; Murphy, B.R. Prospects for a dengue virus vaccine. Nat. Rev. Microbiol. 2007, 5, 518–528. [Google Scholar] [CrossRef] [PubMed]
- Guzman, M.G.; Halstead, S.B.; Artsob, H.; Buchy, P.; Farrar, J.; Gubler, D.J.; Hunsperger, E.; Kroeger, A.; Margolis, H.S.; Martínez, E.; et al. Dengue: A continuing global threat. Nat. Rev. Microbiol. 2010, 8, S7–S16. [Google Scholar] [CrossRef] [PubMed]
- WHO. Dengue and Severe Dengue; Technical Report; World Health Organization, Regional Office for the Eastern Mediterranean: Geneva, Switzerland, 2014. [Google Scholar]
- Gubler, D.J. The changing epidemiology of yellow fever and dengue, 1900 to 2003: Full circle? Comp. Immunol. Microbiol. Infect. Dis. 2004, 27, 319–330. [Google Scholar] [CrossRef] [PubMed]
- WHO. Special Programme for Research and Training in Tropical Diseases; Epidemic and Pandemic Alert. In Dengue: Guidelines for Diagnosis, Treatment, Prevention and Control; Department of Control of Neglected Tropical Diseases and World Health Organization: Geneva, Switzerland, 2009. [Google Scholar]
- Ross, T.M. Dengue virus. Clin. Lab. Med. 2010, 30, 149–160. [Google Scholar] [CrossRef] [PubMed]
- La Ruche, G.; Souarès, Y.; Armengaud, A.; Peloux-Petiot, F.; Delaunay, P.; Desprès, P.; Lenglet, A.; Jourdain, F.; Leparc-Goffart, I.; Charlet, F.; et al. First two autochthonous dengue virus infections in metropolitan France, September 2010. Eurosurveillance 2010, 15, 19676. [Google Scholar] [CrossRef]
- Kraemer, M.U.; Sinka, M.E.; Duda, K.A.; Mylne, A.Q.; Shearer, F.M.; Barker, C.M.; Moore, C.G.; Carvalho, R.G.; Coelho, G.E.; Van Bortel, W.; et al. The global distribution of the arbovirus vectors Aedes aegypti and Ae. albopictus. eLife 2015, 4, e08347. [Google Scholar] [CrossRef]
- Yang, H.M.; Macoris, M.L.; Galvani, K.C.; Andrighetti, M.T.; Wanderley, D.M. Assessing the effects of temperature on the population of Aedes aegypti, the vector of dengue. Epidemiol. Infect. 2009, 137, 1188–1202. [Google Scholar] [CrossRef]
- Maciel-de-Freitas, R.; Koella, J.C.; Lourenço-de-Oliveira, R. Lower survival rate, longevity and fecundity of Aedes aegypti (Diptera: Culicidae) females orally challenged with dengue virus serotype 2. Trans. R. Soc. Trop. Med. Hyg. 2011, 105, 452–458. [Google Scholar] [CrossRef] [PubMed]
- Oliva, C.F.; Damiens, D.; Vreysen, M.J.; Lemperière, G.; Gilles, J. Reproductive Strategies of Aedes albopictus (Diptera: Culicidae) and Implications for the Sterile Insect Technique. PLoS ONE 2013, 8, 11. [Google Scholar] [CrossRef] [PubMed]
- Goindin, D.; Delannay, C.; Ramdini, C.; Gustave, J.; Fouque, F. Parity and Longevity of Aedes aegypti According to Temperatures in Controlled Conditions and Consequences on Dengue Transmission Risks. PLoS ONE 2015, 10, e0135489. [Google Scholar] [CrossRef] [PubMed]
- Hasibeder, G.; Dye, C. Population Dynamics of Mosquito-Borne Disease: Persistence in a Completely Heterogeneous Environment. Theor. Popul. Biol. 1988, 33, 31–53. [Google Scholar] [CrossRef] [PubMed]
- Derouich, M.; Boutayeb, A.; Twizell, E.H. A model of dengue fever. BioMed. Eng. Online 2003, 2, 4. [Google Scholar] [CrossRef]
- Lloyd, A.L. Estimating variability in models for recurrent epidemics: Assessing the use of moment closure techniques. Theor. Popul. Biol. 2004, 65, 49–65. [Google Scholar] [CrossRef]
- Derouich, M.; Boutayeb, A. Dengue fever: Mathematical modelling and computer simulation. Appl. Math. Comput. 2006, 177, 528–544. [Google Scholar] [CrossRef]
- Otero, M.; Solari, H.G.; Schweigmann, N. A Stochastic Population Dynamics Model for Aedes aegypti: Formulation and Application to a City with Temperate Climate. Bull. Math. Biol. 2006, 68, 1945–1974. [Google Scholar] [CrossRef]
- Lloyd, A.L.; Zhang, J.; Root, A.M. Stochasticity and heterogeneity in host–vector models. J. R. Soc. Interface 2007, 4, 851–863. [Google Scholar] [CrossRef]
- Burattini, M.N.; Chen, M.; Chow, A.; Coutinho, F.A.; Goh, K.T.; Lopez, L.F.; Ma, S.; Massad, E. Modelling the control strategies against dengue in Singapore. Epidemiol. Infect. 2008, 136, 309–319. [Google Scholar] [CrossRef]
- Simoy, M.I.; Simoy, M.V.; Canziani, G.A. The effect of temperature on the population dynamics of Aedes aegypti. Ecol. Model. 2015, 314, 100–110. [Google Scholar] [CrossRef]
- Valdez, L.D.; Sibona, G.J.; Condat, C.A. Impact of rainfall on Aedes aegypti populations. Ecol. Model. 2018, 385, 96–105. [Google Scholar] [CrossRef]
- Sánchez-González, G.; Condé, R.; Noguez Moreno, R.; López Vázquez, P.C. Prediction of dengue outbreaks in Mexico based on entomological, meteorological and demographic data. PLoS ONE 2018, 13, 14. [Google Scholar] [CrossRef]
- Chye, J.K.; Lim, C.T.; Ng, K.B.; Lim, J.M.; George, R.; Lam, S.K. Vertical transmission of dengue. Clin. Infect. Dis. 1997, 25, 1374–1377. [Google Scholar] [CrossRef] [PubMed]
- Adams, B.; Boots, M. How important is vertical transmission in mosquitoes for the persistence of dengue? Insights from a mathematical model. Epidemics 2010, 2, 1–10. [Google Scholar] [CrossRef]
- Sánchez-Vargas, I.; Harrington, L.C.; Doty, J.B.; Black, W.C., 4th; Olson, K.E. Demonstration of efficient vertical and venereal transmission of dengue virus type-2 in a genetically diverse laboratory strain of Aedes aegypti. PLoS Negl. Trop. Dis. 2018, 12, 19. [Google Scholar] [CrossRef]
- Duong, V.; Lambrechts, L.; Paul, R.E.; Ly, S.; Lay, R.S.; Long, K.C.; Huy, R.; Tarantola, A.; Scott, T.W.; Sakuntabhai, A.; et al. Asymptomatic humans transmit dengue virus to mosquitoes. Proc. Natl. Acad. Sci. USA 2015, 112, 14688–14693. [Google Scholar] [CrossRef]
- Arrivillaga, J.; Barrera, R. Food as a limiting factor for Aedes aegypti in water-storage containers. J. Vector Ecol. 2004, 29, 11–20. [Google Scholar]
- Gillespie, D.T. A General Method for Numerically Simulating the Stochastic Time Evolution of Coupled Chemical Reactions. J. Comput. Phys. 1976, 22, 403–434. [Google Scholar] [CrossRef]
- Gillespie, D.T. Exact Stochastic Simulation of Coupled Chemical Reactions. J. Phys. Chem. 1977, 81, 2340–2361. [Google Scholar] [CrossRef]
- Andrew Spielman, M.G.L.; Skaff, V. Failure of effective insemination of young female Aedes Aegypti Mosquitoes. J. Insect Physiol. 1969, 15, 1471–1479. [Google Scholar] [CrossRef] [PubMed]
- Cator, L.J.; Zanti, Z. Size, sounds and sex: Interactions between body size and harmonic convergence signals determine mating success in Aedes aegypti. Parasites Vectors 2016, 9, 11. [Google Scholar] [CrossRef] [PubMed]
- Kim, B.H.; Kim, H.K.; Lee, S.J. Experimental analysis of the blood-sucking mechanism of female mosquitoes. J. Exp. Biol. 2011, 214, 1163–1169. [Google Scholar] [CrossRef] [PubMed]
- Livdahl, T.P.; Koenekoop, R.K.; Futterweit, S.G. The complex hatching response of Aedes eggs to larval density. Ecol. Entomol. 1984, 9, 437–442. [Google Scholar] [CrossRef]
- López, L.E.; Muñoz-Loaiza, A.; Olivar-Tost, G.; Betancourt-Bethencourt, J. A mathematical model for controlling the spread of dengue. Public Health 2012, 14, 512–523. [Google Scholar]
- de Castro Medeiros, L.C.; Castilho, C.A.; Braga, C.; de Souza, W.V.; Regis, L.; Monteiro, A.M. Modeling the Dynamic Transmission of Dengue Fever: Investigating Disease Persistence. PLoS Negl. Trop. Dis. 2011, 5, e942. [Google Scholar]
- INEGI. Instituto Nacional de Estadística Geografía e Informática. 2015. Available online: http://www.ceieg.chiapas.gob.mx/productos/files/EIC2015/EIC_2015_presenta_DEFI_Estatal_CHS_07122015-A.pdf (accessed on 1 January 2020).
- Karunaratne, S.H.; Weeraratne, T.C.; Perera, M.D.; Surendran, S.N. Insecticide resistance and, efficacy of space spraying and larviciding in the control of dengue vectors Aedes aegypti and Aedes albopictus in Sri Lanka. Pestic. Biochem. Physiol. 2013, 107, 98–105. [Google Scholar] [CrossRef] [PubMed]
- Otero, H.S.M. Stochastic eco-epidemiological model of dengue disease transmission by Aedes aegypti mosquito. Math. Biosci. 2010, 223, 32–46. [Google Scholar] [CrossRef]
- CONAGUA. Comisión Nacional del Agua. 2021. Available online: https://smn.conagua.gob.mx/tools/RESOURCES/Diarios/7202.txt (accessed on 1 January 2020).
- Marcelo, O.; Nicolás Schweigmannb, H.G.S. A Stochastic Spatial Dynamical Model for Aedes aegypti. Bull. Math. Biol. 2008, 70, 1297–1325. [Google Scholar]
- Powell, J.R.; Gloria-Soria, A.; Kotsakiozi, P. Recent History of Aedes aegypti: Vector Genomics and Epidemiology Records. BioScience 2018, 68, 854–860. [Google Scholar] [CrossRef]
- Chadee, D.D.; Martinez, R.; Sutherl, J.M. Aedes aegypti (L.) mosquitoes in Trinidad, West Indies: Longevity case studies. J. Vector Ecol. 2017, 42, 130–135. [Google Scholar] [CrossRef] [PubMed]
- Yang, H.M. The transovarial transmission in the dynamics of dengue infection: Epidemiological implications and thresholds. Math. Biosci. 2017, 286, 1–15. [Google Scholar] [CrossRef] [PubMed]
- Murillo, D.; Holechek, S.; Murillo, A.L.; Sanchez, F.; Castillo-Chavez, C. Vertical Transmission in a Two-Strain Model of Dengue Fever. Lett. Biomath. 2014, 1, 249–271. [Google Scholar] [CrossRef]
- Ranathunge, T.; Harishchandra, J.; Maiga, H.; Bouyer, J.; Gunawardena, Y.I.N.S.; Hapugoda, M. Development of the Sterile Insect Technique to control the dengue vector Aedes aegypti (Linnaeus) in Sri Lanka. PLoS ONE 2022, 17, e0265244. [Google Scholar] [CrossRef] [PubMed]
- Gato, R.; Menéndez, Z.; Prieto, E.; Argilés, R.; Rodríguez, M.; Baldoquín, W.; Hernández, Y.; Pérez, D.; Anaya, J.; Fuentes, I.; et al. Sterile Insect Technique: Successful Suppression of an Aedes aegypti Field Population in Cuba Sterile Insect Technique: Successful Suppression of an Aedes aegypti Field Population in Cuba. Insects 2021, 12, 469. [Google Scholar] [CrossRef] [PubMed]
- Sasmita, H.I.; Tu, W.C.; Bong, L.J.; Neoh, K.B. Effects of larval diets and temperature regimes on life history traits, energy reserves and temperature tolerance of male Aedes aegypti (Diptera: Culicidae): Optimizing rearing techniques for the sterile insect programmes. Parasites Vectors 2019, 12, 1–16. [Google Scholar] [CrossRef]
- Alphey, L.; Benedict, M.; Bellini, R.; Clark, G.G.; Dame, D.A.; Service, M.W.; Dobson, S.L. Sterile-Insect Methods for Control of Mosquito-Borne Diseases: An Analysis. Vector-Borne Zoonotic Dis. 2010, 10, 295–311. [Google Scholar] [CrossRef]
- Lau, M.J.; Ross, P.A.; Hoffmann, A.A. Infertility and fecundity loss of Wolbachia-infected Aedes aegypti hatched from quiescent eggs is expected to alter invasion dynamics. PLoS Negl. Trop. Dis. 2021, 15, e0009179. [Google Scholar] [CrossRef]
- Crawford, J.E.; Clarke, D.W.; Criswell, V.; Desnoyer, M.; Cornel, D.; Deegan, B.; Gong, K.; Hopkins, K.C.; Howell, P.; Hyde, J.S.; et al. Efficient production of male Wolbachia-infected Aedes aegypti mosquitoes enables large-scale suppression of wild populations. Nat. Biotechnol. 2020, 38, 482–492. [Google Scholar] [CrossRef]
- Iftikhar, M.; Iftikhar, S.; Sohail, A.; Javed, S. AI- modelling of molecular identification and feminization of wolbachia infected Aedes aegypti. Prog. Biophys. Mol. Biol. 2019, 150, 104–111. [Google Scholar] [CrossRef]
- Rahayu, A.; Saraswati, U.; Supriyati, E.; Kumalawati, D.A.; Hermantara, R.; Rovik, A.; Daniwijaya, E.W.; Fitriana, I.; Setyawan, S.; Ahmad, R.A.; et al. Prevalence and Distribution of Dengue Virus in Aedes aegypti in Yogyakarta City before Deployment of Wolbachia Infected Aedes aegypti. Int. J. Environ. Res. Public Health 2019, 16, 1742. [Google Scholar] [CrossRef] [PubMed]

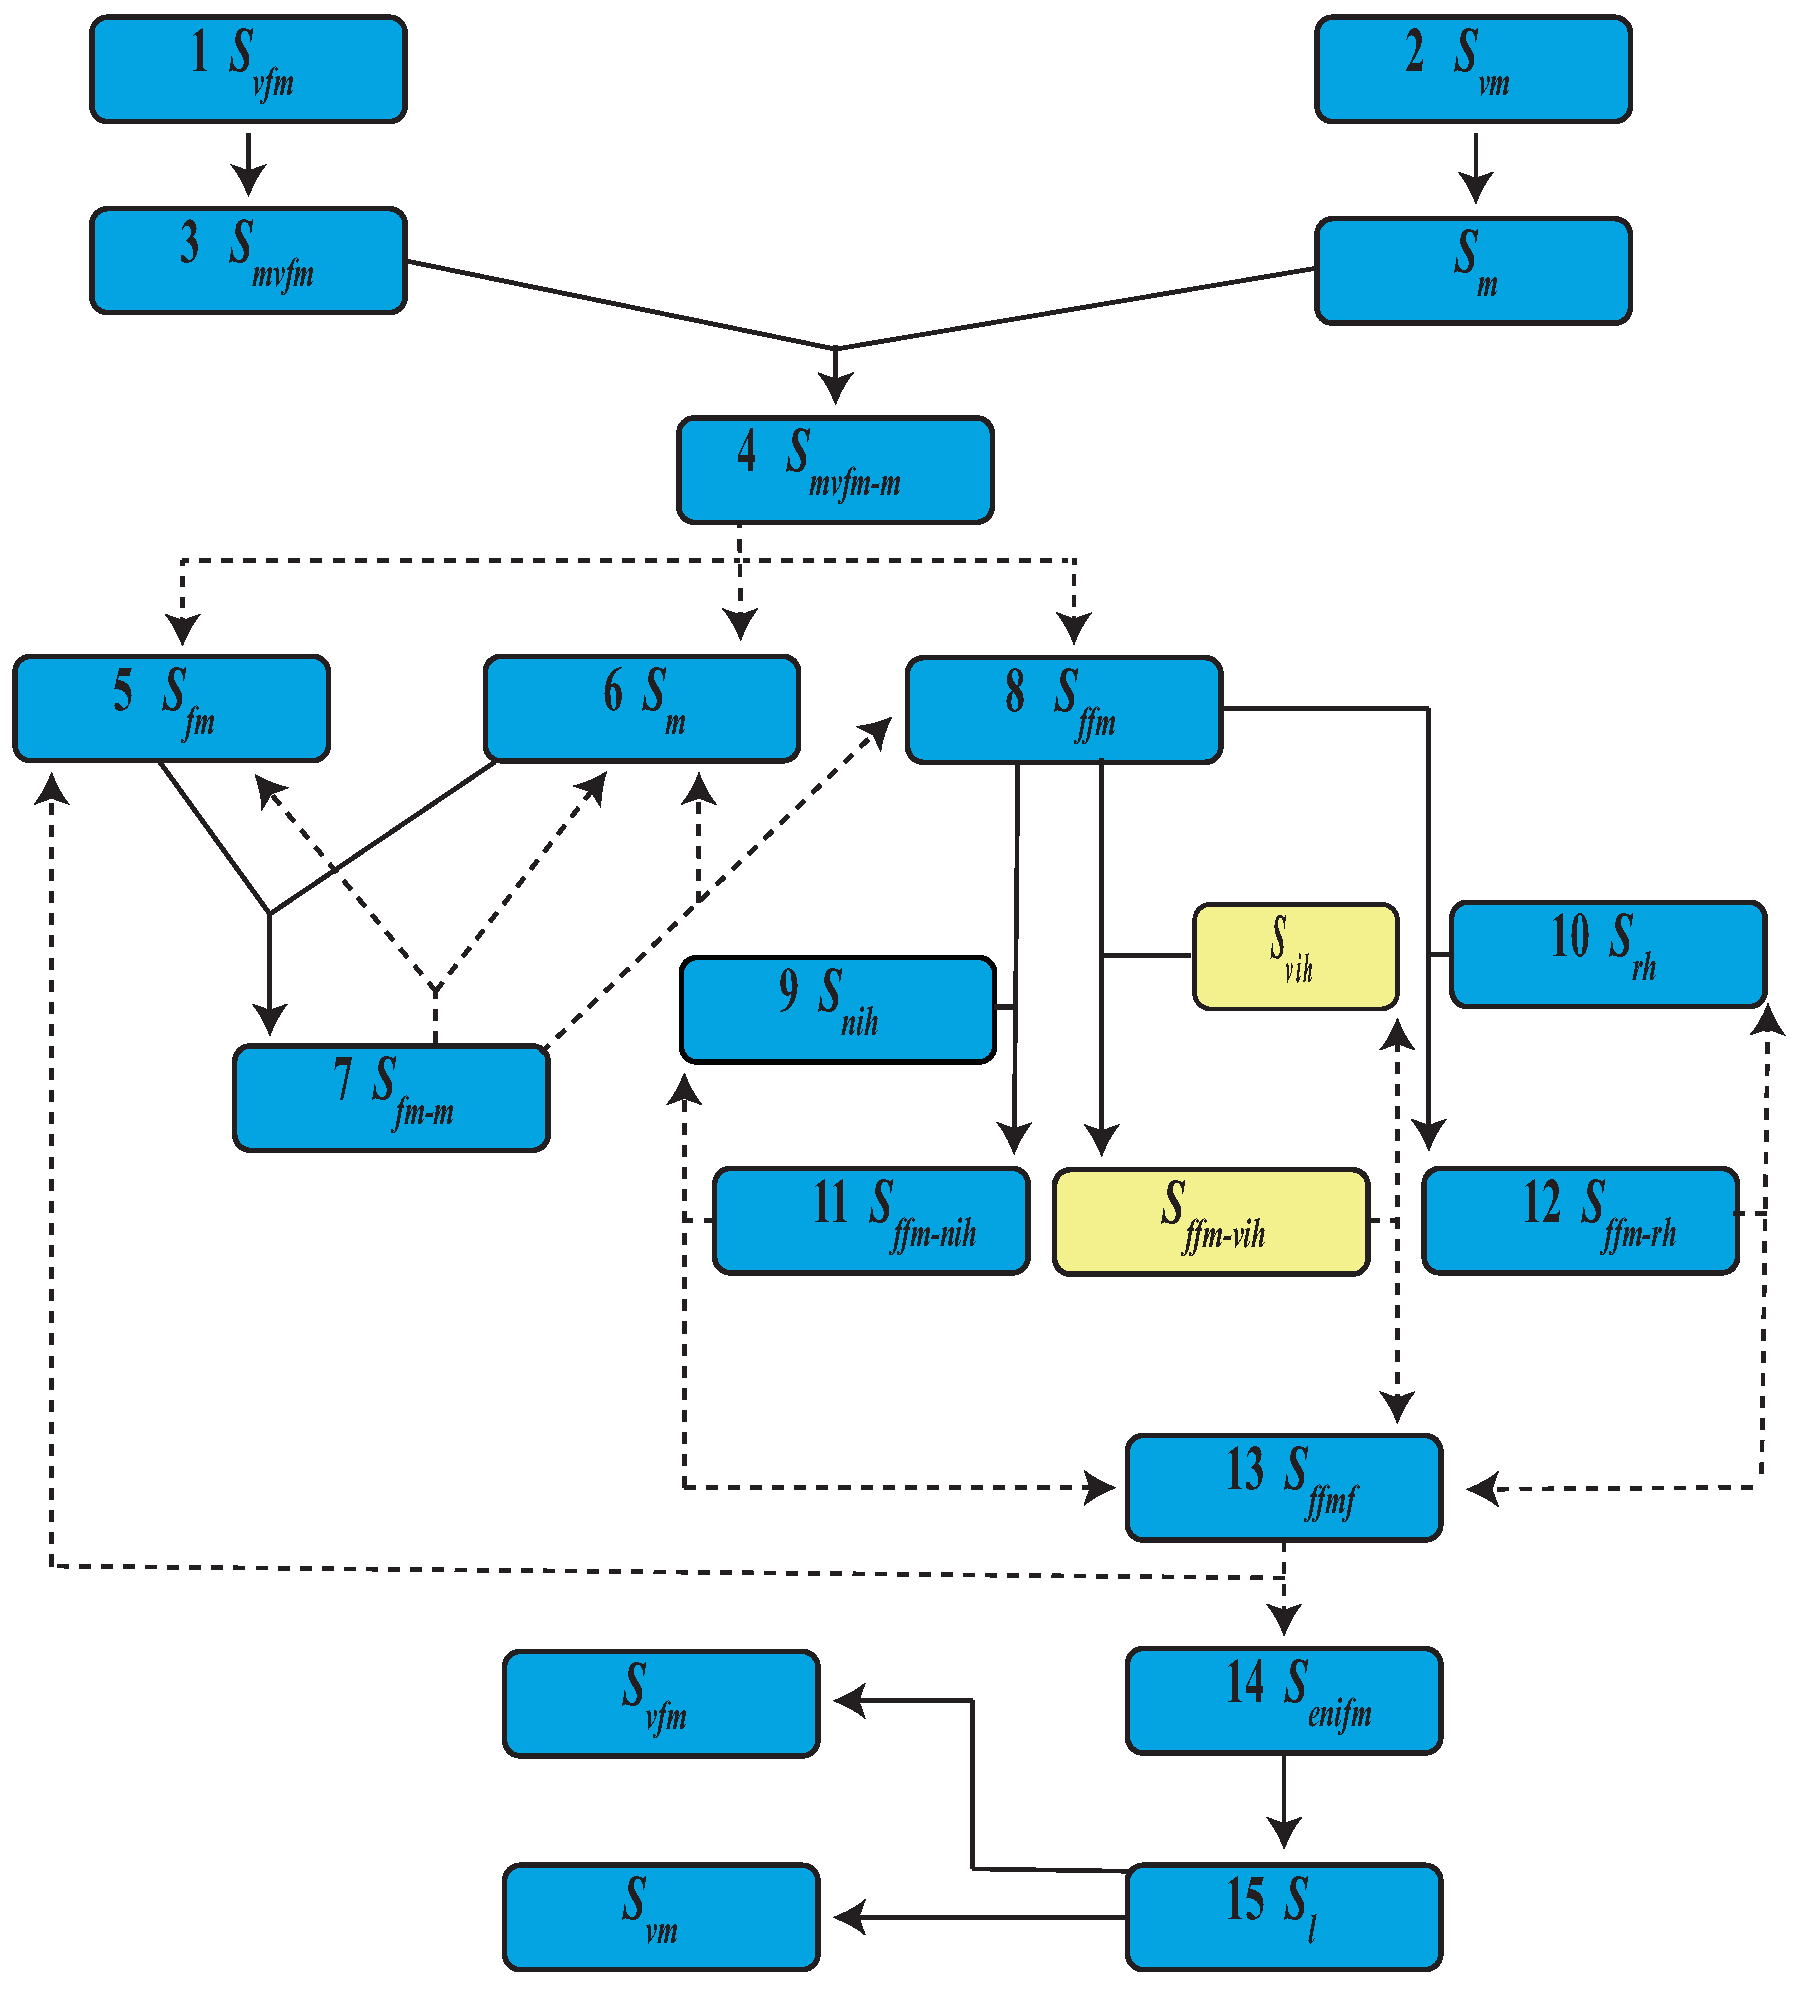

| Event | State | Population | |
|---|---|---|---|
| 1 | Virgin female emergence | ||
| 2 | Virgin male emergence | ||
| 3 | Mature virgin female | ||
| 4 | Mature virgin female and male mating | ||
| 5 | Mature female | ||
| 6 | Mature male | ||
| 7 | Mature female and male mating | ||
| 8 | Fertilized female | ||
| 9 | Uninfected human | ||
| 10 | Recovered human | ||
| 11 | Fertilized female bites a uninfected human | ||
| 12 | Fertilized female bites a recovered human | ||
| 13 | Fertilized female and fed | ||
| 14 | Eggs from uninfected female | ||
| 15 | Uninfected larva |
| Event | State | Population | |
|---|---|---|---|
| 16 | Virgin virus infected female emergence | ||
| 17 | Virgin virus infected male emergence | ||
| 18 | Mature infected female | ||
| 19 | Mature infected male | ||
| 20 | Mature virgin female and infected male mating | ||
| 21 | Mature infected female and male mating | ||
| 22 | Mature female and male infected mating | ||
| 23 | Mature female and infected male mating | ||
| 24 | Infected fertilized female | ||
| 25 | Infected human | ||
| 26 | Fertilized female bites a infected human | ||
| 27 | Infected fertilized female bites a infected human | ||
| 28 | Infected fertilized female bites a uninfected human | ||
| 29 | Infected fertilized female bites a recovered human | ||
| 30 | Infected fertilized female and fed | ||
| 31 | Eggs from infected female | ||
| 32 | Infected larva |
| Event | State | Population | |
|---|---|---|---|
| 33 | Female virus bearer | ||
| 34 | Female virus bearer and male mating | ||
| 35 | Female virus bearer and male infected mating | ||
| 36 | Fertilized female virus bearer | ||
| 37 | Human virus bearer | ||
| 38 | Fertilized female virus bearer bites a uninfected human | ||
| 39 | Fertilized female virus bearer bites a infected human | ||
| 40 | Fertilized female virus bearer bites a recovered human | ||
| 41 | Fertilized infected female bites a human virus bearer | ||
| 42 | Fertilized female bites a human, both virus bearer | ||
| 43 | Fertilized female bites a human virus bearer | ||
| 44 | Fertilized female virus bearer and fed |
| Transition Rate | Event | Transition Rate | Event |
|---|---|---|---|
| → | → | ||
| → | |||
| → | |||
| → | → | ||
| → | |||
| → | |||
| → | → | ||
| → | → | ||
| → | → | ||
| → | → | ||
| → | → | ||
| → | → | ||
| → | → | ||
| → | → | ||
| → | → | ||
| → | → | ||
| → | → | ||
| → | → | ||
| → | → | ||
| → | → | ||
| → | → | ||
| → | → | ||
| → | → | ||
| → | → | ||
| → | → | ||
| → | → | ||
| → | → | ||
| → | → | ||
| → | → | ||
| → | → | ||
| → | → | ||
| → | → |
| Transition Rate | Event | Transition Rate | Event |
|---|---|---|---|
| → | → | ||
| → | → | ||
| → | → | ||
| → | → | ||
| → | |||
| → | |||
| → | → | ||
| → | → | ||
| → | → | ||
| → | → | ||
| → | → | ||
| → | → | ||
| → | → | ||
| → | → | ||
| → | → | ||
| → | → | ||
| → | → | ||
| → | → | ||
| → | → | ||
| → | → | ||
| → | → | ||
| → | → | ||
| → | → | ||
| → | → | ||
| → | → | ||
| → | → | ||
| → | → | ||
| → | → | ||
| → | → | ||
| → | → | ||
| → | → | ||
| → | → | ||
| → | → | ||
| → | → | ||
| → | |||
| → | |||
| → | |||
| → | → | ||
| → | → | ||
| → | → | ||
| → | → | ||
| → | → | ||
| → | → | ||
| → | → | ||
| → | → | ||
| → | → | ||
| → | → | ||
| → | → | ||
| → | → | ||
| → | |||
| → | |||
| → | |||
| → | → | ||
| → | → | ||
| → | → | ||
| → | → | ||
| → |
| Transition Rate | Event | Transition Rate | Event |
|---|---|---|---|
| → | → | ||
| → | |||
| → | |||
| → | → | ||
| → | → | ||
| → | → | ||
| → | → | ||
| → | → | ||
| → | → | ||
| → | → | ||
| → | → | ||
| → | → | ||
| → | → | ||
| → | → | ||
| → | → | ||
| → | → | ||
| → | → | ||
| → | → | ||
| → | → | ||
| → | → | ||
| → | → | ||
| → | → | ||
| → | → | ||
| → | → | ||
| → | → | ||
| → | → | ||
| → | → |
Disclaimer/Publisher’s Note: The statements, opinions and data contained in all publications are solely those of the individual author(s) and contributor(s) and not of MDPI and/or the editor(s). MDPI and/or the editor(s) disclaim responsibility for any injury to people or property resulting from any ideas, methods, instructions or products referred to in the content. |
© 2023 by the authors. Licensee MDPI, Basel, Switzerland. This article is an open access article distributed under the terms and conditions of the Creative Commons Attribution (CC BY) license (https://creativecommons.org/licenses/by/4.0/).
Share and Cite
Cruz, J.-M.; González-Gutiérrez, J.; Salgado-García, R.; Díaz-Hernández, O. A New Stochastic Model for the Aedes aegypti Life Cycle and the Dengue Virus Transmission. Appl. Sci. 2023, 13, 6241. https://doi.org/10.3390/app13106241
Cruz J-M, González-Gutiérrez J, Salgado-García R, Díaz-Hernández O. A New Stochastic Model for the Aedes aegypti Life Cycle and the Dengue Virus Transmission. Applied Sciences. 2023; 13(10):6241. https://doi.org/10.3390/app13106241
Chicago/Turabian StyleCruz, José-Manuel, Jorge González-Gutiérrez, R. Salgado-García, and O. Díaz-Hernández. 2023. "A New Stochastic Model for the Aedes aegypti Life Cycle and the Dengue Virus Transmission" Applied Sciences 13, no. 10: 6241. https://doi.org/10.3390/app13106241