Article

Millimeter Wave Radar Range Bin Tracking and Locking for Vital Sign Detection with Binocular Cameras

1
College of Information Engineering, Inner Mongolia University of Technology, Hohhot 010051, China
2
Inner Mongolia Key Laboratory of Radar Technology and Application, Hohhot 010051, China
*
Author to whom correspondence should be addressed.
Appl. Sci. 2023, 13(10), 6270; https://doi.org/10.3390/app13106270
Submission received: 15 April 2023 / Revised: 15 May 2023 / Accepted: 18 May 2023 / Published: 20 May 2023

Abstract

:
Millimeter wave radars in frequency-modulated continuous wave (FMCW) systems are widely used in the field of noncontact life signal detection; however, large errors still persist when determining the distance dimension of the target to be measured with the radar echo signal. The processing of the signals in the target environment is blind. We propose a method of using binocular vision to lock the distance dimension of the radar life signal and to determine the target distance by using the principle of the binocular camera parallax method, as this reduces the influence of the noise in the environment when determining the distance dimension of the target to be measured. First, the Yolo (you only look once: unified, real-time object detection) v5s neural network is used to call the binocular camera to detect the human body, where the resolution of the single lens is 1280 × 1200, and the DeepSORT (deep simple online real-time tracking) algorithm is used to extract the features of the target and track and register them. Additionally, the binocular vision parallax ranging method is used to detect the depth information of the target, search for the depth information in the range-dimensional FFT (frequency Fourier transform) spectrum of the radar echo signal, and take the spectral peak with the largest energy within the search range to determine it as the target. Then, the target is measured, the range gate of the target is determined, and the life signal is then separated through operations such as phase information extraction, unwrapping, and filtering. The test results showed that this method can be used to directionally separate and register corresponding life signals in a multiliving environment. By conducting an analysis using the Pearson correlation coefficient, we found that the correlation between the breathing frequency collected using this method and a breathing sensor reached 84.9%, and the correlation between the heartbeat frequency and smart bracelet results reached 93.6%. The target range gate was locked to separate and match the life signal.

1. Introduction

As important physical indicators of life activities [1], the heartbeat frequency and respiratory rate of a person have collection requirements when it comes to medical diagnosis, biological research, and other fields. With the increasing development of medical technology and biological science, the demand for noncontact detection of one’s heart and respiratory rate has gradually increased. Many accurate algorithms that perform frequency modulated continuous wave (FMCW) system radar signal detection exist. Liu et al. [2] further developed the polarization detection optimization filter (PDOF) based on Cauchy’s inequality and matrix decomposition theory; namely, they developed the subspace form of the PDOF, which enhances the detection performance. Hua et al. [3] expressed the LDA manifold projection (the cost function maximizes the interclass distance and minimizes the intraclass distance) as an optimization problem in the Stiefel manifold. Four robust LDA-MIG detectors that correspond to different geometric measurements were proposed. Winkler [4] optimized the FMCW signal processing algorithm in an automotive radar system by eliminating the ambiguity between the frequency difference and Doppler frequency produced by the distance. In the past three decades, the FMCW radar has also been used for ocean surface velocity measurements [5] and snow detection [6]. Additionally, due to its large bandwidth and high resolution, the FM continuous wave radar is gradually applied to the life signal detection field [7].
Zhang Yang et al. [8] proposed a multitarget detection and recognition algorithm based on the energy spectrum, which solved the problem of single-base life signal detection radars easily missing when detecting and recognizing multiple human targets, but they did not mention the extraction and recognition of heartbeat signals. Zhang Hua et al. [9] proposed a heartbeat signal separation technology based on filtering with a 35 GHz radar, but this technology is not applicable in general environments because ECG information cannot be obtained. After Sharpe et al. [10] first proposed the use of an FMCW millimeter wave radar to detect vital signs, Park et al. [11] used the phase information of a 77 GHz FMCW millimeter wave radar intermediate frequency signal to detect human vital signs; by doing so, they avoided the influence of high-order harmonics and also solved the problem of the DC signal frequency shift caused by the I/Q two-way signal, which does not consider the interference between the harmonics of the respiratory and life signal or the existence of environmental noise. Luo Langjuan et al. [12] proposed a noise elimination method and used an IIR bandpass filter to separate respiration and heartbeat signals to avoid interference between heartbeat and respiration signal harmonics. In previous studies, the detection was performed in a simple environment, and the target range gate was mostly judged within the first three peaks of the range-dimension FFT by default, or the maximum average value of the different distance intervals was calculated on each frame signal by considering the sweeping frequency power. However, in a complex environment, due to the existence of invalid targets or multiple living bodies, multiple high peak points will be generated during a distance-dimension FFT, interference will be generated during phase signal separation, and the phase information of the target cannot be separated via directivity.
The application of the Yolo neural network in image recognition and practical engineering problems is becoming increasingly extensive. Zhen Liu et al. [13] used their own enhanced Yolo neural network to identify pavement cracks. Zhen Liu et al. [14] also used the improved R-CNN (regional convolutional neural networks) neural network to detect asphalt pavement cracks. Junwei Sha et al. [15] developed an enhanced and accurate automated detection system for the Yolo v5 model.
We based this project on the binocular camera parallax method, and we propose a method of using the Yolo v5s neural network and DeepSORT algorithm to lock the target distance dimension for radar signal processing: First, we use Yolo v5s to call the binocular camera, then identify the target and extract the features from the image acquired by the camera when in the binocular, use the DeepSORT algorithm to track the target, complete the registration and tracking of the human target, use the binocular camera parallax method to measure the distance to obtain the target depth information, and perform a range gate on the radar signal. When locking, the obtained depth information is used as the center value to perform a matching search with the range-dimensional FFT spectrum; then, the target range gate is tracked and locked, and the target life signal is acquired and paired with the directivity.
Our main contribution is our proposition of a method to track and lock different target range gates in a multitarget environment, separate the life signal and match it with the target to be measured, and reduce the cost of noncontact life signal detection based on a millimeter wave radar in a multitarget environment, whereby blindness occurs during the signal processing. We discuss the following topics: the basic principle and signal model of life signal detection, the principle of the binocular camera range, the system design, the experimental verification, and the conclusion.

2. Basic Principles and Signal Models for Vital Sign Detection

As illustrated in Figure 1, the millimeter wave radar [16] comprises a radio frequency system, analog clock, and digital circuit. The radio frequency system includes a transmitter and receiver, and the digital circuit comprises an analog-to-digital converter (ADC) and a digital signal processor (DSP).
The millimeter wave radar transmits linear FMCWs, and the transmit signal model  S T ( t )  can be expressed as follows:
S T t = A t e j 2 π f c t + π B T t 2 + φ 0
where  A t  is the amplitude of the linear FM signal,  f c  is the linear FM signal carrier,  B  is the signal bandwidth,  T  is the signal sweep time, and  φ 0  is the random initial phase of the signal.
The reflection from the human thorax is intercepted by the receiver antenna. The received signal  S R t  can be expressed as
S R t = A r e j 2 π f c t t d + π B T t t d 2 + φ 0 + φ
where  A r  is the signal’s amplitude,  φ  is the additional phase shift of the reflection, and  t d  is the delay in the echo signal. The received signal is combined with the local oscillator (LO) signal in the mixer, and the IF signal is obtained as follows:
S I F t = A t A r e j 4 π B R c T t + 4 π λ R = A t A r e j f b t + ϕ b
where  R  is the distance between the target and radar,  f b  is the IF signal carrier frequency, and  ϕ b  is the initial phase.
The life signal processing flow is shown in Figure 2.
To measure the subtle displacement of the chest cavity due to breathing and one’s heartbeat, obtaining the phase change within the target range bin  ϕ b  is necessary, and this is expressed as
ϕ b = 4 π λ R
The target phase of the signal can be obtained from the signal in the range bin via the FFT. The vibration signal in the range bin at distance m is extracted as follows:
x m , n T s = λ 4 π ϕ b ( m , n T s )
where  m  is the target distance,  n  is the chirp index, and  T s  is the chirp periodicity (the continuous monitoring time).

3. Binocular Camera Ranging Principles

A binocular camera simulates the human eye to imagine a single object from two different angles through binocular vision and calculates the depth of the object via the angular difference [17]. The schematic diagram of the ranging principle of the parallax method is shown in Figure 3.
Q R  and  Q T  are the optical centers of the two binocular cameras,  P  is the actual object to be measured, and  P 1  and  P 2  are the imaging points (mirror images) of the object to be measured by the sensors of the two cameras. The distance  d i s  between  P 1  and  P 2  can be expressed as
d i s = B X R X T
According to the similarity theorem of triangles,
B X R X T B = Z f Z
The vertical distance of the object to be measured from the camera baseline, that is, the depth information  Z  –, can be obtained as follows:
Z = f B X R X T
where  f  is the camera focal length.

4. System Design

4.1. System Flow

Yolo v5s uses the binocular camera for image acquisition purposes, identifies the calibrated target, tracks it with the DeepSORT algorithm, measures the target depth information that is collected via the parallax method, passes the depth information to the millimeter wave radar signal for processing, tracks and locks the target range bin during signal processing, and accurately separates the target vital signs. The flow chart of the system proposed in this paper is shown in Figure 4.

4.2. Yolo v5s Target Detection

The Yolo v5 algorithm has been enhanced from Yolo v4 in terms of being lightweight, having high speed and accuracy, and being easily portable. It retains the mosaic data augmentation at the input end from Yolo v4 and now includes adaptive anchor box calculations and image scaling methods. It also includes the focus and C3 structures at the feature extraction layer to enhance the feature representation. The focus module slices the input image to reduce the loss in the original feature information and increase the model computation speed. The C3 module draws on the idea of CSPNet [18] to enhance the feature fusion capability of the model while reducing the network complexity and increasing the computation speed. In the feature fusion layer, Yolo v5 adopts the structure of the feature pyramid network (FPN) combined with the path aggregation network (PAN). The PAN propagates strong localization features from bottom to top, which allows the model to obtain more abundant feature information. Therefore, we used Yolo v5 as the base model for human recognition based on these enhancements.
The selected Yolo v5S neural network comprised four parts: the input, backbone, neck, and prediction, and its feature map had the smallest depth and width among the Yolo v5 series. Consequently, the network yielded the swiftest response for large-target detection within this series. The structure diagram of Yolo v5S is shown in Figure 5.

4.3. DeepSORT Multitarget Tracking Algorithm [19]

The model that the SORT algorithm strives to achieve is an eight-dimensional model:
X = μ   ν   r   h   x ˙   y ˙   r ˙   h ˙   T
The first three variables represent the current target’s horizontal and vertical axis value and the size ratio and height of the BBox, respectively. The latter four variables represent the relative velocity of the predicted position in the next frame, including the horizontal and vertical coordinate and the BBox size.
DeepSORT improves upon SORT by integrating appearance information to enhance SORT’s performance. With this extension, the model can more effectively handle cases where the target is occluded for a long time, which reduces the ID switch indicators by 45%. DeepSORT adopts the same eight-dimensional features as mentioned above for target modeling, but it also adds the handling and management of target trajectories, which includes setting the states for trajectory addition, termination, and matching.
The DeepSORT multitarget tracking algorithm, which is constructed on the Yolo v5s network, correlates data by tracking the targets and actual detection positions in the subsequent frame; it updates the bounding box by combining the results of the tracking and detection, and thereby it realizes multitarget tracking. The algorithm flow is shown in Figure 6.
(1)
State Prediction:
The tracks generated from the previous iteration undergo Kalman filtering prediction so that the mean and covariance for the current iteration can be calculated, and the state of the data (confirmed and unconfirmed) remains unchanged.
(2)
First Matching:
The tracks from Step 1 and the detections from the current target detector are fed into the cascade for matching purposes, which results in three states: unmatched tracks, unmatched detections, and matched tracks.
(3)
Second Matching:
However, some detections may be missed in Step 2. The detections are then combined with the undetermined tracks from Step 1 and are rematched using IOU (intersection over union) matching to obtain more reliable unmatched tracks, unmatched detections, and matched tracks.
(4)
Handling of Expired Objects:
The unmatched tracks that are still unconfirmed (unconfirmed) or confirmed (confirmed) but with an age exceeding the threshold are set to be deleted.
(5)
Output Results and Prepare Data for the Next Iteration, where Tracks are Merged from the Following Three Sources:
(a)
Merging of matched tracks from Steps 3 and 4, with a Kalman filtering update and an increment in age by 1, which results in output tracks.
(b)
Creating new tracks from unmatched detections from Step 3.
(c)
Including confirmed tracks from Step 4 that have not exceeded the age threshold. These tracks from the three sources are merged as the output for the current iteration, and they also serve as the input for the next iteration to continue with Step (1).

4.4. Binocular Camera Ranging

Because the binocular camera obtains information from two angles, it must be calibrated to accurately acquire the scene depth and three-dimensional information.
This calibration process encompasses two primary stages: internal and external parameter calibrations. The former corresponds to the intrinsic parameters of each camera, such as the focal length, pixel size, and aberration parameters, whereas the latter refers to the designation of the relative position and direction between the cameras as well as the distance between the cameras and the scene. The schematic diagram of the binocular camera ranging principle is shown in Figure 7.

4.5. Vital Sign Processing

Figure 8 shows the life signal processing flow.
(1)
Range frequency Fourier transform (FTT): FFT is performed on the raw complex signals in an ADC to obtain the range spectrum.
(2)
Binocular camera ranging: a binocular camera is used to acquire the images, calibrate the target, and calculate the target depth information by using the parallax method.
(3)
Range bin tracking: with the centralized target depth information, the range error and radar distance resolution are combined to determine the distance range of the human targets and identify the maximal energy spectrum peak within that range to obtain the corresponding range bins.
(4)
Phase extraction: The phases in the target range bins are cyclically extracted at a frame periodicity of 50 ms. That is, the target phases are extracted once per frame. If the radial distance between the target and the original range bin changes, the range-bin tracking algorithm is used to calculate the current range bin, followed by cyclic phase extraction and the remittance of N frames to obtain the framewise phase variation in the target. This value can also be regarded as the relationship between the phase and time of the target.
(5)
Phase unwrapping: Because the phase values are in the range  [ π , π ] , phase unwrapping must be employed to obtain the actual displacement curve. Whenever the phase difference between consecutive values are outside the range of  ± π , unwrapping is performed by subtracting  2 π  from the phase.
(6)
Phase difference: this is performed on adjacent phases to strengthen the pulse signal by subtracting the successive phase values and removing the phase shift.
(7)
Bandpass filtering: the phase values (frequency values caused by phase change) are filtered according to differences in the HR and BR for the subsequent interpretation of respiration and heartbeats.
(8)
Spectral estimation: FFT is conducted to obtain the corresponding BR and HR in N frame frequencies based on the waveform amplitude and characteristics.
(9)
Decision: respiration and frequencies are acquired for a certain period, wherein the HR and BR at that time are determined according to different confidence indicators, and the relationship between the HR and BR over time is obtained.
Table 1 shows the configuration parameters of the millimeter wave radar.

5. Experimental Validation

5.1. Experimental Platform and Environment

Information about the equipment and software used in this experiment are shown in Table 2.

5.2. Binocular Camera Target Detection and Tracking

The neural network adopted in this experiment was Yolo v5s, whose model profiles were identical to those of other Yolo v5 series networks, except for the depth_multiple and width_multiple. Yolo v5s boasts a one-deep depth and no module repetition, which enables a faster processing speed in large target recognition. The Yolo v5 loss function includes classification, localization, and confidence loss. The total loss function is the weighted sum of the three, and the confidence and classification loss in Yolo v5 are used. Binary cross entropy is used to process the information, and the positioning loss is determined by using the CIOU loss.
(1)
Yolo v5s training
The dataset used in this experiment is the data with the label name “person” in the public dataset PASCAL VOC. To enhance the recognition ability of the model when analyzing densely populated environments, we added 9000 dense pedestrian pictures that we collected ourselves. The dataset size and the number of pedestrians are shown in Table 3.
For the experiment, the dataset was divided into a training, verification, and test set in a ratio of 7:2:1.
We selected the Faster-RCNN and Yolo v3, v4, and v5s neural networks for comparison. The detection accuracy and running speed of the neural network are shown in Table 4.
During training, the Yolo v5sV5.0 neural network was used; namely, the Yolov5s pretraining weights were used, the training picture size was 640 × 640, the batch-size was set to 32, the Max-det was set to 1000, the Epochs were 100, and the mAP, Precision, Recall, and Loss of the training results are shown in Figure 9, Figure 10, Figure 11 and Figure 12.
After the iteration, the loss was about 0.04786, the final convergence value of the mAP was 0.70475, and the precision and recall converged at 0.79443 and 0.61314, respectively. The dense crowd test is shown in Figure 13.
The model detection performance was high and met the experimental requirements.
(2)
DeepSORT multitarget tracking algorithm
Existing mainstream target-tracking algorithms are based on a tracking-by-detection strategy; that is, they function in accordance with the detection results. This strategy is employed in DeepSORT to track a crowd in a multiperson environment, whereby the number marked on each box is a unique ID to identify a person.
DeepSORT processes each frame as follows:
Obtain bbox → generate detections → predict Kalman filter → match predicted tracks with detections in the current frame using the Hungarian algorithm (cascade and IOU matching) → Kalman filter update.
(3)
The tracking network was trained
The market-1501 dataset was used for training; it was collected and publicly released in 2015 within Tsinghua University campus. It consists of 1501 pedestrians captured by six cameras, including five high-definition cameras and one low-resolution camera, which resulted in a total of 32,668 pedestrian-bounding boxes. Each pedestrian was captured by at least two cameras, and multiple images of the same person may have been taken with different cameras. The training set contained 751 individuals with 12,936 images with an average of 17.2 training images per person, whereas the test set contained 750 individuals with 19,732 images with an average of 26.3 test images per person.
After partitioning the dataset, a feature extraction model was trained with 100 epochs. The tracking algorithms were evaluated using three metrics: multiple object tracking accuracy (MOTA), identification F1 (IDF1), and frame rate. The MOTA measures the performance of the tracker in object detection and trajectory maintenance, whereas IDF1 focuses more on the performance of the detector. IDF1 is used to assess the tracker’s ability to accurately track the same object in a video over a long period by calculating the proportion of correct initial identity numbers to all identity numbers appearing in the video. The frame rate reflects the processing speed. The evaluation results of the DeepSORT algorithm are shown in Table 5.
The evaluation results demonstrated that the tracking network could fulfill the tracking tasks in the experiments.
(4)
Detection and tracking processes
(a)
Target detection using Yolo v5s: target detection was performed on each image using the Yolo v5s neural network to identify the location and class of each target.
(b)
Preprocessing the detection results: the detection results were converted to the format required by the DeepSORT algorithm; that is, they were converted to the center coordinates and bounding box size of each coordinate.
(c)
Running the DeepSORT algorithm: each target was tracked by the DeepSORT algorithm, which requires an initialized target list; thus, the ID of each target must be manually specified in the first frame.
(d)
Target-state update: for each new frame, the detection results were matched with the tracking results of the previous frame to update the state of each target, whereby the state estimation and prediction were generally based on the Kalman filter.
(e)
Output: the tracking results were output onto the image.

5.3. Binocular Camera Ranging

(1)
Binocular parameter extraction
We captured 45 checkerboard images using a stereo camera setup, with both the left and right camera images containing distinct and complete checkerboard patterns, as shown in Figure 14.
The images captured by the stereo camera setup were segmented and imported into MATLAB’s stereo camera calibrator. In the stereo camera calibrator, the square size of the checkerboard was set to 40 mm. The stereo camera calibrator automatically discarded any images with excessive errors from the left and right camera pairs and performed the stereo calibration. Stereo camera calibration outputs camera internal reference matrix, camera distortion coefficient, camera rotation matrix, camera translation matrix and other parameters, see Table 6, Table 7, Table 8 and Table 9.
Focal length = 1396.84 (unit: mm).
Baseline distance (baseline) = 121.9064 (unit: mm).
(2)
Binocular camera calibration
The purpose of rectifying a stereo camera [20] is to apply mathematical projection transformations to the left and right views captured from the same scene so that the two image planes become coplanar and parallel to the baseline, a process that is commonly referred to as coplanar alignment. After rectification, the epipolar lines in the two images will be completely horizontal, which results in the pixel positions of the same point in space being aligned in the same row in both images. Once coplanar alignment is achieved, the distance can be calculated using the triangulation principle in stereo vision. The schematic diagram of binocular camera correction principle is shown in Figure 15.
(3)
Depth information acquisition
The feature points in the left and right images are matched and compared in terms of attributes to determine the corresponding matched pairs. For each matched point pair, a parallax is obtained by calculating the corresponding pixel distances in the left and right images. The parallax, which is inversely proportional to the object distance, is the difference in the image position of the same object between two viewpoints. Based on the parallax and parameters, an object’s distance can be calculated using triangulation or other methods:
d e p t h = f × b d + ( c x r c x l )
where  f  represents the focal length (in pixels),  b  denotes the baseline length,  d  signifies the disparity, and  c x r  and  c x l  are the column coordinates of the principal points of the two cameras.
As per the above equation, the depth accuracy of a pixel depends on the accuracy of the estimated disparity (d) at that pixel. Assuming a constant error in the disparity estimation, the depth accuracy deteriorates as the measured distance increases, which causes stereo cameras to be less suitable for measuring distant objects. To obtain reliable depth estimates for distant targets, the baseline distance of the cameras needs to be increased, but larger baseline distances result in smaller overlapping regions and greater content differences between left and right views, which, in turn, increases the difficulty of stereo matching. Cameras with larger focal lengths can be chosen, but larger focal lengths result in a smaller field of view, which makes it challenging to estimate the distance of objects close to the cameras. Therefore, for our experiment, human bodies were detected at distances ranging from 0.3 to 3 m.

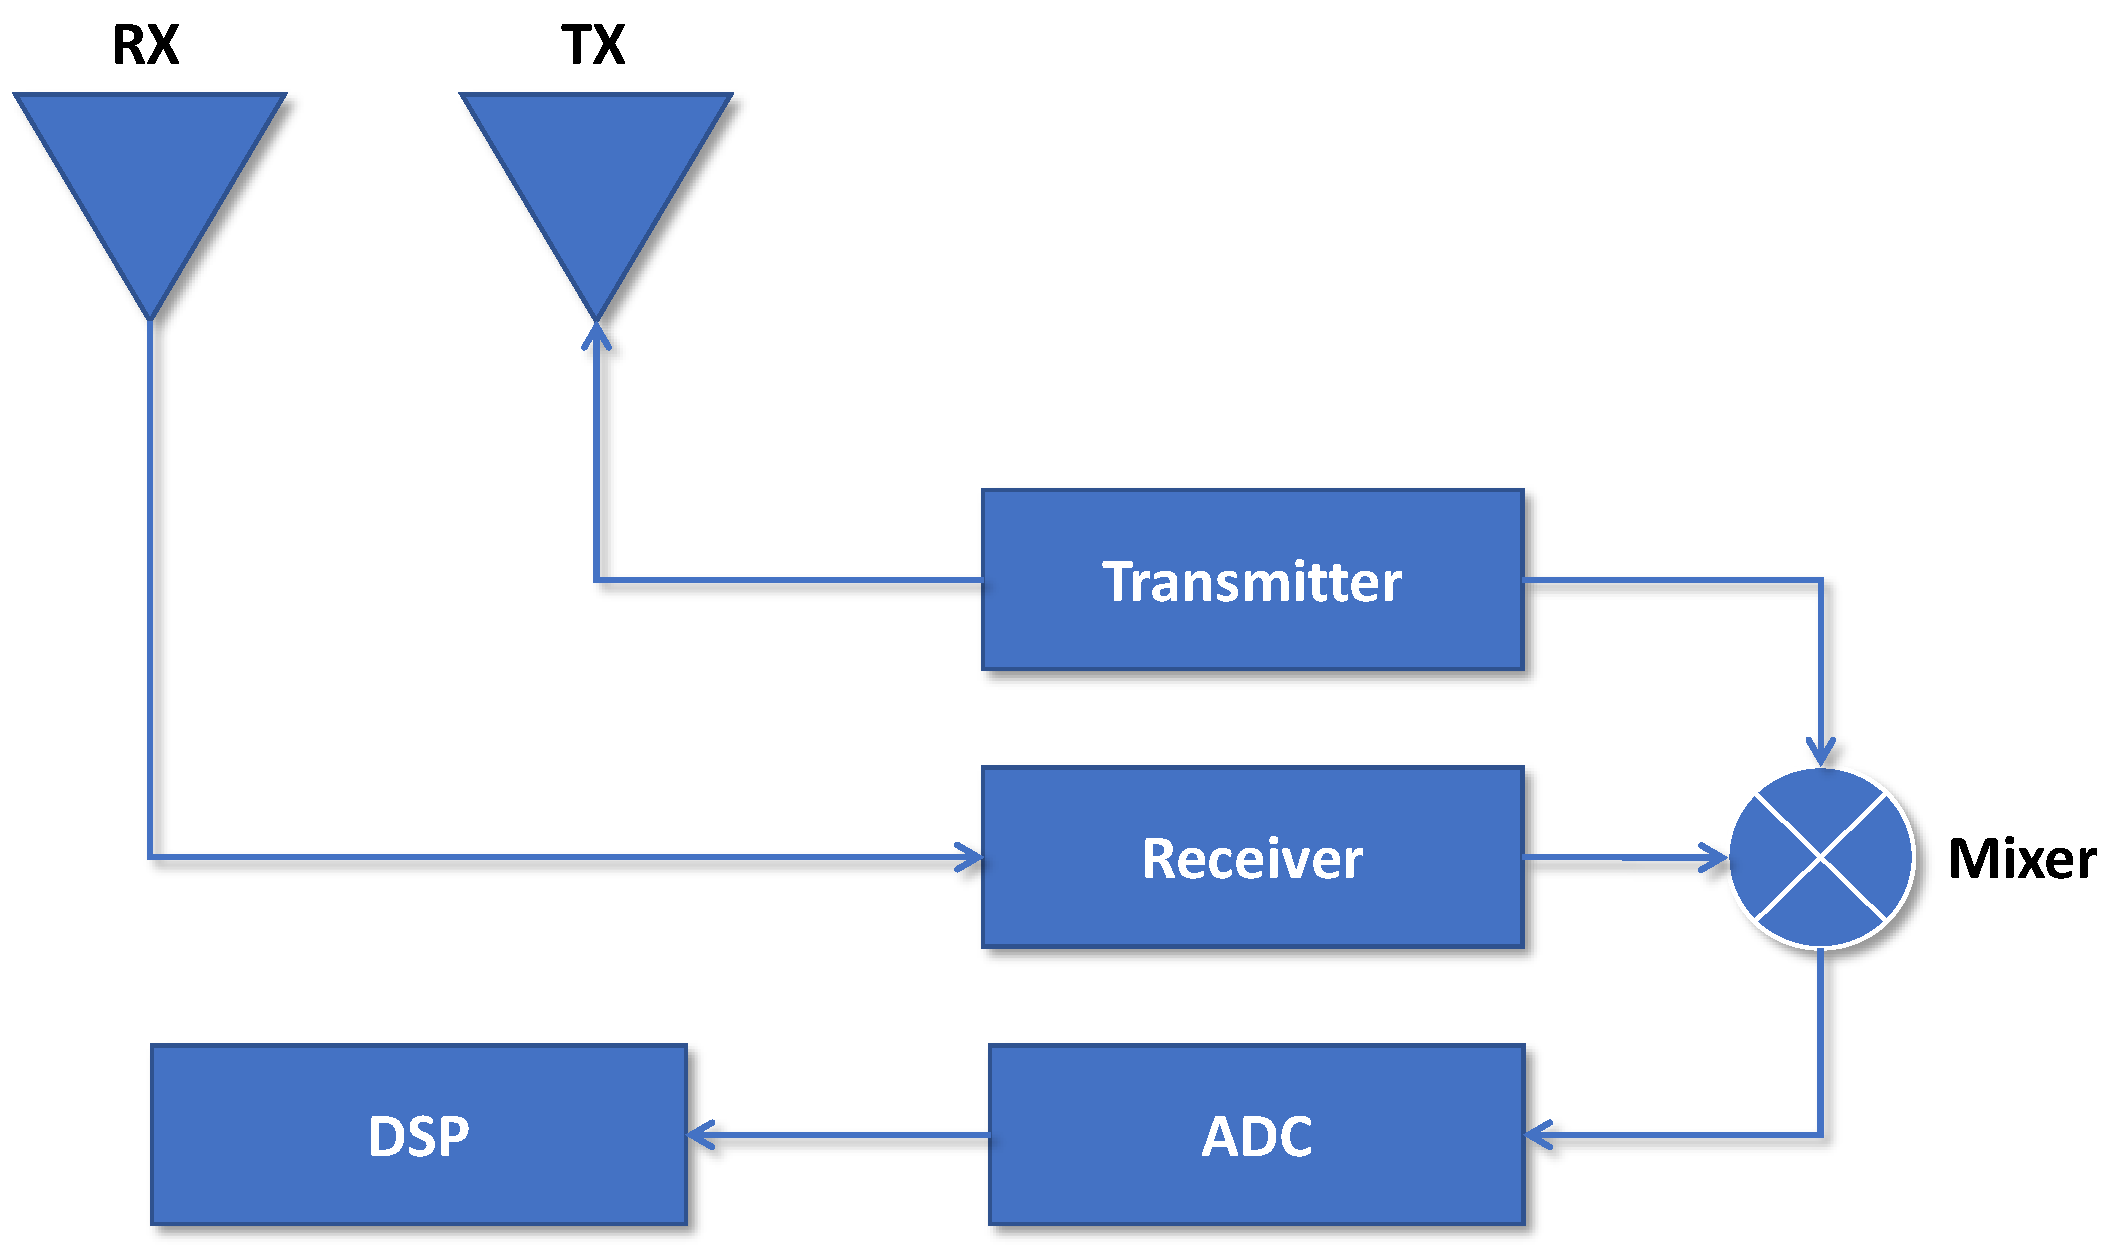
5.4. Millimeter Wave Radar Vital Sign Processing

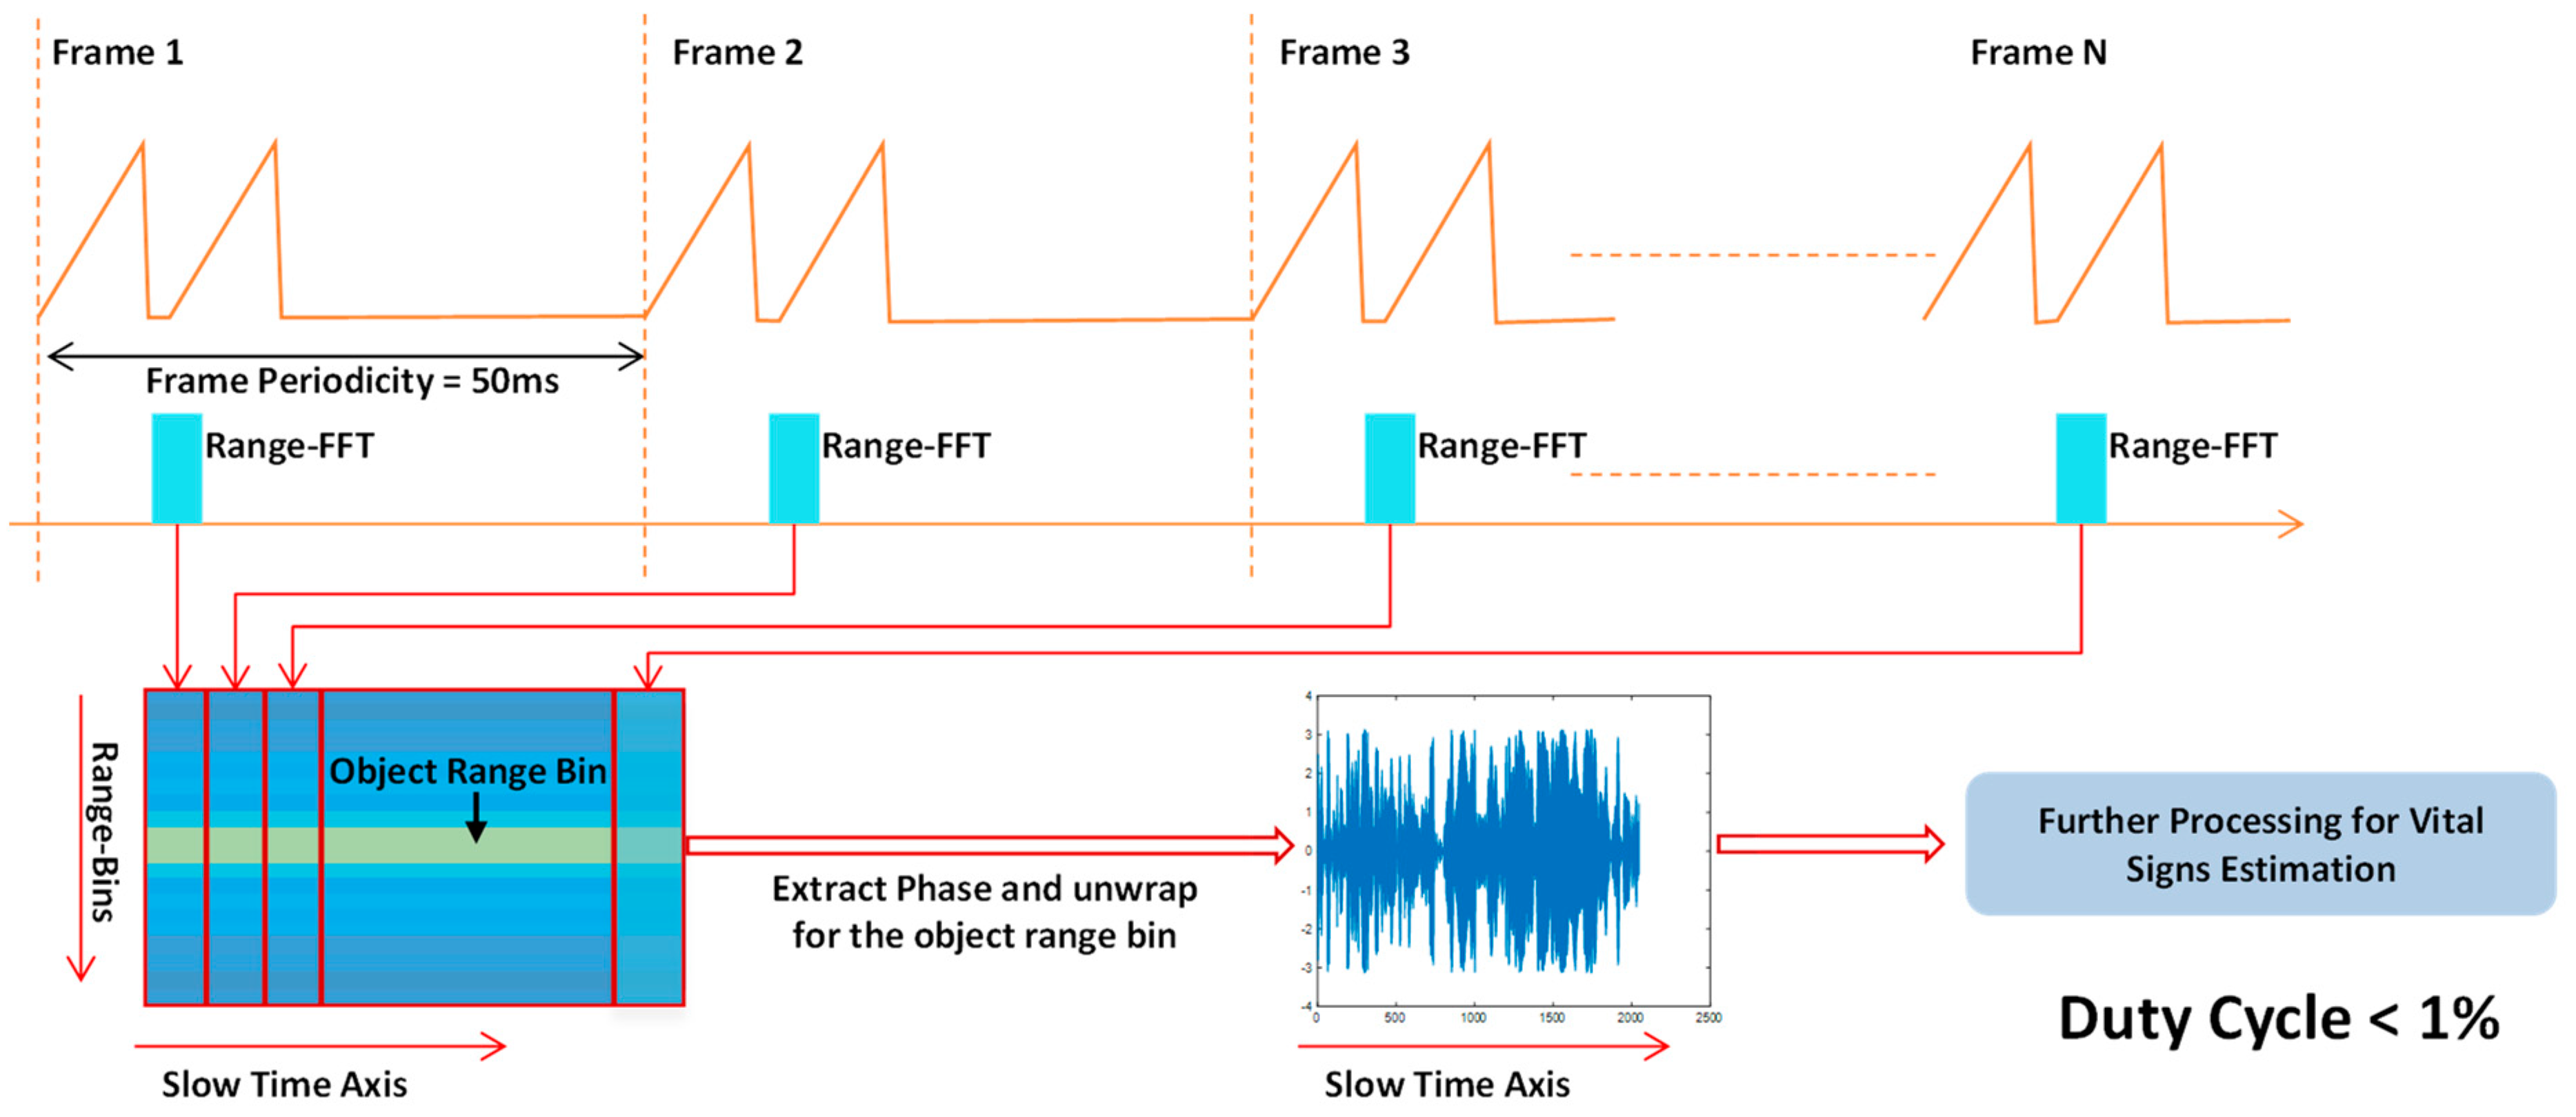
The radar evaluation board utilized in this experiment was an IWR1642Boost produced by TI. The starting frequency of the transmit signal was set to 77 GHz, the FM slope was designated as 70.006 MHz/s, the number of samples per chirp was 200, the sampling rate was 4000 ksps, the frame periodicity was set to 50 ms, and each frame contained 1024 chirp signals. The mode was one send and four received. In the experiment, IWR1642 [21] and DCA1000 [22] were used to collect vital information on the streaming data mode.
(1)
Determine the position of the human body.
Targets 1 and 2 were detected by the binocular camera, and the distances were 1.67 and 2.74 m, respectively, as shown in Figure 16.
(2)
Radar signal processing.
In the range-dimensional FFT of the raw data received by the radar, multiple targets were in the range-dimensional FFT, as shown in Figure 17.
Because the distance resolution of the radar was 0.049 m, the frequency spectrum was centered on 1.67 and 2.74 m, the range was ±0.05 m to search, the point of maximum energy was taken as the target to be measured, and finally, the distances were determined to be 1.67 and 2.70 m. The spectral peak was the target to be measured and the range gate was locked, as shown in Figure 18.
The phase information of targets 1 and 2 was extracted, and then phase unwrapping was performed and phase differences were determined to obtain the relationship between the phase and the number of sampling points, as shown in Figure 19.
The results of medical research regarding the breathing, heartbeat displacement, and frequency parameters of ordinary adults are shown in Table 10.
BR (0.1~0.5 Hz) and HR (0.8~2.0 Hz) filters were established; the respiratory signal was separated first, as shown in Figure 20. And its spectrum was estimated, as shown in Figure 21.
By calculating the data, we found that the respiratory rates of targets 1 and 2 were 22 and 26, respectively.
Then, the HR filter was used to separate the heartbeat signal, and a spectrum estimation was performed, as shown in the Figure 22 and Figure 23.
The heartbeat frequencies of targets 1 and 2 were 81 and 94, respectively.
The positions of targets 1 and 2 were changed, the corresponding target life signals continued to be detected, and life signal models were established for targets 1 and 2, as shown in the Figure 24 and Figure 25.
The life signals of the two targets could still be separated after the position changed. The farther the distance was, the smaller the detected phase change was, and the smaller the calculated amplitude was.
(3)
Performance comparison between respiratory and heart rate.
To verify the accuracy and effectiveness of the method, the radar sensor and the binocular camera were used to collect 10 groups of 30-s heartbeat and breathing data in a two-person, general indoor environment, and the proposed method was used to calculate the breathing and heartbeat frequency. Additionally, we compared the data with the breathing frequency collected by a breathing sensor and the heartbeat frequency collected by a smart bracelet. The results are shown in Table 11.
We used the Pearson correlation coefficient (PCC) to compare the data collected with our method and contact equipment [23], whereby the PCC value ranged from 0 to 100%; 0 indicates that the two are completely uncorrelated, and 100% indicates that the two are completely correlated. The results are shown in Table 10.
The vital signal data calculated by using the proposed method were very close to the data detected by the wearable sensors, and the correlation was high. The matching rate (PCC value) of the breathing rate obtained with the sensor and by using the proposed method reached 84.9%, and the matching rate (PCC value) of the heartbeat frequency obtained by using the proposed method and the smart bracelet reached 93.6%. The results showed that the noncontact life signal detection method using an FMCW millimeter wave radar and binocular camera can be used to complete noncontact detection tasks in an indoor environment and to match multiple targets with life signals within the detection range.

6. Conclusions

We propose a method of using binocular vision to determine the range of the noncontact life signal detection of a 77 GHz millimeter wave radar; this involves the use of the Yolo v5s neural network to identify individuals, perform feature extraction, track features with the DeepSORT algorithm, and detect the depth information of the target. The depth information is used to calculate the life signals. The experimental results showed that the proposed method can be used to distinguish and register different individuals in an indoor environment with multiple living targets, reduce the blindness of noncontact life signal detection based on a millimeter wave radar when processing signals in a multitarget environment, increase the detection directivity, and reduce some of the computational load of the algorithm. When the human body is in a state of motion or violent shaking, the proposed method results in data with a large error when extracting life signals, and it cannot be used to effectively detect breathing and heartbeat signals. Our future research will focus on extracting life signals in a state of motion. The general chest-facing amplitude and the breathing chest-facing amplitude will be studied to increase the accuracy of the algorithm.

Author Contributions

Conceptualization, J.D.; methodology, J.D. and J.Y.; software, J.D.; experiments, J.D. and J.Y.; formal analysis, J.D.; writing—original draft preparation, J.D.; writing—review and editing, J.D. and Y.Q.; supervision, J.D.; project administration, J.D.; funding acquisition, Y.Q. All authors have read and agreed to the published version of the manuscript.

Funding

This work was supported in part by the Innovation and Entrepreneurship Training Program for College Students of Inner Mongolia University of Technology (No. 2022023003), Regional Programs of the National Natural Science Foundation of China under Grant 52064039, the General Project of the Natural Science Foundation of Inner Mongolia Autonomous Region under Grant 2021MS06004, and the Fundamental Scientific Research Projects of Colleges and Universities Directly Under the Inner Mongolia Autonomous Region under Grant JY20220174. This work was also supported by the Major Science and Technology Special Project of Inner Mongolia Autonomous Region 2019ZD022.

Institutional Review Board Statement

Not applicable.

Informed Consent Statement

Not applicable.

Data Availability Statement

Not applicable.

Conflicts of Interest

The authors declare no conflict of interest.

References

  1. Shafiq, G.; Veluvolu, K.C. Surface chest motion decomposition for cardiovascular monitoring. Sci. Rep. 2014, 4, 5093. [Google Scholar] [CrossRef] [PubMed]
  2. Liu, T.; Yang, Z.; Marino, A.; Gao, G.; Yang, J. Joint Polarimetric Subspace Detector Based on Modified Linear Discriminant Analysis. IEEE Trans. Geosci. Remote Sens. 2022, 60, 5223519. [Google Scholar] [CrossRef]
  3. Hua, X.; Peng, L.; Liu, W.; Cheng, Y.; Wang, H.; Sun, H.; Wang, Z. LDA-MIG Detectors for Maritime Targets in Nonhomogeneous Sea Clutter. IEEE Trans. Geosci. Remote Sens. 2023, 61, 5101815. [Google Scholar] [CrossRef]
  4. Winkler, V. Range Doppler detection for automotive FMCW radars. In Proceedings of the 2007 European Radar Conference, Munich, Germany, 9–12 October 2007; pp. 166–169. [Google Scholar] [CrossRef]
  5. Liu, Y.; Weisberg, R.H.; Merz, C.R. Assessment of CODAR SeaSonde and WERA HF radars in mapping surface currents on the West Florida Shelf. J. Atmos. Ocean. Technol. 2014, 31, 1363–1382. [Google Scholar] [CrossRef]
  6. Marshall, H.-P.; Koh, G. FMCW radars for snow research. Cold Reg. Sci. Technol. 2008, 52, 118–131. [Google Scholar] [CrossRef]
  7. Li, C.; Lin, J.; Xiao, Y. Robust overnight monitoring of human vital signs by a non-contact respiration and heartbeat detector. In Proceedings of the 2006 International Conference of the IEEE Engineering in Medicine and Biology Society, New York, NY, USA, 30 August–3 September 2006; pp. 2235–2238. [Google Scholar]
  8. Yang, Z.; Yang, Z.; Liang, F.; Li, Z.; Lv, H.; Xue, H.; Zhang, H.; Wang, J. Research of multi-target identification method using mono-static life detection radar. Chin. Med. Equip. J. 2018, 39, 9. [Google Scholar]
  9. Hua, Z.; Lu, G.; Jing, X.; Wang, H.; Lv, H.; Jiao, T.; Zhang, Y.; Yu, X.; Zhang, X.; Zhang, P.; et al. Noncontact measurement of heartbeat signal via Doppler radar using adaptive filtering. Chin. Med. Equip. J. 2012, 33, 36. [Google Scholar]
  10. Sharpe, S.M.; Seals, J.; MacDonald, A.H.; Crowgey, S.R. Non-Contact Vital Signs Monitor. U.S. Patent 4,958,638, 25 September 1990. [Google Scholar]
  11. Park, B.; Boric-lubecke, O.; Lubecke, V.M. Arctangent demodulation with DC offset compensation in quadrature Doppler radar receiver systems. IEEE Trans Microw Theory Tech. 2007, 55, 1073–1079. [Google Scholar] [CrossRef]
  12. Langjuan, L.; Qia, Z. Research on noncontact life signal detection method. Chin. Med. Equip. J. 2021, 42, 8–13 + 19. [Google Scholar] [CrossRef]
  13. Liu, Z.; Gu, X.; Chen, J.; Wang, D.; Chen, Y.; Wang, L. Automatic recognition of pavement cracks from combined GPR B-scan and C-scan images using multiscale feature fusion deep neural networks. Autom. Constr. 2023, 146, 104698. [Google Scholar] [CrossRef]
  14. Liu, Z.; Yeoh, J.K.; Gu, X.; Dong, Q.; Chen, Y.; Wu, W.; Wang, L.; Wang, D. Automatic pixel-level detection of vertical cracks in asphalt pavement based on GPR investigation and improved mask R-CNN. Autom. Constr. 2023, 146, 104689. [Google Scholar] [CrossRef]
  15. Sha, J.; Wang, J.; Hu, H.; Ye, Y.; Xu, G. Development of an Accurate and Automated Quality Inspection System for Solder Joints on Aviation Plugs Using Fine-Tuned YOLOv5 Models. Appl. Sci. 2023, 13, 5290. [Google Scholar] [CrossRef]
  16. Johnston, S.L. Millimeter Wave Radar; Artech House, Inc.: Dedham, MA, USA, 1980. [Google Scholar]
  17. Liu, Z.; Chen, T. Distance measurement system based on binocular stereo vision. In Proceedings of the 2009 International Joint Conference on Artificial Intelligence, Hainan Island, China, 25–26 April 2009; pp. 456–459. [Google Scholar]
  18. Wang, C.-Y.; Liao, H.-Y.M.; Wu, Y.-H.; Chen, P.-Y.; Hsieh, J.-W.; Yeh, H. CSPNet: A new backbone that can enhance learning capability of CNN. In Proceedings of the 2020 IEEE/CVF Conference on Computer Vision and Pattern Recognition Workshops, Seattle, WA, USA, 14–19 June 2020; p. 19854564. [Google Scholar]
  19. Wojke, N.; Bewley, A.; Paulus, D. Simple online and realtime tracking with a deep association metric. In Proceedings of the 2017 IEEE International Conference on Image Processing (ICIP), Beijing, China, 17–20 September 2017; pp. 3645–3649. [Google Scholar]
  20. Bradley, D.; Heidrich, W. Binocular camera calibration using rectification error. In Proceedings of the 2010 Canadian Conference on Computer and Robot Vision, Ottawa, ON, Canada, 31 May–2 June 2010; pp. 2010183–2010190. [Google Scholar]
  21. IWR1642 Single-Chip 76-GHz to 81-GHz mmWave Sensor Integrating DSP and MCU Evaluation Module. Available online: http://www.ti.com/tool/IWR1642BOOST (accessed on 10 May 2023).
  22. DCA1000EVM Real-Time Data-Capture Adapter for Radar Sensing Evaluation Module. Available online: http://www.ti.com/tool/DCA1000EVM (accessed on 10 May 2023).
  23. Wang, Y.; Wang, W.; Zhou, M.; Ren, A.; Tian, Z. Remote Monitoring of Human Vital Signs Based on 77-GHz mm-Wave FMCW Radar. Sensors 2020, 20, 2999. [Google Scholar] [CrossRef] [PubMed]
Figure 1. Block diagram of millimeter wave radar system.
Applsci 13 06270 g001
Figure 2. FMCW signal schematic.
Applsci 13 06270 g002
Figure 3. Binocular camera ranging schematic.
Applsci 13 06270 g003
Figure 4. Block diagram of system flow.
Applsci 13 06270 g004
Figure 5. Yolo v5s structure diagram.
Applsci 13 06270 g005
Figure 6. DeepSORT algorithm flow block diagram.
Applsci 13 06270 g006
Figure 7. Binocular camera ranging principles.
Applsci 13 06270 g007
Figure 8. Vital sign processing flow.
Applsci 13 06270 g008
Figure 9. mAP.
Figure 9. mAP.
Applsci 13 06270 g009
Figure 10. Precision.
Applsci 13 06270 g010
Figure 11. Recall.
Figure 11. Recall.
Applsci 13 06270 g011
Figure 12. Loss.
Figure 12. Loss.
Applsci 13 06270 g012
Figure 13. Dense pedestrian recognition test.
Applsci 13 06270 g013
Figure 14. Shooting checkerboard.
Applsci 13 06270 g014
Figure 15. Binocular camera calibration.
Applsci 13 06270 g015
Figure 16. Human recognition detection.
Applsci 13 06270 g016
Figure 17. Range FFT spectrum.
Applsci 13 06270 g017
Figure 18. Search results of spectrum peaks.
Applsci 13 06270 g018
Figure 19. Phase difference. (a) Target 1 phase difference. (b) Target 2 phase difference.
Applsci 13 06270 g019
Figure 20. Respiratory time-domain waveform. (a) Respiratory time-domain waveform of target 1. (b) Respiratory time-domain waveform of target 2.
Applsci 13 06270 g020
Figure 21. Respiratory signal FFT. (a) Respiratory signal FFT of target 1. (b) Respiratory signal FFT of target 2.
Applsci 13 06270 g021
Figure 22. Heartbeat time-domain waveform. (a) Heartbeat time-domain waveform of target 1. (b) Heartbeat time-domain waveform of target 2.
Applsci 13 06270 g022
Figure 23. Heartbeat signal FFT. (a) Heartbeat signal FFT of target 1. (b) Heartbeat signal FFT of target 2.
Applsci 13 06270 g023
Figure 24. Respiratory time-domain signal model. (a) Respiratory time-domain signal model of target 1. (b) Respiratory time-domain signal model of target 2.
Applsci 13 06270 g024
Figure 25. Heartbeat time-domain signal model. (a) Heartbeat time-domain signal model of target 1. (b) Heartbeat time-domain signal model of target 2.
Applsci 13 06270 g025
Table 1. Chirp parameters.
ParametersTypical Values
Bandwidth4 GHz
Fc (starting frequency)77 GHz
Fs (slow time axis sampling)20 Hz
Fs_ADC (ADC sampling rate)2 MHz
N (samples per chirp)100 samples
Tc (chirp duration)50 us
Table 2. Equipment and software information.
Software and HardwareVersion
Operating systemWindows11
CPUi7-13700K
GPUNVIDIA GeForce RTX 3080Ti
CUDA12.0
Pytorch version11.8
Python version3.9
SoftwarePyCharm2021
MATLABR2022b
Binocular cameraZED
Radar test boardIWR1642boost
Real-time data capture moduleDCA1000EVM
Table 3. Experimental pedestrian dataset.
DatasetTraining SetNumber of Pedestrians
VOC17,1254374
Ours90003489
Table 4. Test results of different neural networks on the dataset.
AlgorithmmAP (%)FPS
Faster-RCNN58.9-
Yolo v355.035
Yolo v465.433
Yolo v5s70.540
Table 5. Evaluation results.
AlgorithmMOTA/%IDF1/%Frame Rate/Frame ×  s 1  
DeepSORT73.572.942.3
Table 6. Camera internal parameter matrix.
Left CameraRight Camera
Value707.893700707.878200
−1.2556708.44190−1.1673708.19750
642.5495361.19681.0000635.0269355.59851.0000
Table 7. Camera distortion coefficient (k1, k2, p1, p2, k3).
k1k2p1p2k3
Left camera−0.173010.02678−0.00063−6.087680.00027
Right camera−0.177500.03115−0.00050.00002−0.00131
Table 8. Camera rotation matrix.
Camera Rotation Matrix
Value0.9999−0.0015−0.0120
0.00151.0000−0.0007
0.01200.00060.9999
Table 9. Camera translation matrix.
Camera Translation Matrix
Value−121.90640.0832−0.0007
Table 10. Adult respiratory and heartbeat parameters.
Characteristic SignalFrequencyPositive Detection RangeBack Detection Range
Breath0.1~0.5 Hz1~12 mm0.1~0.5 mm
Heartbeat0.8~2.0 Hz0.1~0.5 mm0.01~0.2 mm
Table 11. Comparison of the data collected with the proposed method and the contact equipment used to collect life signals.
Serial NumberTarget 1Target 2
Respiratory RateHeart RateRespiratory RateHeart Rate
Breath SensorProposed Method Smart BraceletProposed Method Breath SensorProposed Method Smart BraceletProposed Method
11716768319218184
21821819319177280
32122879818207982
421246879181994104
520218396172092100
62426697823249396
71819748417218793
817198910118197683
919229010020228798
102326737823246779
Note: in the table, the PCC between the data collected with the proposed method and the respiratory frequency detected by the breathing sensor is 84.9%, and the PCC between the data collected with this method and the heartbeat frequency detected by the smart bracelet is 93.6%.
Disclaimer/Publisher’s Note: The statements, opinions and data contained in all publications are solely those of the individual author(s) and contributor(s) and not of MDPI and/or the editor(s). MDPI and/or the editor(s) disclaim responsibility for any injury to people or property resulting from any ideas, methods, instructions or products referred to in the content.

