Abstract
Laser surface treatment conducted at different power levels is an option to modify titanium bone implants to produce nano- and microtopography. However, such processing can lead to excess mechanical stress within the surface layer. This research aims to calculate the level of such residual stresses after the surface processing of Ti grade IV, Ti15Mo, and Ti6Al7Nb alloys with an Nd:YAG laser. Light and scanning electron microscopies (SEM), energy-dispersive X-ray spectroscopy (EDS), X-ray diffractometry (XRD), optical profilography, and nano-indentation tests were applied to characterize the surface zone. The laser processing resulted in a distinct surface pattern and the formation of remelted zones 66–126 µm thick, with roughness values ranging between 0.22 and 1.68 µm. The mechanical properties were weakly dependent on the material composition. The residual stresses caused by the laser treatment were moderate, always tensile, increasing with loading, and was the highest for the Ti15Mo alloy.
1. Introduction
Aging societies increasingly encounter several health problems, including an increase in malfunctions of skeletal and dental systems. Therefore, joint and dental implants composed totally or in part of titanium and its alloys, have become very common. However, in particular, among older people, different risks can appear, such as a prolonged time of formation of the interface implant tissue, insufficient contact surface between an implant and bone, and a too weak adhesion. For this reason, all commercial titanium implants are subjected to surface modifications, mainly acidic and alkaline etching or oxidation or both for dental implants and spray deposition of hydroxyapatite for hip-joint endoprostheses. There is also a high number of other surface modifications aimed at changing surface topography and morphology, in particular, by electrophoretic deposition [1]. Among them, together with the development of more and more subtle instruments, laser surface treatment (ablation) has become increasingly popular as a technique improving the mechanical behavior of the surface, hydrophilicity, osseointegration, and even enhancing antibacterial efficiency [2,3,4,5,6,7].
There are different laser-based techniques used to modify the surfaces, such as laser melting and cladding, ablation, laser-induced periodic surface structuring (LIPSS), laser-engineered net shaping (LENS), direct laser interference patterning (DLIP), and laser surface hardening [2,3,8]. The main objective of laser modification is structuring the surface at the micro- and nanoscales, by producing different surface architectures, such as grooves and pillars. For such a purpose, different lasers are utilized, mainly including Ytterbium fiber, Nd: glass, Ti-sapphire, and diode lasers.
The laser action unequivocally influences the surface topography. Surface structures can be modeled from micro-grooves to micro-protrusions by setting up the selected processing parameters [9], simultaneously increasing the roughness. Using femtosecond laser line scanning, textured surfaces are created with some microcracks [10]. Cavities sized 20–30 nm were generated by laser irradiation [11].
The laser treatment changed the mechanical properties of the surface layer increasing the microhardness and toughness, and causing degradation under local loading [12,13]. The laser texturing also influenced surface residual stresses [14] and laser-nitrided treatment caused compressive stress, as demonstrated by the cracks that developed in the nitrided layer [15], and also residual tensile stress [16].
The most important process parameters shaping the topography include laser power, the number of pulses, and laser spot [14]. The laser’s lower speed and higher number of scans increase the roughness [2]. However, in [17], the increase in tensile strength, but not in Young’s modulus and microhardness values, were observed. In contrast, in the other research [18], the surface microhardness was shown to increase following laser treatment from 351 to 445 HV. The fiber laser, when applied for remelting a Ti6Al4V surface, created the appearance of a smooth, glossy, and crack-free surface. No distinct correlation between mechanical and tribological behaviors was observed in the nano-indentation tests [19].
Laser treatment can also affect wettability. A hydrophilic titanium surface was obtained using a femtosecond laser [9]. The hydrophilic surface was observed after modification with a femtosecond laser, with the water contact angle decreasing with the increasing laser fluence [10]. In the other research, all samples exhibited super-hydrophilic properties [16]. Two types of titanium surfaces were fabricated by femtosecond laser irradiation and the laser-treated surface was then subjected to either NaOH hydrothermal or H2O2 oxidation treatments; the former surface was hydrophilic and the latter surface changed to superhydrophobic after 50 days of exposure. The changes in contact angle values were supposed to result from the adsorption of organic compounds present in the atmosphere [20]. For the nitride layer on the titanium alloy subjected to the action of a nanosecond laser, the wettability of microtextured samples was improved. The increasing hydrophilicity caused by laser irradiation was often observed and ascribed to the presence of a complex topography with numerous ripples, nanopillars, and microcolumns on the titanium surfaces [2,3].
Corrosion was seldom investigated. In [21], the laser-textured titanium alloy showed improved corrosion resistance.
The chemical composition was slightly related to the laser action. After laser processing, the oxygen content was higher in the micro-protrusion than in the micro-groove [9]. Excessive oxygen was appointed within the subsurface layer [16,22]. Thus, the laser treatment enhanced the transformation of Ti and Ti2O3 into TiO2 within the surface layer [16].
The osteogenic activity expressed by cell proliferation and differentiation was shown to be improved by the femtosecond laser, the effect attributed to reduced Young’s modulus and the microhardness of titanium due to an appearance of voids on the subsurface layer, which originated from cavitation during conditions of high tensile stresses and temperatures [23]. The considerable absence of torque after osseointegration was observed for the titanium alloy treated using laser techniques [22]. However, in [11], for the nanostructured titanium surface coated with either TiNbN or subjected to titanium plasma spraying, all implants were osseointegrated and there were noted differences in both the pull-out force and in the bone-tissue volume ratio between irradiated and non-laser-treated specimens. On the contrary, for a few different studies, higher bone–implant contact (BIC) relative values and removal torque values were reported [23]. Cell activity was reduced and cell proliferation retarded on a surface with a superhydrophilic angle and Sa of 10.96 μm [16]. The generated-by-laser topographical changes optimized the protein-absorption process [24].
The bioactivity expressed by the apatite-forming ability in immersion tests in the simulated body fluid was ameliorated by Yb fiber laser treatment in wet conditions [25].
The antibacterial effect was observed several times for laser-treated titanium. For the femtosecond laser and LIPSS approach, the anti-adhesive properties of Porphyromonas gingivalis, Streptococcus mutans, and Porphyromonas gingivalis were observed [26]. Moreover, the authors claimed that, simultaneously, the modified surface improved the adhesion of gingival tissue. The use of the DLIP technique with several lasers working together can adjust the surface topography and manipulate osteoblasts and bacteria attachment [2,3].
So far, the research has focused on the influence of laser treatment on different process parameters, such as laser power, continuous or pulse modes, and scan rate, on the surface characteristics. The studies have almost been exclusively limited to titanium and Ti6Al4V alloys. This study investigates whether and to what extent the chemical and phase compositions of laser-processed titanium substrate affect the mechanical properties and residual stresses within the surface layer, an issue not often investigated. Titanium and two of its alloys were tested, after laser processing, and heat-treated after laser melting. The roughness, hardness, and intrinsic stresses at different distances from the surface were measured. The previous measurements [27] were performed on similar materials demonstrating that high tensile stresses are obtained in the surface layers after short-pulse laser treatment. In these studies, the materials used—titanium alloys Ti7Nb6Al and Ti15Mo—are a novelty. The obtained results confirm the formation of tensile stresses in the layers remelted with the Nd:YAG laser.
2. Materials and Methods
2.1. Materials
Samples composed of three different materials were used for the tests: Ti grade IV, Ti7Nb6Al, and Ti15Mo. Their chemical compositions and mechanical properties (A—elongation, R0,2—plasticity, Rm—strength) are presented in Table 1 and Table 2, based on certificates obtained from ChM Ltd. Białystok, Polska. The delivered materials had dimensions of 10 mm × 10 mm × 5 mm.

Table 1.
The chemical composition of samples (based on the manufacturer’s certificates).
Table 2.
Selected mechanical properties of Ti grade IV, Ti7Nb6Al, and Ti15Mo samples (based on the manufacturer’s certificates).
2.2. Sample Preparations
The samples were wet-ground (Saphir 330, ATM GmbH, Mammelzen, Germany) to a final grit of #800 with SiC sandpaper (Struers, Kraków, Poland) and then cleaned with distilled water. Cross-sections were prepared to test the thickness of the remelted surface layers; they were ground, then polished to a final grit of #2000, and etched with Kroll’s reagent (0.06 mL HF and 0.2 mL HNO3 supplemented with distilled water to 50 mL).
2.3. Laser Modification
Laser modification was performed using a short-pulse Nd:YAG laser (Trulaser Station 5004, TRUMPF, Dizingen, Germany). Samples composed of technically pure titanium Ti grade IV (LT1) and Ti7Nb6Al (LT2) and Ti15Mo (LT3) alloys were subjected to laser modification using the process parameters shown in Table 3. Argon 5.0 was used (Linde Gaz Poland Ltd., Kraków, Poland) to limit surface oxidation during laser processing.
Table 3.
The laser treatment parameters.
2.4. Analysis of Topography, Chemical and Phase Compositions, and the Thickness of the Surfaces Layers
The analysis of the surface topography of the samples and the assessment of the thickness of the melted surface layers of the samples were performed using a scanning electron microscope (SEM JEOL JSM-7800 F, JEOL Ltd., Tokyo, Japan). The thickness of the surface layer was measured on the etched (Kroll reagent) cross-section using SEM microscope software. The analysis of the chemical composition on the surface of the samples and the cross-sections of the melted surface layers was performed using an SEM microscope attachment—(EDS) X-ray energy-dispersion spectrometer (Octene Elite 25, EDAX, Mahwah, NJ, USA).
To determine the phases present in the materials, XRD (X-ray diffraction) analysis was conducted using an X’PERT-PRO (PHILIPS, Almelo, The Netherlands) diffractometer with a copper lamp. The phase composition of the surface was determined by the X-ray method using Cu Kα radiation, with a radiation wavelength of λKα1 = 0.15406 nm, and λKα2 = 0.15444 nm.
2.5. Roughness Tests
The surface roughness values of samples subjected to laser treatment were measured. The JENOPTIK (Hommel Etamic Waveline, Jena, Germany) profilograph was used for the study. The mapping section was 7 mm, the measurement speed was 5 mm/s, and the distance between the measurement points was 0.5 µm. The test was conducted six times for each sample, and the average value of the Ra coefficient was determined along with the standard deviation.
2.6. Heat Treatment
The parameters of heat treatment were selected for each material based on the manufacturer’s certificates. Table 4 presents the adopted heat treatment parameters. We heated a vacuum furnace PTF 15/75/610 (Protherm Furnaces, Ankara, Turkey) with a power of 7000 W, with the same temperature increase for all samples—100 °C during 3600 s. The samples were slowly cooled in the furnace to room temperature.
Table 4.
Heat treatment parameters.
2.7. Mechanical Tests
Nano-indentation tests were performed using a nano-indenter NanoTestTM Vantage (MicroMaterials, Wrexham, Great Britain) with a Berkovich diamond indenter. Tests were performed for base material (BM), BM after annealing, laser treatment (LT), and LT after annealing samples. For each sample tested, 25 (5 × 5) independent measurements with a distance between each indentation of 30 µm in both axes were performed. Measurements were performed for two maximum force values: 50 and 200 mN. For both force values, the loading time was 20s, the holding time with the maximum force value was 5s, and the unloading time was 20s. To convert the reduced Young’s modulus into Young’s modulus, the Poisson’s ratio value for the test material was assumed as 0.23.
2.8. Analysis of Residual Stress
The nano-indentation method was used to evaluate residual stresses. The tests were performed for Ti, Ti15Mo, and Ti7Nb6Al as base materials (BMs), after laser treatment (LT) and heat treatment, i.e., stress relieving annealing [28]. Based on each series of measurements, the average value of the force acting on the sample was determined for a depth of 300 nm. The penetration value was the same for both the 50 and 200 mN force setpoints. The next step in determining the internal stresses was to calculate the surface area of the Berkovich indentation [29].
where:
- P—indentation load;
- H—indentation displacement;
- θ—the half-apex angle of the conical indenter;
- ht—maximum depth of the indenter during measurements;
- hr—depth of indentation for a force equal to 0.
Internal stresses were determined as the load difference’s quotient and the indenter’s surface area. The difference was determined as the load before and after the stress relieving of the samples. Formula (5) was used [28]:
where:
- ∆P—load difference causing the same displacement of the indenter (for samples before and after stress relief annealing),
- A—surface area of the Berkovich indenter impression.
The forces at set depths and resultant residual stresses were calculated as the means of 25 measurements for any alloy, load value, and the presence or absence of laser treatment. As the standard deviations of arithmetic means were very high and no normal distribution of data could appear, in addition to the means, the medians, i.e., middle numbers of 25 measured values, were also found.
3. Results and Discussion
3.1. Surface Topography and Composition
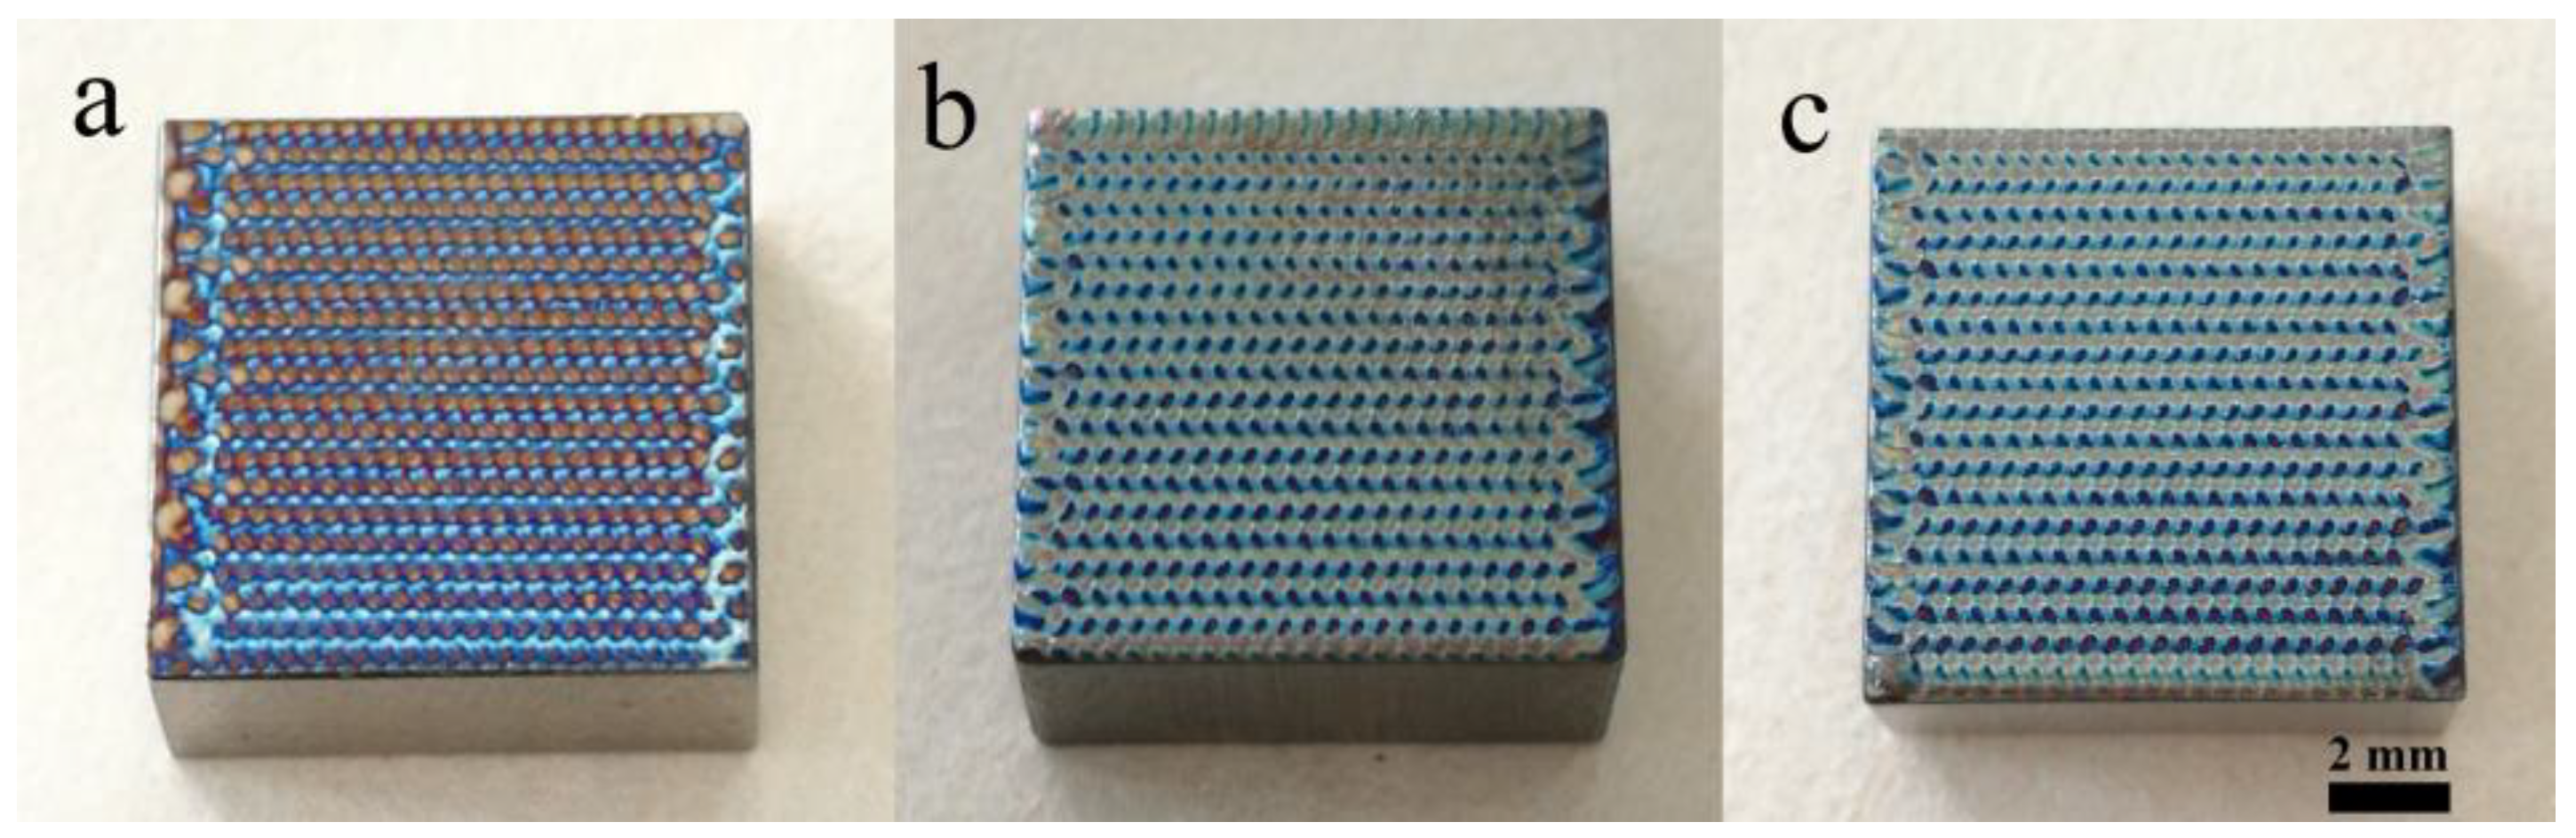
The samples subjected to laser modification are presented in Figure 1. The surface of each sample was significantly modified creating distinct patterns composed of valleys and tops, as already observed [30]. The even textures were obtained by using the overlapping of a laser beam. In addition, blue or dark blue areas were visible on each material, resulting from local surface overheating and oxidation. The appearance of an oxide film on the titanium treated at a sufficient fluence is usual and often reported [9,14,23]. Such behavior can be explained by the oxygen adsorption by metal(s) melted by laser irradiation and eventually the formation of oxides [2].

Figure 1.
The macrophotos of laser-processed samples: (a) Ti grade IV (LT1), (b) Ti7Nb6Al alloy (LT2), (c) Ti15Mo alloy (LT3).
Figure 2 shows the SEM-observed micrographs of laser-processed surfaces. The impacts of the laser beam on the surfaces are observed as the moderate destruction of the top layer and its partial porosity. Numerous short cracks in the surface layer appeared within the very thin subsurface layer. Such cracks are not often reported [31,32] as they are prevented by compressive stresses [33,34]. In [15], the formation of the cracks was attributed to the semi-brittle layer, which experienced high lateral tensile residual stresses.
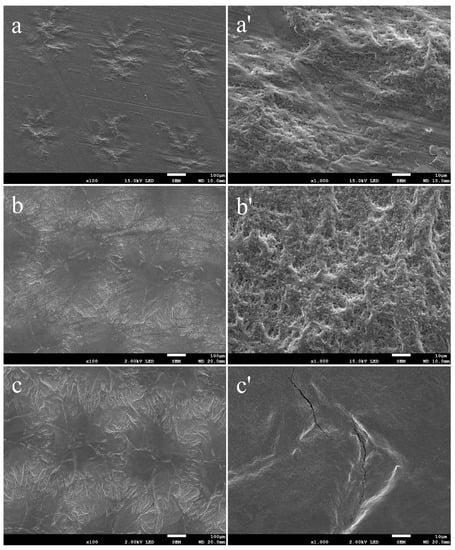
Figure 2.
Surface topographies of laser-processed samples (different magnifications for each pair of samples): (a,a’) LT1, (b,b’) LT2, (c,c’) LT3.
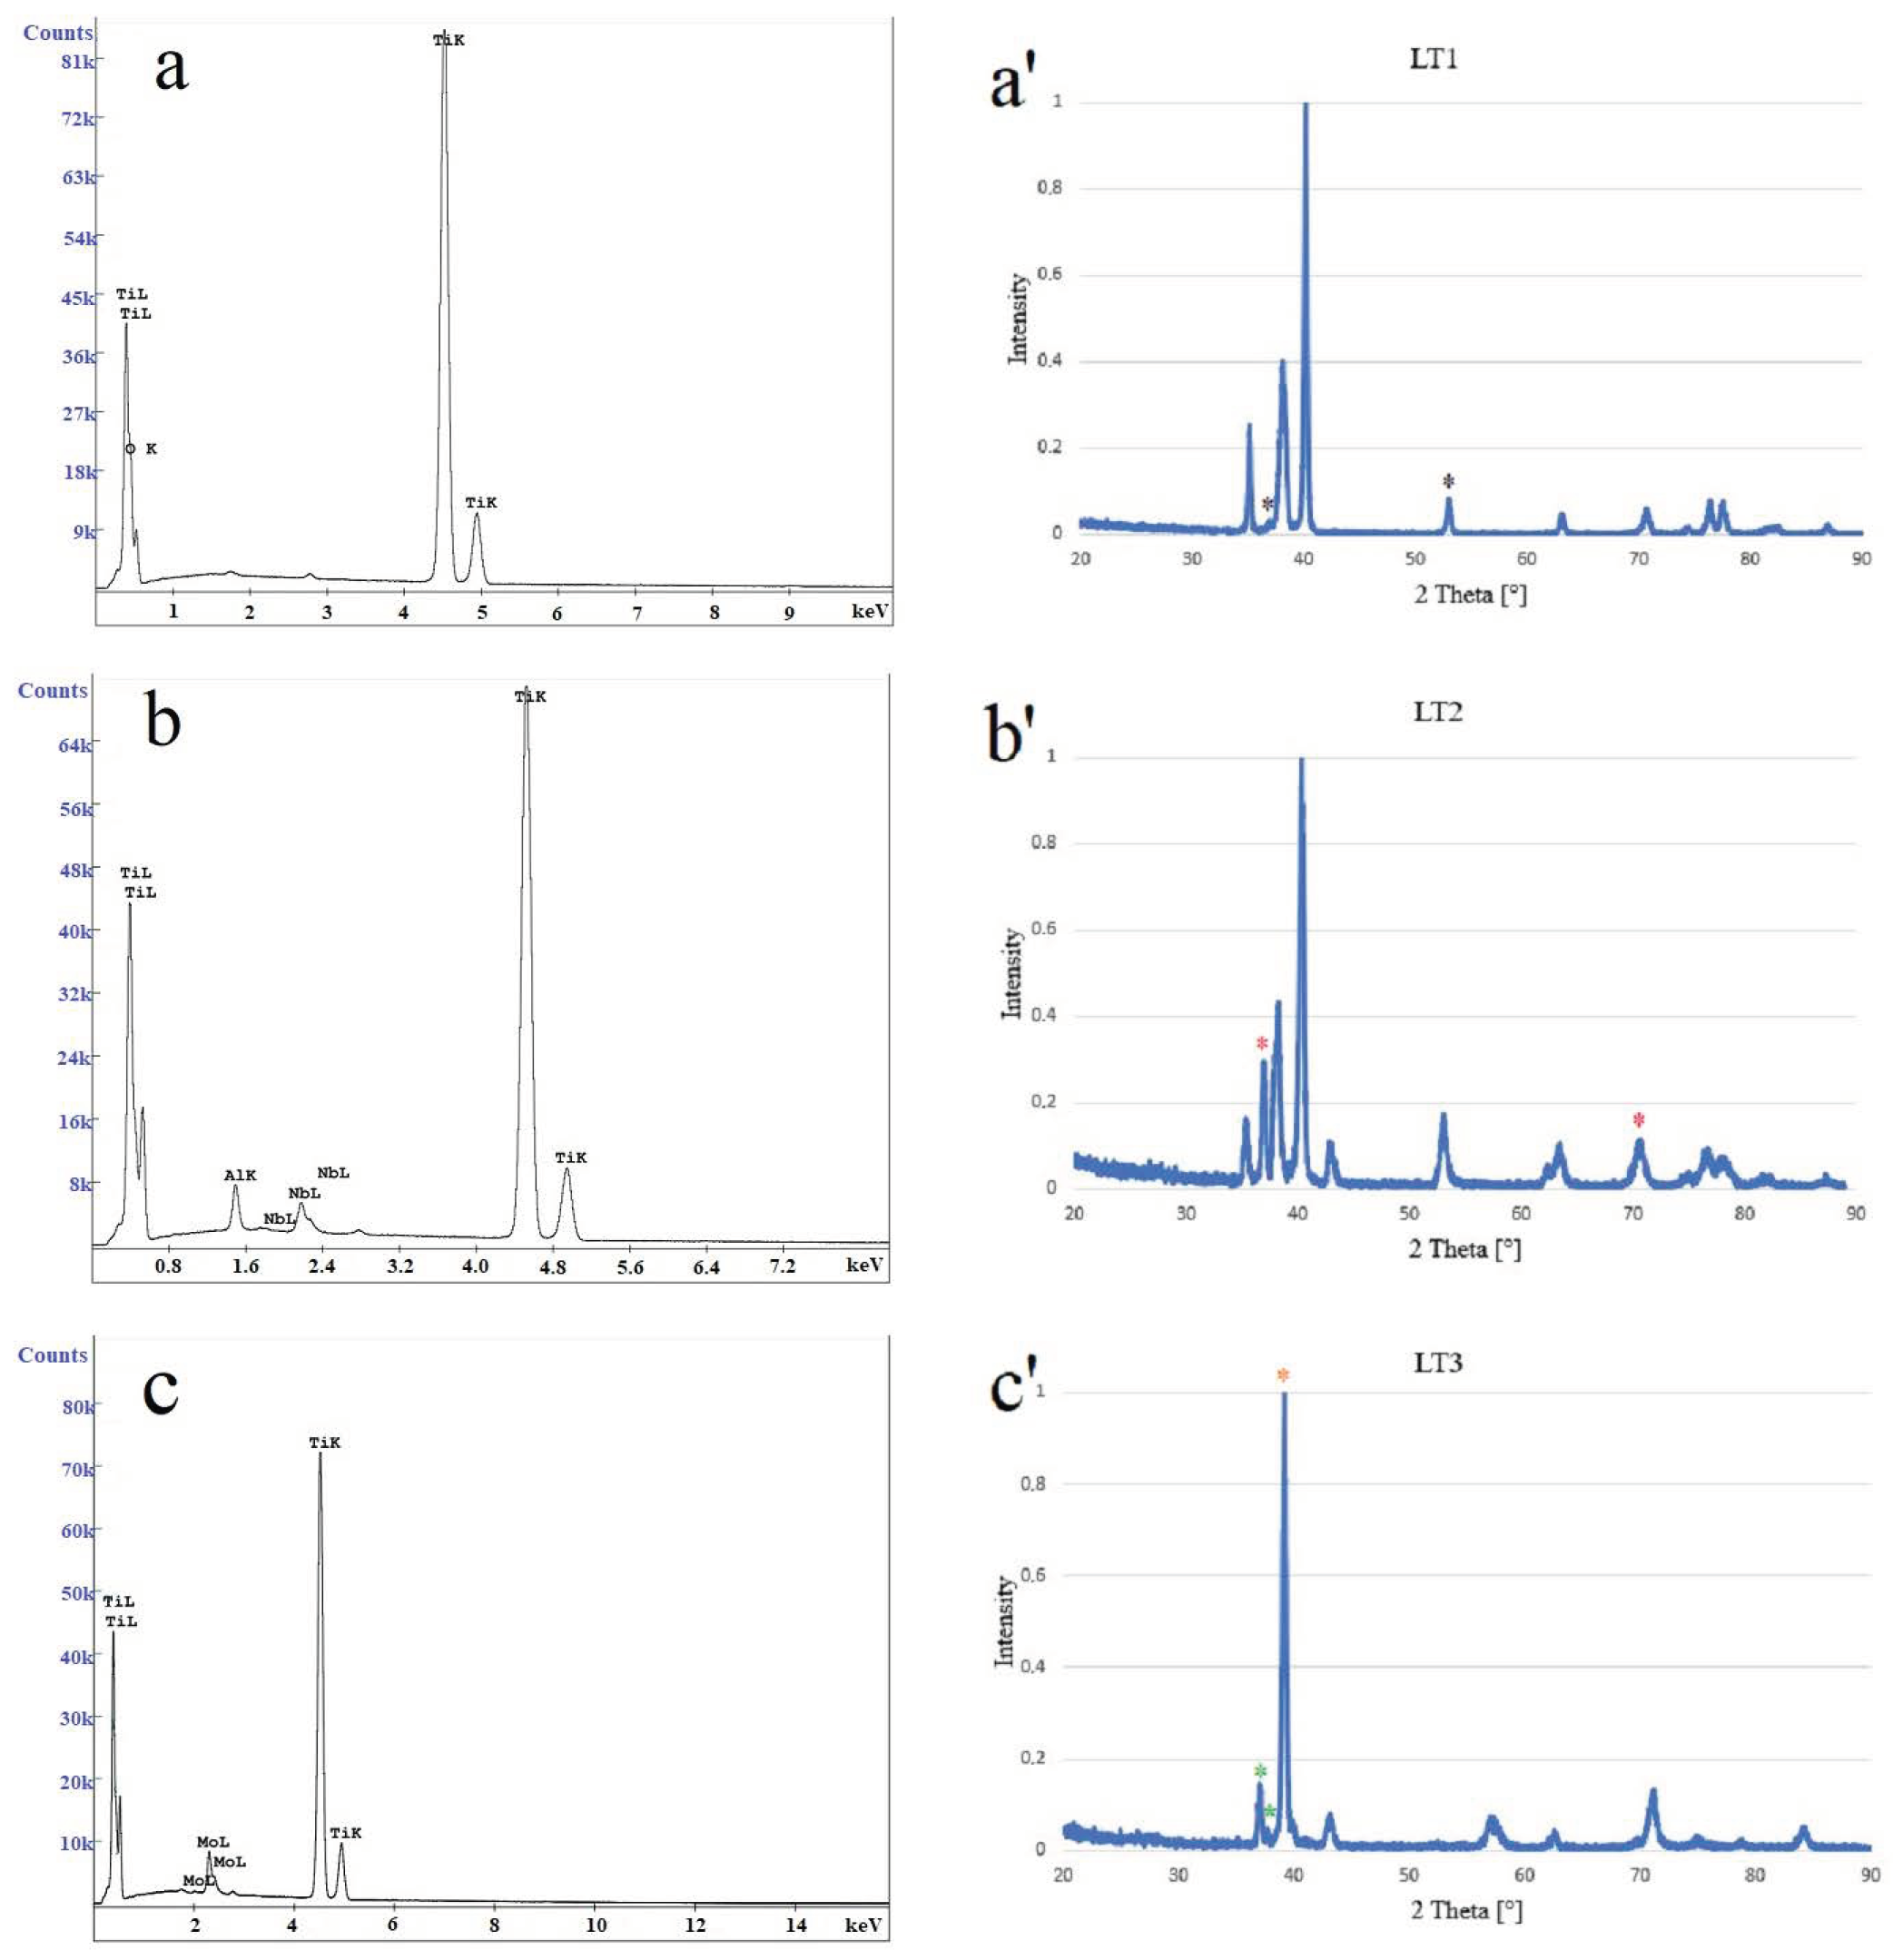
Figure 3 and Table 5 show the chemical compositions of samples after laser treatment. For sample LT2, the weight content of aluminum decreased by more than half, and a similar change was noted for niobium. After applying the laser treatment to the LT3 sample, the molybdenum-to-titanium ratio was significantly reduced. Thus, even qualitatively, all elements were present within the remelted zone; quantitatively, some of them could either evaporate or diffuse into a deeper part of the specimen. Moreover, the change in intensities of metallic elements was determined by the chemical and phase compositions of the laser-treated alloys. The small relative differences in EDS-measured contents of elements of the TC4 medical alloy showed a moderate decrease for all metals at the expense of oxygen [18], and this observed behavior can be attributed to the formation of oxides.
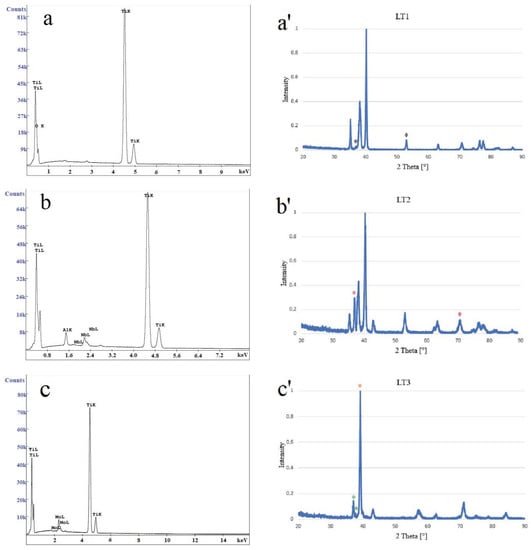
Figure 3.
Chemical and phase compositions of surface layers of the laser-processed samples: (a) LT1, (b) LT2, and (c) LT3. EDS: (a’) LT1 (*TiO2), (b’) LT2 (*Nb2O5), and (c’) LT3 (*MoO2 and MoO3). XRD.
Table 5.
The chemical compositions of samples after laser treatments (based on EDS analysis).
The XRD spectra observed for each investigated surface are shown in Figure 3. The symbols (*) in the graphs indicate the reflections of the precipitates detected for individual materials, which do not result from the base material. In the case of sample LT2, the analysis allowed the identification of niobium oxide Nb2O5 (red *) appearing at 36.99° and 70.69° angles (according to JCPDS no. 30-0873]; in sample LT1, titanium oxide TiO2 (black *) (anatase) was identified by peaks at 36.98° and 53.99° angles (JCPDS no. 21-1272), while in the LT3 sample, molybdenum oxides were identified MoO2 (green *) for 37.13° and 37.95° angles (JCPDS no. 86-0135) and MoO3 for 39.23° (red *) angle (JCPDS no. 05-0508). The appearance of oxides of alloying metals was then confirmed, as previously observed [14].
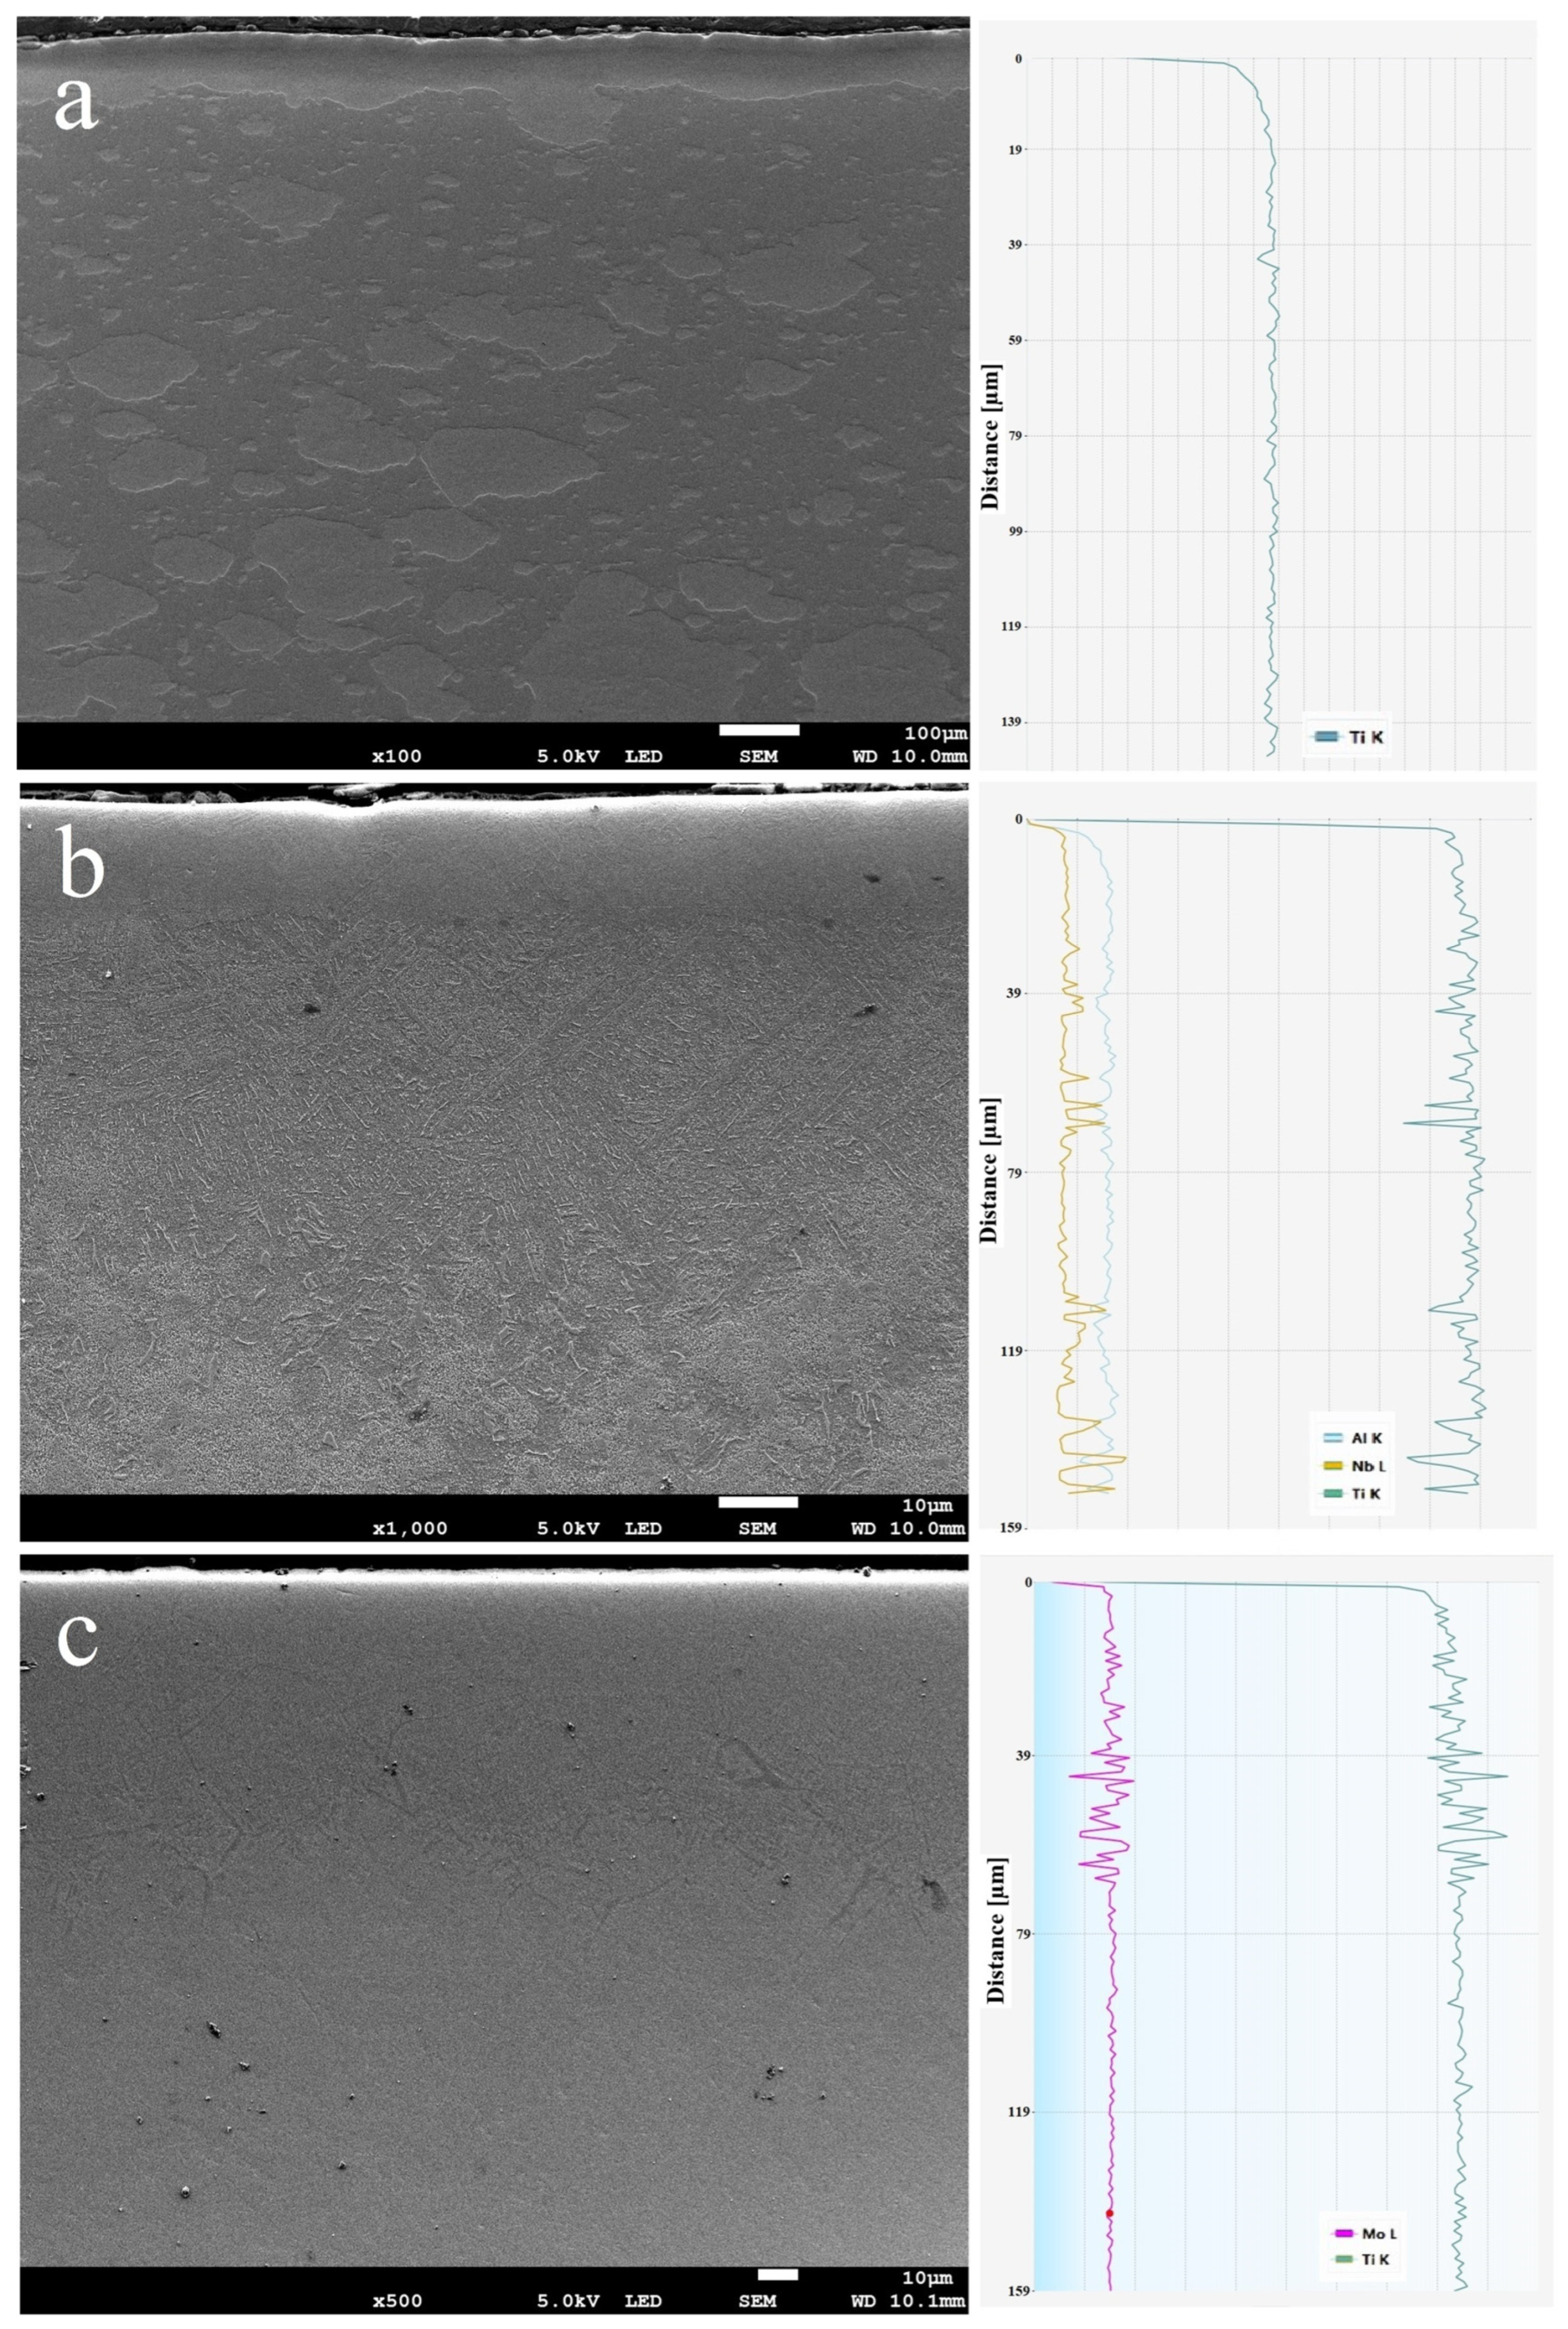
The microstructure and chemical composition created on the cross-sections of laser-remelted surface layers are shown in Figure 4. The EDS analysis of the chemical composition of the cross-sections of the remelted layers was conducted over a length of 150 µm—starting from the near-surface zone, ending on the base material zone, and the averaged results from eight scanning lines were presented. These results confirm the presence of all significant alloying elements and their relative stability within the remelted zone. Thus, the applied pulse laser processing was relatively short and the fluence was small enough to avoid an excess diffusion of metals.
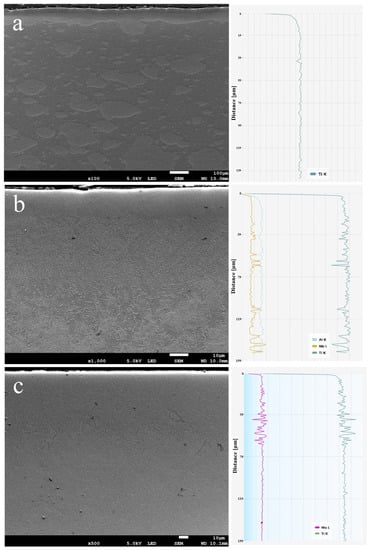
Figure 4.
Cross-sections of laser-processed samples (on left; SEM) and results of chemical analyses (on right, EDS): (a) LT1, (b) LT2, (c) LT3.
Table 6 presents the means of thickness values for all the remelted surface layers. These values are relatively low, compared to, e.g., the 900 um zone for 500 W of laser power [35]; over 500 µm with an Nd:YAG laser [17] 400–500 µm at 500 W [36]. On the other hand, in [23], the hardness changed from 165 HV to the maximum value of 256 HV at 3 μm and decreased at the depth of 9 μm. It was also to note that the cited investigators reported on the zone inside which the hardness changed from an initial surface value to reach a constant value; it can be estimated that the remelted zone is approximately two-fold smaller. The large fluctuations of chemical contents are difficult to explain; most likely, they can be attributed to highly inhomogeneous subsurface zones after laser processing.
Table 6.
Thickness values with standard deviations.
3.2. Roughness
Table 7 shows the results of roughness measurements as arithmetic means of six tests for each sample, along with standard deviations. The roughness of the surface layer is significantly dependent on the laser process parameters, the preliminary surface state, and the alloy chemical and phase composition. In some other research, the roughness Ra was reported as only 15 to 65 nm for a pulse laser power density of 0.16 to 0.8 GW/cm2 [18], 70–350 nm for laser fluence 0.8–5.9 J/cm2 [10], 0.2–3.3 µm for femtosecond laser [34], 50 to 230 um for 100–250 W of laser power [35], and for a nanosecond laser, the Sa value ranged between 0.42 and 6.94 µm [35]. It is incorrect to compare Ra and Sa values, as the first is derived from 2D data in one deviation, and the second is calculated from 3D dataset over an area. The more isotropic the surface, the closer both values are to each other; however, the differences are usually not drastic. For our measurements, even though the Ra values were calculated based on five parallel tests, the possible effect of texture originating from laser beam direction anisotropy could not be neglected. What is important is that we compared the effect of processing parameters on the roughness measured based on the same reliable technique and according to the same standard. It was observed that Ra values we estimated and that other researchers presented appeared in the same magnitude order [10,33].
Table 7.
Roughness results with standard deviations.
3.3. Mechanical Properties
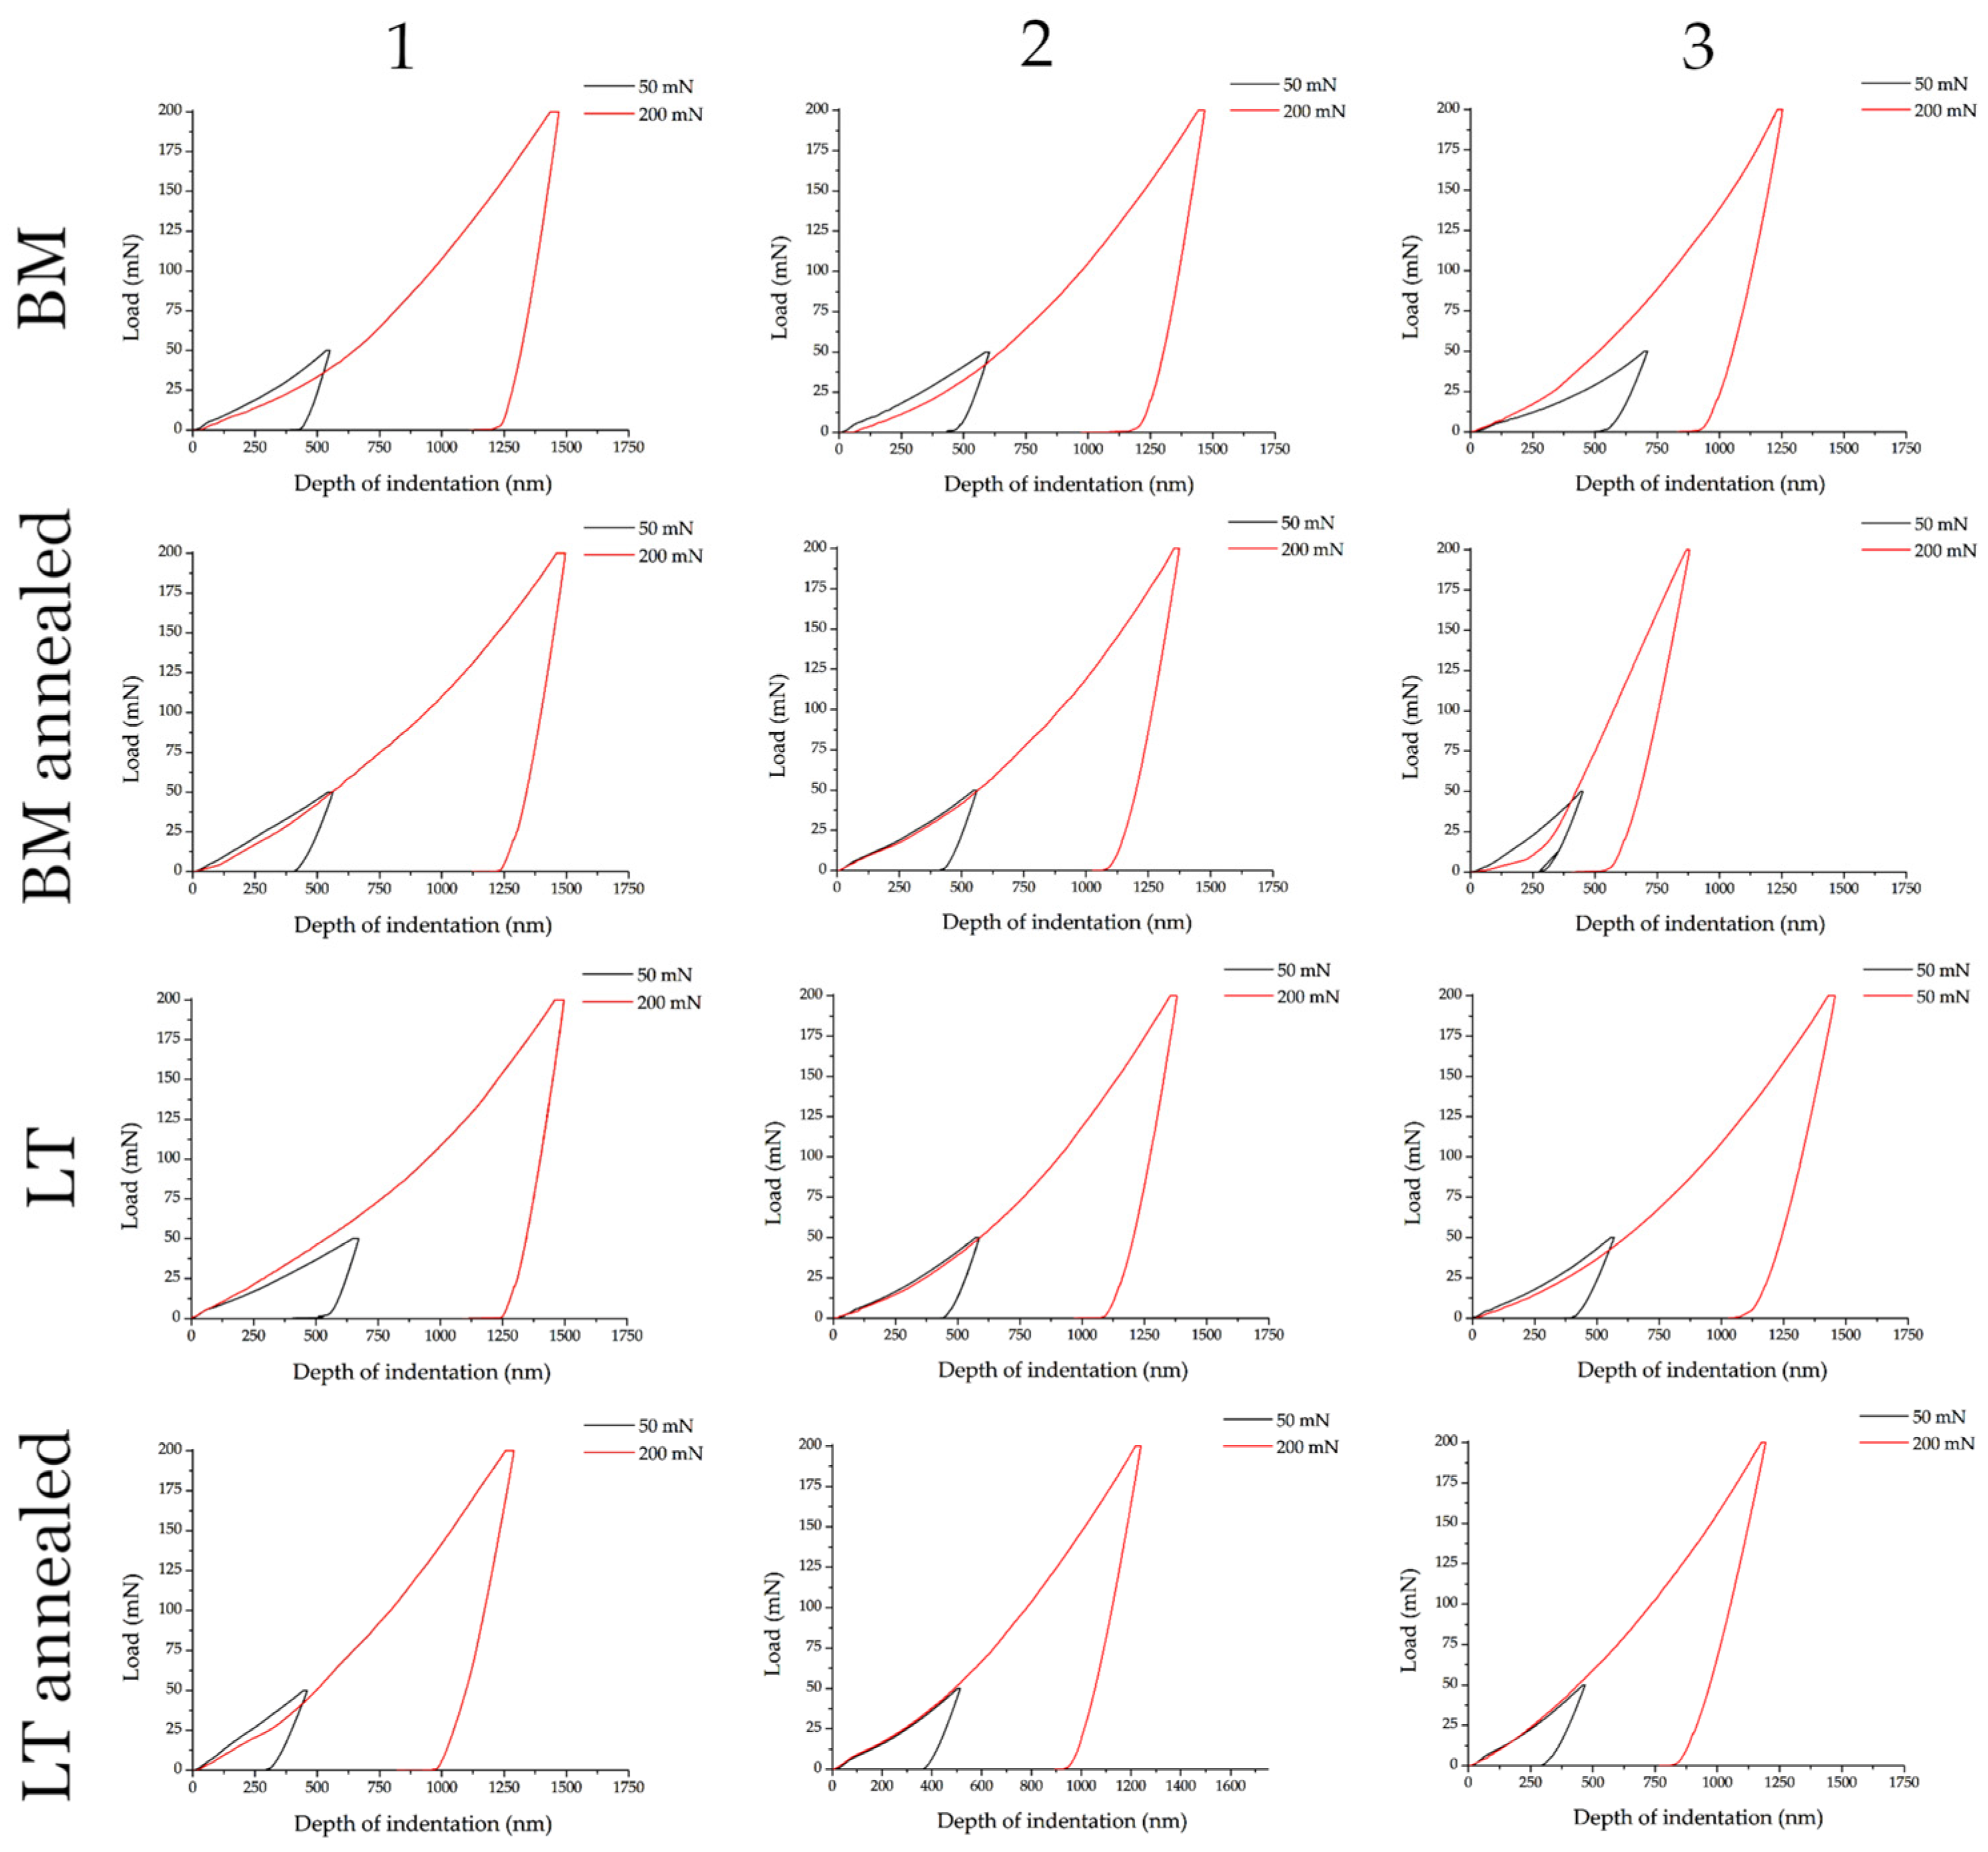
For each of the materials, base, laser treatment, and annealed base and laser treatment, a load–strain hysteresis diagram was plotted during the nano-indentation measurement. The shape of the unloading curve directly affected the mechanical properties of the material determined by the Oliver–Pharr method. The unloading curve started from the value of the maximum indenter depth. Its end occurred at the maximum depth for which the indenter was in contact with the surface of the sample. An example of such a curve is shown in Figure 5. The graphs illustrate the shape of the curve for the 13th nano-indentation measurement for all groups of samples. A decrease in the depth of maximum indentation after annealing compared to samples without annealing was observed for all samples tested. The decrease was observed for both bare materials (BMs) and laser-treated (LT) samples. The slope angle of the unloading curve indicates the plastic–elastic nature of the tested material [37]. In the case of the measurement with a maximum force of 50 mN, it was observed that the angle of the unloading curve (the tangent relative to the top 60% of the obtained force-displacement values) concerning the x-axis was smaller than for the measurement with a maximum force of 200 mN, which may indicate a change similar to the tested material depending on the maximum depth at which the measurement was performed. As the force and maximum depth increased, the material showed a decreasing plastic–elastic character. The greatest changes in the hysteresis shape for the samples before and after annealing was observed for sample number 3 (Ti15Mo).
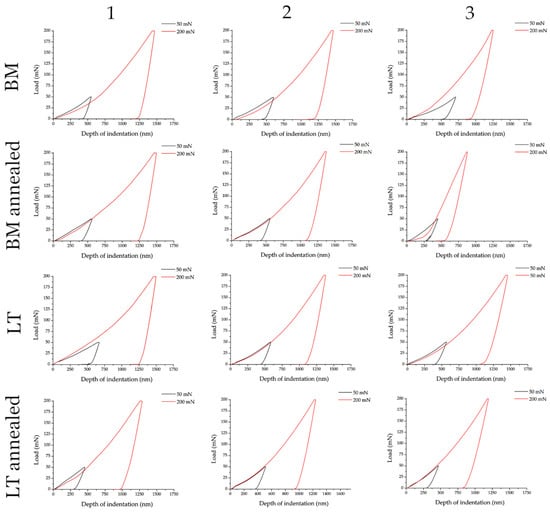
Figure 5.
Indentation curves of BM and LT samples and annealed BM and LT samples ((1)—Ti grade IV; (2)—Ti7Nb6Al; (3)—Ti15Mo) loaded with a maximum force of 50 and 200 mN.
The results of the nano-indentation tests are summarized in Table 8. The chemical composition of the material influences the hardness and Young’s modulus. The laser treatment significantly toughened the surface layer, as demonstrated by the hardness increasing by over 30% and Young’s modulus decreasing by over 15%. The effect resulted from the formation of a small-grain recrystallization zone within the subsurface layer. Compared to the other results, laser irradiation with a femtosecond laser resulted in an increased hardness to 408 HV [34]; from 300 to 440 HV [35]; from 217 HV to 348 HV; Ra from 50 to 230 um; hardness from 300 to 770 HV; [18] Ra from 15 to 65 nm; hardness from 330 to 440 HV [12]; and hardness of 8 GPa [19,33]. These values correspond to the present results and the decreasing Young’s modulus values with increasing hardness. The most considerable increase in hardness was obtained for the Ti7Nb6Al alloy. As regards Young’s modulus, its increase corresponded with the previous result [23], showing a change in the E value from 40 to 60 GPa at 3 µm.
Table 8.
Hardness and Young’s modulus results after nano-indentation test.
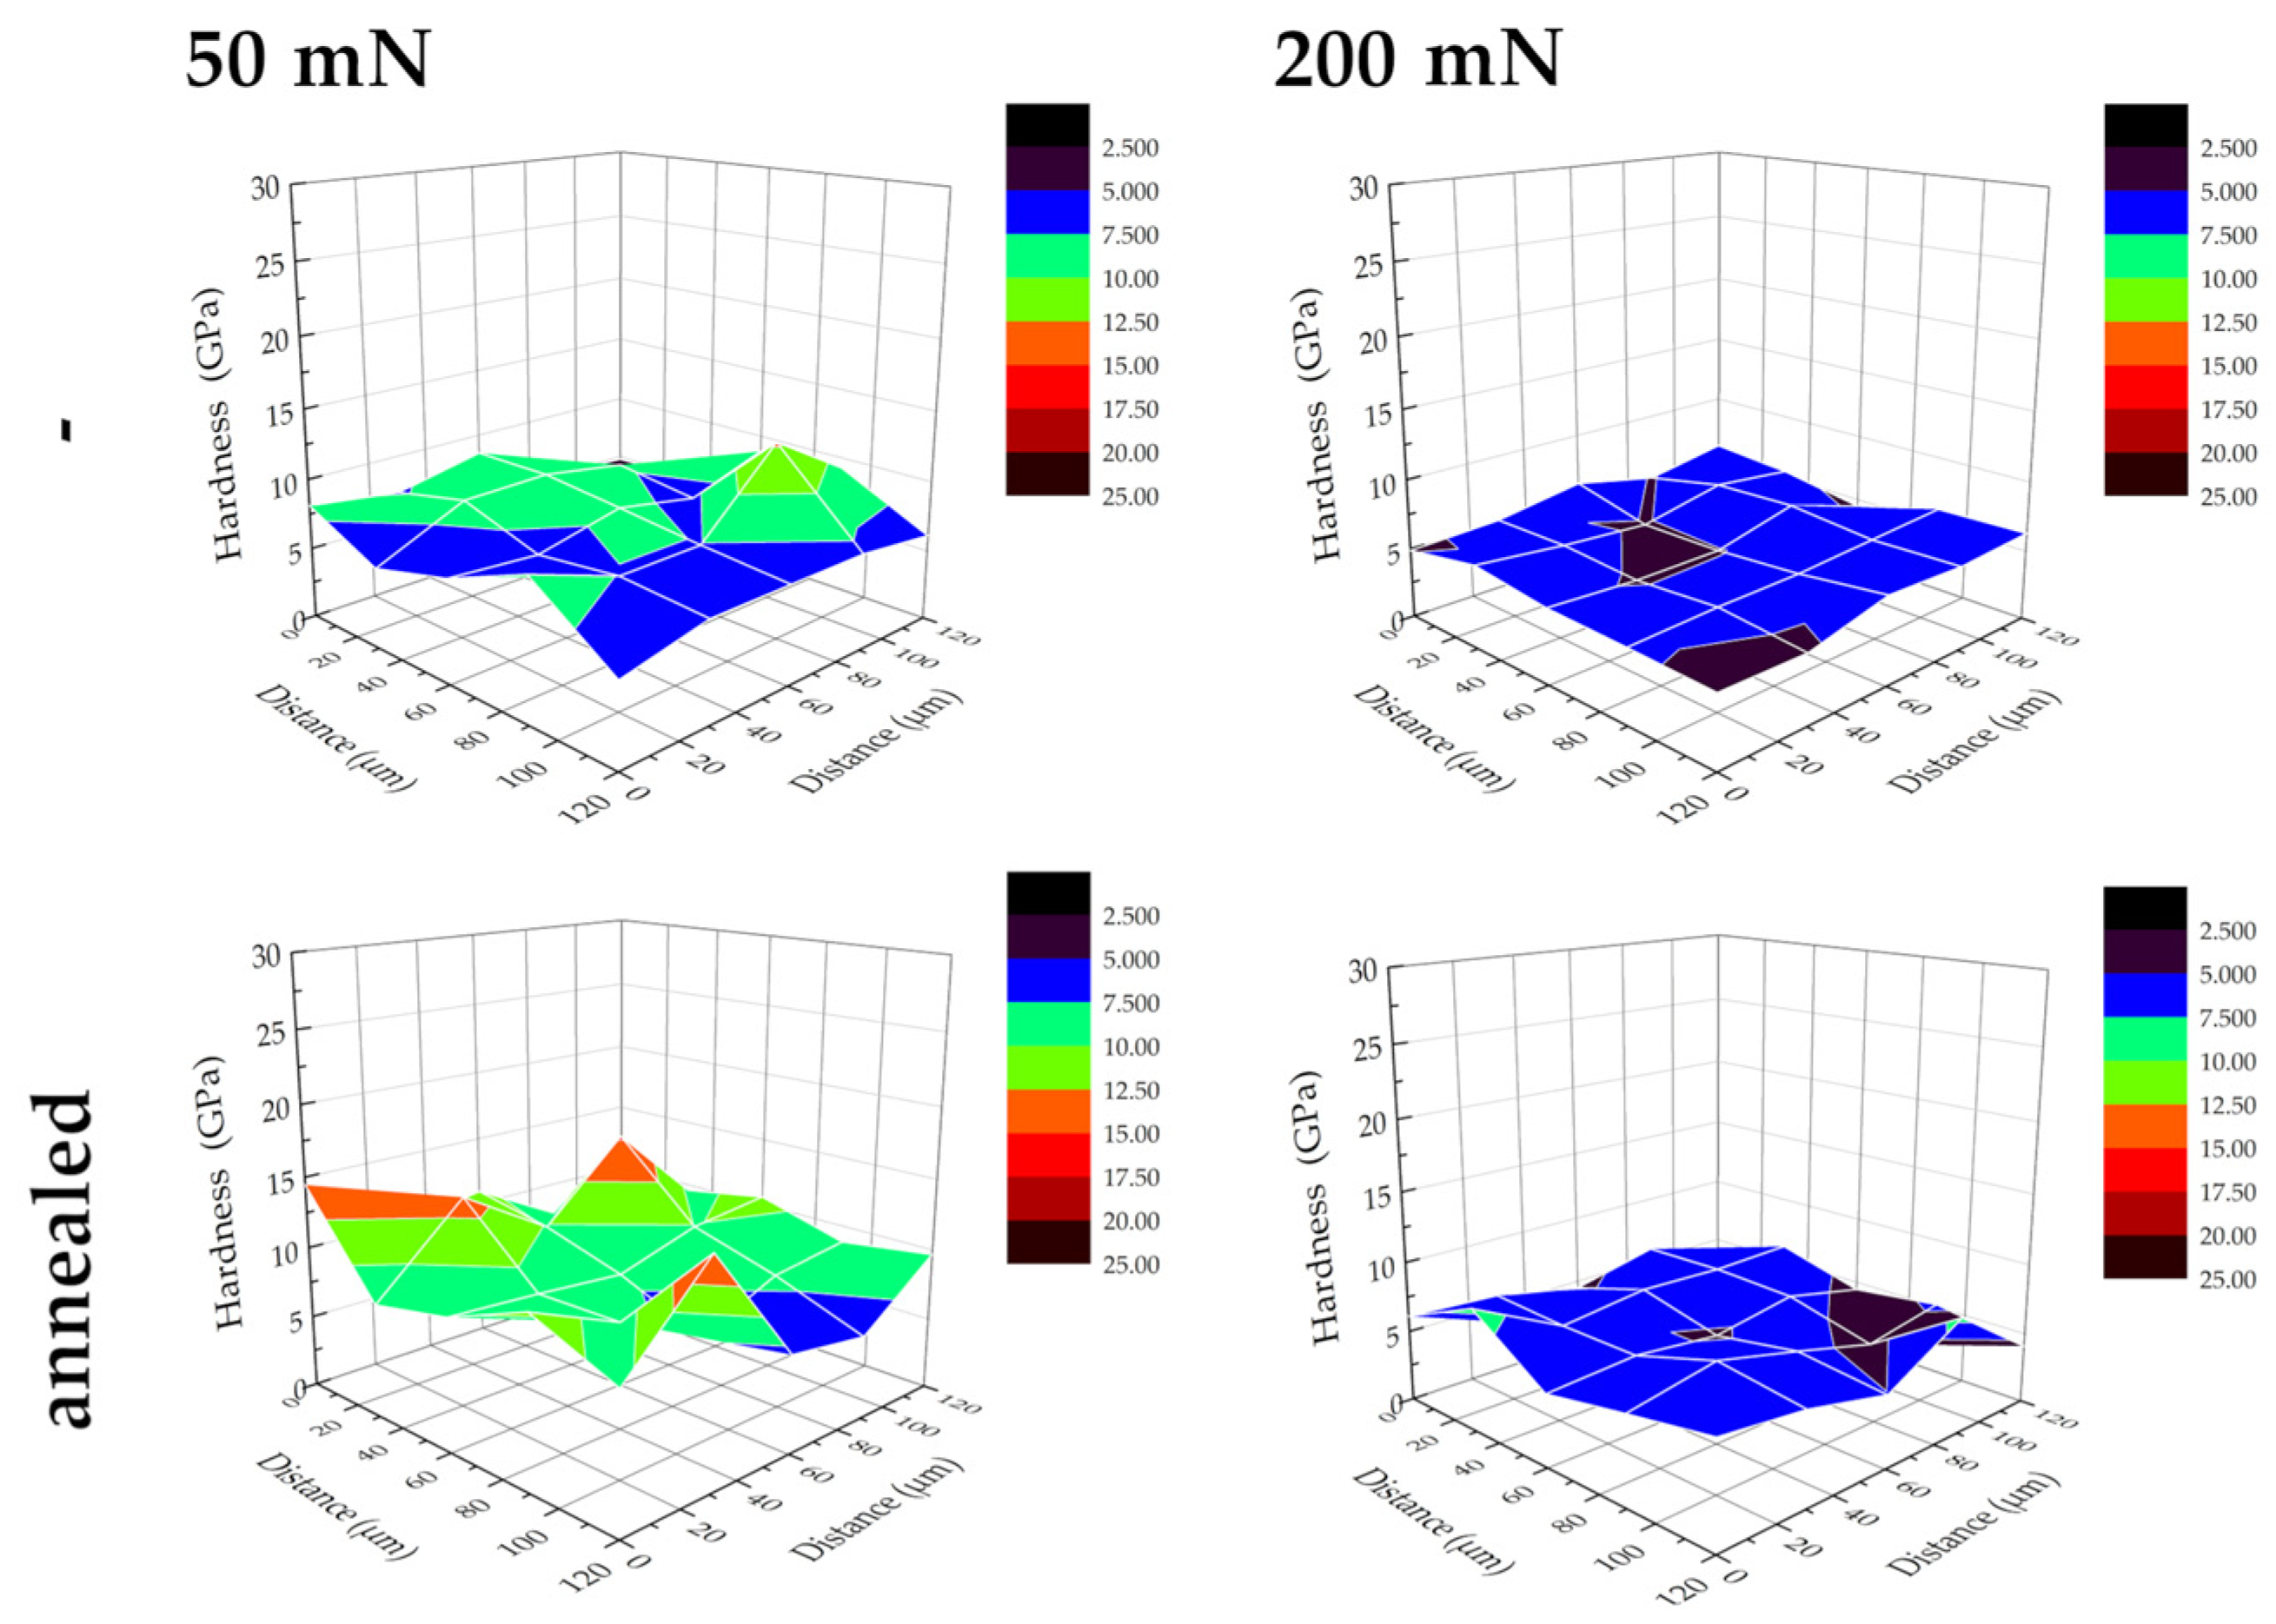
The effect of annealing on mechanical behavior is illustrated by the D change in hardness for Ti specimens shown in Figure 6 for native substrates, and in Figure 7 for laser-processed titanium. The hardness distribution maps for the Ti6Al7Nb and Ti15Mo samples are shown in Figures S1–S4 in the Supplementary Materials.
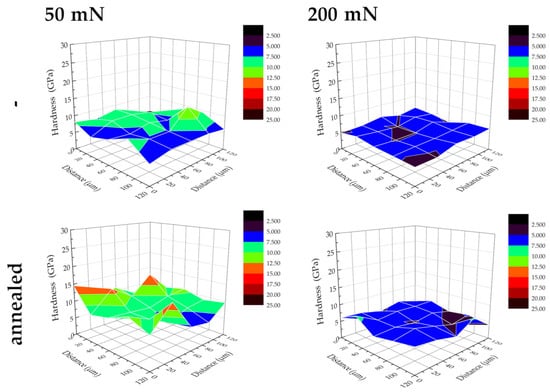
Figure 6.
Three-dimensional hardness maps of the BM and annealed BM of Ti samples.

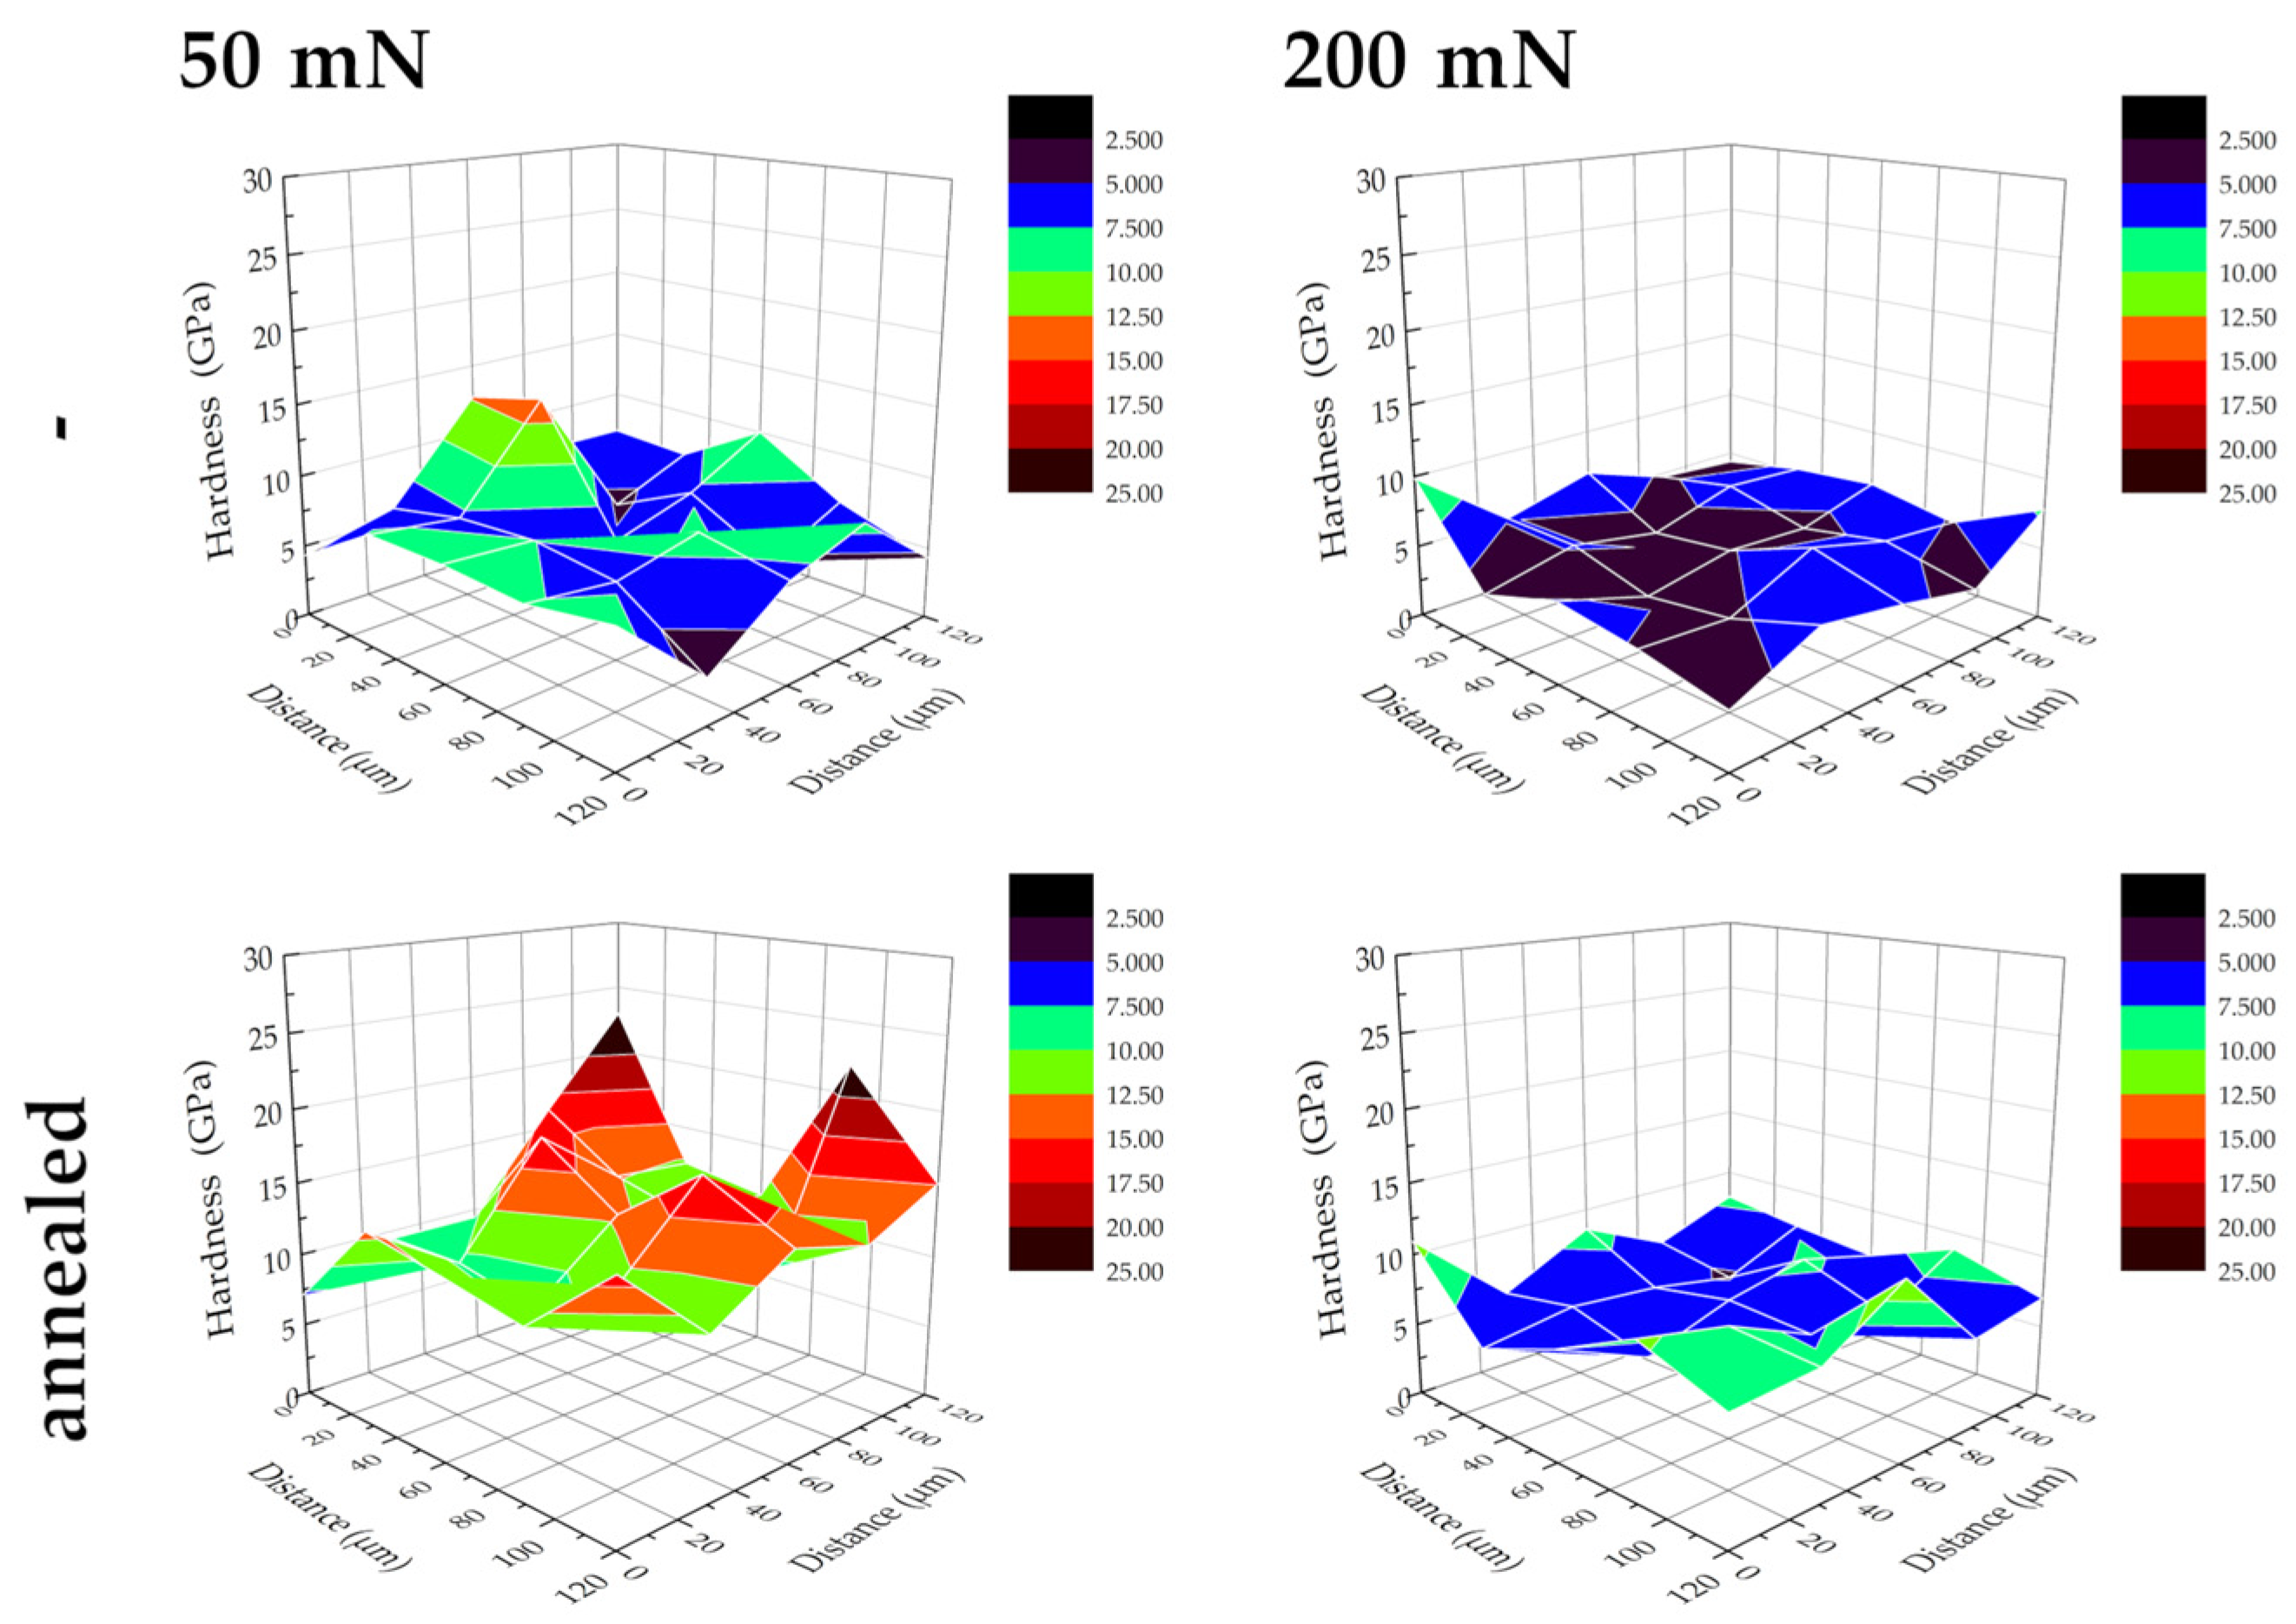
Figure 7.
Three-dimensional hardness maps of the LT and annealed LT of Ti samples.
The obtained 3D distributions of the tested materials indicated an uneven distribution of mechanical properties (nanohardness) on the tested surface. As the force increased (from 50 to 200 mN), an increase in the uniformity of the distribution of the tested properties was observed for all groups of specimens. This was probably due to a decrease in the influence of the roughness of the tested surface with an increase in the maximum force, which influenced the increase in the maximum depth of the measurement performed. In the case of samples after laser treatment (Figure 7), a more uneven distribution of properties was obtained, which, due to the increase in the surface roughness after the laser treatment process, confirmed the previous hypothesis. The 3D distribution maps presented for Ti specimens for all cases studied showed an increase in hardness after annealing, which was greater for measurements performed with a lower maximum force (50 mN). The increase in hardness after annealing was already observed in a previous study [27] with a simultaneous reduction in residual tensile stresses. Similar results have been previously reported; the higher the annealing temperature, the greater the hardness, the effect disappearing only for annealing over 1000 °C, and the effect was attributed to the formation of martensite during cooling following annealing [38]. Moreover, it might also be the effect of the rearrangement of the dislocated structure within a thin subsurface layer, mainly its movement towards the surface, stopping and interacting, resulting in the appearance of surface cracks.
Based on the obtained results, the differences in the average values of the forces causing the same indentation were calculated for samples before and after stress relief annealing, to determine the stresses at the same embedding depths. Table 9 and Table 10 show the values of the mean values of differences together with the standard deviations between the loading forces, 50 or 200 mN, and the forces measured at a depth of 300 nm, before and after stress relief annealing. Moreover, as the normal distribution of data (25 measurements for each value) was uncertain, the medians were also obtained for each such group and presented in Table 11 and Table 12. Residual stresses of native materials and following laser treatment were determined assuming a constant measurement depth of 300 nm and indentation area of 2.2041 nm2.
Table 9.
Differences between an imposed and residual force value and resultant residual stress values following stress relief annealing for different bare alloys and loadings. The means and standard deviations are shown.
Table 10.
Differences between an imposed and residual force value and resultant residual stress values following stress relief annealing for different laser-processed alloys and loadings. The means and standard deviations are shown.
Table 11.
Differences between an imposed and residual force value and resultant residual stress values following stress relief annealing for different bare alloys and loadings. The medians are shown.
Table 12.
Differences between an imposed and residual force value and resultant residual stress values following stress relief annealing for different laser-processed alloys and different loadings. The medians are shown.
When discussing the results, it is useful to consider the sign and magnitude of stresses and the effects of loading and alloy grade. Considering the loading value, the higher the load, the higher the resultant stress. Finally, titanium and Ti7Nb6Al alloys demonstrated similar values of excessive stress, and the Ti15Mo alloy showed much higher values. The stresses assessed were always tensile. Such behavior after laser treatment was already observed as, e.g., 402 ± 60 MPa in [39]. The residual stresses present in thin layers reached 0.1–3 GPa in compression, and up to 1 GPa in tension [15]. It is known that [14] laser texturing created overall tension. Here, obtained residual stresses are, as a rule, tensile and distinctly higher than those reported in the other research. These discrepancies can be explained by different laser processing parameters and, only to some extent, different substrates, including the measurement technique, applied load, and indent depth, as discussed in detail below.
As concerns the laser processing conditions, by increasing the number of laser pulses, the mechanical state of the adjacent area is more affected. The textured surfaces exhibited tensile residual stresses in the surface between the dimples and compressive residual stresses at the bottom of the dimples. The pulse period is very important for the width of the heat-affected zone and the level of residual stresses [34]. For example, for a femtosecond laser, such a zone is below 2 µm; for a nanosecond laser, it increases to 40 µm; and here, the applied pulse period was much longer. Thus, only the tensile stress induced by the femtosecond laser could be negligible if some special measures were not used. In the other research [40], compressive residual stress assessed at 350 MPa was observed in the near-surface zone. This maximum tensile stress of 100 MPa appeared at a depth of ≈2 mm, and at ≈6 mm, the residual stress again became compressive [36]. When increasing the laser energy from 6 to 8 J, the compressive residual stresses increased from 450 to 510 MPa and the affected depth from 500 to 600 μm. In a similar laser treatment [41], a compressive stress field was evident throughout the sample thickness at both locations, decreasing from a peak compression of 600 to 800 MPa at the surface to a minimum compressive stress of 200 MPa at the interior [31]. When increasing the laser power, a rapid increase followed by the decrease in residual compressive stress could be observed. This might be evidence that the laser energy can not only melt the metals, but it also can affect the dislocated structure and movement.
We believe that the high values of our results, close to those already obtained [27], are specific to the test technique. In [38], residual stresses were shown to be substantially related, among the others, to the dimensions of macroscopic and microscopic stresses, intergranular interactions caused by neighboring grain morphologies and orientations, the presence of different phases or precipitates, variations within individual grains, and can be attributed to, e.g., dislocations and twinning. Moreover, it is also significantly influenced by the depth at which the stresses are measured.
The research technique we used is in accordance with the results obtained in earlier studies [42], proving that high tensile stresses can appear in the Ti6Al4V titanium alloy melted with the Nd:YAG laser, measured using the X-ray diffraction method.
4. Conclusions
The laser pulse treatment of the Ti, Ti15Mo, and Ti7Nb6Al alloys resulted in changes in different material and mechanical surface characteristics, such as surface topography, roughness, chemical composition, hardness and Young’s modulus, and level of intrinsic stresses. The effects were dependent, to a varying extent, on the alloy kind.
The impacts of the laser beam on the surfaces were observed as an appearance of pores and short cracks within the thin subsurface layer, presumably caused by the high lateral tensile stresses present in the brittle surface-remelted layer.
The hardness of the remelted alloys ranged between 66 and 126 MPa, being the lowest on single-phase titanium and higher for two alloys.
The laser surface processing increased the roughness as a well-known consequence of melting and high-speed crystallization of the surface layer. The effect of the alloy type was negligible because of similar energy absorption levels by all Ti-based materials.
The laser treatment made the surface layer tougher as proved by the hardness increasing by over 30%, and Young’s modulus decreasing by over 15%. The effects resulted from the formation of a small-grain recrystallization zone within the remelted layer. The chemical composition significantly influenced the hardness and Young’s modulus.
All materials possessed residual tensile stresses, in particular, the Ti15Mo alloy. This effect was specific to the measurement depth, the number of laser pulses, and the laser power.
Supplementary Materials
The following supporting information can be downloaded at: https://www.mdpi.com/article/10.3390/app13106276/s1, Figure S1: Three-dimensional hardness maps of the BM and annealed BM of Ti7Nb6Al samples, Figure S2: Three-dimensional hardness maps of the BM and annealed BM of Ti15Mo samples, Figure S3: Three-dimensional hardness maps of the LT and annealed LT of Ti7Nb6Al samples, Figure S4: Three-dimensional hardness maps of the LT and annealed LT of Ti15Mo samples.
Author Contributions
Conceptualization, M.J.; methodology, M.J. and M.B.; software, M.J., M.B. and D.B.K.; validation, M.J. and A.Z.; formal analysis, M.J., M.B. and A.Z.; investigation, M.J., M.B. and A.Z.; resources, M.J. and M.B.; data curation, M.J.; writing—original draft preparation, M.J., M.B. and A.Z.; writing—review and editing, A.Z.; visualization, M.J.; supervision, M.J.; project administration, M.J. All authors have read and agreed to the published version of the manuscript.
Funding
This research received no external funding.
Institutional Review Board Statement
Not applicable.
Informed Consent Statement
Not applicable.
Data Availability Statement
Not applicable.
Acknowledgments
The authors would like to thank the students A. Berk-Kaczyńska and K. Chyżyńska and the employees of Gdansk University of Technology, B. Majkowska-Marzec, G. Gajowiec and A. Mielewczyk-Gryń for their technical assistance in some of the tests.
Conflicts of Interest
The authors declare no conflict of interest.
References
- Zielinski, A.; Bartmanski, M. Electrodeposited Biocoatings, Their Properties and Fabrication Technologies: A Review. Coatings 2020, 10, 782. [Google Scholar] [CrossRef]
- Simões, I.G.; dos Reis, A.C.; da Costa Valente, M.L. Analysis of the Influence of Surface Treatment by High-Power Laser Irradiation on the Surface Properties of Titanium Dental Implants: A Systematic Review. J. Prosthet. Dent. 2021, in press. [CrossRef]
- Souza, J.C.M.; Sordi, M.B.; Kanazawa, M.; Ravindran, S.; Henriques, B.; Silva, F.S.; Aparicio, C.; Cooper, L.F. Nano-Scale Modification of Titanium Implant Surfaces to Enhance Osseointegration. Acta Biomater. 2019, 94, 112–131. [Google Scholar] [CrossRef] [PubMed]
- Pandey, L.M. Design of Biocompatible and Self-Antibacterial Titanium Surfaces for Biomedical Applications. Curr. Opin. Biomed. Eng. 2023, 25, 100423. [Google Scholar] [CrossRef]
- Rogala-Wielgus, D.; Majkowska-Marzec, B.; Zieliński, A.; Bartmański, M.; Bartosewicz, B. Mechanical Behavior of Bi-Layer and Dispersion Coatings Composed of Several Nanostructures on Ti13Nb13Zr Alloy. Materials 2021, 14, 2905. [Google Scholar] [CrossRef] [PubMed]
- Kaur, M.; Singh, K. Review on Titanium and Titanium Based Alloys as Biomaterials for Orthopaedic Applications. Mater. Sci. Eng. C 2019, 102, 844–862. [Google Scholar] [CrossRef]
- Abdal-hay, A.; Staples, R.; Alhazaa, A.; Fournier, B.; Al-Gawati, M.; Lee, R.S.; Ivanovski, S. Fabrication of Micropores on Titanium Implants Using Femtosecond Laser Technology: Perpendicular Attachment of Connective Tissues as a Pilot Study. Opt. Laser Technol. 2022, 148, 107624. [Google Scholar] [CrossRef]
- Mohazzab, B.F.; Jaleh, B.; Fattah-alhosseini, A.; Mahmoudi, F.; Momeni, A. Laser Surface Treatment of Pure Titanium: Microstructural Analysis, Wear Properties, and Corrosion Behavior of Titanium Carbide Coatings in Hank’s Physiological Solution. Surf. Interfaces 2020, 20, 100597. [Google Scholar] [CrossRef]
- He, W.; Yao, P.; Chu, D.; Sun, H.; Lai, Q.; Wang, Q.; Wang, P.; Qu, S.; Huang, C. Controllable Hydrophilic Titanium Surface with Micro-Protrusion or Micro-Groove Processed by Femtosecond Laser Direct Writing. Opt. Laser Technol. 2022, 152, 108082. [Google Scholar] [CrossRef]
- Dou, H.-Q.; Liu, H.; Xu, S.; Chen, Y.; Miao, X.; Lü, H.; Jiang, X. Influence of Laser Fluences and Scan Speeds on the Morphologies and Wetting Properties of Titanium Alloy. Optik 2020, 224, 165443. [Google Scholar] [CrossRef]
- Wedemeyer, C.; Jablonski, H.; Mumdzic-Zverotic, A.; Fietzek, H.; Mertens, T.; Hilken, G.; Krüger, C.; Wissmann, A.; Heep, H.; Schlepper, R.; et al. Laser-Induced Nanostructures on Titanium Surfaces Ensure Osseointegration of Implants in Rabbit Femora. Materialia 2019, 6, 100266. [Google Scholar] [CrossRef]
- Ushakov, I.; Simonov, Y. Formation of Surface Properties of VT18u Titanium Alloy by Laser Pulse Treatment. Mater. Today Proc. 2019, 19, 2051–2055. [Google Scholar] [CrossRef]
- Majkowska, B.; Serbinski, W. Cavitation Wearing of the SUPERSTON Alloy after Laser Treatment at Cryogenic Conditions. Solid State Phenom. 2010, 165, 306–309. [Google Scholar] [CrossRef]
- Convert, L.; Bourillot, E.; François, M.; Pocholle, N.; Baras, F.; Politano, O.; Costil, S. Laser Textured Titanium Surface Characterization. Appl. Surf. Sci. 2022, 586, 152807. [Google Scholar] [CrossRef]
- Shirazi, H.A.; Chan, C.W.; Lee, S. Elastic-Plastic Properties of Titanium and Its Alloys Modified by Fibre Laser Surface Nitriding for Orthopaedic Implant Applications. J. Mech. Behav. Biomed. Mater. 2021, 124, 104802. [Google Scholar] [CrossRef]
- Wang, Y.; Zhang, M.; Li, K.; Hu, J. Study on the Surface Properties and Biocompatibility of Nanosecond Laser Patterned Titanium Alloy. Opt. Laser Technol. 2021, 139, 106987. [Google Scholar] [CrossRef]
- Watanabe, I.; McBride, M.; Newton, P.; Kurtz, K.S. Laser Surface Treatment to Improve Mechanical Properties of Cast Titanium. Dent. Mater. 2009, 25, 629–633. [Google Scholar] [CrossRef] [PubMed]
- Liu, Q.; Liu, Y.; Li, X.; Dong, G. Pulse Laser-Induced Cell-like Texture on Surface of Titanium Alloy for Tribological Properties Improvement. Wear 2021, 477, 203784. [Google Scholar] [CrossRef]
- Kümmel, D.; Linsler, D.; Schneider, R.; Schneider, J. Surface Engineering of a Titanium Alloy for Tribological Applications by Nanosecond-Pulsed Laser. Tribol. Int. 2020, 150, 106376. [Google Scholar] [CrossRef]
- Lu, J.; Huang, T.; Liu, Z.; Zhang, X.; Xiao, R. Long-Term Wettability of Titanium Surfaces by Combined Femtosecond Laser Micro/Nano Structuring and Chemical Treatments. Appl. Surf. Sci. 2018, 459, 257–262. [Google Scholar] [CrossRef]
- Yu, Z.; Zhang, J.; Hu, J. Study on Surface Properties of Nanosecond Laser Textured Plasma Nitrided Titanium Alloy. Mater. Today Commun. 2022, 31, 103746. [Google Scholar] [CrossRef]
- Khoo, L.K.; Sakdajeyont, W.; Khanijou, M.; Seriwatanachai, D.; Kiattavorncharoen, S.; Pairuchvej, V.; Wongsirichat, N. Titanium Fixture Implants Treated by Laser in Dentistry: Review Article. J. Oral Maxillofac. Surg. Med. Pathol. 2019, 31, 381–385. [Google Scholar] [CrossRef]
- Yao, H.; Zou, X.; Zheng, S.; Hu, Y.; Zhang, S.; Liang, C.; Zhou, H.; Wang, D.; Wang, H.; Yang, L.; et al. Femtosecond Laser-Induced Nanoporous Layer for Enhanced Osteogenesis of Titanium Implants. Mater. Sci. Eng. C 2021, 127, 112247. [Google Scholar] [CrossRef] [PubMed]
- Neto, J.V.C.; Kreve, S.; Valente, M.L.D.C.; dos Reis, A.C. Protein Absorption on Titanium Surfaces Treated with a High-Power Laser: A Systematic Review. J. Prosthet. Dent. 2022, in press. [CrossRef]
- Katahira, K.; Ezura, A.; Ohkawa, K.; Komotori, J.; Ohmori, H. Generation of Bio-Compatible Titanium Alloy Surfaces by Laser-Induced Wet Treatment. CIRP Ann.-Manuf. Technol. 2016, 65, 237–240. [Google Scholar] [CrossRef]
- Papa, S.; Abou Khalil, A.; Hamzeh-Cognasse, H.; Thomas, M.; Maalouf, M.; Di Maio, Y.; Sedao, X.; Guignandon, A.; Dumas, V. Dual-Functionalized Titanium by Ultrafast Laser Texturing to Enhance Human Gingival Fibroblasts Adhesion and Minimize Porphyromonas Gingivalis Colonization. Appl. Surf. Sci. 2022, 606, 154784. [Google Scholar] [CrossRef]
- Jażdżewska, M.; Kwidzińska, D.B.; Seyda, W.; Fydrych, D.; Zieliński, A. Mechanical Properties and Residual Stress Measurements of Grade IV Titanium and Ti-6Al-4V and Ti-13Nb-13Zr Titanium Alloys after Laser Treatment. Materials 2021, 14, 6316. [Google Scholar] [CrossRef]
- Lee, Y.-H.; Kwon, D. Residual Stresses in DLC/Si and Au/Si Systems: Application of a Stress Relaxation Model to the Nanoindentation Technique. J. Mater. Res. Technol. 2002, 17, 901–906. [Google Scholar] [CrossRef]
- Fischer-Cripps, A.C. Nanoindentation; Springer: Berlin/Heidelberg, Germany, 2004. [Google Scholar]
- Kuczyńska-Zemła, D.; Pura, J.; Przybyszewski, B.; Pisarek, M.; Garbacz, H. A Comparative Study of Apatite Growth and Adhesion on a Laser-Functionalized Titanium Surface. Tribol. Int. 2023, 182, 108338. [Google Scholar] [CrossRef]
- Liangchen, G.; Haotian, C.; Zongjun, T.; Boyuan, X. Relationship between Surface Residual Stress and Dislocation Configuration after Laser Shock Processing of TC4 Titanium Alloy. Opt. Laser Technol. 2023, 157, 108702. [Google Scholar] [CrossRef]
- Depboylu, F.N.; Yasa, E.; Poyraz, Ö.; Minguella-Canela, J.; Korkusuz, F.; De los Santos López, M.A. Titanium Based Bone Implants Production Using Laser Powder Bed Fusion Technology. J. Mater. Res. Technol. 2022, 17, 1408–1426. [Google Scholar] [CrossRef]
- Li, Z.; Xu, J.; Zhang, D.; Xu, Z.; Su, X.; Jin, Y.; Shan, D.; Chen, Y.; Guo, B. Nanosecond Pulsed Laser Cleaning of Titanium Alloy Oxide Films: Modeling and Experiments. J. Manuf. Process. 2022, 82, 665–677. [Google Scholar] [CrossRef]
- PAN, X.; HE, W.; CAI, Z.; WANG, X.; LIU, P.; LUO, S.; ZHOU, L. Investigations on Femtosecond Laser-Induced Surface Modification and Periodic Micropatterning with Anti-Friction Properties on Ti6Al4V Titanium Alloy. Chin. J. Aeronaut. 2022, 35, 521–537. [Google Scholar] [CrossRef]
- Chauhan, A.S.; Jha, J.S.; Telrandhe, S.V.S.; Gokhale, A.A.; Mishra, S.K. Laser Surface Treatment of α-β Titanium Alloy to Develop a β -Rich Phase with Very High Hardness. J. Mater. Process. Technol. 2021, 288, 116873. [Google Scholar] [CrossRef]
- Li, J.; Chen, S.; Zhu, W.; Zhao, Y.; Liu, L.; Wang, Z.; Pan, H. Microstructural Response and Surface Mechanical Properties of TC6 Titanium Alloy Subjected to Laser Peening with Different Laser Energy. Opt. Laser Technol. 2023, 158, 108836. [Google Scholar] [CrossRef]
- Iqbal, T.; Briscoe, B.J.; Luckham, P.F. Surface Plasticization of Poly(Ether Ether Ketone). Eur. Polym. J. 2011, 47, 2244–2258. [Google Scholar] [CrossRef]
- Omoniyi, P.O.; Akinlabi, E.T.; Mahamood, R.M. Heat Treatments of Ti6Al4V Alloys for Industrial Applications: An Overview. IOP Conf. Ser. Mater. Sci. Eng. 2021, 1107, 012094. [Google Scholar] [CrossRef]
- Takase, A.; Ishimoto, T.; Suganuma, R.; Nakano, T. Surface Residual Stress and Phase Stability in Unstable β-Type Ti–15Mo–5Zr–3Al Alloy Manufactured by Laser and Electron Beam Powder Bed Fusion Technologies. Addit. Manuf. 2021, 47, 102257. [Google Scholar] [CrossRef]
- Everaerts, J.; Song, X.; Nagarajan, B.; Korsunsky, A.M. Evaluation of Macro- and Microscopic Residual Stresses in Laser Shock-Peened Titanium Alloy by FIB-DIC Ring-Core Milling with Different Core Diameters. Surf. Coat. Technol. 2018, 349, 719–724. [Google Scholar] [CrossRef]
- Ruschau, J.J.; John, R.; Thompson, S.R.; Nicholas, T. Fatigue Crack Nucleation and Growth Rate Behavior of Laser Shock Peened Titanium. Int. J. Fatigue 1999, 21, 199–209. [Google Scholar] [CrossRef]
- Jażdżewska, M. Effects of Co 2 and Nd:YAG Laser Remelting of the Ti6Al4V Alloy on the Surface Quality and Residual Stresses. Adv. Mater. Sci. 2020, 20, 82–90. [Google Scholar] [CrossRef]

Disclaimer/Publisher’s Note: The statements, opinions and data contained in all publications are solely those of the individual author(s) and contributor(s) and not of MDPI and/or the editor(s). MDPI and/or the editor(s) disclaim responsibility for any injury to people or property resulting from any ideas, methods, instructions or products referred to in the content. |
© 2023 by the authors. Licensee MDPI, Basel, Switzerland. This article is an open access article distributed under the terms and conditions of the Creative Commons Attribution (CC BY) license (https://creativecommons.org/licenses/by/4.0/).