Article

Yb-Doped All-Fiber Amplifier with Low-Intensity Noise in mHz Range Oriented to Space-Borne Gravitational Wave Detection

1
Key Laboratory of Photonic Control Technology, Department of Precision Instrument, Tsinghua University, Beijing 100084, China
2
State Key Laboratory of Precision Measurement Technology and Instruments, Department of Precision Instrument, Tsinghua University, Beijing 100084, China
3
Ordnance Sergeant College, Army Engineering University, Wuhan 430075, China
4
State Key Laboratory of Quantum Optics and Quantum Optics Devices, Institute of Opto-Electronics, Shanxi University, Taiyuan 030006, China
*
Authors to whom correspondence should be addressed.
Appl. Sci. 2023, 13(10), 6338; https://doi.org/10.3390/app13106338
Submission received: 18 April 2023 / Revised: 10 May 2023 / Accepted: 19 May 2023 / Published: 22 May 2023
(This article belongs to the Special Issue Advances in Optical and Optoelectronic Devices and Systems)

Abstract

:
We present a low-intensity noise single-frequency Yb-doped all-fiber amplifier oriented to space-borne gravitational wave detection. Relative intensity noise (RIN) below −70 dBc/Hz @ 1 mHz~1 Hz was achieved by virtue of feedback-loop-based intensity noise suppression. Based on systematic noise analysis and experimental investigation, we found that the pump noise and temperature-dependent noise of the fiber splitter and the photodetector contributed mainly to the RIN of the fiber amplifier. Therefore, we carefully designed a feedback-loop-based Yb-doped all-fiber amplifier, and finely stabilized the temperature of the pump diode, fiber splitters, and photodetectors. Consequently, the RIN can be suppressed down to −72.5 dBc/Hz around 1 mHz. This low-intensity all-fiber Yb-doped amplifier can be used for space-borne gravitational-wave detection.

1. Introduction

Single-frequency lasers are used for a wide variety of commercial and scientific applications including material processing, manufacturing, lidar, and gravitational-wave (GW) detectors [1,2,3]. The GW detector has extremely strict requirements in terms of intensity noise performance and primary laser stability. Intensity noise would induce fluctuating forces on the test mass of GW detectors, which can severely reduce GW detector sensitivity [4]. A high-power, low-noise, highly stable, long-lifetime laser system is a key component of the GW detector. The most promising candidate for such a laser system is the master oscillator power amplifier (MOPA) architecture [5]. In the MOPA architecture, a low-power, low-noise, narrow-linewidth laser is amplified through a fiber amplifier to achieve high-power output. The advantages of the MOPA laser system are the high efficiency of the fiber amplifier and the power scalability of the overall laser system. On the other hand, the fiber amplifier might induce more power fluctuations and broaden the linewidth of the seed laser [6,7]. Accordingly, active power stabilization is required for the MOPA laser system used in GW detectors.
Limited by ground vibration, gradient noise, and limited interferometer size (~kilometers long), ground-based GW detectors cannot receive GW signals below 10 Hz [8]. Space-borne GW detectors are expected to provide more information about the universe through GWs in the frequency range from 0.1 mHz to 1 Hz [9]. Space-borne GW detectors have been proposed, such as the Laser Interferometer Space Antenna (LISA) [10], TianQin [11], and Taiji [12]. All the MOPA lasers in these schemes require single-frequency radiation with 2~5 W of output power in a diffraction-limited beam and a relative power stability of better than 2 × 10 4 / H z at a Fourier frequency of 1 mHz [13].
To date, many studies have been devoted to low-noise lasers for LISA [14,15,16,17,18]. The baseline architecture for the laser consists of a low-power, low-noise master oscillator followed by a power amplifier stage with ~2 W output. As early as 2005, M. Tröbs reported a MOPA laser with an output power of 1 W [16]. In this work, a quartz glass wedge in free space was used for stable laser sampling. In the electronic feedback loop, a voltage reference (AD587 KN) was employed, and the temperature coefficient of AD587KN was up to 10 ppm/K. The best RIN result of −90 dBc/Hz @ 1 mHz was obtained through electronic feedback to the pump diode current, temperature stabilization of the photodiode, quartz wedge, and voltage reference. In 2017, Camp. J compared the intensity noise between a stand-alone nonplanar ring oscillator (NPRO) and a planar-waveguide external-cavity diode laser (PW-ECL) built by Redfern Integrated Optics Incorporated (RIO) [17]. The results show that the PW-ECL intensity noise is significantly lower than that of NPRO at frequencies from 0.1 mHz to 1 mHz. The amplifier contained a semiconductor optical amplifier (SOA) as a preamplifier and a fiber amplifier as a power amplifier. The laser system used a robust mechanical design and temperature stabilization to suppress fiber-length variations. By stabilizing the amplifier pump-diode current, an amplitude noise attenuation of ~30 was achieved at a frequency of 0.1 mHz. In 2018, K. Dahl reported a MOPA design including an extended cavity diode laser (ECDL) as the master oscillator, and two amplification stages as the power amplifier with a 2.1 W output power [18]. However, the RIN below the frequency of 3 mHz still fell behind the requirement of LISA. In 2019, Numata. K reported a highly stable MOPA laser system with a 2.5 W output [9]. The adopted micro NPRO (m-NPRO) has the lowest noise level. By stabilizing the pump-diode current in the amplifier, the intensity noise at approximately 1 mHz can be greatly improved.
Recently, Chinese space GW detection projects have been developing quickly. TianQin-1 and Taiji-1 have successfully completed in-orbit tests. A distributed Bragg reflector (DBR) laser, operating at a wavelength of 1064 nm and power level of approximately 20 mW, was adapted to the space environment of the TianQin-1 mission [19]. In Taiji-1, a high-stability Nd:YAG laser was tested. The main output power was 40 mW and the intensity noise reached −74 dBc/Hz @ 0.1 Hz [20]. TianQin-2 and Taiji-2 are scheduled to launch a pair of satellites in 2023–2025 to make a major technological breakthrough in testing high-precision intersatellite laser interferometry [8]. Ongoing plans would require a laser system with an optical power higher than 2 W and with low-intensity noise down to the millihertz range. To reduce the intensity noise, a low-noise seed source and a fiber amplifier with photoelectric feedback and active temperature control techniques are essential [21].
In this work, we demonstrate a low-intensity noise, single-frequency, all-fiber amplifier oriented to Chinese space-borne GW detectors. First, we present a theoretical noise model in the feedback loop to guide the fiber amplifier design. The intensity noise suppression scheme designed for the amplifier will be discussed with special emphasis. Then, we present a low-intensity noise Yb-doped all-fiber amplifier with an average power of 2.5 W. All polarization-maintaining fibers and fiber components are adopted to improve the long-term mechanical stability and reliability of the fiber amplifier. It produced a strongly linearly polarized output at 1064.35 nm with a linewidth of 1 kHz and a maximum output power of 5 W. By stabilizing the amplifier pump laser diode (LD) current and the temperature of the pump LD and fiber components, the RIN of the amplified laser was suppressed to −72.5 dBc/Hz @ 1 mHz and −90 dBc/Hz @ 0.1 Hz when the output power of the laser is 2.5 W. In addition, we measured the additional linewidth induced by the amplified laser, and the results indicate that no additional linewidth could be measured for the fiber amplifier.

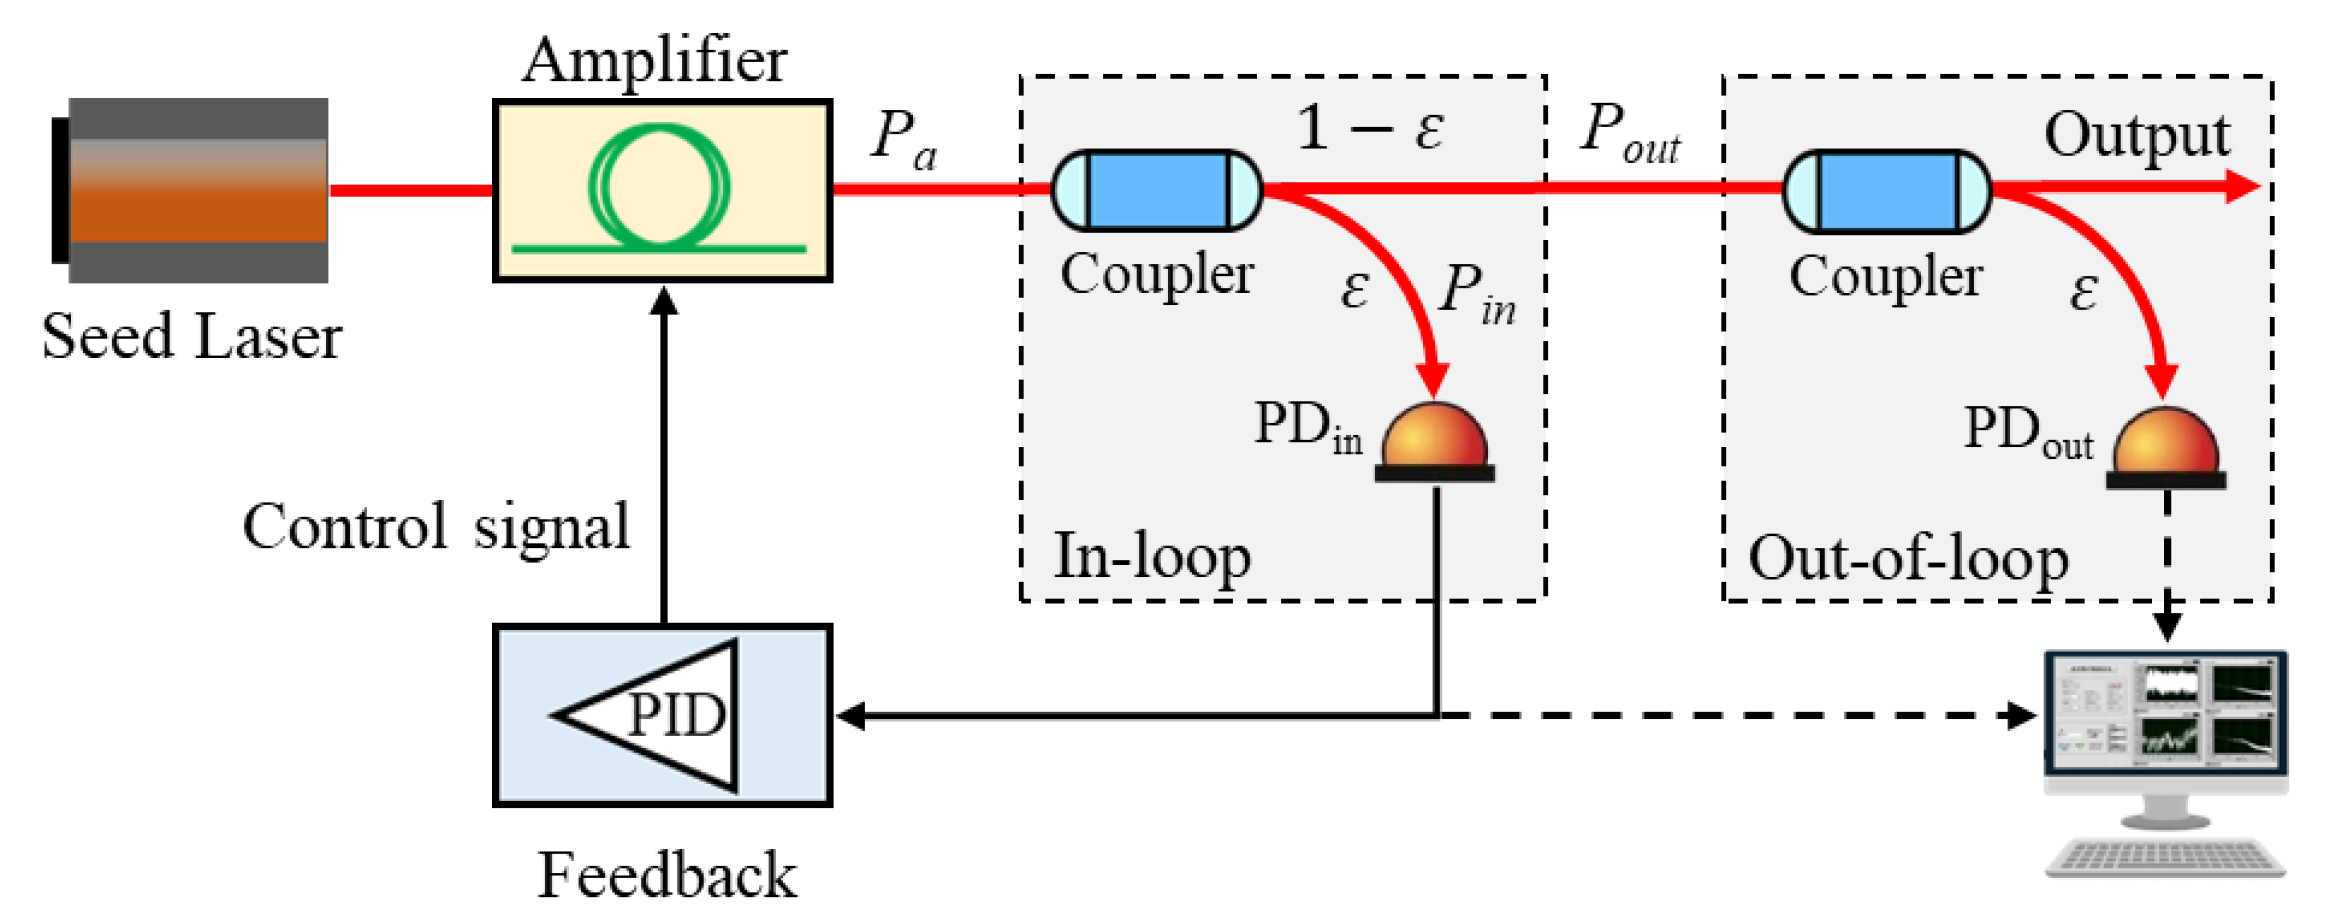
2. Theoretical Noise Model

We first model the intensity noise in MOPA with feedback-loop-based intensity noise suppression. Figure 1 shows a schematic of the intensity noise suppression feedback loop. The seed laser is amplified by an all-fiber amplifier, and a fraction (ε) of the amplified laser Pa is directed to a photodetector (PDin) to generate the error signal for the proportional-integral-derivative (PID) controller. The current of the amplifier pump LD changed in real time according to the control signal to suppress the temporal power fluctuations of the amplifier output. The components in the feedback loop, i.e., the pump LD, the fiber splitters, the PDin, and the PID controller, induce excess noise in the laser output.
The seed power can be described as
P s = P ¯ s + δ P s ,
where P s and δ P s stand for the average and fluctuations of the seed laser, respectively.
The amplified laser can be written as
P a = G P s + δ P f = G P ¯ s + G δ P s + δ P f ,
where G and δ P f stand for the gain of the amplifier and the fluctuations induced by the feedback loop, respectively. The amplified laser is then divided into two beams by a fiber splitter with a coupling ratio ε. The in-loop and out-of-loop power can be given by
P i n = ε δ ε P a = ε P a δ ε P a = ε P a δ P ε ,
P o u t = ( 1 ε + δ ε ) P a = 1 ε P a + δ ε P a = 1 ε P a + δ P ε ,
where δ ε and δ P ε stand for the coupling ratio fluctuations and the power fluctuations induced by the fiber splitter, respectively.
In the feedback loop, the photocurrent I i n can be expressed as
I i n = δ P i n = P i n δ P i n = P i n δ I p d ,
I i n = ε G P ¯ + ε G δ P s + ε δ P f δ P ε δ I p d ,
where R and δ R represent the responsivity and responsivity fluctuations of the photodetector PDin, respectively, and δ I p d represents the photocurrent fluctuations induced by the photodetector PDin. Therefore, we can obtain
δ I i n = ε G δ P s + ε δ P f δ P ε δ I p d .
Although the fluctuations in the amplifier may depend on the transfer function of the feedback loop, we assume that the power fluctuations δ P f is frequency-independent [22], for simplicity. This means that δ P f = K δ I i n . Consequently, we can get
δ P f = K ε G δ P ^ s + K δ P ε + K δ I p d 1 + K ε .
Combining Equations (2) and (8), we obtain the expression for the total fluctuations of the amplified laser δ P a as
δ P a = G δ P s + δ P f = G δ P s + K δ P ε + K δ I p d 1 + K ε .
Then, combining Equations (3), (4) and (9), we obtain the expression for the total fluctuations of the in-loop δ P i n and out-of-loop δ P o u t as
δ P i n = ε δ P a δ P ε = ε G δ P s δ P ε + ε K δ I p d 1 + K ε ,
δ P o u t = 1 ε δ P a + δ P ε = 1 ε G δ P s + K + 1 δ P ε + 1 ε K δ I p d 1 + K ε .
Equations (10) and (11) show that the total fluctuations of the in-loop and out-of-loop are quite different. Equation (11) shows that δ P o u t is determined by the seed power fluctuations, the gain of the amplifier, the fluctuations induced by the fiber splitter and photodetector, and the negative feedback gain. We focus on the power fluctuations of the out-of-loop and expect it to be as small as possible. For a given seed, the noise suppression scheme involves choosing a low feedback gain, keeping the coupling ratio ε stable, and controlling the temperatures of the photodetector and amplifier to reduce the thermal noise. This is the guideline for our experimental investigations.

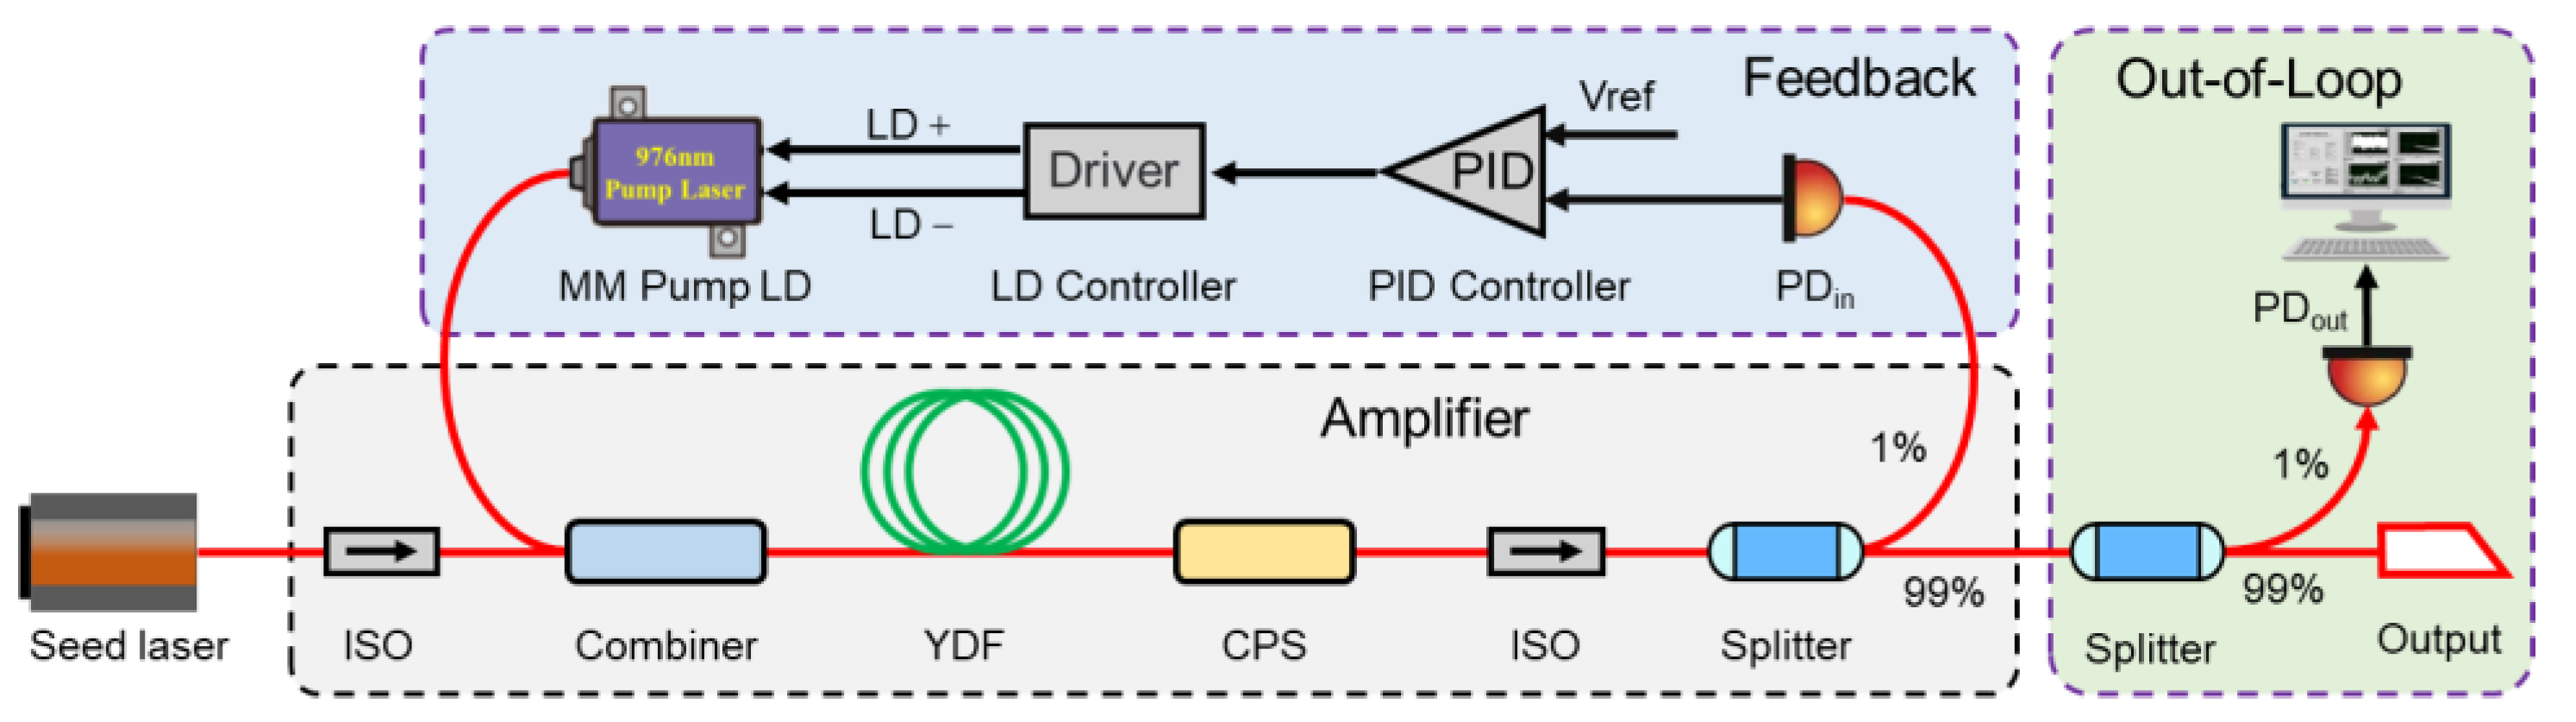
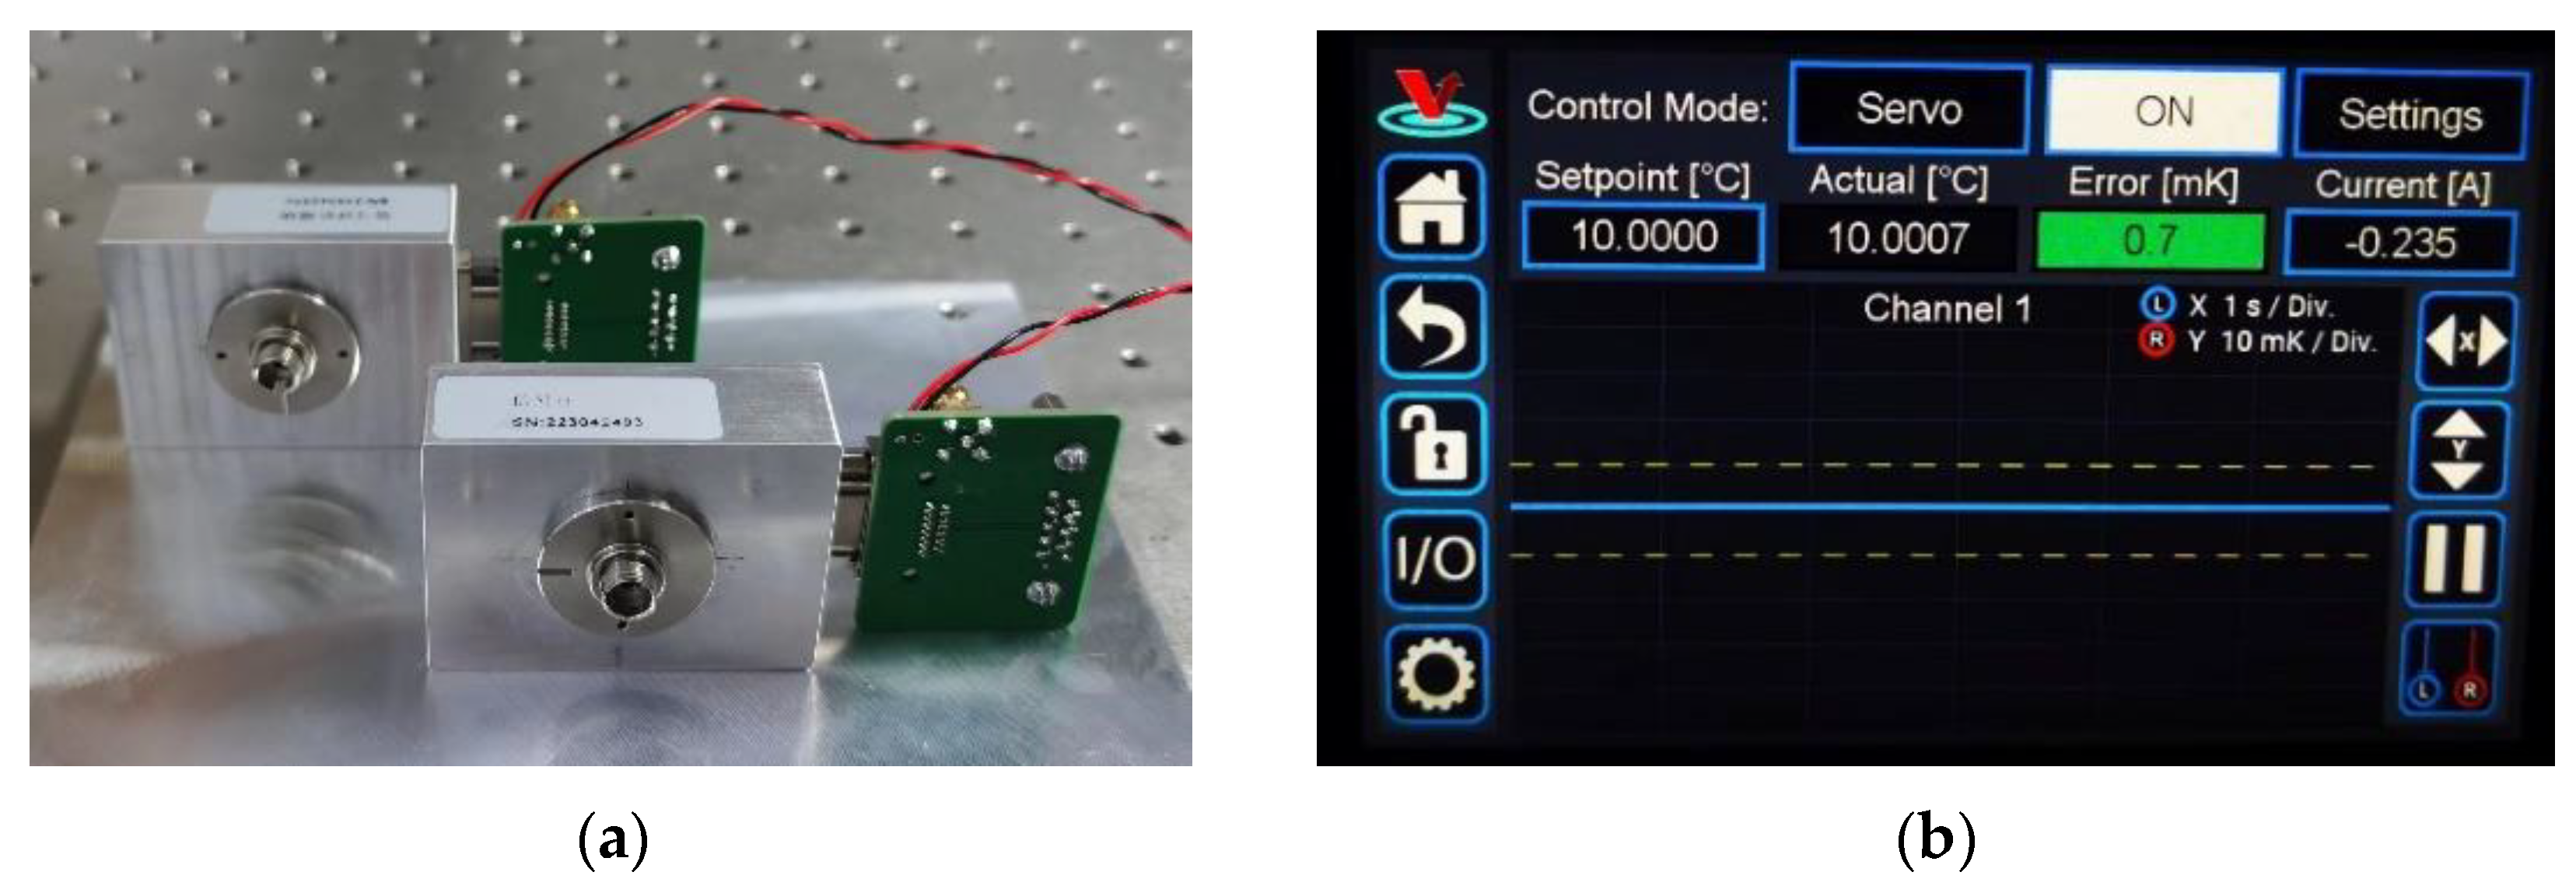
3. Experimental Setup

Figure 2 shows the schematic for the low-noise laser system. The fiber amplifier is seeded by a low-noise, narrow-linewidth (<1 kHz), single-frequency Nd:YAG NPRO emitting at 1064.35 nm with an output power of 100 mW injected into the fiber amplifier via an optical fiber isolator (ISO) to avoid any possible backscattered light and stimulated Brillouin scattering (SBS) light in the amplifier.
The fiber amplifier uses a 2.5 m long Yb-doped polarization-maintaining fiber (Nufern, PLMA-YDF-10/125, CA, USA) forward-pumped by a wavelength-stabilized pump-diode module (BWT, K976AA2RN, Beijing, China) operating at 976 nm, which can deliver up to 18 W of CW power at the maximum current of 11 A. The active fiber has a core/cladding diameter of 10/125 µm and a core numerical aperture of 0.08, making it single-moded at 1064 nm. It has a cladding absorption of 4.9 dB/m at 976 nm. The forward-pump scheme is employed to minimize potential feedback and possible catastrophic damage. After cladding power stripper (CPS) and fiber isolator, the amplified laser is divided into two laser beams (1% for feedback and 99% for out-of-loop test) by a fiber splitter. The 1% laser beam was attenuated and detected by a low-noise photodetector (PDin). The output of the PID controller (SRS, SIM 960, Santa Clara, CA, USA) is used to control the pump LD current in real time. The second fiber splitter (1:99) is employed for out-of-loop noise evaluation. It is worth noting that all the components involved are in polarization-maintaining fiber format to have excellent long-term mechanical stability and maintenance-free operation. The fiber amplifier and the feedback loop are placed in an aluminum alloy box with good vibration isolation and good temperature stabilization.

4. Results and Discussion

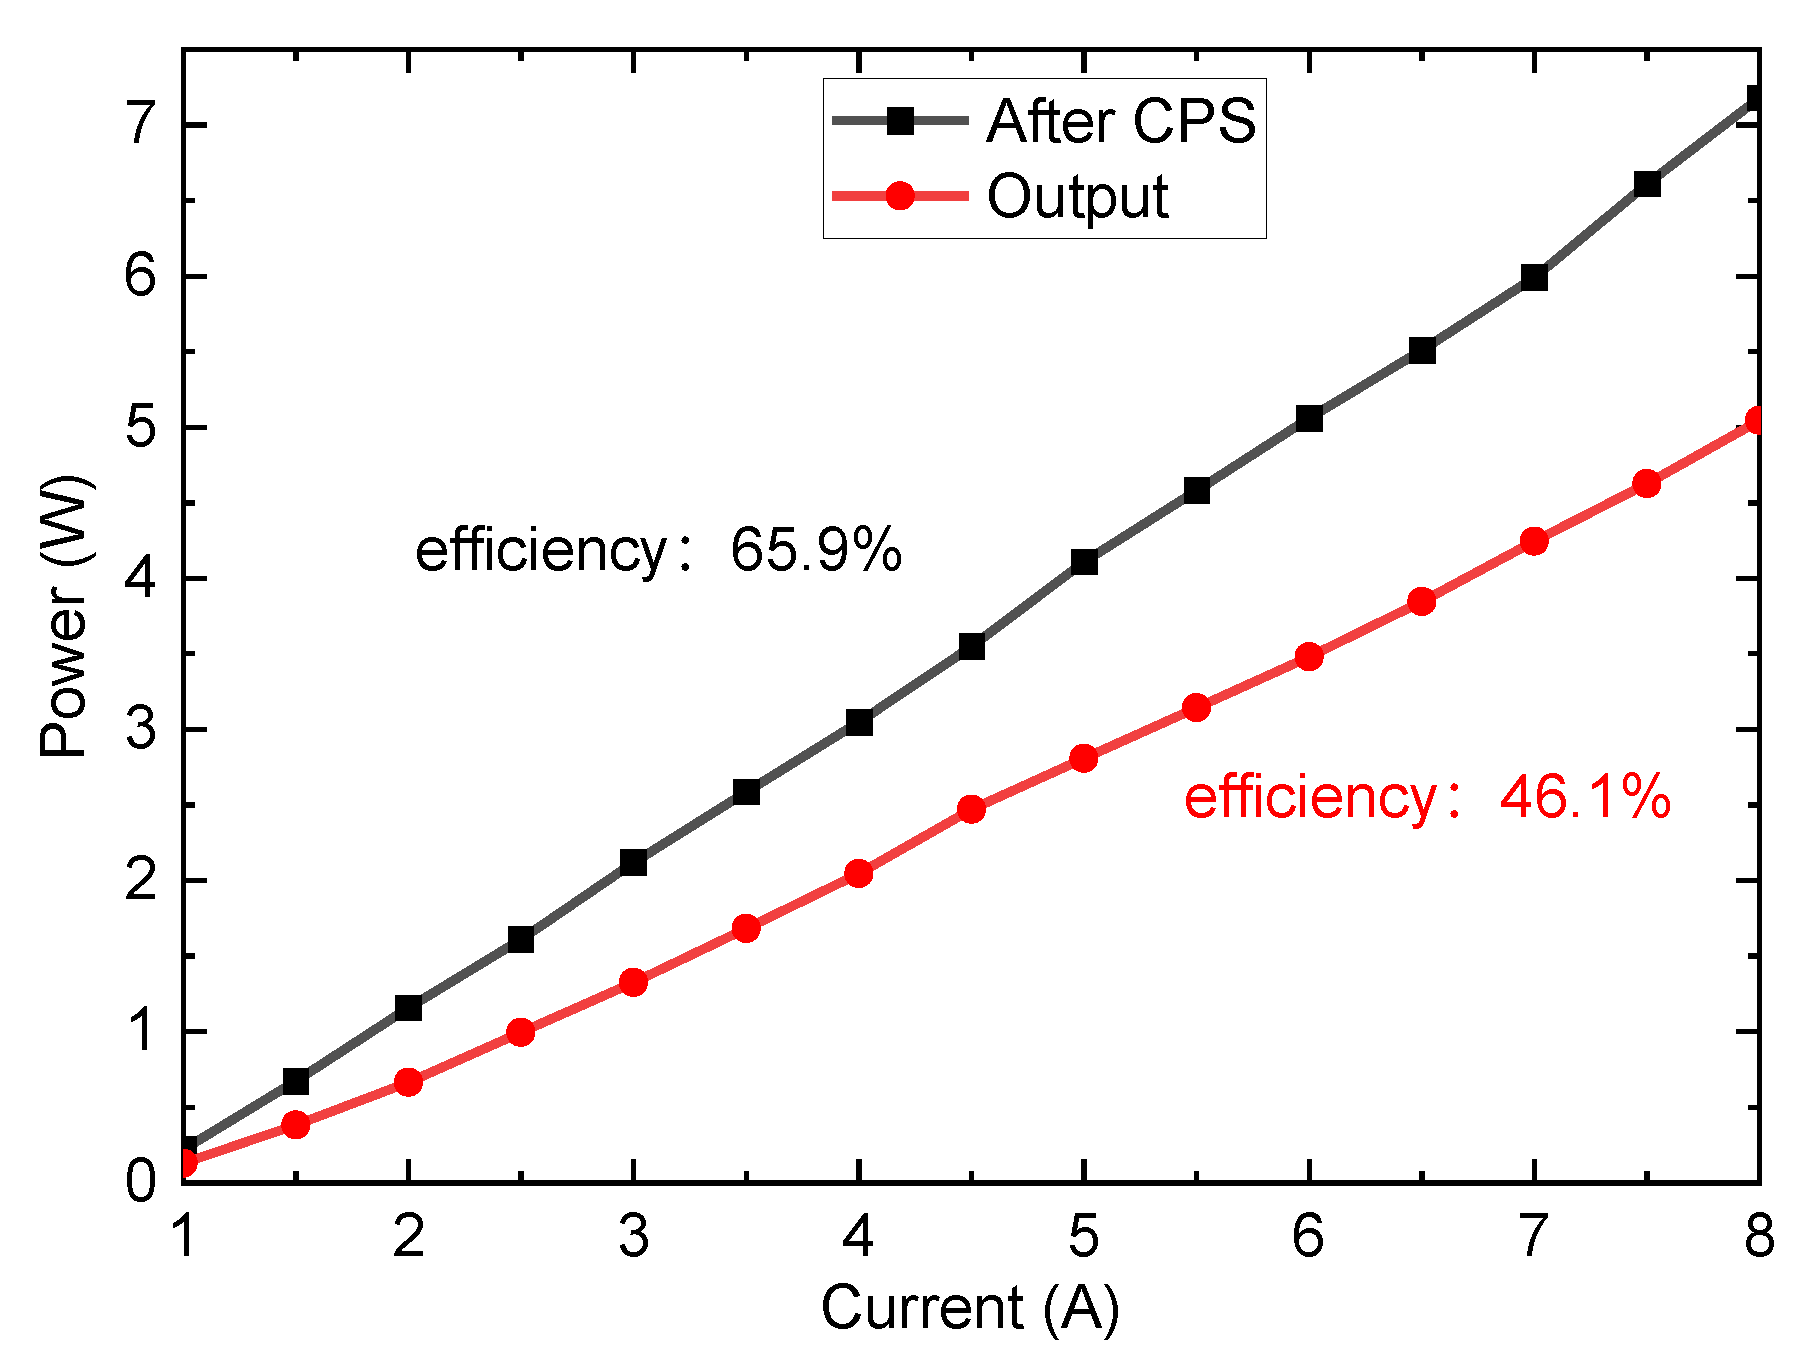
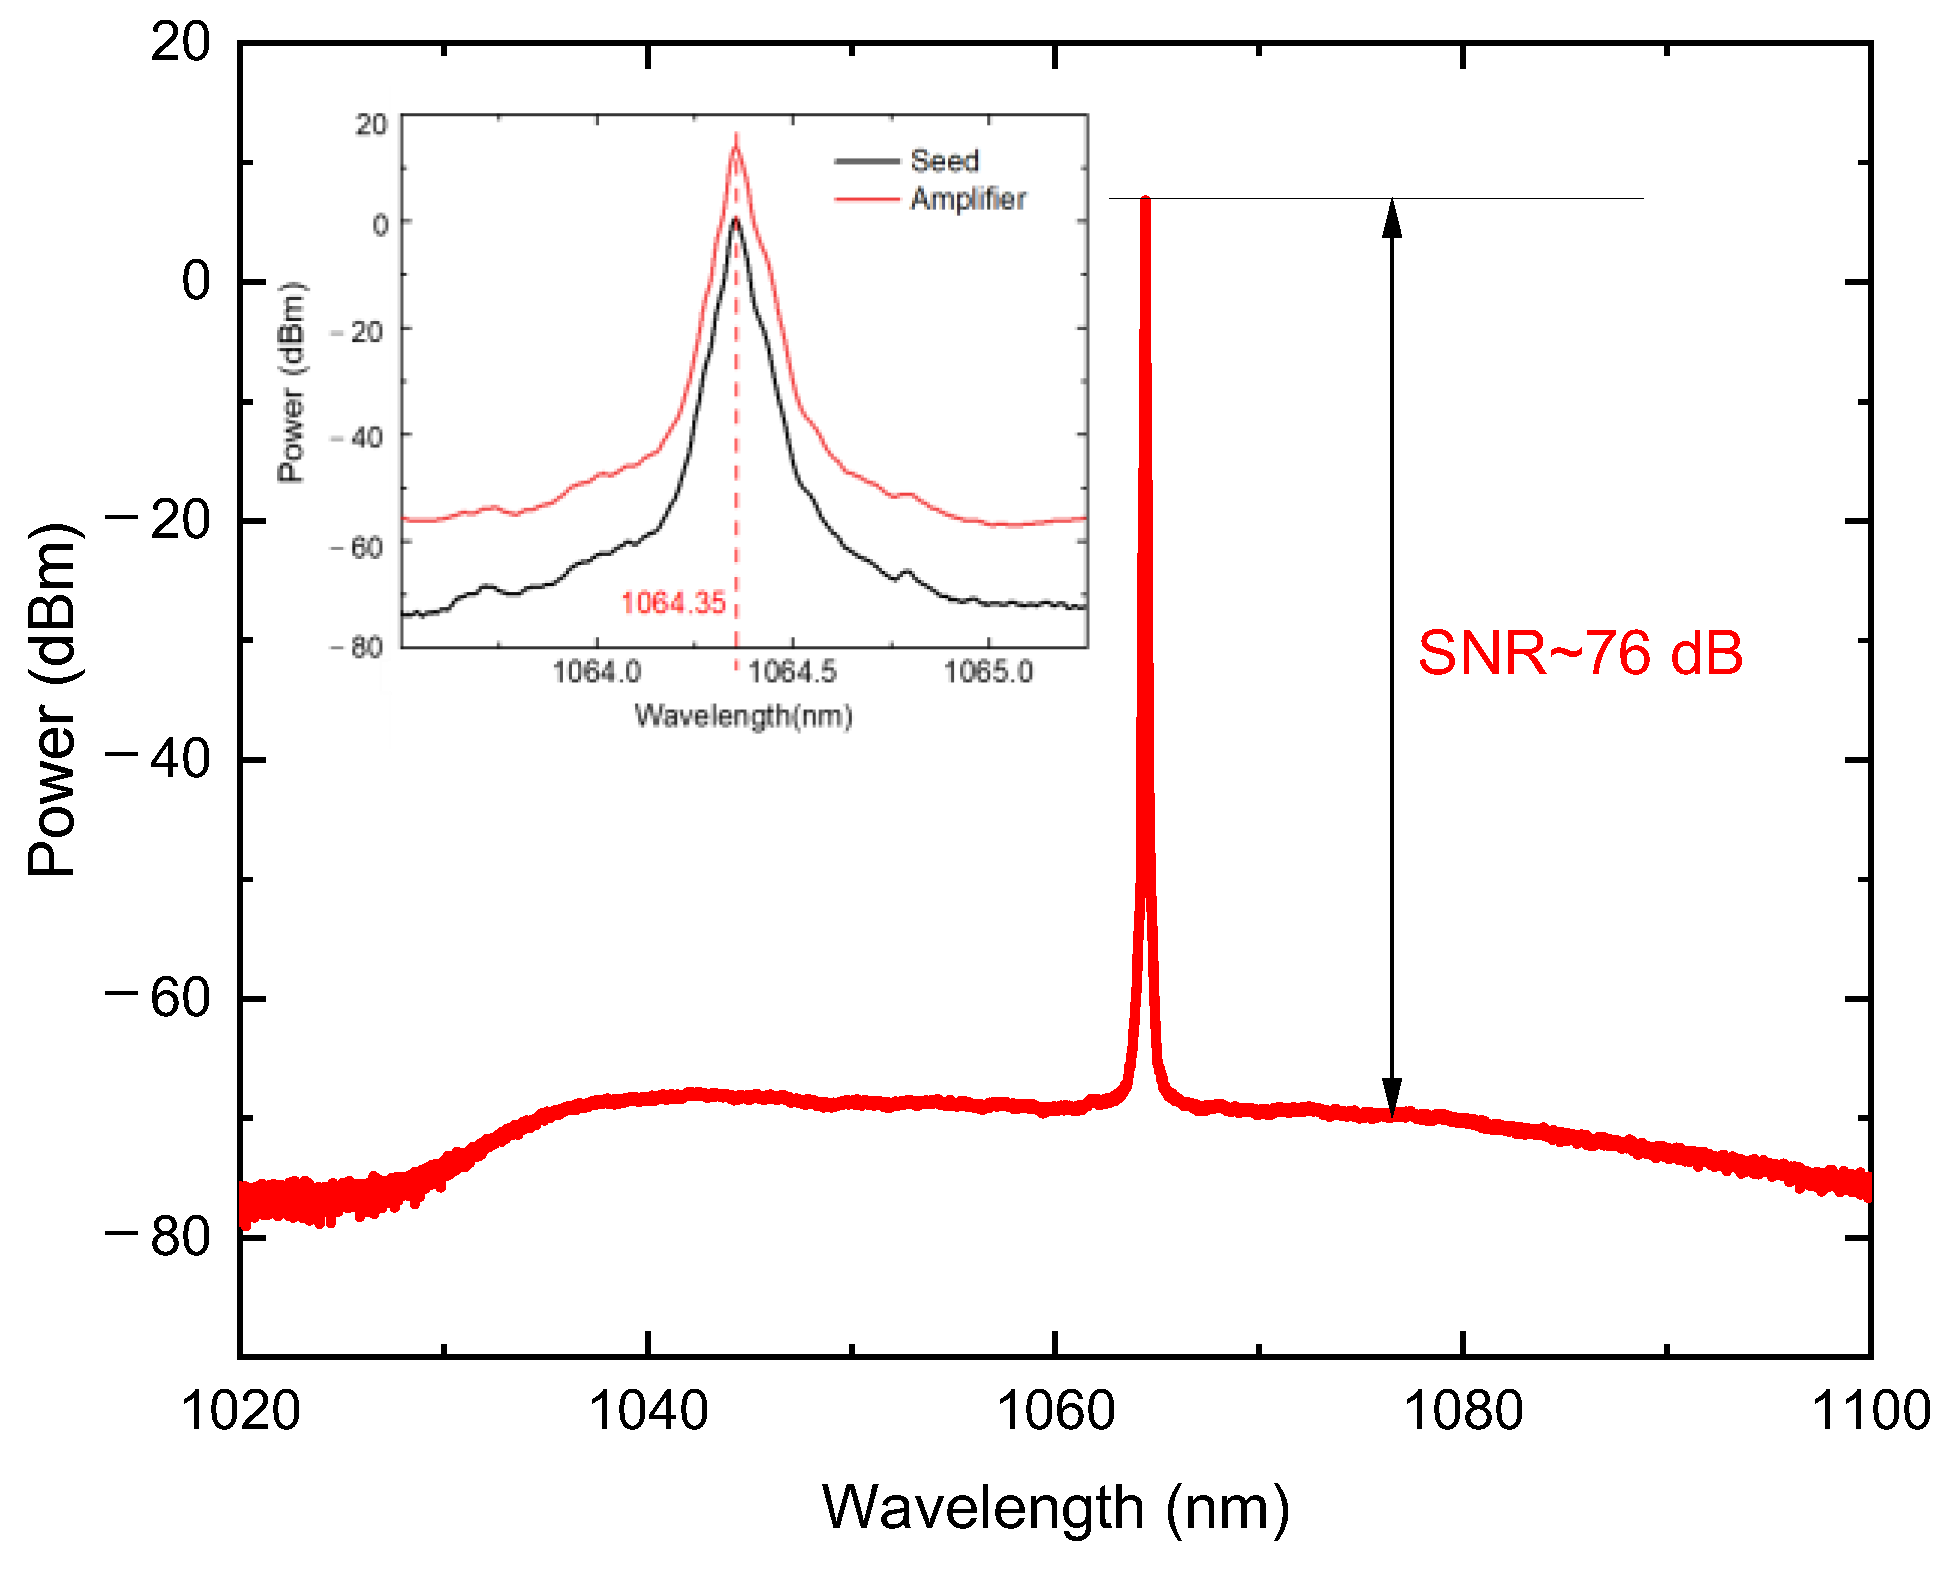
4.1. Power, Slope Efficiency, and Optical Spectrum

In our experiments, we recorded the power after CPS and the output power of the low-noise fiber amplifiers with an optical power meter (Ophir, Starlite, Jerusalem, Israel). As shown in Figure 3, the power increases linearly with the pump current. The amplifier with 100 mW seed can deliver an output power up to 5 W when the pump current is 8 A, and the corresponding slope efficiency is 46.1%. However, the output power and slope efficiency are less than the results after CPS. We consider that this difference was caused by the insert loss of the optical devise and fiber fusion loss in the fiber amplifier. The total loss after CPS is approximately 1.5 dB. Compared to the laser in [18], our fiber amplifier is comparable in terms of output power and slope efficiency.
The signal-to-noise ratio (SNR) of the seed and amplified laser was detected by an optical spectrum analyzer (OSA) covering the spectral range from 950 to 1500 nm (YOKOGAWA, AQ6370D, Tokyo, Japan). The spectrum was obtained at 2.5 W output of the amplifier operation with a gain of 14 dB. Figure 4 shows the measured results. There is no ASE at approximately 1030 nm. The SNR is higher than 75 dB, and negligible degradation is observed.

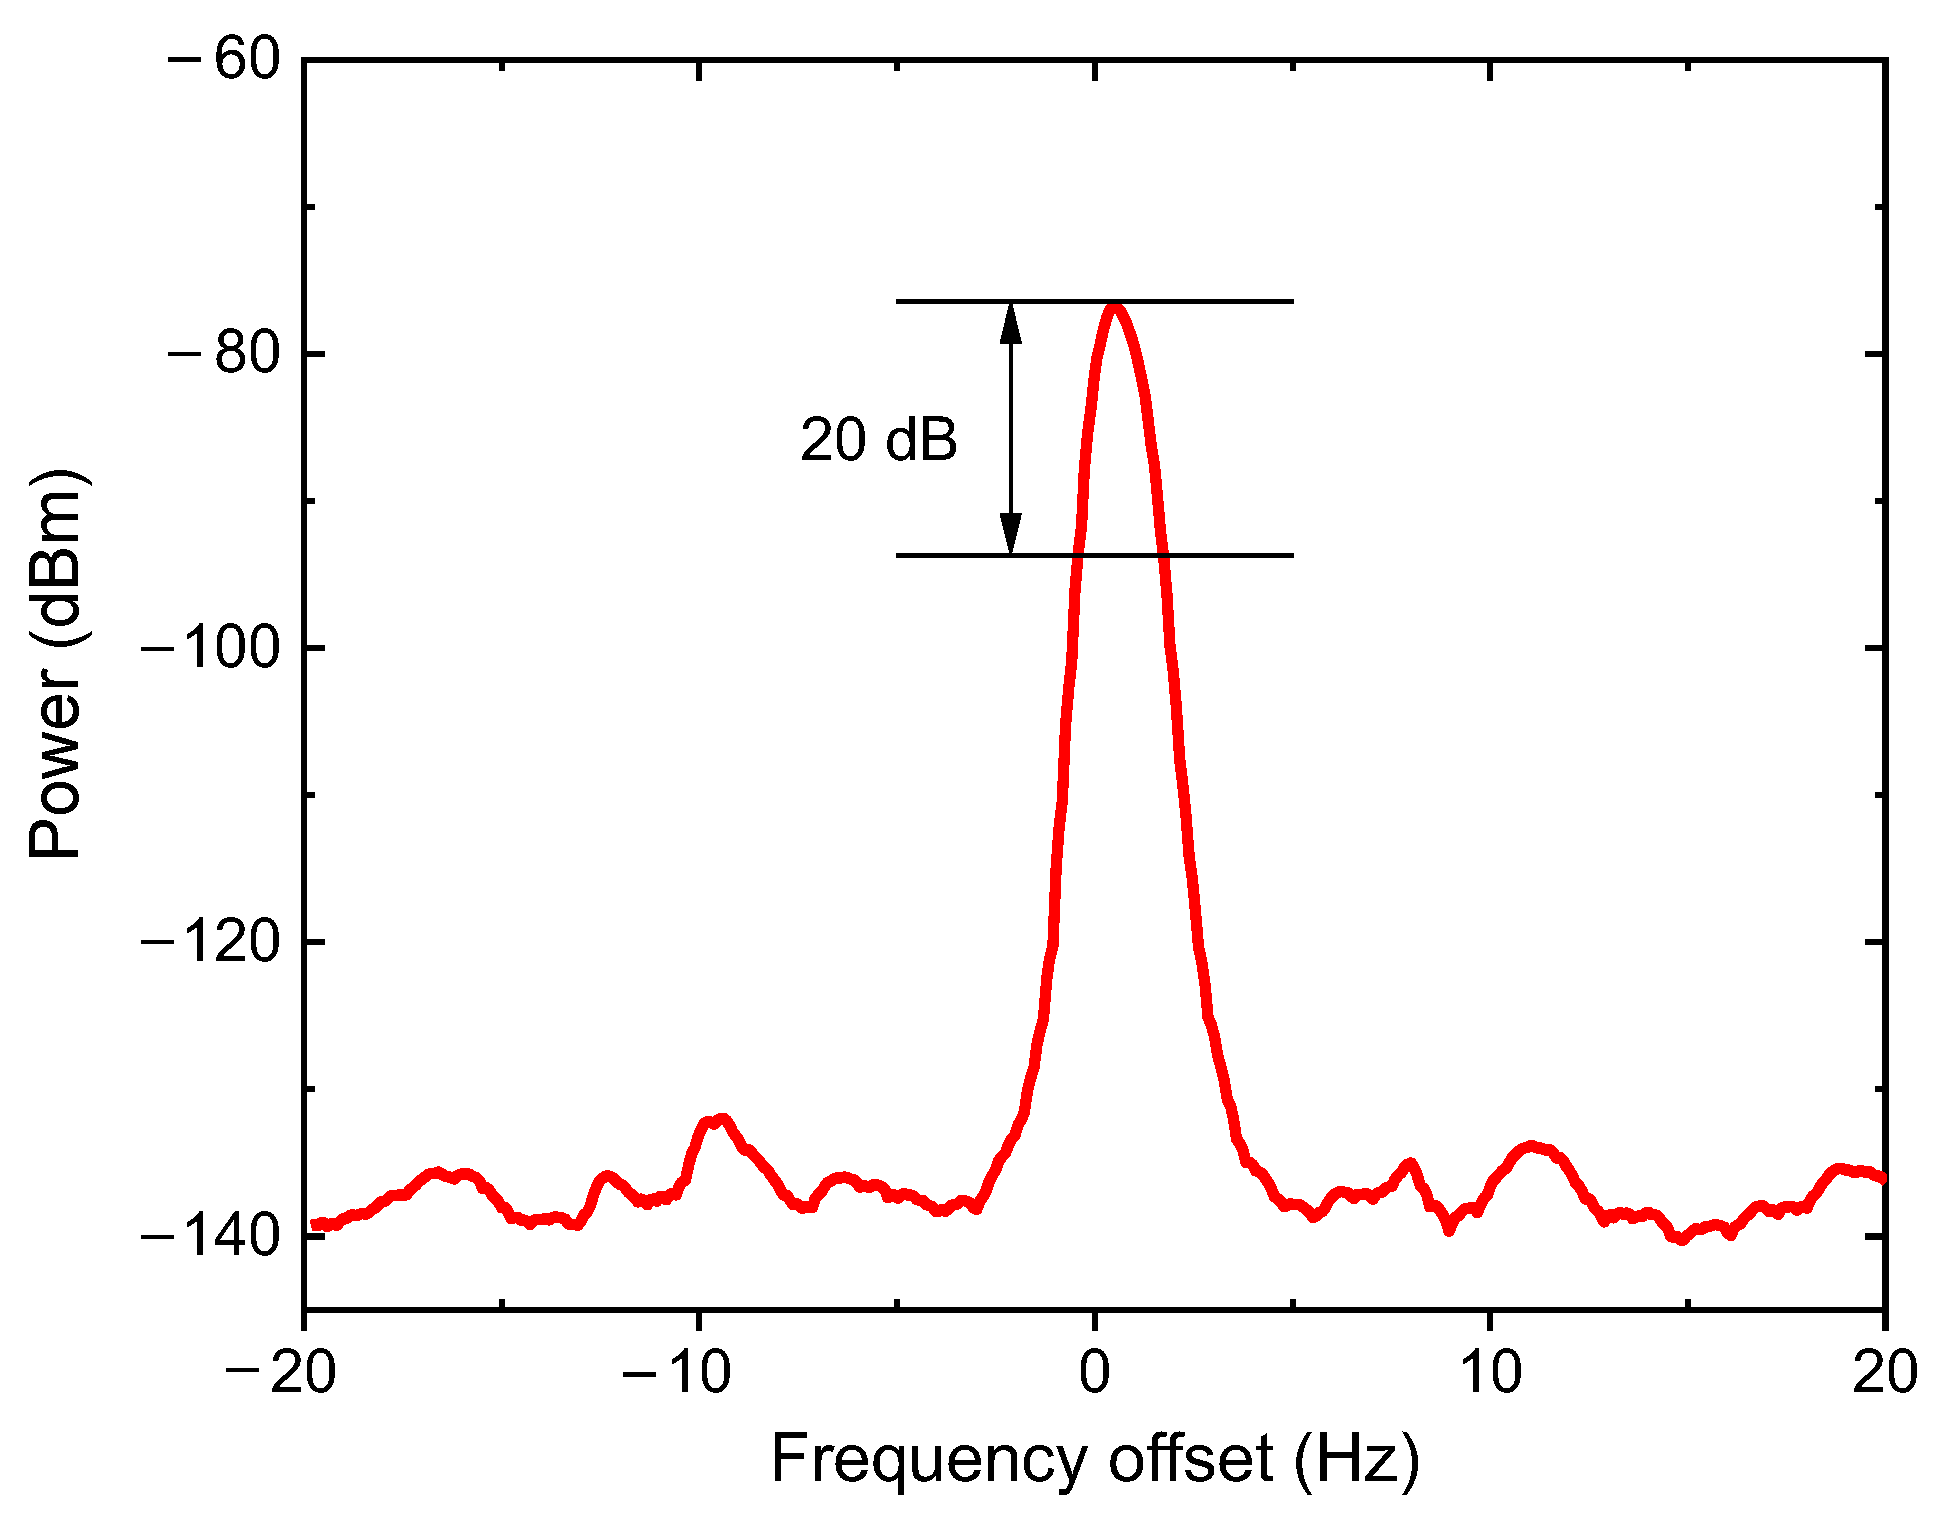
4.2. Measurement of Additional Linewidth

Linewidth broadening in fiber amplifiers has been controversial for decades [7,22,23,24]. To precisely measure the additional linewidth of the low-noise Yb-doped fiber amplifier, we use a balanced Mach–Zehnder heterodyne interferometer scheme shown in Figure 5, with a delayed line fiber approximately 10 m long and a 100 MHz acousto-optic modulator (AOM). The two arms are combined by a 3-dB coupler and detected by a low-noise photodetector. The power spectrum of the photodetector output is displayed on a spectrum analyzer (R&S, FSU, Munich, Germany). The fiber amplifier is placed in one of the arms, and the two arms are tuned to have roughly the same path length to eliminate the linewidth error caused by the otherwise imbalance of the interferometer. The technique effectively deconvolves the seed laser spectrum from the amplifier spectral broadening and provides an output that consists solely of the amplifier spectral broadening response to a spectrum passing through the amplifier [24].
The measured power spectral density of the amplifier spectral broadening is shown in Figure 6. The span and resolution of the spectrum analyzer (R&S, FSU, Munich, Germany) are set as 40 Hz and 1 Hz, respectively. The additional linewidth of the amplifier was measured to be less than 2 Hz @ 20 dB, and the 3-dB additional linewidth can be calculated to be 0.1 Hz [25]. The result indicates that the additional linewidth induced by the fiber amplifier could be negligible compared with the linewidth of the seed laser.

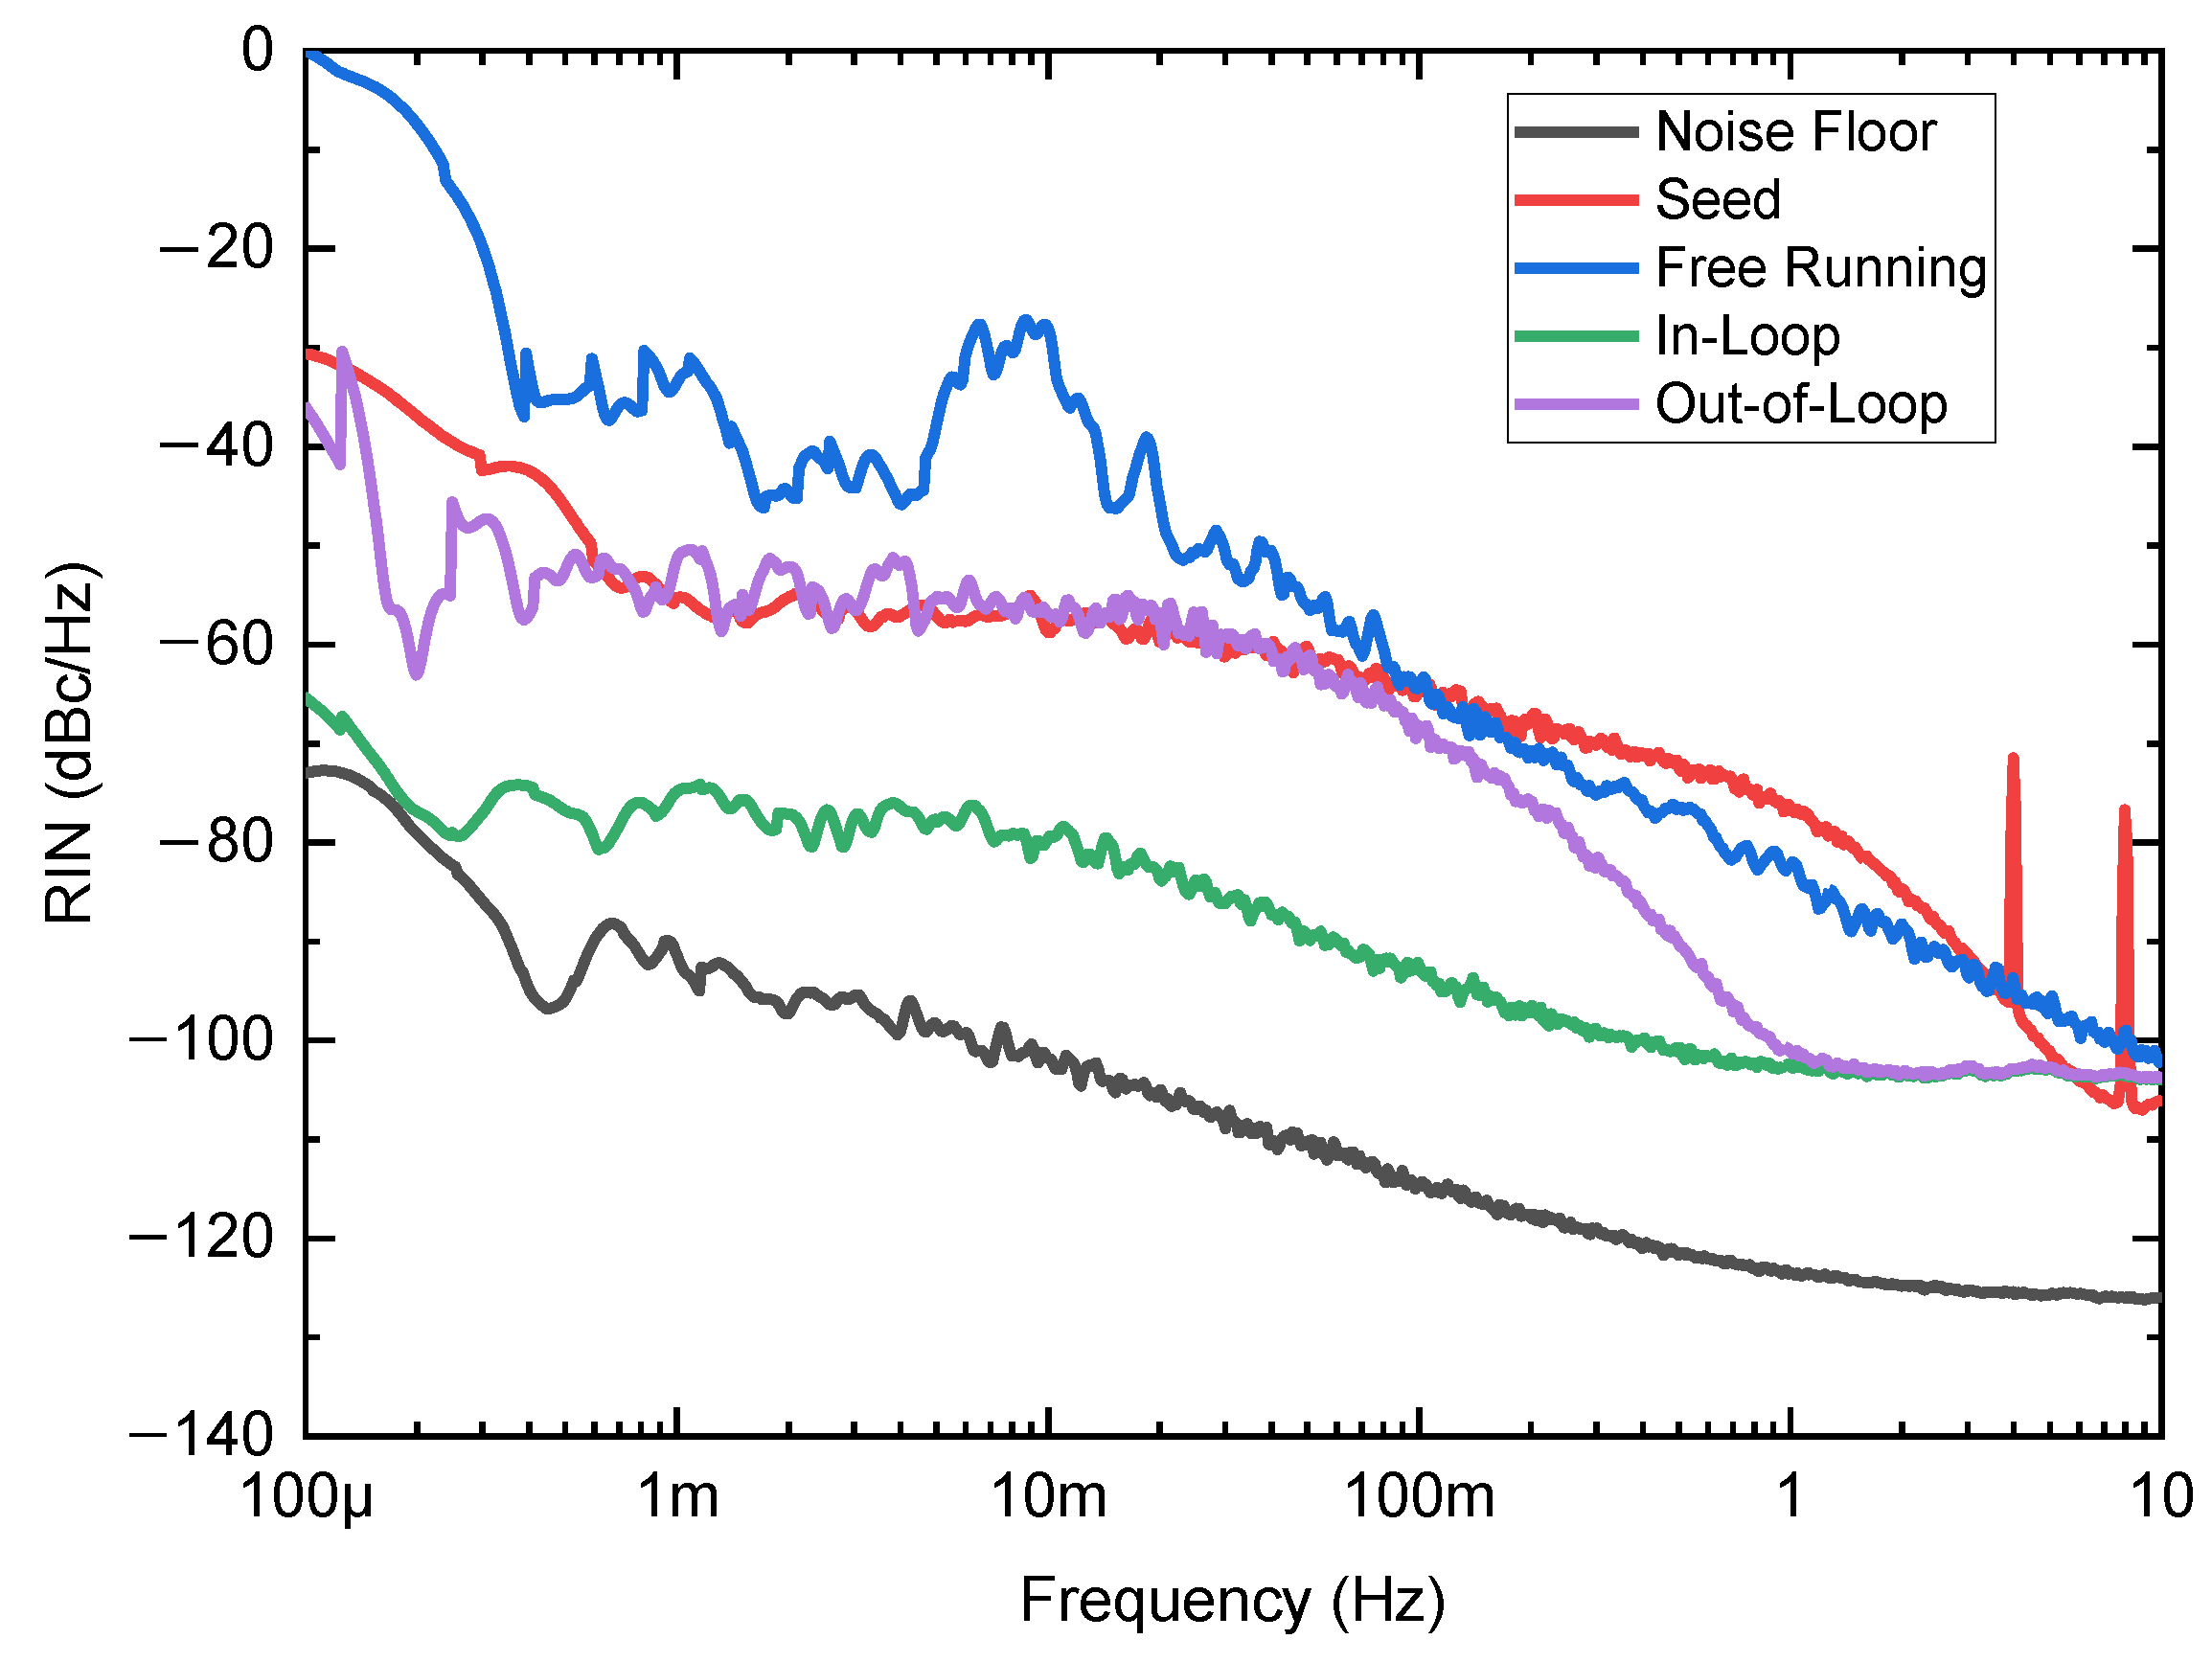
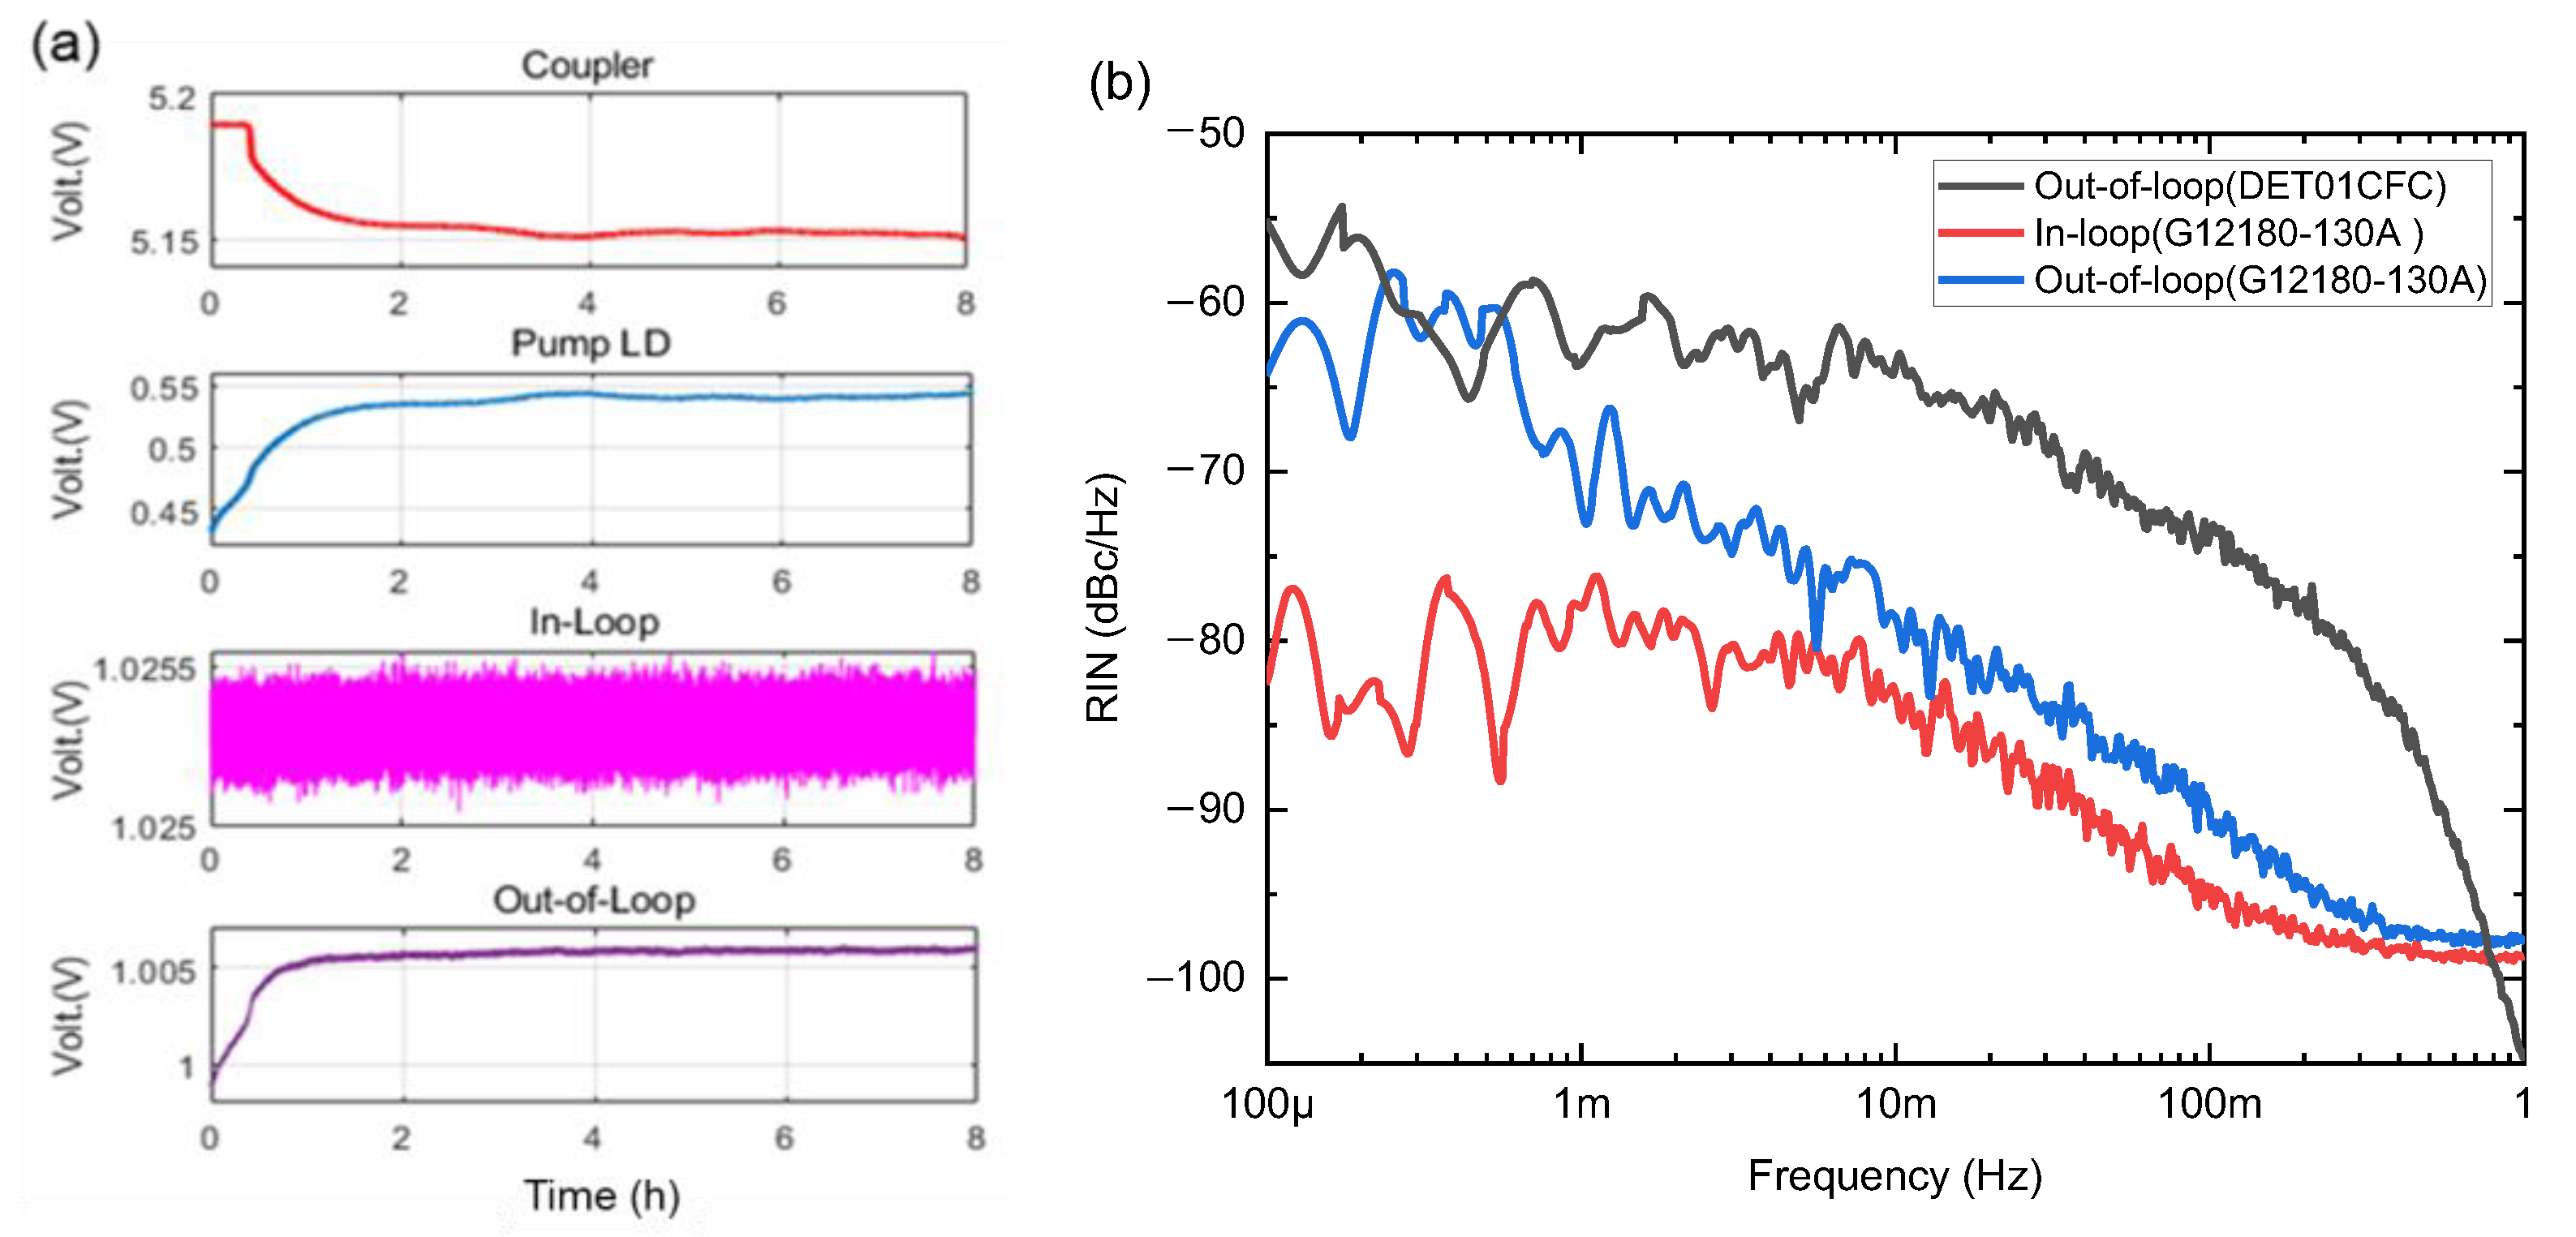
4.3. Measurement of the RIN

Limited by the measurement frequency range of commercial instruments, the measurement of the RIN in the millihertz range (1 mHz~1 Hz) is not straightforward. We developed a precision RIN measurement system, which consists of a low-noise photodetector (Thorlabs, DET01CFC/M, Newton, NJ, USA), a dynamic signal acquisition device (NI, PCI/PXI-4462, Austin, TX, USA) and a signal acquisition and processing program. The frequency resolution of the RIN measurement system is up to 2 μHz. We first measured the noise floor of the RIN measurement system in the frequency range from 0.1 mHz to 10 Hz. The result is shown by the black curve in Figure 7. In the frequency range from 1 mHz to 1 Hz, the noise floor is below −90 dBc/Hz. Then, we measured the RIN of the seed laser and the amplified laser operating at free running. Compared with the RIN of the seed laser (the red curve), the RIN of the amplified laser (the blue curve) obviously deteriorates in the frequency range below 0.1 Hz. As shown in Figure 7, the difference between the red curve and the blue curve at approximately 10 mHz exceeds 20 dB. The main reason for noise deterioration is pump noise, which can be reduced by stabilizing the pump current.
Following the guidelines shown in Section 2, we turned on the feedback loop and tried to minimize the out-of-loop RIN in the millihertz range by stabilizing the amplifier pump LD current. According to Equation (9), the intensity noise of the amplified laser can be reduced by choosing the optimal PID parameters. We tuned the PID parameters while monitoring the error signal with an oscilloscope, until the smallest error signal was observed. Then, we set the TEC temperature of the pump LD at 298 K and stabilize the pump LD temperature at 298 K ± 0.01 K. The RINs of the in-loop and out-of-loop are measured and shown by the green curve and purple curve in Figure 7, respectively. It can be seen that the RIN of the out-of-loop is lower than that when free running. In the frequency range from 1 mHz to 1 Hz, the RIN of the out-of-loop can be suppressed by 5~30 dB compared to the free running case. However, it is above −60 dBc/Hz below 30 mHz, which is slightly higher than the seed laser.

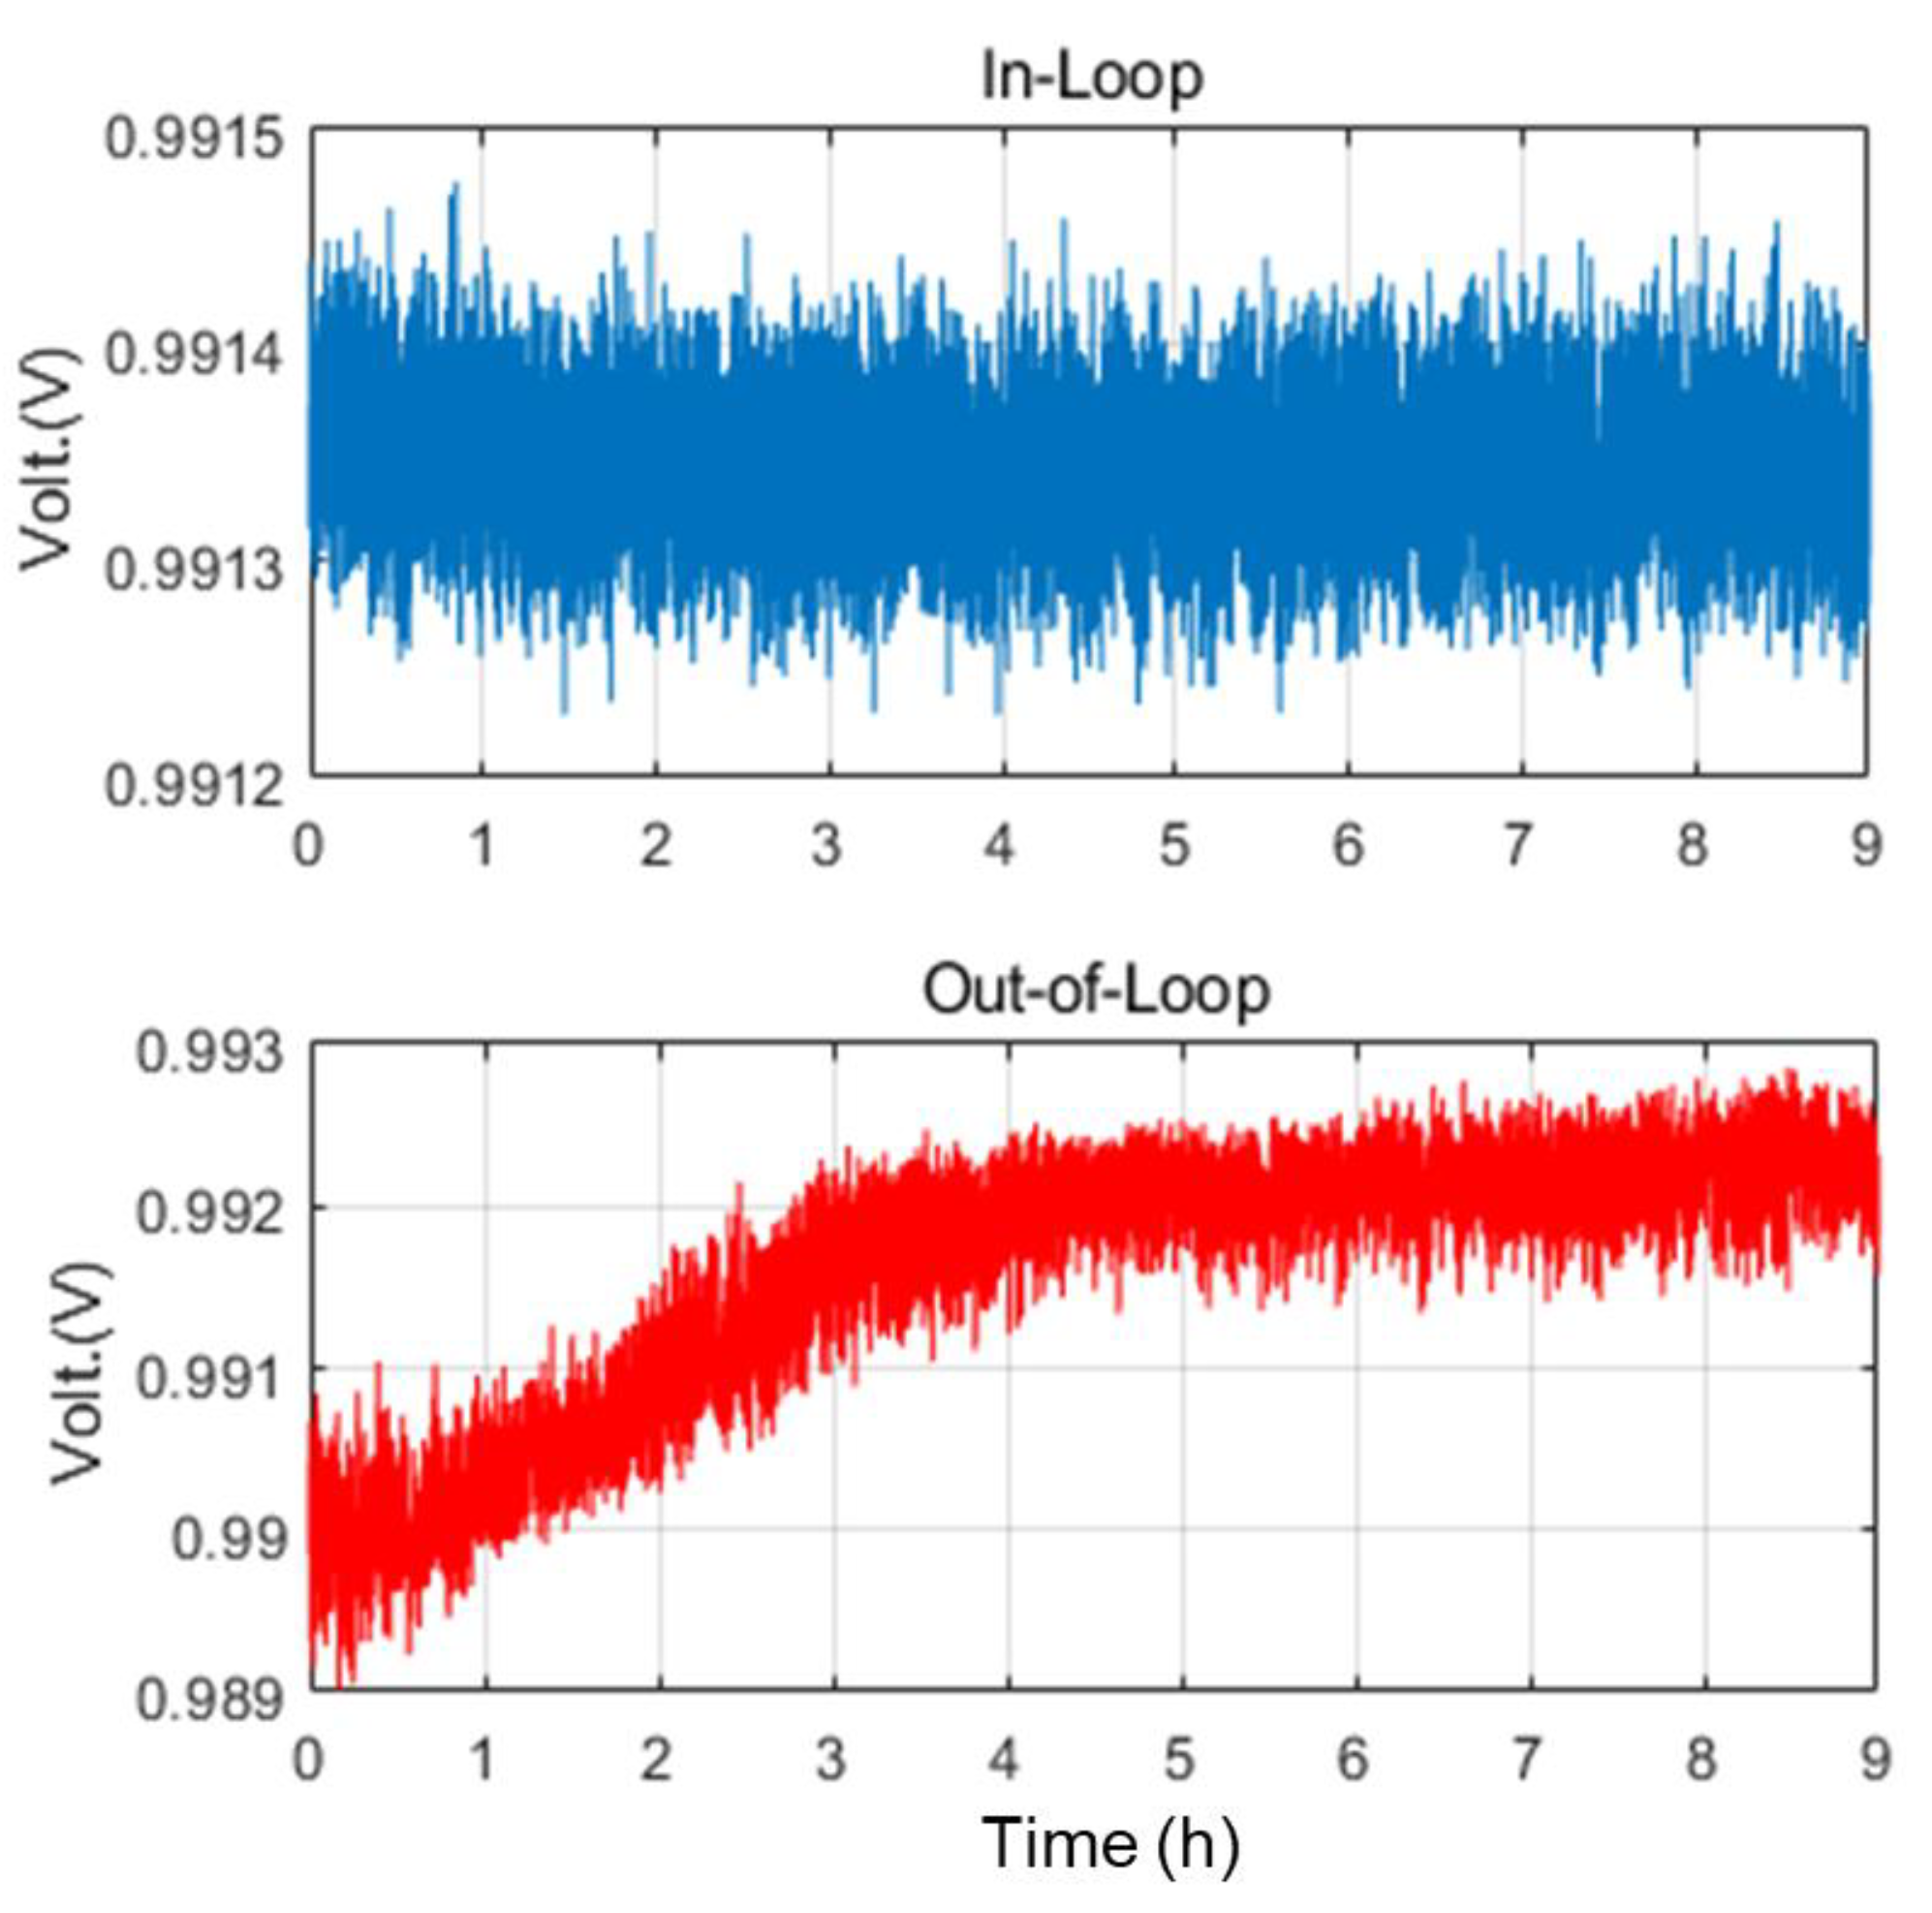
4.4. Optimization of the RIN

In the process of measurement, we found that air convection in the laboratory and intrinsic light heating may lead to temperature fluctuations in the fiber splitters and photodetector, which would bring fluctuations in the coupling ratio of the fiber splitters and the responsivity of the photodetectors. To verify this, we measured the temperatures of the laboratory and interior of the amplifier, the voltages used for monitoring the actual temperature of the fiber splitter, and the voltage of the PDout. As shown in Figure 8, the temperatures of the laboratory and interior of the fiber amplifier change synchronously with a period of approximately 9000 s. The temperature change of the fiber splitters is consistent with that in the interior of the fiber amplifier. When the temperature of the fiber splitter decreases, the power of the out-of-loop increases. The measured voltage of PDout also shows periodic fluctuations under the influence of the temperatures of the fiber splitters and interior of the amplifier.
To reduce the temperature fluctuations of the fiber splitters, we carefully designed a temperature control system, including a copper encapsulation jacketed by a thermal isolation coating and a precise temperature controller (Thorlabs, TED200C, Newton, NJ, USA) with a temperature stability of 1 mK. The temperature controller (TED200C) is operated with a thermistor temperature sensor (10 kΩ), and the analog output delivers a DC voltage, proportional to the actual temperature. For further measurement, we monitored the internal temperature of the amplifier after operating for 4 h, and set the temperature points for the pump LD and fiber couplers to be the same as the internal temperature of the amplifier. Then, the voltage fluctuations of the in-loop and out-of-loop are recorded as shown in Figure 9. The voltage fluctuations of the in-loop and out-of-loop are approximately 0.15 mV and 1 mW when the stable state in the amplifier is achieved. Compared to the out-of-loop voltage in Figure 8, the voltage fluctuations are reduced significantly.
Figure 10 shows the measured RIN of the in-loop and out-of-loop. The out-of-loop RIN is measured to be −63.2 dBc/Hz @ 1 mHz and −105.8 dBc/Hz @ 1 Hz. In the frequency range from 1 mHz to 1 Hz, the RIN can be reduced to −60 dBc/Hz, with a further improvement of approximately 16 dBc/Hz @ 1 mHz compared to the out-of-loop RIN without temperature stabilization of the fiber splitters (the black curve).
Another important noise source in the feedback loop is the temperature-dependent responsivity of the photodetector, which deteriorates the performance of the power stabilization feedback loop. The photodetector PDin can induce electronic and thermal noise, which affects the intensity noise of the amplified laser. In the feedback loop, the noise of PDin adds to the control signal and impresses equivalent fluctuations with the opposite sign onto the output laser beam. To verify the influence of different photodetectors, a temperature-stabilized detector with a one-stage TE-cooled system (Hamamatsu, G12180-130A, Hamamatsu, Japan) is employed to replace the detector (Thorlabs, DET01DFC/M, NJ, USA) used in the RIN measurement system. Table 1 shows their typical specifications.
When we apply a biased voltage to a photodetector, the dark current varies directly with temperature. This suggests that the dark current can approximately double for every 10 K increase in temperature. Moreover, a higher bias will increase the amount of dark current present. When the photodetector temperature rises, the spectral dark current increases exponentially. From Table 1, we can see that the G12180-130A with one-stage TE-cooling has a lower dark current (0.15 nA) and bias voltage (1.2 V) than the DET01DFC/M, and can be used at a constant operating temperature. We chose the SLICE-QTC four-channel temperature controller to stabilize the temperature of the G12180-130A photodetector. In our experiment, we designed a packaging for the photodetectors, as shown in Figure 11a. Figure 11b shows the detailed parameters of the setpoint, actual and error temperature, and transducer current.
Figure 12 shows the measured voltage fluctuations and RINs employing G12180-130A with 1.2 V bias voltage. The photodetector is temperature-stabilized at 283.15 K and the temperature fluctuations are within 0.7 mK during the measurements. When the internal temperature of the amplifier reaches a steady state, the voltage fluctuations for the out-of-loop detector are approximately 0.3 mV and the out-of-loop RIN is −72.5 dBc/Hz @ 1 mHz and −90 dBc/Hz @ 0.1 Hz, as shown in Figure 12b. This is a further 10 dB improvement in the millihertz range of 1 mHz~1 Hz compared to Figure 10. However, except for frequencies below 3 mHz, it is well within the requirement of LISA. Compared to the out-of-loop RIN in [18], our result is lower than −70.5 dBc/Hz (3.0 × 10⁻⁴/Hz−1/2) at 1 mHz, but higher than −114 dBc/Hz (2.0 × 10⁻⁶/Hz−1/2) at 1 Hz.

5. Conclusions

We have demonstrated an all-fiber low-intensity noise Yb-doped amplifier seeded by a narrow-linewidth low-noise NPRO laser. The intensity noise is greatly suppressed by a well-designed feedback loop and temperature control of the pump LD, fiber splitter and photodetector. By using a theoretical noise model, we recognize the most important noise sources of the amplifier output power, i.e., fluctuations in the pump LD power, fiber splitter temperature and photodetector responsivity. Accordingly, we show that good temperature control of the pump LD, fiber splitter and photodetector is crucial for low-intensity noise operation of the fiber amplifier. With fine temperature control and a carefully designed intensity noise suppressing feedback loop, the output RIN can be down to −72.5 dBc/Hz @ 1 mHz and −90 dBc/Hz @ 0.1 Hz. Based on measurement of the additional linewidth, no spectral broadening could be measured for the fiber amplifier. We believe the guidelines and experimental results in this work will be valuable for ultralow-intensity noise fiber amplifier design, especially for the amplifiers oriented to space-borne gravitational wave detection.

Author Contributions

Conceptualization, Z.W., Y.L. and Q.L.; methodology, Z.W. and Y.L.; software, J.W.; investigation, J.W.; resources, F.L. and L.T.; data curation, J.W.; writing—original draft preparation, Z.W.; writing—review and editing, Y.L. and Q.L.; project administration, Q.L. All authors have read and agreed to the published version of the manuscript.

Funding

This research was funded by the National Key Research and Development Program of China, grant number 2020YFC2200403; National Natural Science Foundation of China, grant number U22A6003, 62175122.

Institutional Review Board Statement

Not applicable.

Informed Consent Statement

Not applicable.

Data Availability Statement

Not applicable.

Conflicts of Interest

The authors declare no conflict of interest.

References

  1. Hall, J. Stabilized Lasers and Precision Measurements. Science 1978, 202, 147–156. [Google Scholar] [CrossRef] [PubMed]
  2. Tünnermann, A.; Schreiber, T.; Limpert, J. Fiber lasers and amplifiers: An ultrafast performance evolution. Appl. Opt. 2010, 49, F71–F78. [Google Scholar] [CrossRef]
  3. Wellmann, F.; Steinke, M.; Wessels, P.; Bode, N.; Meylahn, F.; Willke, B.; Overmeyer, L.; Neumann, J.; Kracht, D. Performance study of a high-power single-frequency fiber amplifier architecture for gravitational wave detectors. Appl. Opt. 2020, 59, 7945–7950. [Google Scholar] [CrossRef] [PubMed]
  4. Willke, B. Stabilized lasers for advanced gravitational wave detectors. Laser Photon. Rev. 2010, 4, 780–794. [Google Scholar] [CrossRef]
  5. Numata, K.; Yu, A.; Jiao, H.; Merritt, S.; Micalizzi, F.; Fahey, M.; Camp, J.; Krainak, M. Progress and plans for a U.S. laser system for the LISA mission. In Proceedings of the International Conference on Space Optics—ICSO 2018, Chania, Greece, 9–12 October 2018. [Google Scholar]
  6. Guiraud, G.; Traynor, N.; Santarelli, G. High-power and low-intensity noise laser at 1064 nm. Opt. Lett. 2016, 41, 4040–4043. [Google Scholar] [CrossRef] [PubMed]
  7. Xue, M.; Gao, C.; Niu, L.; Zhu, S.; Sun, C. Influence of amplified spontaneous emission on laser linewidth in a fiber amplifier. Appl. Opt. 2020, 59, 2610. [Google Scholar] [CrossRef] [PubMed]
  8. Gong, Y.G.; Luo, J.; Wang, B. Concepts and status of Chinese space gravitational wave detection projects. Nat. Astron. 2021, 5, 881–889. [Google Scholar] [CrossRef]
  9. Numata, K.; Yu, W.; Jiao, H.; Merritt, A.; Micalizzi, F.; Fahey, E.; Camp, B.; Krainak, A. Laser system development for the LISA (Laser Interferometer Space Antenna) mission. In Solid State Lasers XXVIII: Technology and Devices; SPIE: Bellingham, WA, USA, 2019. [Google Scholar]
  10. Danzmann, K.; the LISA Study Team. LISA—An ESA cornerstone mission for the detection and observation of gravitational waves. Adv. Space Res. 2003, 32, 1233–1242. [Google Scholar] [CrossRef]
  11. Luo, J.; Chen, L.S.; Duan, H.Z.; Gong, Y.G.; Hu, S.; Ji, J.; Liu, Q.; Mei, J.; Milyukov, V.; Sazhin, M. Tianqin: A space-borne gravitational wave detector. Class. Quantum Grav. 2016, 33, 035010. [Google Scholar] [CrossRef]
  12. Luo, Z.; Wang, Y.; Wu, Y.; Hu, W.; Jin, G. The Taiji program: A concise overview. Prog. Theor. Exp. Phys. 2021, 2021, 05A108. [Google Scholar] [CrossRef]
  13. Danzmann, K.; Rüdiger, A. LISA technology—Concepts, status, prospects. Class. Quantum Grav. 2003, 20, S1–S9. [Google Scholar] [CrossRef]
  14. Peterseim, M.; Brozek, O.S.; Danzmann, K.; Freitag, I.; Rottengatter, P.; Tünnermann, A.; Welling, H. Laser development and laser stabilization for the space-borne gravitational wave detector LISA. AIP Conf. Proc. 1998, 456, 148–155. [Google Scholar]
  15. Numata, K.; Chen, J.R.; Camp, J. Fiber laser development for LISA. J. Phys. Conf. Ser. 2010, 228, 012043. [Google Scholar] [CrossRef]
  16. Tröbs, M.; Weßels, P.; Fallnich, C. Power- and frequency-noise characteristics of an Yb-doped fiber amplifier and actuators for stabilization. Opt. Express. 2005, 13, 2224–2235. [Google Scholar] [CrossRef]
  17. Camp, J.J.; Numata, K.; Krainak, M. Progress and Plans for a US Laser System for LISA. J. Phys. Conf. Ser. 2017, 840, 012013. [Google Scholar] [CrossRef]
  18. Dahl, K.; Cebeci, P.; Fitzau, O.; Giesberts, M.; Greve, C.; Krutzik, M.; Peters, A.; Pyka, S.; Sanjuan, J.; Schiemangk, M.; et al. A New Laser Technology for LISA. Proc. SPIE 2018, 11180, 111800C. [Google Scholar]
  19. Luo, J.; Bai, Y.; Cai, L.; Cao, B.; Chen, W.-M.; Chen, Y.; Cheng, D.-C.; Ding, Y.-W.; Duan, H.-Z.; Gou, X.; et al. The first-round result from the TianQin-1 satellite. Class. Quantum Grav. 2020, 37, 185013. [Google Scholar] [CrossRef]
  20. Sun, G.; Chen, D.; Xin, G.; Cai, H.; Chen, W. High stability laser source for Taiji-1 satellite. Int. J. Mod. Phys. A 2021, 36, 2140006. [Google Scholar] [CrossRef]
  21. Buchler, B.; Huntington, E.; Harb, C.; Ralph, T. Feedback control of laser intensity noise. Phys. Rev. A. 1998, 57, 1286–1294. [Google Scholar] [CrossRef]
  22. Cowle, G.; Morkel, P.; Laming, R.; Payne, D. Spectral broadening due to fibre amplifier phase noise. Electron. Lett. 1990, 26, 424–425. [Google Scholar] [CrossRef]
  23. Okamura, H.; Iwatsuki, K. Spectral linewidth broadening in Er-doped-fibre amplifiers measured with less than 1.4 kHz linewidth light source. Electron. Lett. 1990, 26, 1965–1967. [Google Scholar] [CrossRef]
  24. Möller, L. Novel aspects of spectral broadening due to fiber amplifier phase noise. IEEE J. Quantum Electron. 1998, 34, 1554–1558. [Google Scholar] [CrossRef]
  25. Chen, M.; Zhou, M.; Wang, F.; Chen, W. Ultra-narrow linewidth measurement based on Voigt profile fitting. Opt. Express. 2015, 23, 6803–6808. [Google Scholar] [CrossRef] [PubMed]
Figure 1. Schematic for feedback-loop-based intensity noise suppression in the fiber amplifier.
Applsci 13 06338 g001
Figure 2. Schematic for the low noise fiber amplifier. ISO: isolator, YDF: Yb-doped fiber, CPS: cladding power stripper, MM Pump LD: multi-mode pump laser diode. Red line and black line represent laser signal path and electrical signal path respectively.
Applsci 13 06338 g002
Figure 3. Output power and slope efficiency measured versus pump current of the pump diode.
Applsci 13 06338 g003
Figure 4. Optical spectrum of the fiber amplifier at an output power of 2.5 W. Inset: Optical spectra of the seed and amplifier.
Applsci 13 06338 g004
Figure 5. Experimental setup for the additional linewidth measurement.
Applsci 13 06338 g005
Figure 6. Additional linewidth measurement results of the amplified laser.
Applsci 13 06338 g006
Figure 7. RIN of the amplifier output.
Applsci 13 06338 g007
Figure 8. Measurements of temperature fluctuations and voltage fluctuations.
Applsci 13 06338 g008
Figure 9. Measurements of the voltage fluctuations with temperature stabilization of the fiber splitters.
Applsci 13 06338 g009
Figure 10. Measurements of the RIN with temperature stabilization of the fiber splitters.
Applsci 13 06338 g010
Figure 11. (a) Photograph of the packaged photodetector; (b) Screen of the detailed parameters in SLICE-QTC.
Applsci 13 06338 g011
Figure 12. (a) Voltage fluctuations of the fiber splitter, pump LD, in-loop and out-of-loop photodetectors; (b) RIN results measured by G12180-130A and DET01CFC.
Applsci 13 06338 g012
Table 1. Typical specifications of two different InGaAs PIN photodetectors.
ParameterDET01CFC/MG12180-130A
Wavelength Range/nm800~1700900~1670
Response/(A/W) @ 1064 nm0.650.6
Bandwidth/MHz12002.5
NEP (λp)/(W/Hz1/2)4.50 × 10−154.90 × 10⁻¹⁵
Dark Current/nA0.2350.15
Bias Voltage/V121.2
CoolingOne-stage TE-cooled
Disclaimer/Publisher’s Note: The statements, opinions and data contained in all publications are solely those of the individual author(s) and contributor(s) and not of MDPI and/or the editor(s). MDPI and/or the editor(s) disclaim responsibility for any injury to people or property resulting from any ideas, methods, instructions or products referred to in the content.

