Article

Distinguishing Malignant Melanoma and Benign Nevus of Human Skin by Retardance Using Mueller Matrix Imaging Polarimeter

1
Key Laboratory of Photoelectronic Imaging Technology and System of Ministry of Education of China, School of Optics and Photonics, Beijing Institute of Technology, 5 South Zhongguancun Street, Beijing 100081, China
2
Institute of Engineering Medicine, Beijing Institute of Technology, 5 South Zhongguancun Street, Beijing 100081, China
*
Author to whom correspondence should be addressed.
Appl. Sci. 2023, 13(11), 6514; https://doi.org/10.3390/app13116514
Submission received: 28 April 2023 / Revised: 14 May 2023 / Accepted: 24 May 2023 / Published: 26 May 2023
(This article belongs to the Section Applied Biosciences and Bioengineering)

Abstract

:
Malignant melanoma is considered the most serious type of skin cancer. In clinical practice, the conventional technique based on subjective visual examination has a high rate of misdiagnosis for malignant melanoma and benign nevus. Polarization imaging techniques have great potential in clinical diagnosis due to the advantages of improving sensitivity to functional structures, such as microfiber. In this paper, a set of human skin tissue sections, including 853 normal, 851 benign nevus, and 874 malignant melanoma, were analyzed and differentiated using a homemade high-fidelity Mueller matrix imaging polarimeter. The quantitative result using support vector machine algorithms confirmed that, while scalar retardance yields lower accuracy rates, vectorial retardance results in greater accuracy for both the training and testing sets. In particular, the cross-validation accuracy for the training set increased from 88.33% to 98.60%, and the prediction accuracy for the testing set increased from 87.92% to 96.19%. This tackles the limitation of the examination based on clinical experience and suggests that vectorial retardance can provide more accurate diagnostic evidence than scalar retardance. Unfortunately, it is inconvenient and time-consuming to read and analyze each component of the vectorial retardance simultaneously in the qualitative assessment. To address this clinical challenge, a color-encoded vectorial retardance imaging method was implemented. This method can provide superior tissue-specific contrast and more fiber details than scalar retardance. The anisotropic microfiber variation among different skin lesions, including the orientation and distribution, can be clearly highlighted. We believe that this work will not only enable early and rapid diagnosis of skin cancer but also provide a good observation and analysis of the state of cancer progression.

1. Introduction

Skin cancer is the most common group of cancers [1]. Its incidence, treatment costs, and associated health burden are steadily increasing [2,3]. The most prevalent forms of skin cancer include basal cell carcinoma (BCC), squamous cell carcinoma (SCC), and malignant melanoma (MM) [4]. Although MM accounts for approximately one in five skin cancers, it remains the most serious type of skin cancer because of its lethality [1,5]. It has been estimated that 325,000 new cases of MM were diagnosed, and 57,000 people died from the disease worldwide in 2020, as well as more than 50% of cases of MM are predicted to occur in 2040 than in 2020 [1]. If MM is diagnosed and cured early, the five-year survival rate can be as high as 99% but drops to 65% or even 25% if the disease progresses to the lymph nodes or distant organs [6]. Therefore, it is crucial to realize early identification and stage assessment of MM.
Clinical diagnostic techniques for MM include dermoscopy, reflective confocal microscopy (RCM), and excisional biopsy [6,7,8]. Dermoscopy has been proven to improve the diagnostic accuracy of MM [9,10]. RCM, also known as confocal laser scanning microscopy, has demonstrated higher sensitivity and specificity than dermoscopy for the diagnosis of pigmented melanoma [11,12]. However, the performance remains subject to lesion characteristics. The current gold standard for the diagnosis of MM is excisional biopsy and histopathological examination [7,13]. However, such an approach relies heavily on subjective visual examination by the physician [5,14]. The general visual indicators of MM include size, elevation, color, irregular borders, surface roughness, cellular morphology, etc. [15,16]. Unfortunately, these features resemble benign skin lesions such as benign nevus (BE) [17,18], making the diagnosis of melanoma difficult. It has been reported that the rate of misdiagnosis can be as high as 15%, influenced by subjective factors [19]. Furthermore, the histopathological examination is technically demanding due to the dependence on staining [20]. The staining process is based on a chemical reaction between the dye and the biological components, which needs strict restriction of the dye and operation, resulting in it being time-consuming [20,21,22]. Thus, it is necessary to develop an objective and rapid diagnostic technology for detecting MM from BE.
Pathologically, it has been concluded that the collagen fibers in the extracellular matrix are tightly associated with disease progression [23,24,25,26]. Therefore, an accurate characterization of these structures may be of great significance as a promising biomarker for distinguishing MM from BE. As a primary component of connective tissue, collagen fibers are organized linearly or helically by collagen supramolecular structures [26,27]. The regular molecular structure or ordered units induce strong birefringence properties in collagen fibers [28,29,30,31,32]. This property can be measured by retardance-related parameters, such as scalar retardance [29,30,31,32,33,34]. Changes in scalar retardance have been demonstrated to accompany alterations in collagen spatial structures in various severe pathologies, including vaginal prolapse [33], skin basal cell carcinoma [35], cervical neoplasia [36], glaucoma [37], etc.
Numerous polarization-sensitive techniques have attracted much attention, due to their unique ability to measure polarized properties of light [38], especially the retardance induced by birefringent samples [29,36,37,38,39,40,41,42,43,44]. The most common methods for describing the retardance of polarized light are the intensity-based Mueller algebra and the field-based Jones algebra [23,24,25,26,27,28,29,41,42,43,45,46,47]. The intensity-based Mueller algebra is promising as the 4 × 4 Mueller matrix completely characterizes the polarimetric properties of samples, including linear/circular diattenuation, linear/circular retardance, linear/circular polarizance, linear/circular depolarization, and so on [35,45,48,49,50]. Direct physical meanings of the 16 Mueller matrix elements individually are usually ambiguous, thus a decomposition of the Mueller matrix is required [35,51,52]. The main decomposition method is the Mueller matrix polar decomposition (MMPD) proposed by Lu and Chipman [53,54,55,56]. The Mueller matrix imaging polarimeter (MMIP) technology with the MMPD method has been widely used for characterizing tissular-level (nerve bundle [37], vessel [57], muscle [58], etc.) and cellular-level (nucleus [32], chromosome [59], etc.) microstructures in different tissues. During the past decade, several attempts have been made for differentiating MM from BE by detecting retardance using an MMIP [31,60]. However, the experiments are carried out on small animals. Although the similarity between animal tumor models and human tumors is high, the gap between the two is still undeniable. Therefore, the direct use of human skin models would help to better understand the development of human skin cancer. Furthermore, most MMIPs still struggle to perform high-fidelity Mueller matrix imaging at higher resolutions due to the lack of a proper calibration strategy [58,61,62,63]. Recently, our group has developed a high-fidelity MMIP in combination with a rational calibration method, and the excellent diagnosis ability has been approved in the tendon [46], lung [64], and skin [65] tissue lesions. The reliability of this MMIP has also been validated, demonstrating its remarkable clinical potential [65]. Thus, the homemade high-fidelity MMIP can provide accurate information on anisotropic structures by detecting the retardance of polarized light.
In this paper, we prepare a set of human skin tissue sections, including normal, BE, and MM. Considering the experimental convenience and time costs, the sections are dewaxed, unstained, and unsealed. By employing the homemade high-fidelity MMIP, we detect the Mueller matrix from different unstained skin sections. Combined with the MMPD method, the retardance-related parameters are compared and analyzed between different diseases using the support vector machine (SVM) algorithms. In addition, we implement a true-color vectorial retardance imaging technique to differentiate MM from BE. The true-color imaging method based on encoding stokes parameters has been used to visualize birefringent tissues (e.g., muscles, nerve bundle, and vascular walls) [47]. By encoding multiple polarization-derived parameters (e.g., retardance, depolarization, diattenuation), this method has also been used to extract sample components (e.g., collagen and elastic fibers) [34,66]. In this paper, we implemented the true-color imaging technique based on one parameter, namely the vectorial retardance to enhance the contrast of birefringent microstructures for classifying the three types of skin tissues. The true-color vectorial retardance, encoding the three retardance components into color space, contains not only the magnitude but also the fast axis information of retardance. Thus, the technique allows simultaneous observation of the distribution and orientation information of the anisotropic microfibrillar structures, such as collagen fibers. This imaging technology will assist doctors as well as dermatologists in making a quick and readable assessment of skin pathologies.

2. Materials and Methods

2.1. Collection and Preparation of Human Skin Specimens

A total of 64 patients were studied, including 21 patients with normal skin, 20 patients with BE, and 23 patients with MM (mean age: 68 ± 12 years). For each patient, two consecutive slices were cut from the identical tissue by a microtome (RM2235, Leica, Germany), each with a thickness of 4 μm, allowing a high degree of similarity in the structural distribution between the two slices. One of the slices is dewaxed, unstained, unsealed, and stored under a vacuum for MMIP detection. The other is stained with hematoxylin–eosin (H–E) and annotated by pathologists for histology ground truth. We imaged each physician-labeled area at evenly spaced intervals in each unstained section to obtain images with identical lesions. For multiple images from the same marked area despite partially overlapping, correlation analyses were conducted to ensure data independence [67,68]. For each unstained slice, 35 to 45 independent sites with the same lesion were detected by our homemade MMIP. The number of independent sites in one slice is determined mainly by the size of the annotated areas by the physician. The final dataset is summarized in Table 1.
A total of 2551 individual sites obtained from 64 patients were finally included in this study. Each site was obtained on the superficial dermis with the size of 2000 × 2000 pixels (0.46 × 0.46 mm2) and considered an independent case in this study. The experimental procedures were approved by the Ethics Committee of the Seventh Center of the General Hospital of the Chinese People’s Liberation Army (Ethics Approval No. 2021-52).

2.2. Experimental Setup

A homemade transmission MMIP system based on the dual-rotating-retarder (DRR) method is used. The experimental setup and schematic diagram are shown in Figure 1. The light from a broadband LED (MWWHLP1, Thorlabs, Newton, NJ, USA, 400–700 nm) is modulated by a polarization state generator (PSG). The PSG consists of a polarizer (P1, LPVISE100-A, Thorlabs, USA, 400–700 nm) and a rotatable achromatic quarter-wave plate (R1, AQWP10M-580, Thorlabs, USA, 350–850 nm). The fast axis azimuth of R1 is successively rotated to 15°, −15°, 52°, −52° directions by an electric turntable (KPRM1E/M, Thorlabs, USA) to generate four independent polarized lights. The modulated polarized light is then focused on the sample by the condenser (C, Nikon MBL11300), and the outgoing light carried the sample polarization information. After interacting with the sample, the forward scattered light is collected by an apochromatic objective lens (MRL00202, Nikon, Tokyo, Japan, 20×/0.40). Then each polarization state of the forward scattered light is analyzed by a polarization state analyzer (PSA), which is composed of a rotatable achromatic quarter-wave plate (R2, AQWP10M-580, Thorlabs, USA, 350–850 nm) and a polarizer (P2, LPVISE100-A, Thorlabs, USA, 400–700 nm). The fast axis azimuth of R2 is successively rotated to 15°, −15°, 52°, and −52° using an electric turntable (KPRM1E/M, Thorlabs, USA) to achieve four linearly independent analyses. Hence, a set of sixteen intensity images can be collected in one experiment, and the corresponding Mueller matrix can be derived by the linear algebra operations.
To improve the accuracy of the measurement, a calibration is performed using the eigenvalue calibration method (ECM) with standard samples, including air, a linear polarizer, and a quarter-wave plate [36]. The mean values of each Mueller matrix element of the standard samples after calibration are given in Equations (1)–(4). M a i r , M P 0 , M P 90 , and M r 30 represent the normalized Mueller matrix of air, the linear polarizer oriented at 0° and 90°, and the quarter-wave plate oriented at 30°, respectively. The measured Mueller matrices are constructed with an error below 1%. The detailed calibration process can be found in our previous publications [46,63,64,65].
  M a i r = 1.0000 0.0030 0.0012 0.0003 0.0008 0.9944 0.0106 0.0025 0.0001 0.0003 1.0060 0.0055 0.0008 0.0111 0.0056 1.0037
M P 0 = 1.0000 0.9982 0.0023 0.0053 0.9928 0.9946 0.0033 0.0034 0.0001 0.0001 0.0048 0.0003 0.0021 0.0028 0.0010 0.0010
M P 90 = 1.0000 0.9907 0.0028 0.0004 0.9977 0.9909 0.0027 0.0000 0.0019 0.0016 0.0003 0.0006 0.0040 0.0038 0.0006 0.0003
M r 30 = 1.0000 0.0026 0.0023 0.0015 0.0000 0.2519 0.3936 0.7747 0.0011 0.3988 0.7503 0.4936 0.0019 0.7724 0.4927 0.0061

2.3. Vectorial Retardance Imaging

To obtain the birefringence of the sample, the measured Mueller matrix is then decomposed by the MMPD method proposed by Lu and Chipman [69], defined as follows:
M = M Δ M R M D
where M Δ , M R , and M D are the depolarization, retardance, and diattenuation matrices, respectively. Then, the vectorial retardance ( R ), which completely characterizes the birefringence properties, is derived from M R [69]:
R = R H R 45 R C = R a 1 a 2 a 3
where R H , R 45 , and R C represent the horizontal, 45 -linear, and circular retardance components, respectively. The normalized Stokes vector ( 1 , a 1 , a 2 , a 3 ) T indicates the fast axis of R . The magnitude of R (i.e., R ), also called scalar retardance, can be deduced from the three components by the square root of the sum of squares method [69]. In addition, the orientation of linear retardance (θ) can be obtained as follows:
θ = 1 2 tan 1 ( a 2 a 1 )
Recent reports have successfully proven birefringence is a useful marker for bio-diagnostics. As the basic functional indicator of birefringence, scalar retardance has been widely utilized benefiting from the ability to visualize the density of ultrastructural organization (e.g., the density of aligned collagen fibers) [46]. It has been used for differentiating MM from BE using an MMIP [31,60]. Yet, due to the inherent limitations resulting from the square root of the sum of squares method, the scalar retardance lacks the fast axis information. The orientation of the fast axis is used to show the orientation information. Thus, they cannot fully describe the birefringence characteristics and shows relatively low contrast for internal anisotropic structures [47,69]. Conversely, the vectorial retardance, including the horizontal, 45°-linear, and circular retardance components, contains not only the magnitude but also the fast axis of retardance. It is of gaining increasing interest in pathology research [31,70,71]. Corresponding clinical value using the components has been demonstrated in the diagnosis of diseases of the colon [71], skin [31], cervix [70], etc. Unfortunately, it is inconvenient and time-consuming for clinicians to read and analyze all three components simultaneously in the clinic. As a result, such clinical challenge severely hinders the application of advanced polarization imaging techniques in clinical practice.
To address this clinical challenge, a true-color vectorial retardance imaging technique is utilized by encoding the three components of vectorial retardance into the color space. The key post-processing steps are shown in Figure 2. Specifically, R H , R 45 , and R C are encoded as the primary colors of green, red, and blue, respectively, in the RGB color space. The brightness of the integrated image is then modulated in the RGB color space according to the scalar retardance. Thus, the true-color vectorial retardance image can be reconstructed to completely characterize the birefringence properties of probed samples.
Figure 3 graphically illustrates the color-encoded vectorial retardance imaging technology. Figure 3a,b show all possible states of the vectorial retardance mapped on a color-encoded sphere. The color is determined by the orientation of the fast axis. Figure 3c lists the relationship between several typical vectorial retardance states and the colors, where different colors correspond to different fast axis orientations. Figure 3d,i show several typical cross-sections of the color-encoded sphere. The radius is determined by the scalar retardance that regulates the brightness. Thus, the brightness becomes progressively dimmer as the scalar retardance decreases. It is worth mentioning that colors vary tinier in each of Figure 3g,i than that in each of Figure 3d,f. The tinier variation of colors (i.e., the Stokes vector ( 1 , a 1 , a 2 , a 3 ) T ) is consistent with the subtler orientation change. Each color in Figure 3g,i is determined by one variable component and two definite components of ( 1 , a 1 , a 2 , a 3 ) T , resulting in a slower change in the orientation. On the contrary, each color in Figure 3d,f is determined by two variable components with one definite component, so the orientation changes faster.
In clinical practice, the vectorial retardance states can be distributed anywhere in the color-encoded sphere, due to the inherent complexity of samples. Different colors and brightness correspond to the different vectorial retardance (fast axis and scalar retardance). In the color-encoded sphere, there is visual difficulty in distinguishing tiny color or brightness gradients (e.g., Figure 3g,i), resulting in difficulty in differentiating small variations of fast axis and scalar retardance visually. However, this does not hinder the ability of vectorial retardance in demonstrating the orientation and distribution of birefringent structures simultaneously. We believe that true-color vectorial retardance imaging technology would be the potential in assisting physicians in better pathological diagnosis with the high contrast of anisotropic structures.

3. Results and Discussion

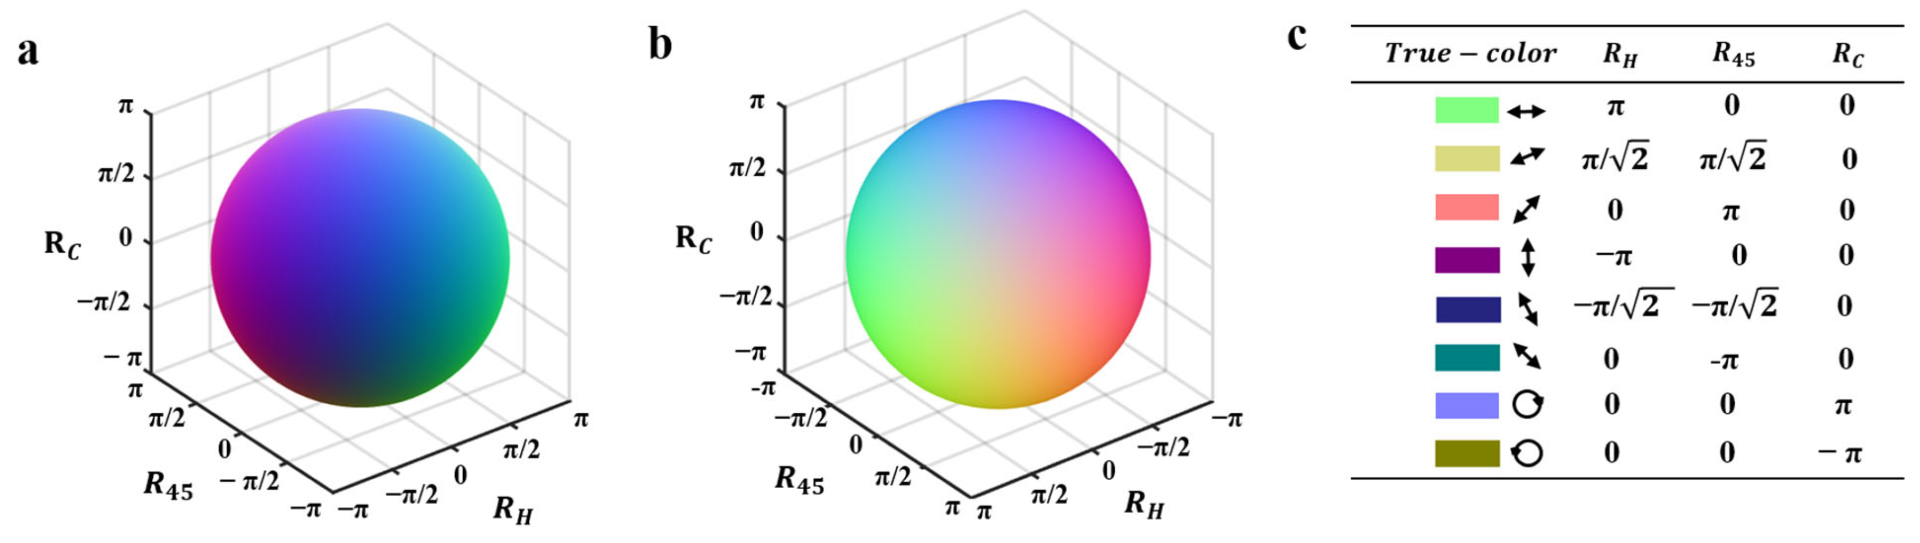
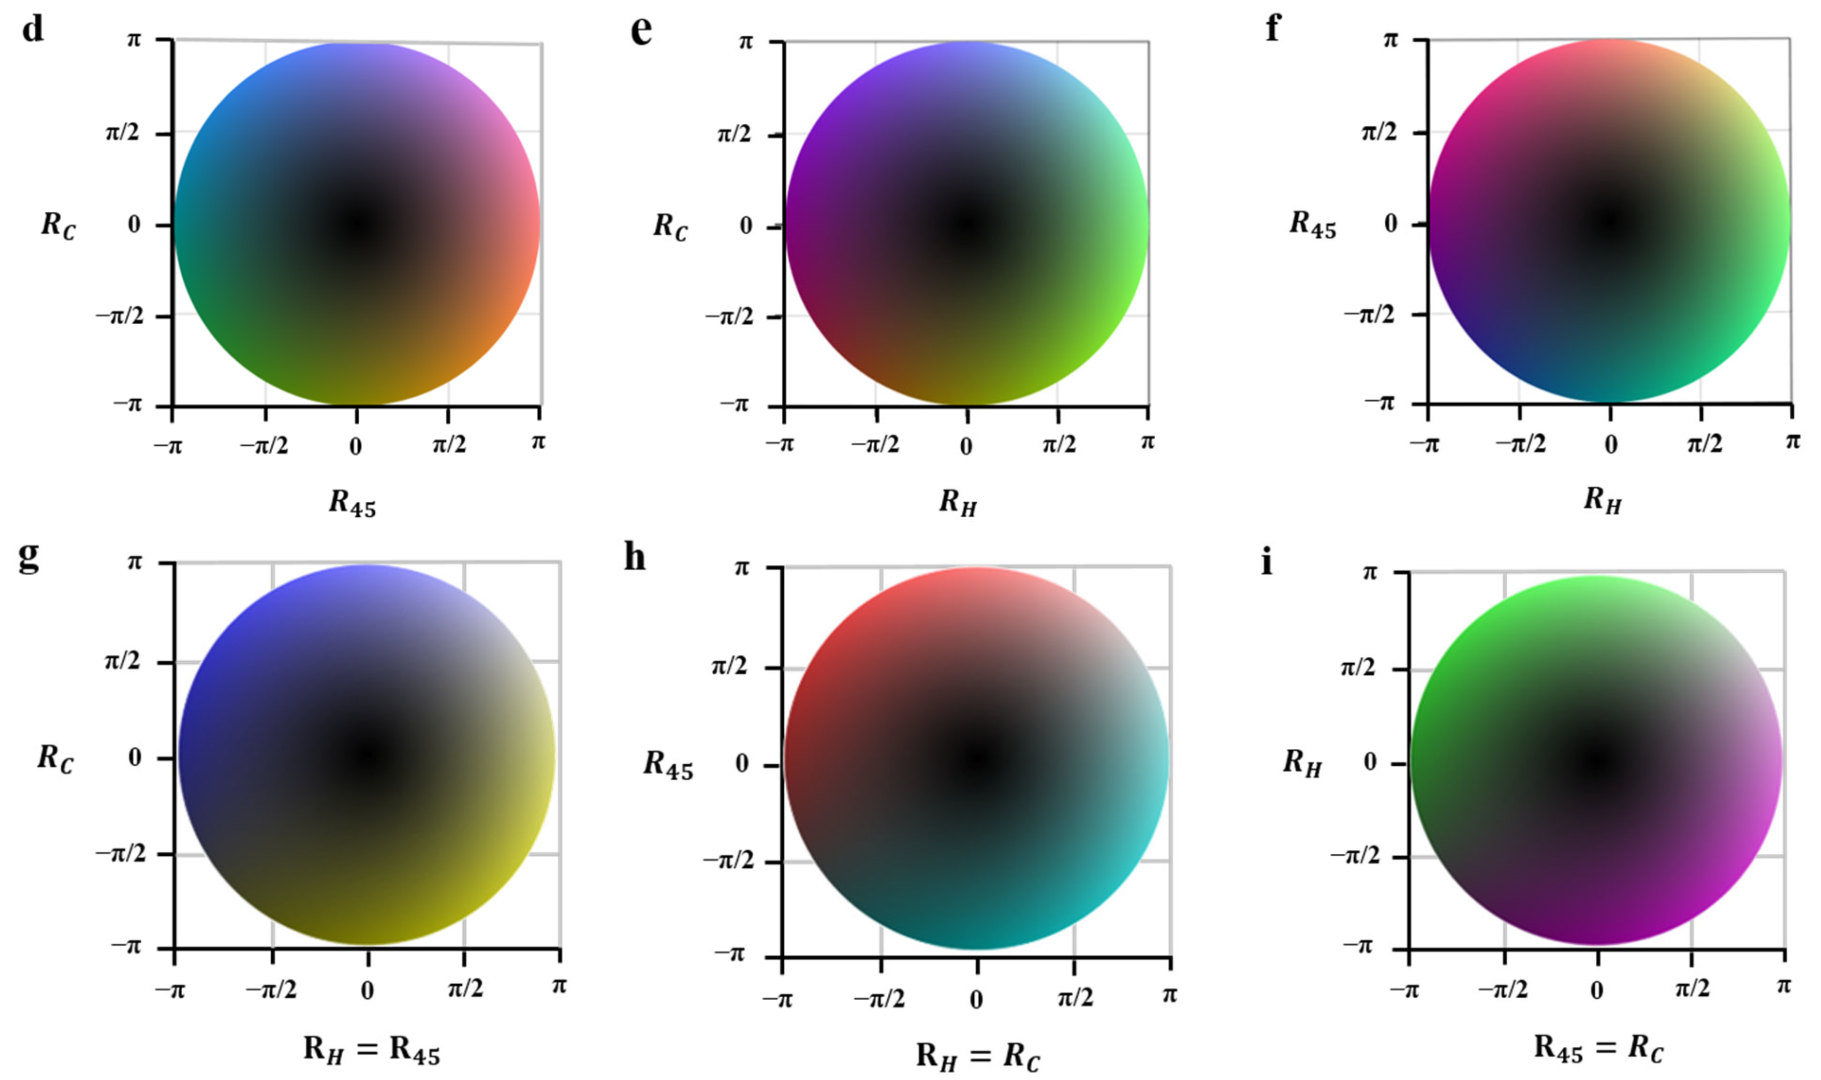
3.1. Test Experiment of True-Color Vectorial Retardance Imaging by a Vortex Retarder

To demonstrate the performance of the true-color vectorial retardance imaging technique, we use the homemade MMIP system to detect a half-wave vortex retarder (m = 2, center wavelengths available from 405 nm to 1550 nm, Thorlabs). Figure 4 shows the imaging results of the half-wave vortex retarder. Figure 4a–c are the horizontal, 45°-linear, and circle retardance, respectively. Theoretically, the horizontally and 45°-linearly arranged anisotropic microstructures may display a great value in horizontal retardance and 45°-linear retardance, respectively [69,70]. The results in Figure 4a,b are consistent with the previous conclusion. Figure 4c shows the circle retardance with the mean value of 0.0050 ± 0.2866 rad, resulting from the linear birefringence property of the vortex retarder. Each retardance component can highlight the details of anisotropic structures with different orientations, which together can provide a complete description of the birefringence property. However, interpreting the three components simultaneously is complex and challenging. Figure 4d demonstrates the scalar retardance of the half-wave vortex retarder with a mean value of 3.0390 ± 0.0216 rad. It is proved that our MMIP has high measurement accuracy for scalar retardance. Although the scalar retardance reflects the distribution of the anisotropic structures, Figure 4d shows the lack of fast axis orientation information of the vortex retarder. This is due to the superposition algorithm (the square root of the sum of squares) of the three components. Figure 4e shows the orientation of linear retardance for the half-wave vortex retarder. Figure 4f shows the true-color vectorial retardance image of the half-wave vortex retarder using the color-encoded algorithm. The brightness in Figure 4f is uniform, representing the scalar retardance of the vortex retarder is close to the same (~π). This is consistent with Figure 4d. On the other hand, each color of the vectorial retardance image corresponds to an independent fast-axis orientation. In contrast to Figure 4e, the vectorial retardance imaging method can enhance the contrast.
Different from the scalar retardance and the orientation of linear retardance, true-color vectorial retardance imaging can visualize the distribution and orientation of birefringent structures in one resultant image. We found that the orientation of linear retardance along +45° and −45° can be distinguished by different colors in Figure 4f, while they are not distinguishable in Figure 4e. The true-color vectorial retardance images can directly reflect the orientation with enhanced contrast. The measurement results are consistent with the theory shown in Figure 3. Therefore, the vectorial retardance imaging technology might be a vital tool in assessing the birefringence properties of anisotropic microstructures.

3.2. Discrimination of Different Human Skin Tissues Using Vectorial Retardance

3.2.1. Quantitative Classification

A dataset of 853 normal cases, 851 BE cases, and 847 MM cases is detected. The specific information on training and testing sets is listed in Table 2. To quantitatively differentiate normal skin, BE, and MM, the SVM algorithm is applied. The basic idea of the SVM algorithm is to create a separated hyperplane that can correctly partition the training dataset with maximum geometric separation [71,72]. It is mainly used in solving small samples, nonlinear, and high-dimensional classification problems [73,74], which fits well with the sample characteristics of this paper. SVM has been commonly used and performs well in pattern recognition [73,74,75,76,77,78,79]. To demonstrate the performance of retardance-related parameters in discriminating skin tissues with different lesions, eight SVM classifiers with three classifications were established and evaluated according to different retardance-related parameters in conjunction with the one-against-one (OAO) method. The relationships between the eight SVM classifiers are shown in Table 3.
For constructing the SVM classifiers, five characteristics are extracted from the measured retardance-related parameters, including mean ( M ), standard deviation ( S t d ), skewness ( S k e ), kurtosis ( K u r ), and entropy ( E n ) shown as Equations (8)–(12) [80,81]. M and S t d describe the mean value and standard deviation of the retardance-related parameters, respectively. S k e measures the distribution of the values around the mean and gives its shape. K u r calculates from the histogram and extends up to the shape of the distribution equal to the normal distribution. E n describes the randomness of the structures displayed in the image.
M = 1 m × n i = 1 m j = 1 n R i , j
S t d = 1 m × n i = 1 m j = 1 n R i , j - M 2
S k e = 1 S t d 3 1 m × n i = 1 m j = 1 n R i , j - M 3
K u r = 1 S t d 4 1 m × n i = 1 m j = 1 n R i , j - M 4
E n = i = 1 m j = 1 n q i , j log 2 q i , j
where R i , j is the value at the i -th and j -th pixel in the horizontal and vertical directions, respectively, and q i , j represents the probability of R i , j . m and n are the total number of pixels in the horizontal and vertical directions, respectively.
Each of the eight SVM classifiers is trained by five tissue microstructural features (including M , S t d , S k e , K u r , and E n ) with the RBF kernel and five-fold cross-validation approach for accurate prediction. Cross-validation accuracy and prediction accuracy are used to assess the performance of classifiers. For a fair comparison, the feature selection is not performed for each classifier, and all features of each classifier are normalized to avoid systematic bias [71,72]. The classification tasks are carried out with the reference to practical guidance [71,72].
It is worth noting from Table 3 that the three components show comparable accuracy, albeit with slightly different [82,83]. This is caused by factors such as the datasets, the feature selection of the datasets, model selection, kernel parameters, etc. [72]. Additionally, it can be found that the accuracy increases progressively as more retardance components are combined. In particular, classifier VIII based on three components (i.e., the vectorial retardance) shows the most attractive prediction accuracy of 96.19% in distinguishing MM, BE, and normal skin. In the future, we will prepare more samples, choose more valuable feature quantities combined with feature selection, establish different SVM models, or compare different machine learning methods to investigate the value of different retardance components.
Currently, many statistical methods have been developed for diagnosing and classifying several diseases, including SVM [62,73,75], k-nearest neighbors (KNNs) [76], artificial neural networks (ANNs) [84], random forest (RF) [76,85], naive Bayes classifier models [78,86], convolutional neural networks (CNNs) [87], linear discriminant analysis (LDA) [88], etc. In this paper, the SVM has provided an appealing result, which is consistent with most reported on other disease classifications [73,74,75,76]. More importantly, the results validate that vectorial retardance can visualize more useful details than scalar retardance.
Although the accuracy provided by the SVM method is highly acceptable (~96.19%), we will compare the SVM method with other machine learning (ML) methods for the classification of the three types of skin tissues to further improve the accuracy in the future.

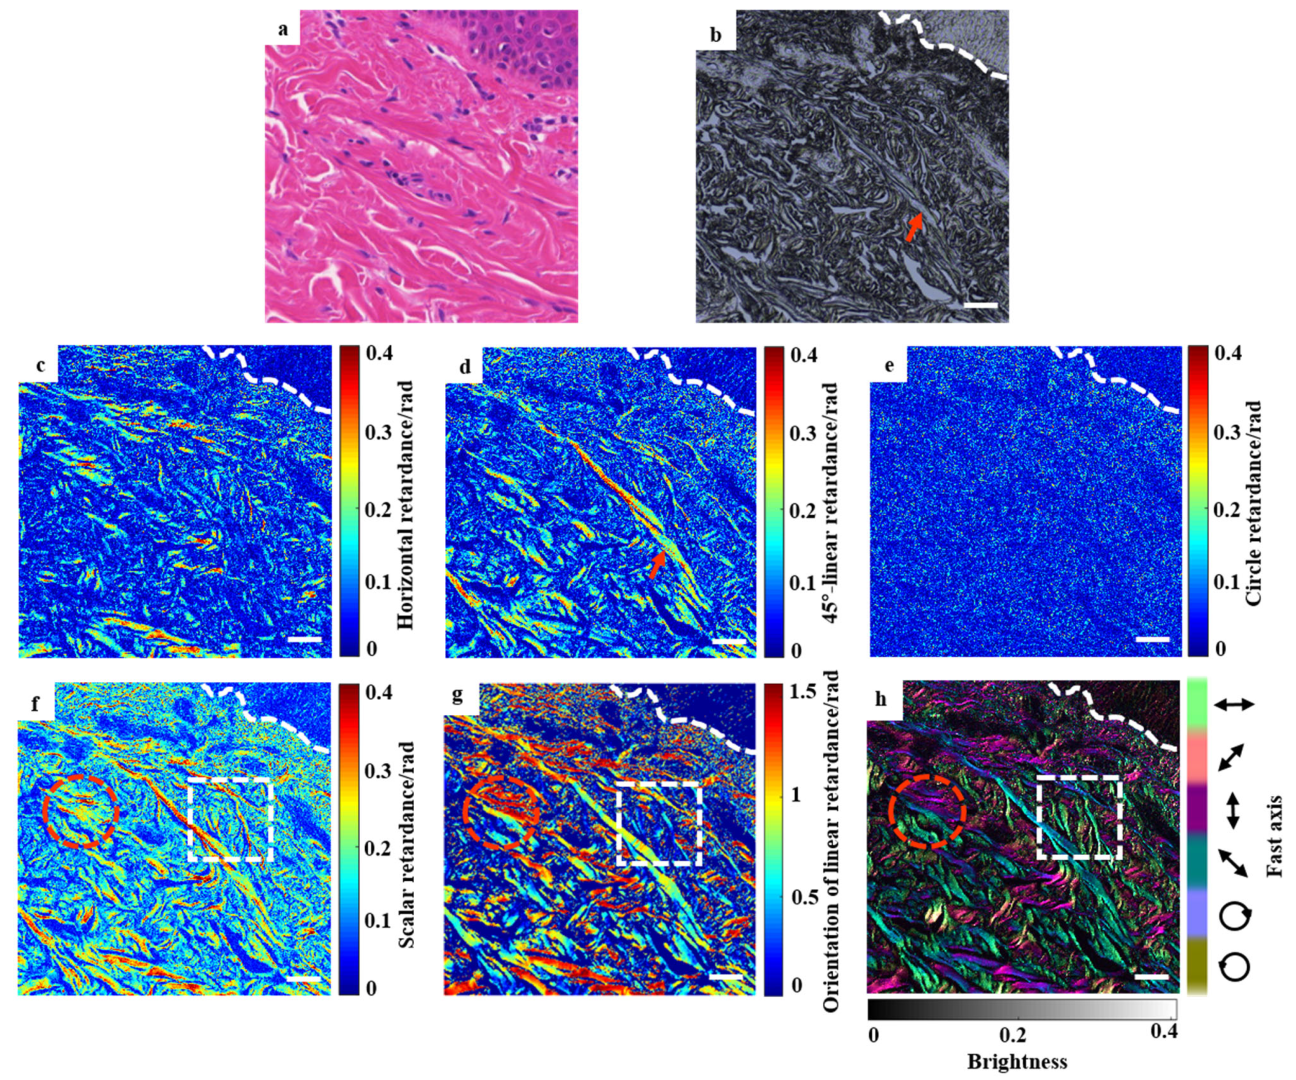
3.2.2. Qualitative Assessment by True-Color Vectorial Retardance Imaging

To demonstrate the feasibility of the vectorial retardance imaging method, we use the above homemade high-fidelity MMIP system to detect numerous unstained skin sections, including normal, BE, and MM tissues. Figure 5 shows different images of the same normal skin tissue. Figure 5a is the H&E stained section microscopic intensity image, which can be used to roughly identify different structures with different colors. Typically, the stained samples are visualized to analyze the microstructural variations in the clinic. However, the staining depends on the mechanism of the chemical reaction between the dye and the biological components [20], which leads to the alteration of molecular structures [21,22] and may result in the optical property changes of tissues (e.g., the birefringence of collagen fibers) [34]. Thus, imaging unstained samples is more appropriate. It has been concluded that the distribution and orientation of fibers can serve as important evidence for early diagnosis and disease management [34]. Unfortunately, the traditional microscopic intensity images of unstained samples are less sensitive to anisotropic fibers. As shown in Figure 5b, the intensity image of the unstained section provides a rough shape of the microstructures but fails to clearly show the distribution and orientation of fibers, such as the region pointed by the red arrow.
The Mueller matrix microscopic imaging, whose results are shown in Figure 5c–h, is a label-free and quantitative method. The horizontal retardance (Figure 5c) and 45°-linear retardance (Figure 5d) show abundant and well-ordered collagen fibers distributed linearly. The region pointed out by the red arrow in Figure 5d highlights the clear distribution of the fibers along 45°. In Figure 5e, the values are much smaller, which is due to rare helically distributed fibers. As mentioned, each of the three retardance components can highlight the distribution of fibers with different orientations, which together can provide a complete description of the retardance of anisotropic tissues. However, interpreting the three components simultaneously is complex and challenging for pathological analysis. In Figure 5f, larger scalar retardance values are mapped in the region distributing abundant fibers with strong birefringences, such as regions pointed by the circle with red lines and the rectangle with white lines. However, due to the square root of the sum of squares algorithm, many fiber details are filtered out [69] although the distribution and density of most fibers are highlighted in Figure 5f. In Figure 5g, although the orientation of linear retardance highlights fibers with different linear fast axes, the contrast is influenced by the absence of fiber distribution. Conversely, the vectorial retardance (Figure 5h) allows the observation of birefringent fibers with enhanced contrast and more fiber details by directly visualizing the distribution and orientation simultaneously. Additionally, it is worth mentioning that the upper right corner in Figure 5h shows darker, which indicates weaker birefringence and less fiber content. This is because the area is mainly composed of squamous cells [23].
To further analyze the vectorial retardance images, the areas marked by the rectangle with white lines in Figure 5 are enlarged as shown in Figure 6. Each of the retardance components (Figure 6a, Figure 6b, or Figure 6c) can demonstrate the distribution of fibers with a specific orientation (for example, the horizontal retardance for fibers with a horizontal fast axis). The scalar retardance (Figure 6d) shows the distribution of all fibers but lacks orientation information. Figure 6e highlights the orientation of the mainly linear fibers by pseudo-colors but is absent in the fiber distribution. Although scalar retardance (Figure 6d) and orientation of linear retardance (Figure 6e) highlight fibers with birefringence properties, the contrast is influenced by inherent limitations [69].
Compared with Figure 6d,e, the vectorial retardance (Figure 6f) can enhance fiber contrast and clarity by visualizing more fiber details using true-color vectorial retardance imaging technology. In this approach as shown in Figure 6f, different brightness is modulated by the scalar retardance (Figure 6d), and the colors correspond to various orientations of fibers, which is almost consistent with the Figure 6e due to the small magnitude of R C as shown in Figure 6c. By comparing the area marked by red arrows, Figure 6f shows the striped fibrils different from the surrounding colors, indicating they have different orientations, which is close to that indicated in Figure 6e. In addition, we can hardly visualize a brightness gradient with the same color in the striped fibrils, representing that the fibrils content is similar, which is almost consistent with Figure 6d and cannot be shown in Figure 6e. In Figure 6f, the region pointed out by the red arrow can observe not only the neatly arranged bundled fibers but also the microfibrous structures. It highlights clear and specific orientations of the fibrils, which are the main compositions of the bundled fibers [34]. Typically, the collagen fibers are 1–8 u m in diameter, while the fibrils are about 100 n m [61]. This demonstrates that the true-color vectorial retardance can highlight more fiber microstructures than the traditional retardance-related parameters. It is resulting from the brightness and color being determined by scalar retardance and orientation of the fast axis, making it possible to present fiber distribution and orientation information simultaneously in one image.
To analyze the performance in identifying different human skin lesions by true-color vectorial retardance, Figure 7 shows the imaging results of BE and MM. Although the three retardance components (Figure 7(a1–c1) and Figure 7(a2–c2)) could demonstrate the specific details of fibers along different orientations, the information is complicated. Conventional microscopic intensity images of stained sections (Figure 7(d1,d2)) indicate varying degrees of degradation of fibers due to the presence of nevus cells and tumor cell nests in BE and MM tissues. However, fiber details are difficult to observe. The scalar retardance images ((Figure 7(e1,e2)) visualize the rough distribution of fibers, such as the regions pointed by the red arrows. Compared with the scalar retardance images, the true-color vectorial retardance images (Figure 7(f1,f2)) can highlight the different orientations of fibers in different colors, as pointed out by the red arrows.
Figure 8 shows the changes in the microfibers for different skin lesion tissues, namely normal skin (Figure 8(a1,a2)), BE (Figure 8(b1,b2)), and MM (Figure 8(c1,c2)). The first row is the scalar retardance images, while the second row shows the vectorial retardance images. It has been reported that the scalar retardance values become smaller as normal tissue develops into BE and even MM [31,61]. This is consistent with the results shown in Figure 8(a1–c1). Correspondingly, the brightness gradually becomes darker in Figure 8(a2–c2). This is due to a loss of the inherent heterogeneity in the tissue morphology with the extent of the lesion [39]. This indicates that the highly organized fibrous structure of the normal tissue is most likely obliterated by various pathologies such as BE and MM [61]. Such changes can be directly observed by the orientation of fibers in Figure 8(a2–c2). As in the area indicated by red arrows in Figure 8(b2), the BE shows a relatively ordered orientation but with much thinner fibrous stripes, whereas Figure 8(c2) shows a large number of scattered dotted fibers in MM tissue. We suspect that during the development of BE, the main mode of degradation is the transformation of bundled fibers into thin fibrils. In MM, the severe breakage of fibrils plays a leading role. This finding needs to be further verified by histology. Nevertheless, all these assumptions do not hinder the ability to infer and generalize the results of the true-color vectorial retardance imaging technique from the perspective of skin tissues and associated pathologies. The true-color vectorial retardance imaging method can assist the physician to better identify different lesions by enhancing the image contrast. As shown in Figure 8(a2,b2,c2), as the lesions increase, the collagen fibers become severely degraded, resulting in a weakening of the birefringence property [31,61]. Thus, the brightness of the vectorial retardance image gradually becomes darker, and the fracture of the fibers is better highlighted than the scalar retardance.
Figure 9 shows the MMIP imaging results of different stages of MM tissues. Figure 9(a2–c2) gives the true-color vectorial retardance images for the early, intermediate, and late stages of MM unstained sections. Compared with scalar retardance, true-color vectorial retardance imaging reflects not only the distribution but also the orientation of fibers in higher image contrast and clarity. By the vectorial retardance images, it can be found that the fiber content decreases, and the breakage becomes more severe as the degree of MM increases, which is due to the degradation of fibers resulting from the tumor expansion. These findings demonstrate that true-color vectorial retardance may assist the clinician in providing additional information regarding the stage of MM. In the future, we will study in depth the correspondence between different lesions and true-color vectorial retardance images.
Although scalar retardance is utilized widely in diagnosing lesions [33,35,36,37], the visualization of fiber distribution is limited and with less tissue-specificity contrast [47,69]. The orientation of linear retardance, another important parameter for observing the orientations of anisotropic fibers, is usually paired with scalar retardance to describe the birefringence [32]. However, it is inconvenient and time-consuming to read and analyze the two parameters simultaneously. In contrast to scalar retardance, the true-color vectorial retardance imaging method can directly distinguish the lesion and reflect the orientation of fibers with high contrast. As shown in the upper Figure 8(a2–c2) and Figure 9(a2–c2), it is difficult to distinguish each of the three components in a single vectorial retardance image. Because the true-color vectorial retardance algorithm used color and brightness to highlight the orientation and distribution information, by combining the three components together. However, it can be found that vectorial retardance can provide higher contrast than scalar retardance, as shown in the area indicated by the red arrows in Figure 8. Thus, the inability to identify a single component does not hinder the ability of true-color vectorial retardance in assisting physicians in better differentiating different skin lesions. Additionally, depolarization [59] and diattenuation [89] are also of great value in disease identification. Their value has been studied in human basal cell carcinoma [90] and cervical precancerous lesions [91]. We believe that the true-color imaging method can also be extended to these parameters to analyze corresponding microstructure details.
It is worth noting that the relatively small circular retardance contributes relatively weak to the true-color images than the linear retardance, as shown in Figure 5h, Figure 6f, and Figure 7(f1,f2). Because the true-color images are generated by simply overlaying the color channels in corresponding proportions of different components without any weight adjustment. The reason for the small presence of circular birefringence and chiral molecules is mainly due to the small thickness of the sections (4 μm was used in this manuscript) [34]. It has been reported that linear retardance and circular retardance both are important tissue polarimetry characteristics [38,92]. Linear retardance (or linear birefringence) of many tissues is stemming from their anisotropic fibrous structure, such as extra-cellular matrix proteins [93]. Circular retardance (or circular birefringence, also called optical rotation) in tissue arises due to the presence of asymmetric optically active chiral molecules such as glucose, proteins, and lipids [93,94]. At present, many reports consider only linear retardance, which is largely dominant in tissues [33,34,70,93,94]. The major reason for the small circular retardance may result from the small thickness of the sections [34,94], the small tissue anisotropy [70], or the resolution of the instrument. However, the measurement of optical rotation (circular birefringence) may provide an attractive method for pathological diagnosis [70]. Furthermore, together, R C , R H , and R 45 are indispensable components of the vectorial retardance describing the complete birefringent characteristics of anisotropic structures (magnitude and fast axis) [56]. Therefore, vectorial retardance imaging technology combining the three retardance components simultaneously is necessary for analyzing anisotropic microstructures. In our experiment, although the R C shows a smaller magnitude compared to the linear retardance, the R C model trained using five characteristics with specific statistics significance (including M , S t d , S k e , K u r , and E n ) have comparable classification ability with linear retardance. The cross-validation accuracy and prediction accuracy in distinguishing MM an BE and normal skin can be achieved at 88.33% and 85.92%, respectively. This proves that feature mining and quantitative classification using the SVM can compensate for the limitations of subjective judgment.
The experimental results from [29] demonstrate circular birefringence of skin tissues, although small (~0.25 rad), is present in the normal skin tissues. We attribute the small presence of circular birefringence and chiral molecules to the small thickness of the sections (5 μm was used in the reported study [29]). The authors of [62] reported that circular retardance components can be used to classify different cervical lesions [62]. That is due to the optically active collagen fibers present in the stroma of cervical tissue [62]. Clinically, the glucose and proteins with circular birefringence are existent in both skin stroma and cervical stroma [62,95]. Thus, the use of MMIP on thicker skin tissue sections has the potential to yield more significant circular retardance and can be applied for distinguishing MM from BE. In the future, thicker skin tissue sections (e.g., 10 μm [31], 20 μm [89], or 28 μm [90]), ex or in vivo skin tissues would be considered combined with the vectorial retardance imaging technology for distinguishing different skin lesions. In addition, we will continue to employ other imaging techniques to improve birefringence image contrast in the future, including using more valuable polarization parameters, using image fusion methods based on other color space (HSI or HSV), or normalizing colors by non-linear brightness scaling based on RGB color space.
Table 4 lists several represented polarimetric imaging techniques combined with polarization staining methods for different applications. In this paper, the MMIP technology was preferred, since the Mueller matrix can describe the full polarization properties of samples, including the full birefringence properties. This is very useful for effectively classifying the normal, BE, and MM. Many studies have reported that the change of birefringence within tissue is tightly related to disease progression, which can be manifested fully as the vectorial retardance measured by MMIP. Additionally, benefiting from the proposed true-color imaging method, the birefringent fiber information with enhanced contrast can be completely visualized in one image. In the future, with the development of advanced technologies to improve the stability and measurement accuracy of the system, the electrically tunable achromatic waveplates, the DoFP polarization technique, or their combination would be considered to replace the rotating waveplates strategy to shorten detection time [96,97,98,99,100,101,102].
A white light source was adopted in this paper to cooperate with the conventional microscope with which the clinicians are familiar. Therefore, it will be convenient for clinicians to perform pathological analysis and realize polarization imaging without additional hardware replacement or manipulation. Through quantitative and qualitative analysis, although the spectral information at different wavelengths will be mixed together [103,104,105,106], the classification accuracy of the three lesions can reach 96.19%, and the orientation and distribution of the fibers can be clearly displayed. Therefore, the broadband light used in this paper has little influence on the classification of the three lesions. In the future, we will further compare the results of studies using different monochromatic light, including different wavelengths from infrared to ultraviolet.

4. Conclusions

In summary, we employed the homemade high-fidelity MMIP and effectively differentiated the various lesions of human skin, including normal, BE, and MM, by quantitative and qualitative approaches. For the quantitative classification, eight classifiers using the SVM algorithm were established and evaluated with different retardance-related parameters. The preferred cross-validation accuracy of 98.60% and prediction accuracy of 96.19% can be achieved by the classifier based on vectorial retardance. For the qualitative analysis, a true-color vectorial retardance imaging technique was implemented to help clinicians to read and interpret parameters conveniently but without sacrificing any information about fibers. Compared to the conventional scalar retardance images, this method can significantly enhance the tissue-specific contrast and provide more details, including fiber distribution and orientation. Benefiting from these advantages, many valuable insights into the development of skin disease can be observed directly. We believe that the combined analysis of true-color vectorial retardance imaging technique and SVM can improve the accuracy of the diagnosis of early disease. This will dramatically facilitate the clinical application of polarization imaging.

Author Contributions

Conceptualization, W.W. and G.C.; methodology, W.W. and G.C.; software, W.W. and G.C.; validation, W.W. and G.C.; formal analysis, W.W. and G.C.; investigation, W.W.; resources, W.W.; data curation, W.W.; writing—original draft preparation, W.W. and G.C.; writing—review and editing, W.W.; visualization, W.W.; supervision, G.C. and Y.L.; project administration, Y.L.; funding acquisition, Y.L. All authors have read and agreed to the published version of the manuscript.

Funding

National Natural Science Foundation of China (11627808).

Institutional Review Board Statement

This study was conducted in accordance with the Declaration of Helsinki and approved by the Ethics Committee of the Seventh Center of the General Hospital of the Chinese People’s Liberation Army (Ethics Approval No. 2021-52, date of approval 27 July 2021).

Informed Consent Statement

Informed consent was obtained from all subjects involved in this study.

Data Availability Statement

Not applicable.

Acknowledgments

We would like to acknowledge Aijun Liu and Ziyu Ma at the 7th Medical Center of the Chinese People’s Liberation Army General Hospital for providing us with samples and experimental guidance, which was very important for our study.

Conflicts of Interest

The authors declare no conflict of interest.

References

  1. Arnold, M.; Singh, D.; Laversanne, M.; Vignat, J.; Vaccarella, S.; Meheus, F.; Cust, A.E.; de Vries, E.; Whiteman, D.C.; Bray, F. Global Burden of Cutaneous Melanoma in 2020 and Projections to 2040. JAMA Dermatol. 2022, 158, 495–503. [Google Scholar] [CrossRef] [PubMed]
  2. Babino, G.; Lallas, A.; Longo, C.; Moscarella, E.; Alfano, R.; Argenziano, G. Dermoscopy of melanoma and non-melanoma skin cancer. G. Ital. Dermatol. Venereol. 2015, 150, 507–519. [Google Scholar] [PubMed]
  3. Kornek, T.; Augustin, M. Skin cancer prevention. J. Dtsch. Dermatol. Ges. 2013, 11, 283–296. [Google Scholar] [CrossRef] [PubMed]
  4. Linares, M.A.; Zakaria, A.; Nizran, P. Skin Cancer. Prim. Care 2015, 42, 645–659. [Google Scholar] [CrossRef] [PubMed]
  5. OCatalano, O.; Roldán, F.A.; Varelli, C.; Bard, R.; Corvino, A.; Wortsman, X. Skin cancer: Findings and role of high-resolution ultrasound. J. Ultrasound 2019, 22, 423–431. [Google Scholar] [CrossRef]
  6. Marghoob, N.G.; Liopyris, K.; Jaimes, N. Dermoscopy: A Review of the Structures That Facilitate Melanoma Detection. J. Am. Osteopat. Assoc. 2019, 119, 380–390. [Google Scholar] [CrossRef]
  7. Bobos, M. Histopathologic classification and prognostic factors of melanoma: A 2021 update. G. Ital. Dermatol. Venereol. 2021, 156, 300–321. [Google Scholar] [CrossRef]
  8. González, S. Clinical applications of reflectance confocal microscopy in the management of cutaneous tumors. Actas Dermo-Sifiliográficas 2008, 99, 528–531. [Google Scholar] [CrossRef]
  9. Braun, R.P.; Rabinovitz, H.S.; Oliviero, M.; Kopf, A.W.; Saurat, J.H. Dermoscopy of pigmented skin lesions. J. Am. Acad. Dermatol. 2005, 52, 109–121. [Google Scholar] [CrossRef]
  10. Fink, C.; Haenssle, H.A. Non-invasive tools for the diagnosis of cutaneous melanoma. Ski. Res. Technol. 2017, 23, 261–271. [Google Scholar] [CrossRef]
  11. Xiong, Y.Q.; Ma, S.J.; Mo, Y.; Huo, S.T.; Wen, Y.Q.; Chen, Q. Comparison of dermoscopy and reflectance confocal microscopy for the diagnosis of malignant skin tumours: A meta-analysis. J. Cancer Res. Clin. Oncol. 2017, 143, 1627–1635. [Google Scholar] [CrossRef] [PubMed]
  12. Broggi, G.; Verzì, A.E.; Lacarrubba, F.; Micali, G.; Caltabiano, R. Horizontal Histopathology Correlation with In Vivo Reflectance Confocal Microscopy in Inflammatory Skin Diseases: A Review. Appl. Sci. 2022, 12, 1930. [Google Scholar] [CrossRef]
  13. Li, M.M.; Datto, M.; Duncavage, E.J.; Kulkarni, S.; Lindeman, N.I.; Roy, S.; Tsimberidou, A.M.; Vnencak-Jones, C.L.; Wolff, D.J.; Younes, A.; et al. Standards and Guidelines for the Interpretation and Reporting of Sequence Variants in Cancer: A Joint Consensus Recommendation of the Association for Molecular Pathology, American Society of Clinical Oncology, and College of American Pathologists. J. Mol. Diagn. 2017, 19, 4–23. [Google Scholar] [CrossRef] [PubMed]
  14. Bouzin, M.; Marini, M.; Chirico, G.; Granucci, F.; Mingozzi, F.; Colombo, R.; D’alfonso, L.; Sironi, L.; Collini, M. Melanin concentration maps by label-free super-resolution photo-thermal imaging on melanoma biopsies. Biomed. Opt. Express 2022, 13, 1173–1187. [Google Scholar] [CrossRef]
  15. Sober, A.J.; Fitzpatrick, T.B.; Mihm, M.C.; Wise, T.G.; Pearson, B.J.; Clark, W.H.; Kopf, A.W. Early recognition of cutaneous melanoma. JAMA 1979, 242, 2795–2799. [Google Scholar] [CrossRef]
  16. Christos, P.J.; A Oliveria, S.; Berwick, M.; Guerry, D.; E Elder, D.; Synnestvedt, M.; A Fine, J.; Barnhill, R.L.; Halpern, A.C. Signs and symptoms of melanoma in older populations. J. Clin. Epidemiol. 2000, 53, 1044–1053. [Google Scholar] [CrossRef]
  17. Zhou, X.; Maloufi, S.; Louie, D.C.; Zhang, N.; Liu, Q.; Lee, T.K.; Tang, S. Investigating the depolarization property of skin tissue by degree of polarization uniformity contrast using polarization-sensitive optical coherence tomography. Biomed. Opt. Express 2021, 12, 5073–5088. [Google Scholar] [CrossRef]
  18. Jayasooriya, P.R.; Mendis, B.R.R.N.; Lombardi, T. A Case Series on Intraoral Blue Nevi with a Literature Review-Based Clinico-Pathologic Comparison of Intraoral Blue Nevi with Other Oral Melanocytic Nevi. Appl. Sci. 2023, 13, 4420. [Google Scholar] [CrossRef]
  19. Courtenay, L.A.; González-Aguilera, D.; Lagüela, S.; Del Pozo, S.; Ruiz-Mendez, C.; Barbero-García, I.; Román-Curto, C.; Cañueto, J.; Santos-Durán, C.; Cardeñoso-Álvarez, M.E.; et al. Hyperspectral imaging and robust statistics in non-melanoma skin cancer analysis. Biomed. Opt. Express 2021, 12, 5107–5127. [Google Scholar] [CrossRef]
  20. Horobin, R.; Kiernan, J. Conn’s Biological Stains: A Handbook of Dyes, Stains and Fluorochromes for Use in Biology and Medicine; BIOS Scientific Publishers: Milton Park, UK, 2002. [Google Scholar]
  21. Tam, K.Y.; Smith, E.R.; Booth, J.; Compton, R.G.; Brennan, C.M.; Atherton, J.H. Kinetics and Mechanism of Dyeing Processes: The Dyeing of Cotton Fabrics with a Procion Blue Dichlorotriazinyl Reactive Dye. J. Colloid Interface Sci. 1997, 186, 387–398. [Google Scholar] [CrossRef]
  22. Constantine, V.S.; Mowry, R.W. Selective staining of human dermal collagen. I. An analysis of standard methods. J. Investig. Dermatol. 1968, 50, 414–418. [Google Scholar] [CrossRef] [PubMed]
  23. Wood, M.F.G.; Ghosh, N.; Moriyama, E.H.; Wilson, B.C.; Vitkin, I.A. Proof-of-principle demonstration of a Mueller matrix decomposition method for polarized light tissue characterization in vivo. J. Biomed. Opt. 2009, 14, 014029. [Google Scholar] [CrossRef] [PubMed]
  24. Rehbinder, J.; Haddad, H.; Deby, S.; Teig, B.; Nazac, A.; Novikova, T.; Pierangelo, A.; Moreau, F. Ex vivo Mueller polarimetric imaging of the uterine cervix: A first statistical evaluation. J. Biomed. Opt. 2016, 21, 071113. [Google Scholar] [CrossRef] [PubMed]
  25. Arifler, D.; Pavlova, I.; Gillenwater, A.; Richards-Kortum, R. Light Scattering from Collagen Fiber Networks: Micro-Optical Properties of Normal and Neoplastic Stroma. Biophys. J. 2007, 92, 3260–3274. [Google Scholar] [CrossRef] [PubMed]
  26. Prockop, D.J.; Kivirikko, K.I. Collagens: Molecular biology, diseases and potentials for therapy. Ann. Rev. Biochem. 2007, 64, 403–434. [Google Scholar] [CrossRef] [PubMed]
  27. Aubry, L.; Sy, K.; Sayd, T.; Ferraro, V. Collagen Peptides-Minerals Complexes from the Bovine Bone by-Product to Prevent Lipids Peroxidation in Meat and Butter and to Quench Free Radicals—Influence of Proteases and of Steam Sterilisation. Appl. Sci. 2023, 13, 3979. [Google Scholar] [CrossRef]
  28. Moreno, I.; Velasquez, P.; Fernandez-Pousa, C.R.; Sanchez-Lopez, M.M. Jones matrix method for predicting and optimizing the optical modulation properties of a liquid-crystal display. J. Appl. Phys. 2003, 94, 3697–3702. [Google Scholar] [CrossRef]
  29. Schucht, P.; Lee, H.R.; Mezouar, H.M.; Hewer, E.; Raabe, A.; Murek, M.; Zubak, I.; Goldberg, J.; Kovari, E.; Pierangelo, A.; et al. Visualization of white matter fiber tracts of brain tissue sections with wide-field imaging Mueller polarimetry. IEEE Trans. Med. Imaging 2020, 39, 4376–4382. [Google Scholar] [CrossRef]
  30. Wang, H.; Akkin, T.; Magnain, C.; Wang, R.; Dubb, J.; Kostis, W.J.; A Yaseen, M.; Cramer, A.; Sakadžić, S.; Boas, D. Polarization sensitive optical coherence microscopy for brain imaging. Opt. Lett. 2016, 41, 2213–2216. [Google Scholar] [CrossRef]
  31. Le, D.L.; Nguyen, D.T.; Le, T.H.; Phan, Q.-H.; Pham, T.-T. Characterization of healthy and cancerous human skin tissue utilizing Stokes–Mueller polarimetry technique. Opt. Commun. 2021, 480, 126460. [Google Scholar] [CrossRef]
  32. Dixon, A.W.; Taberner, A.J.; Nash, M.P.; Nielsen, P. Quantifying optical anisotropy in soft tissue membranes using Mueller matrix imaging. J. Biomed. Opt. 2021, 26, 106001. [Google Scholar] [CrossRef] [PubMed]
  33. Bancelin, S.; Nazac, A.; Ibrahim, B.H.; Dokládal, P.; Decencière, E.; Teig, B.; Haddad, H.; Fernandez, H.; Schanne-Klein, M.C.; De Martino, A. Determination of collagen fiber orientation in histological slides using Mueller microscopy and validation by second harmonic generation imaging. Opt. Express 2014, 22, 22561–22574. [Google Scholar] [CrossRef] [PubMed]
  34. Zhai, H.; Sun, Y.; He, H.; Chen, B.; He, C.; Wang, Y.; Ma, H. Distinguishing tissue structures via polarization staining images based on different combinations of Mueller matrix polar decomposition parameters. Opt. Lasers Eng. 2022, 152, 106955. [Google Scholar] [CrossRef]
  35. Sun, M.; He, H.; Zeng, N.; Du, E.; Guo, Y.; Liu, S.; Wu, J.; He, Y.; Ma, H. Characterizing the microstructures of biological tissues using Mueller matrix and transformed polarization parameters. Biomed. Opt. Express 2014, 5, 4223–4234. [Google Scholar] [CrossRef]
  36. Pierangelo, A.; Nazac, A.; Benali, A.; Validire, P.; Cohen, H.; Novikova, T.; Ibrahim, B.H.; Manhas, S.; Fallet, C.; Antonelli, M.R.; et al. Polarimetric imaging of uterine cervix: A case study. Opt. Express 2013, 21, 14120–14130. [Google Scholar] [CrossRef]
  37. Benoit, A.M.; Naoun, K.; Louis-Dorr, V.; Mala, L.; Raspiller, A. Linear dichroism of the retinal nerve fiber layer expressed with Mueller matrices. Appl. Opt. 2001, 40, 565–569. [Google Scholar] [CrossRef]
  38. Ghosh, N.; Vitkin, I.A. Tissue polarimetry: Concepts, challenges, applications, and outlook. J. Biomed. Opt. 2011, 16, 110801. [Google Scholar] [CrossRef]
  39. Li, H.; Li, L.; Yu, X.; Meng, D.; Gu, C.; Liu, Z.; Zhao, Z. Mueller Matrix Decomposition and Image for Non-Destructive Testing of UAVs Skin. Appl. Sci. 2023, 13, 2609. [Google Scholar] [CrossRef]
  40. Liang, Q.T. Physical Optics; Publishing House of Electronics Industry: Beijing, China, 2018. [Google Scholar]
  41. Chang, J.; He, H.; Wang, Y.; Huang, Y.; Li, X.; He, C.; Liao, R.; Zeng, N.; Liu, S.; Ma, H. Division of focal plane polarimeter-based 3 × 4 Mueller matrix microscope: A potential tool for quick diagnosis of human carcinoma tissues. J. Biomed. Opt. 2016, 21, 056002. [Google Scholar] [CrossRef]
  42. Ushenko, Y.A.; Gorskii, M.P.; Dubolazov, A.V.; Motrich, A.V.; Ushenko, V.A.; Sidor, M.I. Spatial-frequency Fourier polarimetry of the complex degree of mutual anisotropy of linear and circular birefringence in the diagnostics of oncological changes in morphological structure of biological tissues. Quantum Electron. 2012, 42, 727. [Google Scholar] [CrossRef]
  43. Luu, T.N.; Phan, Q.H.; Le, T.H.; Pham, T.T. Classification of human skin cancer using Stokes-Mueller decomposition method and artificial intelligence models. Optik 2022, 249, 168239. [Google Scholar] [CrossRef]
  44. Sung, H.; Ferlay, J.; Siegel, R.L.; Laversanne, M.; Soerjomataram, I.; Jemal, A.; Bray, F. Global cancer statistics 2020: GLOBOCAN estimates of incidence and mortality worldwide for 36 cancers in 185 countries. CA Cancer J. Clin. 2021, 71, 209–249. [Google Scholar] [CrossRef]
  45. He, C.; He, H.; Chang, J.; Dong, Y.; Liu, S.; Zeng, N.; He, Y.; Ma, H. Characterizing microstructures of cancerous tissues using multispectral transformed Mueller matrix polarization parameters. Biomed. Opt. Express 2015, 6, 2934–2945. [Google Scholar] [CrossRef]
  46. Cao, C.; Wang, J.; Zhou, G.; Li, J.; Liu, K.; Liu, L.; Li, L.; Li, Y. Quantitatively characterizing the microstructural features of collagen fiber bundles with or without tenocytes by Mueller imaging polarimeter. In Proceedings of the Biomedical Imaging and Sensing Conference 2021, Online, 20–22 April 2021; Volume 11925, pp. 99–102. [Google Scholar]
  47. Tang, P.; Xu, J.; Wang, R.K. Imaging and visualization of the polarization state of the probing beam in polarization-sensitive optical coherence tomography. Appl. Phys. Lett. 2018, 113, 231101. [Google Scholar] [CrossRef]
  48. Huard, S. Polarization of Light; Wiley: Hoboken, NJ, USA, 1997. [Google Scholar]
  49. Goldstein, D. Polarized Light, 2nd ed.; Marcel Dekker: New York, NY, USA, 2003. [Google Scholar]
  50. Chipman, R.A.; Lam, W.S.T.; Young, G. Polarized Light and Optical Systems; CRC Press: Boca Raton, FL, USA, 2018. [Google Scholar]
  51. Ortega, O.N.; Arce-Diego, J.L. Mueller matrix differential decomposition. Opt. Lett. 2011, 36, 1942–1944. [Google Scholar] [CrossRef]
  52. Mi, C.; Shao, C.; He, H.; He, C.; Ma, H. Evaluating Tissue Mechanical Properties Using Quantitative Mueller Matrix Polarimetry and Neural Network. Appl. Sci. 2022, 12, 9774. [Google Scholar] [CrossRef]
  53. Yao, Y.; Zhang, F.; Wang, B.; Wan, J.; Si, L.; Dong, Y.; Zhu, Y.; Liu, X.; Chen, L.; Ma, H. Polarization imaging-based radiomics approach for the staging of liver fibrosis. Biomed. Opt. Express 2022, 13, 1564–1580. [Google Scholar] [CrossRef]
  54. Varin, B.; Rehbinder, J.; Dellinger, J.; Heinrich, C.; Torzynski, M.; Spenlé, C.; Bagnard, D.; Zallat, J. Monitoring subcutaneous tumors using Mueller polarimetry: Study on two types of tumors. Biomed. Opt. Express 2021, 12, 6055–6065. [Google Scholar] [CrossRef]
  55. Heinrich, C.; Rehbinder, J.; Zallat, J. Revisiting the generalized polar decomposition of Mueller matrices. J. Opt. Soc. Am. A 2020, 37, 1327–1339. [Google Scholar] [CrossRef]
  56. Ignatenko, D.N.; Shkirin, A.V.; Lobachevsky, Y.P.; Gudkov, S.V. Applications of Mueller Matrix Polarimetry to Biological and Agricultural Diagnostics: A Review. Appl. Sci. 2022, 12, 5258. [Google Scholar] [CrossRef]
  57. Gan, Y.; Yao, W.; Myers, K.M.; Vink, J.Y.; Wapner, R.J.; Hendon, C.P. Analyzing three-dimensional ultrastructure of human cervical tissue using optical coherence tomography. Biomed. Opt. Express 2015, 6, 1090–1108. [Google Scholar] [CrossRef] [PubMed]
  58. Chue-Sang, J.; Holness, N.; Gonzalez, M.; Greaves, J.; Saytashev, I.; Stoff, S.; Gandjbakhche, A.; Chernomordik, V.V.; Burkett, G.; Ramella-Roman, J.C. Use of Mueller matrix colposcopy in the characterization of cervical collagen anisotropy. J. Biomed. Opt. 2018, 23, 121605. [Google Scholar] [CrossRef]
  59. Ahmad, I.; Ahmad, M.; Khan, K.; Ashraf, S.; Ahmad, S.; Ikram, M. Ex vivo characterization of normal and adenocarcinoma colon samples by Mueller matrix polarimetry. J. Biomed. Opt. 2015, 20, 056012. [Google Scholar] [CrossRef] [PubMed]
  60. Baldwin, A.M.; Chung, J.R.; Baba, J.S.; Spiegelman, C.H.; Amoss, M.S.; Cote, G.L. Mueller matrix imaging for cancer detection. In Proceedings of the 25th Annual International Conference of the IEEE Engineering in Medicine and Biology Society (IEEE Cat. No. 03CH37439), Cancun, Mexico, 17–21 September 2003; Volume 2, pp. 1027–1030. [Google Scholar]
  61. Ahmad, I.; Khaliq, A.; Iqbal, M.; Khan, S. Mueller matrix polarimetry for characterization of skin tissue samples: A review. Photodiagn. Photodyn. Ther. 2020, 30, 101708. [Google Scholar] [CrossRef]
  62. Le, D.L.; Huynh, T.N.; Nguyen, D.T.; Vo, T.V.; Hien, P. Characterization of healthy and nonmelanoma-induced mouse utilizing the Stokes-Mueller decomposition. J. Biomed. Opt. 2018, 23, 125003. [Google Scholar] [CrossRef] [PubMed]
  63. Li, J.; Li, Y.; Liu, K.; Zhou, G.; Liu, L.; Zheng, M. Hybrid calibration method of a wide-view-angle Mueller polarimeter for hyper-numerical-aperture imaging systems. Chin. Opt. Lett. 2020, 18, 081202. [Google Scholar] [CrossRef]
  64. Wang, J.; Li, Y.; Cao, C.; Zhou, G.; Li, L. High-fidelity and rapid cellular-level Mueller matrix imaging for tissue identification with unstained sections. Biomed. Opt. Express 2021, 12, 4745. [Google Scholar] [CrossRef] [PubMed]
  65. Wang, W.; Ma, Z.; Li, J.; Liu, A.; Li, Y.; Wang, J.; Zhou, G.; Li, Y. Research on the Reliability of Mueller Imaging Polarimeter in pathological diagnosis. Acta Optica Sinica. 2022, 42, 1512002. [Google Scholar]
  66. Maitra, S.; Gartley, M.G.; Kerekes, J.P. Relation between degree of polarization and Pauli color coded image to characterize scattering mechanisms. Polariz. Meas. Anal. Remote Sens. X SPIE 2012, 8364, 128–136. [Google Scholar]
  67. Zhu, D.; Wang, J.; Marjanovic, M.; Chaney, E.J.; Cradock, K.A.; Higham, A.M.; Liu, Z.G.; Gao, Z.; Boppart, S.A. Differentiation of breast tissue types for surgical margin assessment using machine learning and polarization-sensitive optical coherence tomography. Biomed. Opt. Express 2021, 12, 3021–3036. [Google Scholar] [CrossRef]
  68. Wang, J.; Xu, Y.; Mesa, K.J.; South, F.A.; Chaney, E.J.; Spillman, D.R.; Barkalifa, R.; Marjanovic, M.; Carney, P.S.; Higham, A.M.; et al. Complementary use of polarization-sensitive and standard OCT metrics for enhanced intraoperative differentiation of breast cancer. Biomed. Opt. Express 2018, 9, 6519–6528. [Google Scholar] [CrossRef] [PubMed]
  69. Lu, S.Y.; Chipman, R.A. Interpretation of Mueller matrices based on polar decomposition. J. Opt. Soc. Am. A 1996, 13, 1106–1113. [Google Scholar] [CrossRef]
  70. Zaffar, M.; Pradhan, A. Mapping of Retardance, Diattenuation and Polarizance vector on Poincare Sphere for Diagnosis and Classification of Cervical Precancer. J. Biophotonics 2020, 13, e201960139. [Google Scholar] [CrossRef] [PubMed]
  71. Hsu, C.W.; Lin, C.J. A comparison of methods for multiclass support vector machines. IEEE Trans. Neural Netw. 2002, 13, 415–425. [Google Scholar]
  72. Hsu, C.W.; Chang, C.C.; Lin, C.J. A practical Guide to Support Vector Classification. 2003, 1396–1400. Available online: https://www.csie.ntu.edu.tw/~cjlin/papers/guide/guide.pdf (accessed on 19 May 2016).
  73. Zhang, R.; Xu, Z.; Hao, J.; Yu, J.; Liu, Z.; Liu, S.; Chen, W.; Zhou, J.; Li, H.; Lin, Z.; et al. Label-free identification of human coronary atherosclerotic plaque based on three-dimensional quantitative assessment of multiphoton microscopy images. Biomed. Opt. Express 2021, 12, 2979–2995. [Google Scholar] [CrossRef]
  74. Chen, X.; Liu, W.; Thai, T.C.; Castellano, T.; Gunderson, C.C.; Moore, K.; Mannel, R.S.; Liu, H.; Zheng, B.; Qiu, Y. Developing a new radionics-based CT image marker to detect lymph node metastasis among cervical cancer patients. Comput. Methods Programs Biomed. 2020, 197, 105759. [Google Scholar] [CrossRef]
  75. Alnemari, S.; Alshammari, M. Detecting Phishing Domains Using Machine Learning. Appl. Sci. 2023, 13, 4649. [Google Scholar] [CrossRef]
  76. Wu, X.; Chen, C.; Chen, X.; Luo, C.; Lv, X.; Shi, Y.; Yang, J.; Meng, X.; Chen, C.; Su, J.; et al. Raman spectroscopy combined with machine learning algorithms for rapid detection Primary Sjögren’s syndrome associated with interstitial lung disease. Photodiagn. Photodyn. Ther. 2022, 40, 103057. [Google Scholar] [CrossRef]
  77. Kim, K.M.; Hwang, H.; Sohn, B.; Park, K.; Han, K.; Ahn, S.S.; Lee, W.; Chu, M.K.; Heo, K.; Lee, S.K. Development and Validation of MRI-Based Radiomics Models for Diagnosing Juvenile Myoclonic Epilepsy. Korean J. Radiol. 2022, 23, 1281–1289. [Google Scholar] [CrossRef]
  78. Zhao, X.; Lu, Y.; Li, S.; Guo, F.; Xue, H.; Jiang, L.; Wang, Z.; Zhang, C.; Xie, W.; Zhu, F. Predicting renal function recovery and short-term reversibility among acute kidney injury patients in the ICU: Comparison of machine learning methods and conventional regression. Ren. Fail. 2022, 44, 1326–1337. [Google Scholar] [CrossRef]
  79. Meng, L.; Wei, T.; Fan, R.; Su, H.; Liu, J.; Wang, L.; Huang, X.; Qi, Y.; Li, X. Development and validation of a machine learning model to predict venous thromboembolism among hospitalized cancer patients. Asia Pac. J. Oncol. Nurs. 2022, 9, 100128. [Google Scholar] [CrossRef] [PubMed]
  80. Borovkova, M.; Peyvasteh, M.; Dubolazov, O.; Ushenko, Y.; Ushenko, V.; Bykov, A.; Deby, S.; Rehbinder, J.; Novikova, T.; Meglinski, I. Complementary analysis of Mueller-matrix images of optically anisotropic highly scattering biological tissues. J. Eur. Opt. Soc. 2018, 14, 20. [Google Scholar] [CrossRef]
  81. El Naqa, I.; Grigsby, P.; Apte, A.; Kidd, E.; Donnelly, E.; Khullar, D.; Chaudhari, S.; Yang, D.; Schmitt, M.; Laforest, R.; et al. Exploring feature-based approaches in PET images for predicting cancer treatment outcomes. Pattern Recognit. 2009, 42, 1162–1171. [Google Scholar] [CrossRef] [PubMed]
  82. Jaynes, E.T. Probability Theory: The Logic of Science; Cambridge University Press: Cambridge, UK, 2003. [Google Scholar]
  83. Zhu, Y. Limit Error and Confidence Level in Sampling; China Statistics Press: Beijing, China, 2009. [Google Scholar]
  84. Park, W.J.; Park, J.B. History and application of artificial neural networks in dentistry. Eur. J. Dent. 2018, 12, 594–601. [Google Scholar] [CrossRef]
  85. Gao, Y.; Wu, F.G.; Guo, W.B.; Zheng, H.; Zhang, L.; Chen, X.L.; Li, M. Risk prediction model for early postoperative death in patients with hepatocellular carcinoma: A retrospective study based on random forest algorithm and logistic regression. Eur. J. Gastroenterol. Hepatol. 2022, 4, 1247–1254. [Google Scholar] [CrossRef]
  86. Lee, S.; Zhou, J.; Chung, C.T.; Lee, R.O.Y.; Bazoukis, G.; Letsas, K.P.; Wong, W.T.; Wong, I.C.K.; Mok, N.S.; Liu, T.; et al. Comparing the Performance of Published Risk Scores in Brugada Syndrome: A Multi-center Cohort Study. Curr. Probl. Cardiol. 2022, 47, 101381. [Google Scholar] [CrossRef]
  87. Kayalibay, B.; Jensen, G.; Smagt, P. CNN-based segmentation of medical imaging data. arXiv 2017, arXiv:1701.03056. [Google Scholar]
  88. Suhail, Z.; Denton, E.R.E.; Zwiggelaar, R. Classification of micro-calcification in mammograms using scalable linear Fisher discriminant analysis. Med Biol. Eng. Comput. 2018, 56, 1475–1485. [Google Scholar] [CrossRef]
  89. Zaffar, M.; Pradhan, A. Spatial autocorrelation analysis on two-dimensional images of Mueller matrix for diagnosis and differentiation of cervical precancer. J. Biophotonics 2020, 13, e202000006. [Google Scholar] [CrossRef]
  90. Du, E.; He, H.; Zeng, N.; Sun, M.; Guo, Y.; Wu, J.; Liu, S.; Ma, H. Mueller matrix polarimetry for differentiating characteristic features of cancerous tissues. J. Biomed. Opt. 2014, 19, 76013. [Google Scholar] [CrossRef]
  91. Shukla, P.; Pradhan, A. Mueller decomposition images for cervical tissue: Potential for discriminating normal and dysplastic state. Opt Express. 2009, 17, 1600–1609. [Google Scholar] [CrossRef]
  92. Ghosh, N.; Wood, M.F.G.; Vitkin, I.A. Mueller matrix decomposition for extraction of individual polarization parameters from complex turbid media exhibiting multiple scattering, optical activity, and linear birefringence. J. Biomed. Opt. 2008, 13, 044036. [Google Scholar] [CrossRef] [PubMed]
  93. McNichols, R.J.; Coté, G.L. Optical glucose sensing in biological fluids: An overview. J. Biomed. Opt. 2000, 5, 5–16. [Google Scholar] [CrossRef] [PubMed]
  94. Qi, J.; He, H.; Lin, J.; Dong, Y.; Chen, D.; Ma, H.; Elson, D.S. Assessment of tissue polarimetric properties using Stokes polarimetric imaging with circularly polarized illumination. J. Biophotonics 2018, 11, e201700139. [Google Scholar] [CrossRef] [PubMed]
  95. Fritsch, P.; Schwarz, T. Dermatologie Venerologie: Grundlagen. Klinik. Atlas; Springer: Berlin/Heidelberg, Germany, 2018. [Google Scholar]
  96. Zhao, Y.; Zhang, L.; Pan, Q. Spectropolarimetric imaging for pathological analysis of skin. Appl. Opt. 2009, 48, D236–D246. [Google Scholar] [CrossRef]
  97. Feng, X.; Sun, L.; Zhang, E. Depth selectivity for the assessment of microstructure by polarization studies. Biomed. Opt. Express 2013, 4, 958–966. [Google Scholar] [CrossRef]
  98. Safrani, A.; Aharon, O.; Mor, S.; Arnon, O.; Rosenberg, L.; Abdulhalim, I. Skin biomedical optical imaging system using dual wavelength polarimetric control with liquid crystals. J. Biomed. Opt. 2010, 15, 026024. [Google Scholar] [CrossRef]
  99. Ney, M.; Abdulhalim, I. Modeling of reflectometric and ellipsometric spectra from the skin in the terahertz and submillimeter waves region. J. Biomed. Opt. 2011, 16, 067006. [Google Scholar] [CrossRef]
  100. Aharon, O.; Abdulhalim, I.; Arnon, O.; Rosenberg, L.; Dyomin, V.; Silberstein, E. Differential optical spectropolarimetric imaging system assisted by liquid crystal devices for skin imaging. J. Biomed. Opt. 2011, 16, 086008. [Google Scholar] [CrossRef]
  101. Ney, M.; Abdulhalim, I. Ultrahigh polarimetric image contrast enhancement for skin cancer diagnosis using InN plasmonic nanoparticles in the terahertz range. J. Biomed. Opt. 2015, 20, 125007. [Google Scholar] [CrossRef]
  102. Graham, L.; Yitzhaky, Y.; Abdulhalim, I. Classification of skin moles from optical spectropolarimetric images: A pilot study. J. Biomed. Opt. 2013, 18, 111403. [Google Scholar] [CrossRef] [PubMed]
  103. Abuleil, M.J.; Abdulhalim, I. Tunable achromatic liquid crystal waveplates. Opt. Lett. 2014, 39, 5487–5490. [Google Scholar] [CrossRef] [PubMed]
  104. Abuleil, M.J.; Abdulhalim, I. Broadband ellipso-polarimetric camera utilizing tunable liquid crystal achromatic waveplate with improved field of view. Opt. Express 2019, 27, 12011–12024. [Google Scholar] [CrossRef] [PubMed]
  105. Abu Aisheh, M.; Abutoama, M.; Abuleil, M.J.; Abdulhalim, I. Fast tunable metamaterial liquid crystal achromatic waveplate. Nanophotonics 2023, 12, 1115–1127. [Google Scholar] [CrossRef]
  106. Wu, J.; Li, Y.; Ning, T.; Long, C.; Zhou, G. Optimal design for a broadband Stokes polarimeter of liquid crystal variable retarders. Appl. Opt. 2022, 61, 7490–7497. [Google Scholar] [CrossRef] [PubMed]
Figure 1. The experimental setup and schematic diagram.
Applsci 13 06514 g001
Figure 2. The processing flowchart for vectorial retardance imaging.
Applsci 13 06514 g002
Figure 3. Demonstration of the color-encoded vectorial retardance: (a,b) the front side and back side of the color-encoded sphere, which map all possible states of vectorial retardance; (c) the relationship between several typical vectorial retardance states and the colors; (df) each color on the cross-sections has characteristics of R H = 0 , R 45 = 0 , and R C = 0 , respectively; (gi) each color on the cross-sections has characteristics of R H = R 45 , R H = R C , and R 45 = R C , respectively.
Applsci 13 06514 g003aApplsci 13 06514 g003b
Figure 4. Birefringence-related imaging results: (a) horizontal retardance; (b) 45°-linear retardance; (c) circle retardance; (d) scalar retardance; (e) orientation of linear retardance; (f) true-color vectorial retardance image.
Applsci 13 06514 g004
Figure 5. Imaging results of normal skin tissues: (a) microscopic intensity image of H&E stained section; (b) microscopic intensity image of unstained section; (c) horizontal retardance; (d) 45°-linear retardance; (e) circle retardance; (f) scalar retardance; (g) orientation of linear retardance; (h)vectorial retardance. The scale bar represents 50 μm.
Applsci 13 06514 g005
Figure 6. Results of normal skin tissues: (a) horizontal retardance; (b) 45°-linear retardance; (c) circle retardance; (d) scalar retardance; (e) orientation of linear retardance; (f) vectorial retardance. The scale bar represents 25 μm.
Applsci 13 06514 g006
Figure 7. Imaging results of BE and MM tissues: (a1f1) BE; (a2f2) MM; (a1,a2) horizontal retardance; (b1,b2) 45°-linear retardance; (c1,c2) circle retardance; (d1,d2) microscopic intensity image of H&E stained section; (e1,e2) scalar retardance; (f1,f2) vectorial retardance. The scale bar represents 50 μm.
Applsci 13 06514 g007
Figure 8. Imaging results of normal skin, BE, and MM tissues: (a1,a2) normal skin; (b1,b2) BE; (c1,c2) MM; (a1c1) scalar retardance; (a2c2) vectorial retardance. The scale bar represents 50 μm.
Applsci 13 06514 g008
Figure 9. Imaging results of different stages of MM tissues: (a1,a2) early stage of MM; (b1,b2) intermediate stage of MM; (c1,c2) late stage of MM; (a1c1) scalar retardance; (a2c2) vectorial retardance. The scale bar represents 50 μm.
Applsci 13 06514 g009
Table 1. The number of patients and detection cases of unstained skin sections detected by MMIP.
NormalBEMMTotalMean Age
Patients2120236468 ± 12
Cases8538518472551
Table 2. The specific information on training and testing sets.
Train SetTest Set
NormalBEMMTotalNormalBEMMTotal
Cases50050050015003533513471051
Table 3. The performance of eight SVM classifiers in distinguishing the three skin tissues.
SVM ClassifierRetardance-Related
Parameters
Cross-Validation AccuracyPrediction
Accuracy
Classifier I R H 82.80%81.64%
Classifier II R 45 87.40%84.30%
Classifier III R C 87.20%85.92%
Classifier IV R 88.33%87.92%
Classifier V R H , R 45 95.20%84.11%
Classifier VI R H , R C 95.33%82.97%
Classifier VII R 45 , R C 96.27%85.16%
Classifier VIII R H , R 45 , R C ( R )98.60%96.19%
Table 4. The comparison among several represented polarimetric imaging techniques combined with polarization staining methods. Each parameter represents a unique physical quantity.
NumberPolarimetric Imaging TechniquesPolarization
Parameters
Polarization
Staining Methods
1MMIP [33]Scalar retardance
Azimuth of the slow axis
False-color imaging by
one parameter
2MMIP [34]Diattenuation
Linear retardance
Azimuth of the slow axis
True-color imaging by
several parameters
3DoFP polarization microscope [41] Degree of linear polarization
Angle of polarization
True-color imaging by
several parameters
4PS-OCT [47]Stokes parametersTrue-color imaging by
several parameters
5Stokes polarimeter [96]Stokes parametersTrue-color imaging by
several parameters
Disclaimer/Publisher’s Note: The statements, opinions and data contained in all publications are solely those of the individual author(s) and contributor(s) and not of MDPI and/or the editor(s). MDPI and/or the editor(s) disclaim responsibility for any injury to people or property resulting from any ideas, methods, instructions or products referred to in the content.

