Abstract
This paper investigates the spatial response of electromagnetic flowmeters, which are commonly used to measure bulk flow in various industrial applications. While most flowmeters focus on measuring the overall flow rate, this paper explores the response of a flowmeter to the spatial distribution of the flow and develops a new dipole form of the forward map. By writing the Neumann Green’s function and using the dipole form, we investigate reconstruction of the distribution of flow within the pipe. The paper presents examples of flow tomography using a truncated singular value reconstruction, which enables accurate visualization of the flow field. By examining the spatial response of electromagnetic flowmeters and presenting a new dipole form of the forward map, this paper contributes to the ongoing effort to improve the accuracy and informativeness of flow measurements in industrial settings.
1. Introduction
The use of electromagnetic (EM) measurement to determine a fluid’s rate of flow began in 1832 with Faraday’s unsuccessful attempt to determine the flow rate of the Thames river from measurements of induced potentials due to the river’s movement within Earth’s magnetic field [1]. The first successful measurement came from Wollaston, who measured the voltage difference across the English channel, using existing telegraph cables, induced in the same way [2]. While early investigators knew that it would be theoretically possible to accurately measure the bulk flow rate of a fluid, they lacked the tools and methods to be able to overcome the practical issues such as the construction plus transport of the measurement devices, and noise reduction techniques. They instead limited their efforts to correlating the measurements with the tides for oceanography and aquatic sciences [3,4].
Williams [5] and Thúrlemann [6] pioneered the development of EM flow measurements in cylindrical pipes. If a fixed radially symmetric velocity field is assumed, then the measurement from two electrodes arranged perpendicular to both the fluid flow, and magnetic field is proportional to the total flow. With some calibration to find the constant of proportionality, reasonable measurements of flow are obtainable. A similar assumption on the velocity field allowed for a means of measuring the velocity of the ocean relative to a boat [7,8]. However, it was found that turbulence has a large effect on the measurements.
Electromagnetic flowmeters measure the electric potential induced when an Ohmic fluid flows in the presence of a stationary, external magnetic field. In industrial settings, typically the fluid, and flow, is inside a cylindrical pipe, while applications in geophysics typically operate with an effectively unbounded domain. The basic theory and governing equations were developed by Kolin [9] that are summarized as the flowmeter equation given by Shercliff ([10], p. 13):
Here, is the velocity of the fluid at each point, is the imposed magnetic flux density, and u is the resulting electric potential throughout the moving fluid. The right-hand side is an effective current source distribution within the fluid resulting from the Lorentz force, or equivalently Faraday’s Law, while the left-hand side combines Ohm’s Law and conservation of current. This equation assumes that the conductivity of the fluid is finite, homogeneous, and isotropic, though, interestingly, the value of the conductivity cancels and does not appear in the flowmeter Equation (1).
Shercliff [10,11] developed theory and solutions for a cylindrical geometry, with circular cross-section, assuming axial flow, i.e., that flow in a pipe occurs only parallel to the axis of the pipe taken to be the z-direction, assumed uniform field perpendicular to the axis of the pipe along the x direction, and electrodes sensing the voltage at the boundary located on the diameter along the y axis. These simplifying assumptions reduce the problem to a 2-dimensional problem in the circular domain D that is the cross-section of the pipe in . Then, the flowmeter equation reduces to where B is the magnitude of and v is the z-component of . This simplified theory, as summarized by Shercliff in [10], breaks down as soon as the flow is no longer a simple distribution. This was widely known by leading proponents in the field at the time of his writing. For this reason, and the prevalence of liquid metal cooled nuclear power at the time, EM flowmeter theory development was confined mostly to cylindrically symmetric systems.
Solving the flowmeter equation for the potential u may be performed by an application of Green’s theorem for Poisson’s equation, as in the following Lemma; see ([12], p. 229).
Lemma 1.
If u is continuous and has continuous second-order derivatives within a 2-dimensional domain D, with boundary , containing the point , then
where is any fundamental solution for , that is
where is harmonic in D, and denotes the outward normal derivative on the boundary .
Strictly, the adjoint fundamental solution, and adjoint Green’s function, is required in Lemma 1 [13], though, typically the boundary value problem for EM flowmeters is self-adjoint so this detail can be overlooked.
When each of of the terms for , for , and for are known, the solution can be determined by evaluating Equation (2). When the pipe is insulating, it follows that though the term for is unknown. For a bounded region D, it is not possible to choose the harmonic function in Equation (3) so that , since, by conservation of current, ; see, (e.g., [14], p. 286). Thus, the basic definition of the (adjoint) Green’s function, as a fundamental solution that satisfies the homogeneous form of the (adjoint) boundary conditions, needs to be modified for the Neumann problem (7). (See Section 2 for the definition and properties of the Neumann Green’s function.)
Instead, Shercliff ignored the integral over in Equation (2)—called the bilinear concomitant—but by adding a harmonic function and assuming the no-slip boundary condition that gave a potential u that satisfied the boundary condition that , though with unstated reference potential. By taking the difference of such potentials, Shercliff avoided the requirement to state a reference potential for u. Here, we utilize the rigorous and comprehensive theory of Green’s functions as particular fundamental solutions, formally defined via Schwartz’ distribution theory, though these methods were not widely integrated into the applied sciences at the time. Substituting , as noted above, and integrating by parts in the y direction, Shercliff [11] derived the potential difference between electrodes at and in a pipe of radius 1 as
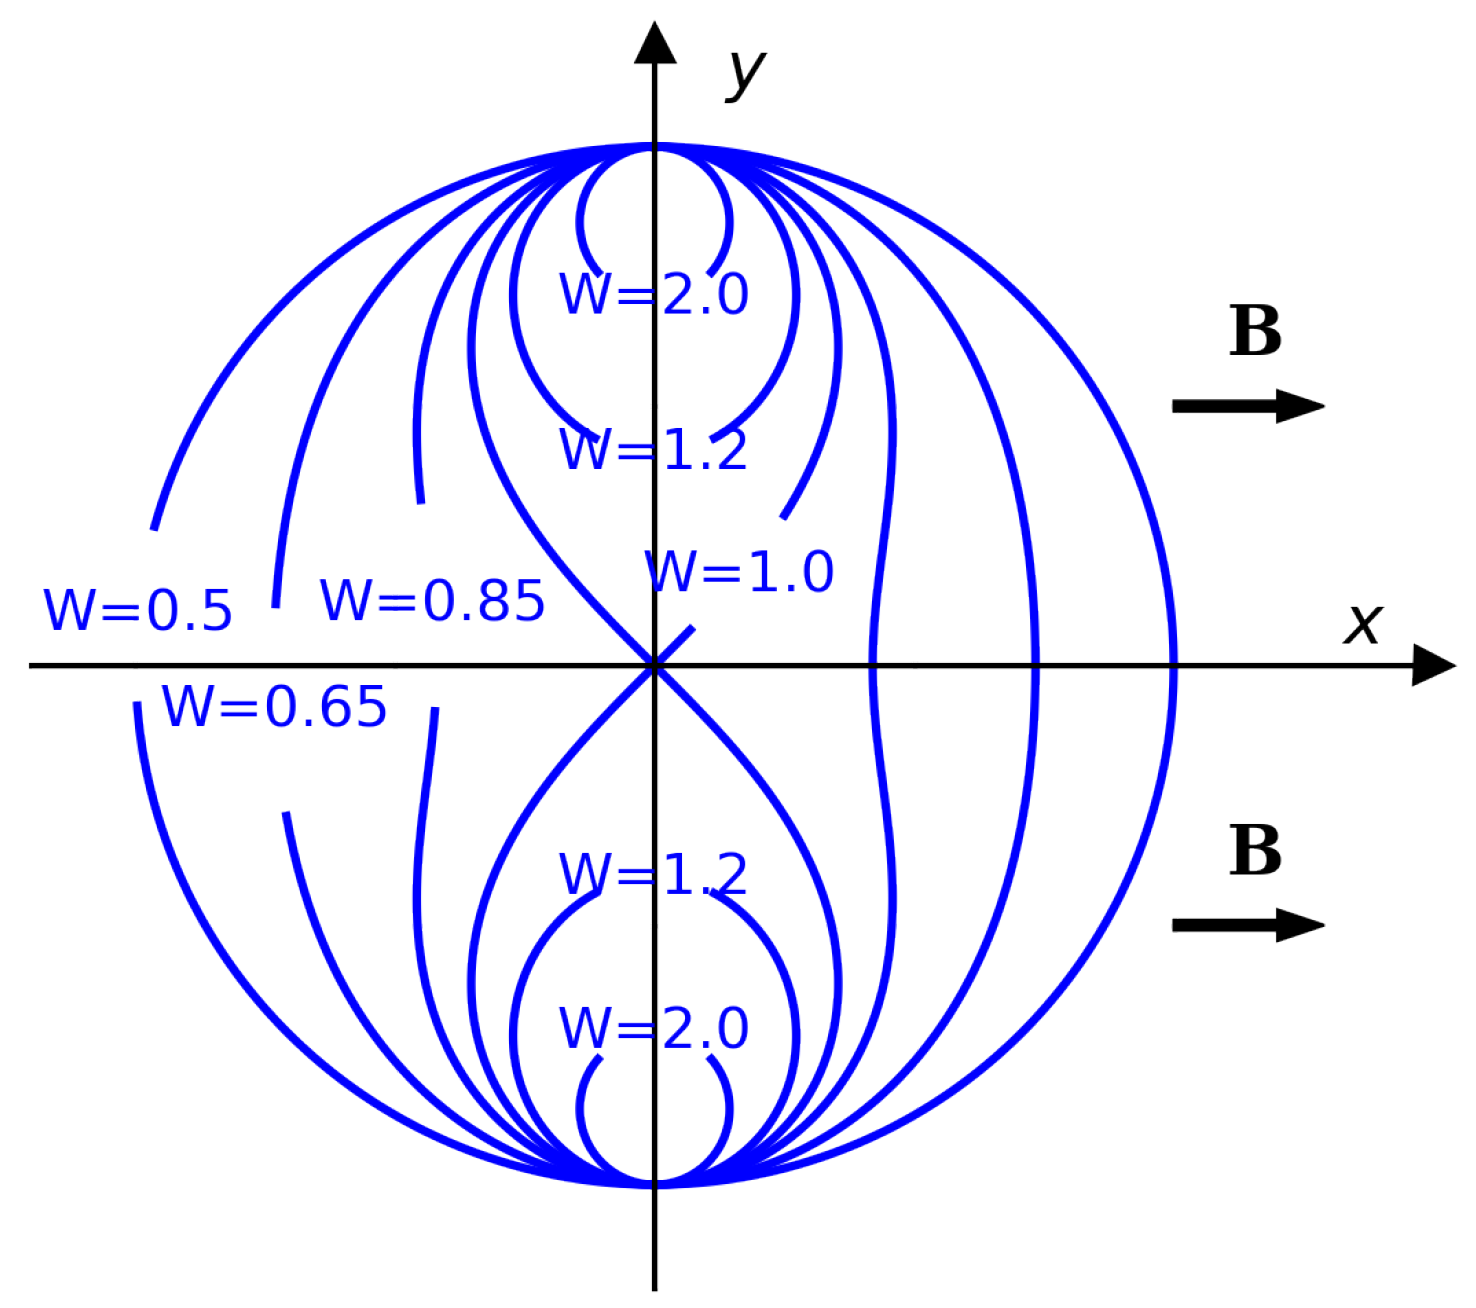
where W is Shercliff’s weight function. Contours of W are plotted in Figure 1, which, as noted by Shercliff [11], are Cassini ovals.
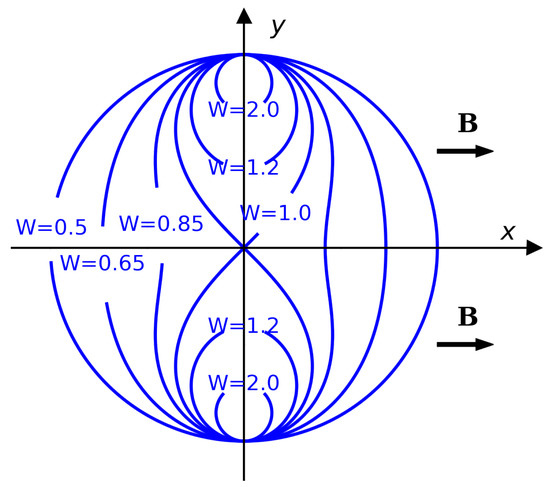
Figure 1.
Cross section of pipe showing contours of Shercliff’s weight function, W, for constant field in the x-direction and for small sensing electrodes at and , redrawn from [11].
Importantly, for our purposes, and as is evident in Figure 1, the measured potential difference is much more sensitive to fluid flow in the pipe near the electrodes, than further away. That is, a given magnitude of flow in a region near the electrode will cause a greater electrical response than when the same flow occurs in a region further away from the electrode. Because the weighting function W approaches ∞ at the electrodes, reverse flow near one electrode could cause negative readings for positive bulk flow, and, indeed, the measurement could be anywhere between and for a given average, bulk flow rate. Shercliff [11] also noted this, and that the common statement at that time that flowmeters are insensitive to the velocity profile is clearly erroneous, except in the special case of radially symmetric axial flow.
Shercliff’s weighting function was subsequently extended by Bevir [15] to accommodate general flow fields, and also gave the conditions for an EM flowmeter to be insensitive to flow profile [16]. Bevir’s formulation defines the weight function by
with
where is the current density when unit current is passed between the electrodes. We generalize both Shercliff’s and Bevir’s formulation in Section 2. Further notes on the historical development of electromagnetic flowmeters are presented in [17].
Many papers have been published since, further exploring this weighting function applied to different magnetic field arrangements, and extending to more measurements than the original two electrodes; see, e.g., [18,19,20,21].
This paper further explores the sensitivity of a flowmeter to spatial variation in flow and imposed magnetic field. As noted by Shercliff [11], even in the restricted case of axial flow in a pipe, the spatial distribution of flow can dominate the measurement made, with a measurement anywhere between and theoretically possible for a given bulk flow rate. It is therefore critical to understand the response of flowmeters to spatial flow distribution when designing a flowmeter intended for detecting bulk flow rate or for imaging flow distribution, especially when calibration within a restricted flow regime is not feasible or when simplifying assumptions about the flow distribution are not valid. We restrict examples to the two-dimensional disk, corresponding to axial flow in circular pipes, to allow direct comparison with the weighting functions of Shercliff and Bevir, presented above. However, the methods presented here easily extend to general flows in 3-dimensional domains, with the only change required is using the appropriate Neumann Green’s function. We develop a dipole form of the forward map from flow to boundary potential, to examine the theoretical limits of flowmeters, with potentially multiple point electrodes around the boundary of the pipe. The singular value decomposition (SVD) of the forward map then demonstrates the capability of flowmeters to imaging the spatial flow distribution and a simple reconstruction of a few velocity fields is presented.
Our motivation for this work started with the goal of developing accurate inversion for an application in measuring flow in subsurface rivers, or aquifers, in Aoteoroa New Zealand, within a multidisciplinary team developing instrumentation and processing. Measurements in a lab-scale aquifer simulator built for this project are reported in [22] showing correlation with measured bulk flow after interference effects are removed. Presently, there is no efficient way of measuring the natural ground-water flow distribution. Electromagnetic flowmeters seem a promising technology as the principle is non-invasive, and the flowmeter responds to bulk or averaged properties, thereby allowing remote measurement of bulk flow, at least in principle.
However, there are many practical obstacles to developing such an instrument for measuring subsurface flow in the natural environment. In contrast to industrial settings, the region of flow is unconstrained while flow direction and velocity is likely to be somewhat random. Electromagnetic flowmeters for open channels are reported in [17] showing some success, though the application to underground sensing is more challenging as the region of flow is essentially unbounded. Further, sensing electrodes are likely to be placed within the flow (and non-zero magnetic field) leading to potentially unbounded sensitivity to local flow around the electrode and to details of electrode geometry. Since electrodes will need to be pushed into the ground for subsurface applications, electrode geometry is unlikely to be precisely known. In contrast, almost all analyses of electromagnetic flowmeters assume zero flow at electrodes, for example due to boundary effects [15], so ignore flow at electrodes and also details of electrode geometry. We note that Woolaston’s successful measurement [2] employed electrodes in mud banks, so were in regions of zero flow. We analyze the response of flowmeters to flow at electrodes using a novel dipole form in Section 2, and further discuss this issue in Section 4.3. As noted above, the analysis presented here can be generalized to include all these aspects of underground flow sensing. Practical instrumentation also suffers from interference from unwanted magnetic and electric field coupling, and electro-chemical effects at electrodes (see [17,22] and reference therein). A further potential difficulty is that the conductivity underground may not be spatially homogeneous, so not satisfying the assumptions required for the flowmeter Equation (1) to hold. These last two difficulties are outside the scope of this paper.
This paper is structured as follows: The Neumann Green’s function in the disk is presented and expanded upon in Section 2, that is then developed to give the dipole form of the forward map for EM flowmeters. The relationship to Shercliff’s and Bevir’s weight functions is explained. Section 3 gives details required for discrete approximation of the forward map for computational purposes, then uses the computational form to calculate the singular value decomposition (SVD) of the forward map that displays sensitivities of EM flowmeters to spatial flow distribution. Two computed examples of reconstruction of the spatial flow distribution using a truncated singular value decomposition (TSVD) are presented in Section 4, with a discussion of some implications of the results in Section 4.3. Finally, conclusions are given in Section 5.
2. Neumann Green’s Function and Dipole Kernel for EM Flowmeters
In this section, we define and give the Neumann Green’s function for the Laplacian in the unit disk . This allows the solution of the flowmeter Equation (1) using Equation (2) for general flow in circular pipes. We go on to develop a dipole form of the forward map, and show its relationship to the weight functions given by Shercliff [11] and Bevir [15], in the restricted setting of axial flow.
The Neumann Green’s function, also known as Neumann’s function, is the Green’s function for the Laplacian on D with Neumann boundary conditions in , i.e.,
It is well known that the solution of Neumann boundary value problem (BVP) (7) is not unique; however, it is unique up to an additive constant, or, equivalently, the statement of a reference potential. We will require , i.e., the average potential on the boundary is zero. The fulfillment of the following condition, corresponding to conservation of current
is a necessary and sufficient for the existence of a solution to this problem [14,23]. Necessity follows by an application of the divergence theorem to the boundary value problem (BVP) (7), while sufficiency follows by construction of the solution, as follows.
The Neumann Green’s function for the unit disk D has the explicit form [23,24]
where is the inverse point of with respect to the unit disk, and satisfies the following properties, that may be established by direct calculation [12,13,24].
- 1.
- , .
- 2.
- , .
- 3.
- is harmonic in .
- 4.
- is harmonic in D, .
- 5.
- on , .
- 6.
- , .
The second property, i.e., self-adjointness of the (real) Neumann Green’s function, is often called reciprocity in physics. Property 4 shows that is a fundamental solution of the form (3).
The Neumann Green’s function allows the solution of the Neumann BVP (7) via a simplified form of Equation (2) stated in the following Lemma [23].
Lemma 2.
Remark 1.
When flow occurs in an electrically insulating pipe then on and the boundary integral in (9) is omitted.
Remark 2.
Unbounded regions may also be treated using the Neumann Green’s function and the solution in (9), such as when implementing an EM flowmeter in the natural environment. Formally, one can take the radius of the disk D to be very large so the inverse point in (9) tends to ∞ and the Neumann Green’s function reduces to the free-space fundamental solution with reference potential at ‘the point at’ ∞, as desired.
In Figure 1, the measurement is the difference in the potentials measured at the two electrode locations, and . Using (9), a theoretical measurement, i.e., without any measurement errors, for this geometry is given by
where the second equality uses integration by parts and Shercliff’s assumption that on . Comparing this with (4), we see that Shercliff’s weight function W is the (scaled) y-gradient of the difference of Neumann Green’s functions.
Bevir’s formulation [15,16] allowed more general flow profiles and placement of electrodes, with the theoretical measurement that is the difference of potentials at electrodes at and . Then, Equation (9) gives
where the second equality uses the divergence theorem and the assumption that on , and the third equality follows from application of the scalar triple product. Comparing this with Equations (5) and (6), we see that , i.e., the gradient of the difference of Neumann Green’s functions. This result is clear when one considers that the Neumann Green’s function is the potential in the region due to unit current source at with insulating boundary conditions, current is the gradient of potential, and reciprocity equates the form to current injection at electrodes. That is, Bevir’s weight function is the cross product of the magnetic field with the gradient of the difference of Neumann Green’s functions.
The calculations leading to Equations (10) and (11) suggest a generalization of both Shercliff’s and Bevir’s analysis that also does not bias the forward map towards any specific reference point, while acknowledging that only potential differences are measurable. In particular we evaluate measurement at a single boundary electrode given by Equation (9) with as in Remark 1. Using vector identities to shift the divergence off the source term, , (9) with can be written as
Since is the dipole distribution with moment [13], the first term describes the potential generated from dipolar source distribution in the domain D, and the second describes the potential due to current source distribution on the boundary. We refer to Equation (12) as the dipole form of the forward map, in contrast to Equation (9) where the flowmeter source term appears at a distribution of monopole sources in the domain D.
The dipole form allows us to gain an intuitive understanding of the spatial sensitivity of flowmeters, and the extreme, infinite sensitivity to flow near electrodes. As dipolar sources have magnitude proportional to , all of the near a measurement will contribute significantly more than the sources distant. Thus, any source within one eighth of the radius from an electrode will contribute four times more than a source half a radius away, and 16 times more than a source in the center of the domain, and so on. When is perpendicular to the direction to an electrode, that component of the flow contributes zero to the potential at the electrode.
An application of separation of variables for harmonic functions in the domain D allows an easy route to determining the length scale in the axial direction required for the 2-dimensional approximation to be accurate [24]. For separated functions, the z solution is a decaying exponential
where is set by the smallest positive zero of . Thus, the slowest decaying exponential reaches the mark at . Therefore, the 2-dimensional flowmeter approximation is appropriate if the fluid velocity and magnetic field are approximately constant in z up to a distance equal to the diameter of the pipe away from the 2-dimensional plane being considered.
For computational purposes, it is convenient to use the form of the forward map that is equivalent to Equation (11). Using vector identities again to shift the divergence off the term , (2) becomes
For realistic fluids in a pipe we can also make the same assumption as earlier work of no shear at boundaries so that , a feature of the boundary layer effect. This eliminates the second term in (14). When , and , this becomes:
For simplicity of examples we assume that the magnetic field is only in the y-direction, though the theory in this paper is easily extendable to include the x-component. We then define the function as a generalized “flow”, that we use in the following section.
3. Computing and the Singular Value Decomposition
For computational purposes it is necessary to form a discrete approximation to the Green’s function and Equation (14). We begin by partitioning the circular region into approximately equal-area cells. This is performed with a regular partition of radius r into m equal sub-intervals, followed by regular partitions in angle for each sub-interval of r, starting with n sub-intervals in for the central disc, then a partition to sub-intervals in for the next ring out, and so on. All but the inner-most sub-interval in r contains cells, where is the sub-interval number. The area of cell k is
which tends towards , the area of a centre division. A similar polar grid was used in [21] to define a resistor network discretization of the disk, equivalent to a finite element method discretization, that was used to for solve Laplace’s equation and reproduce Shircliff’s weight function shown in Figure 1.
Flow f is discretized as piece-wise constant in each cell occupying region a. Using subscript to denote the value in cell with centre at , each term in (15) has the discrete form
The map from flow to potential is therefore written as a matrix equation
The elements of can be resolved individually by Gaussian quadrature, with
It is worth noting that there is a point of difference between this work and much of existing literature in the field. Many EM flowmeter papers examine a specific shape of the magnetic field and focus on what that implies for measurements of the fluid’s velocity. This approach fits with Bevir’s weight function. We, however, are combining the velocity and magnetic field into a single entity. In practice, the magnetic field will be reasonably well known and the velocity is, thus, inferable.
The singular value decomposition (SVD) provides an orthonormal basis for and that diagonalizes the map A. Hence the SVD gives us a coordinate system for the measurement process such that individual components in flow are mapped to individual components in potential, with a scalar multiplier that is the singular value. Because these basis vectors are normalized, the singular values are exactly the sensitivity of measurements to that specific vector. Mathematically, for the th singular vectors
where is the corresponding singular value.
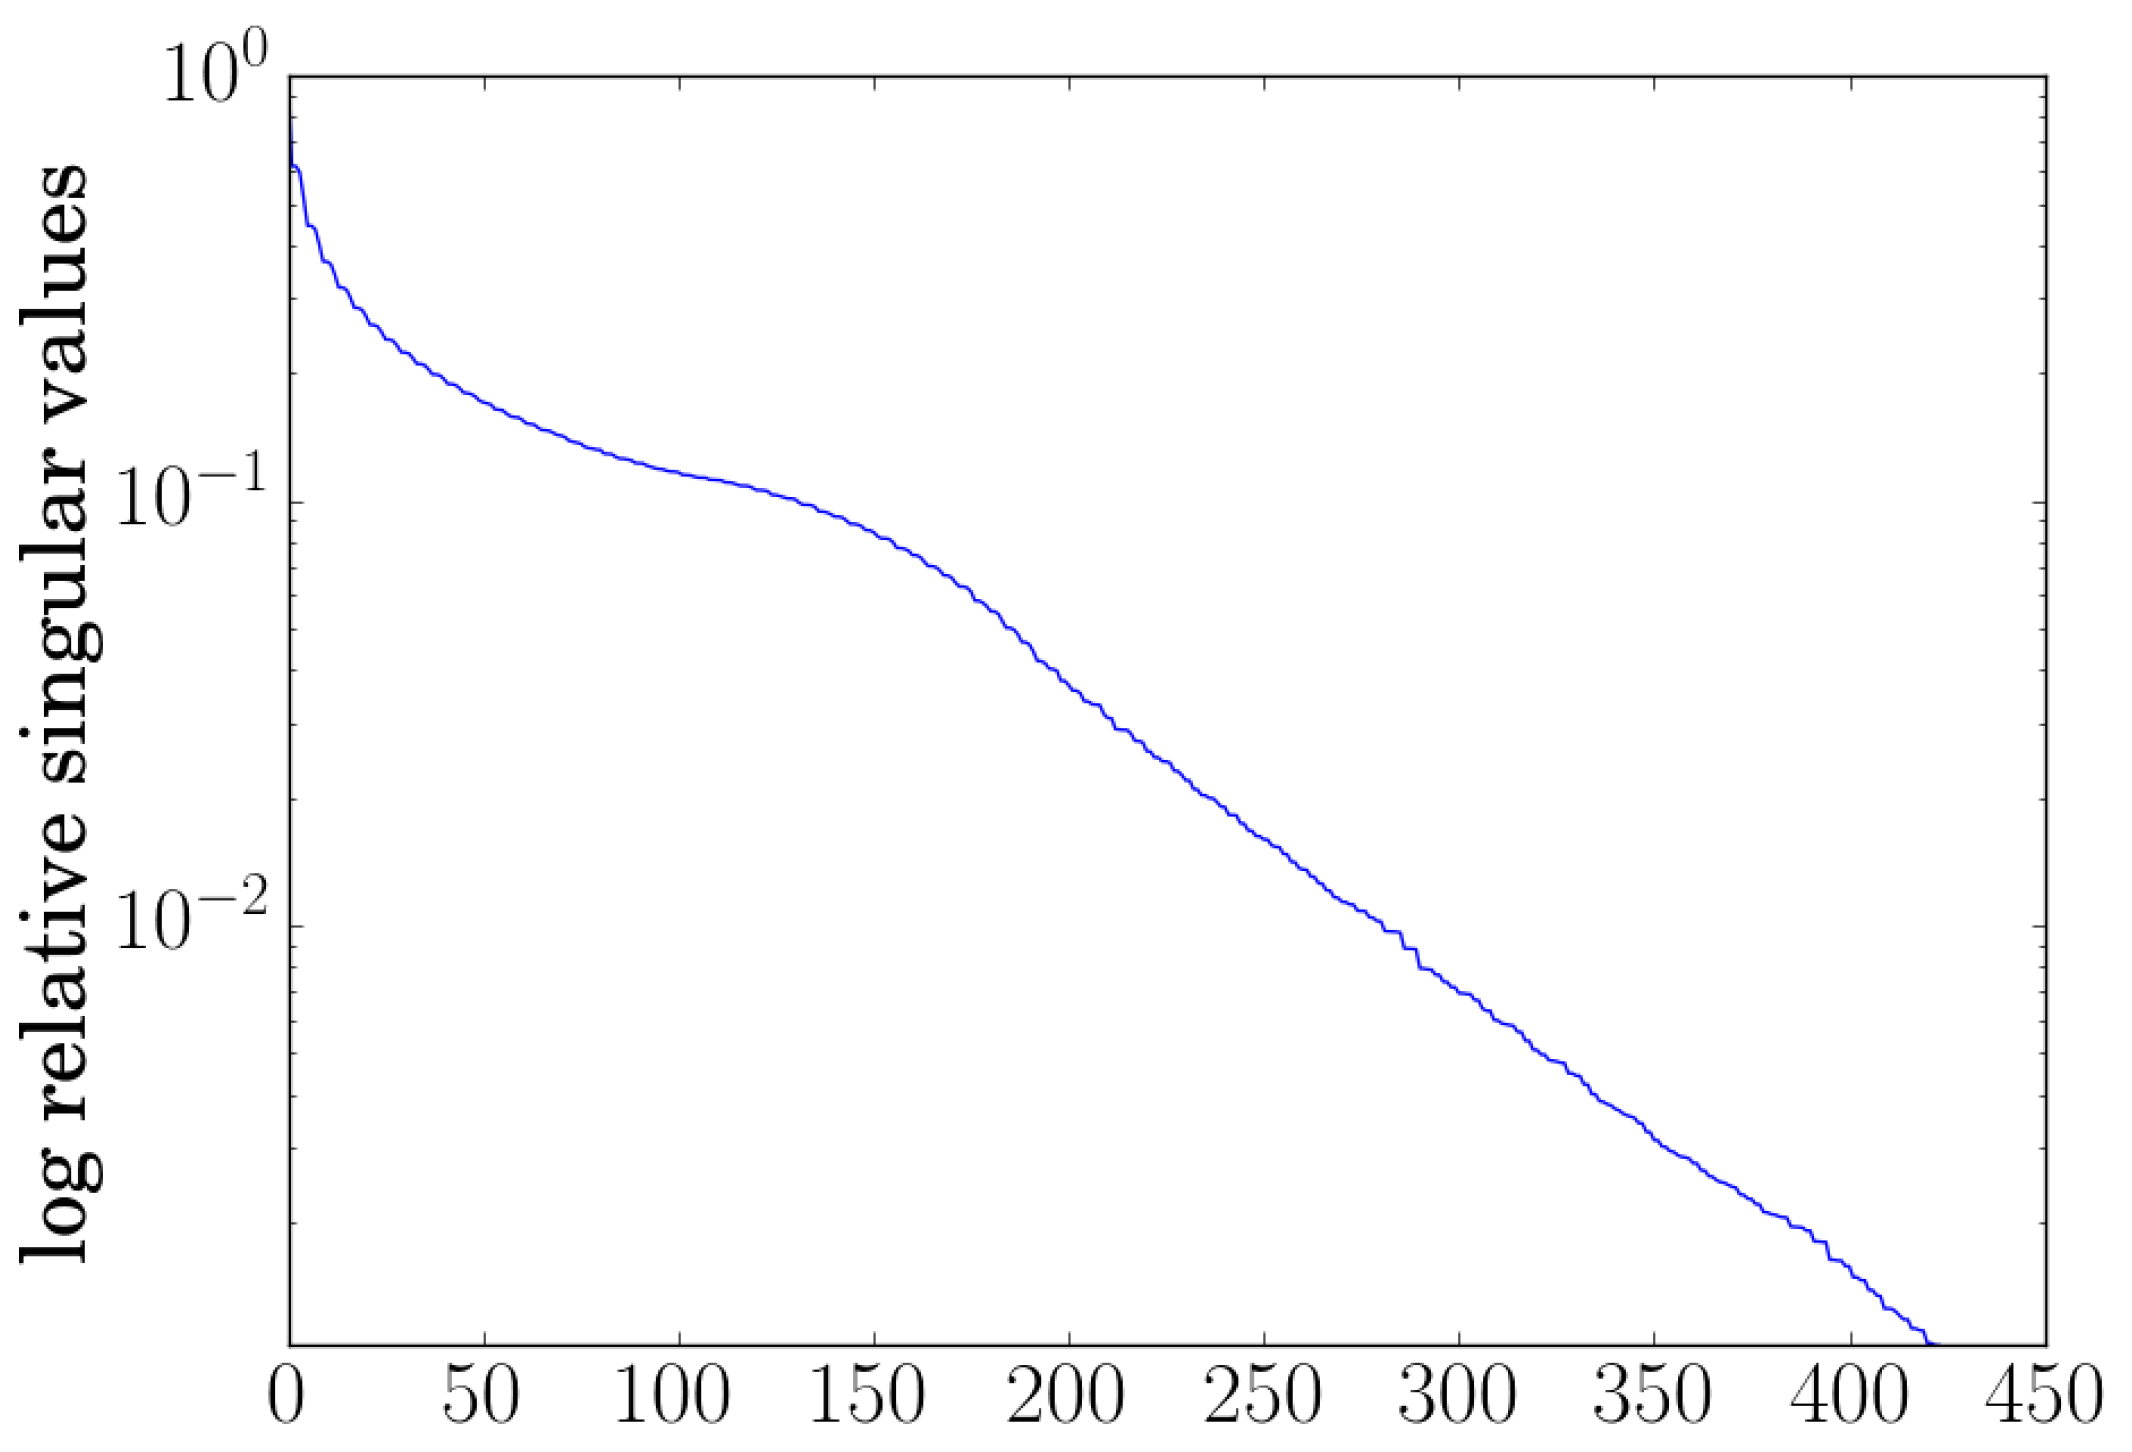
By approximating the continuous system by a large number of measurement points and a fine discretization of functions, the number of singular vales above the signal to noise ratio (SNR) is an estimate of the number of pieces of information that can be extracted from the system through this measurement process. Figure 2 shows the singular values of this zero-mean measurement flowmeter setup. There are many pieces of information to be gained from this system, with over 100 singular values above of the maximum value.
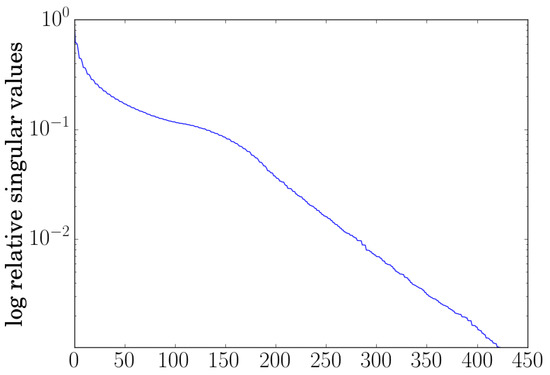
Figure 2.
Scaled singular values, relative to the largest, versus singular value index.
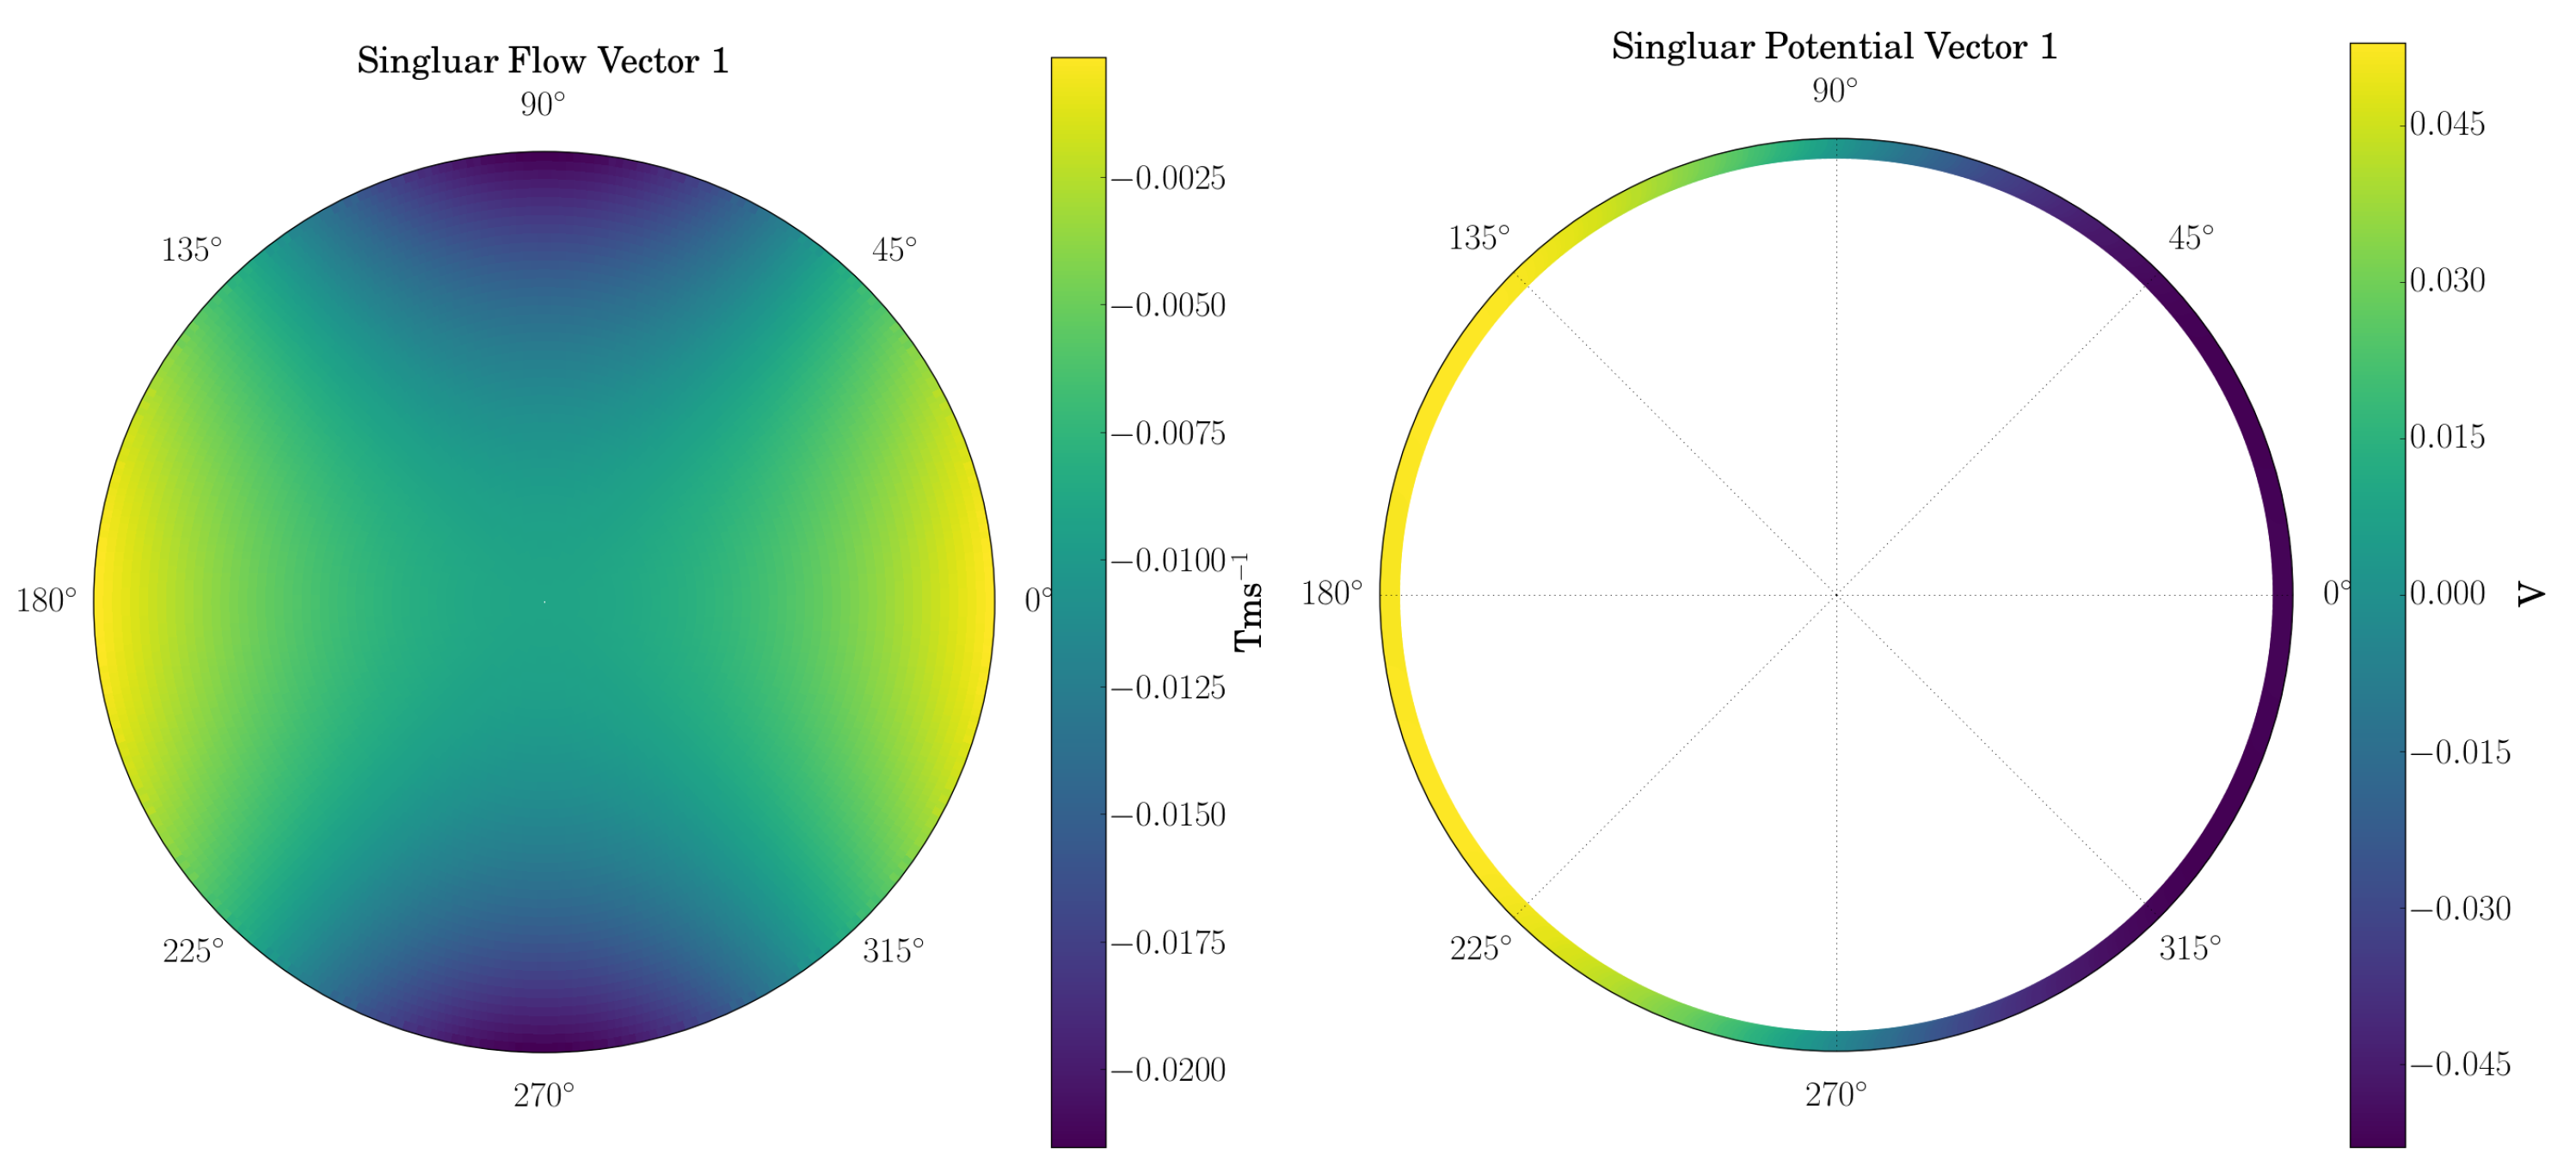
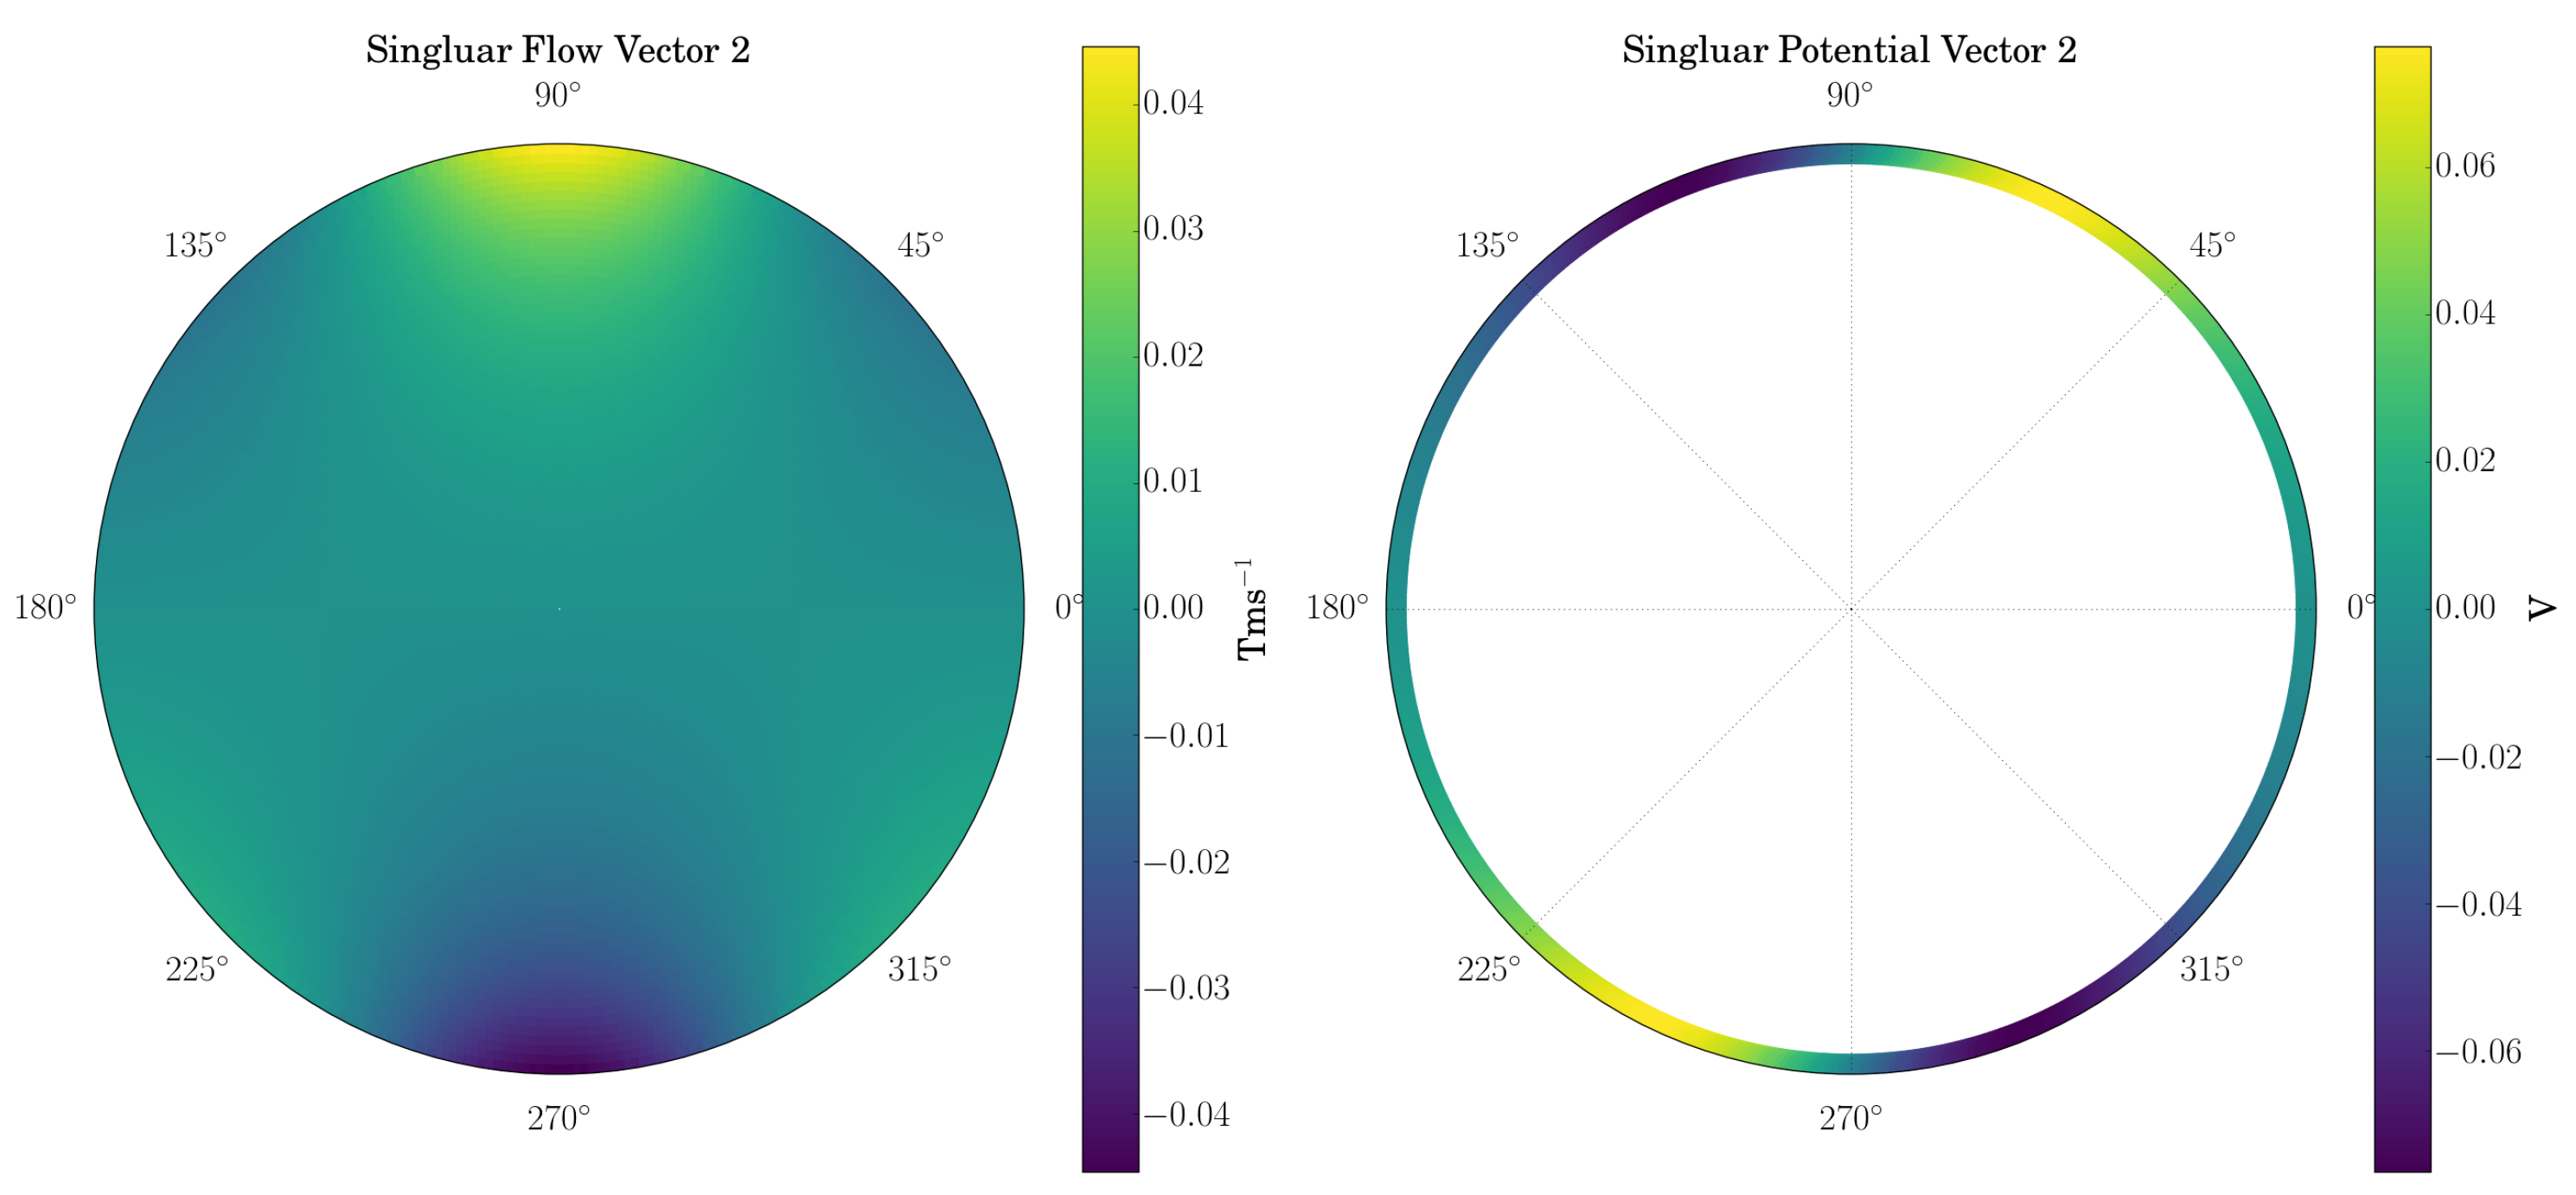
The first two singular vectors in both flow- and measurement-space are shown in Figure 3 and Figure 4. While there are many flow profiles that this measurement process is sensitive to, as Figure 2 leads us to believe, actually the only singular flow vector in the first 200 with flow not significantly tending towards zero away from the boundary is the first (Figure 3 left). The rest of the singular flow vectors are similar to Figure 4, with an increasing number of peaks and troughs along the boundary and rapid decay away from the boundary. Thus, most of the information about spatial variation in the flow that can be extracted from the system is fine detail located near the boundary of the pipe.
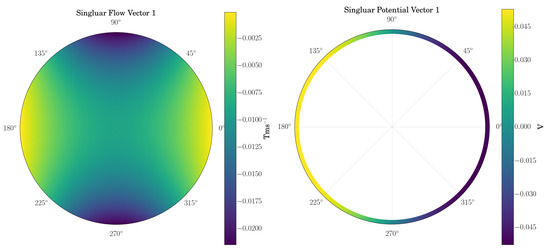
Figure 3.
First singular vectors, for flow (left) and boundary potential (right).
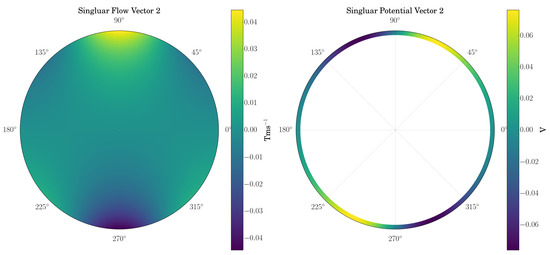
Figure 4.
Second singular vectors, for flow (left) and boundary potential (right).
These observations are consistent with the early results of [5,6]. The dominant contribution to a measurement is the flow component Figure 3 left, which is closely related to the total flow across the pipe. A simple measurement, such as a single potential difference between and would correlate strongest to this and therefore be sufficient for an estimate of the flow rate, after some calibration.
4. Reconstruction of Flow
As previously mentioned, the SVD can be very useful for sensitivity analysis as the relative sizes of singular values can be compared with a SNR, such as the peak signal to mean noise ratio. If the SNR is known for the measurement process, then all singular vectors with singular values lower than the SNR are indistinguishable from noise. Thus, the measurement can be projected onto a truncated basis containing all singular vectors distinguishable from noise. This allows for a simple kind of regularization as the singular vectors from measurement-space and state-space map to one another. For a given measurement and the cut-off point of the th singular vector, the estimated state of the system is
where and are the th measurement- and state-space singular vectors, and denotes an inner product. The singular vectors and values are ordered in monotonically decreasing order of , and k is the cut off point dictated by the SNR. This regularization is called the truncated singular value decomposition (TSVD).
4.1. Uniform Flow
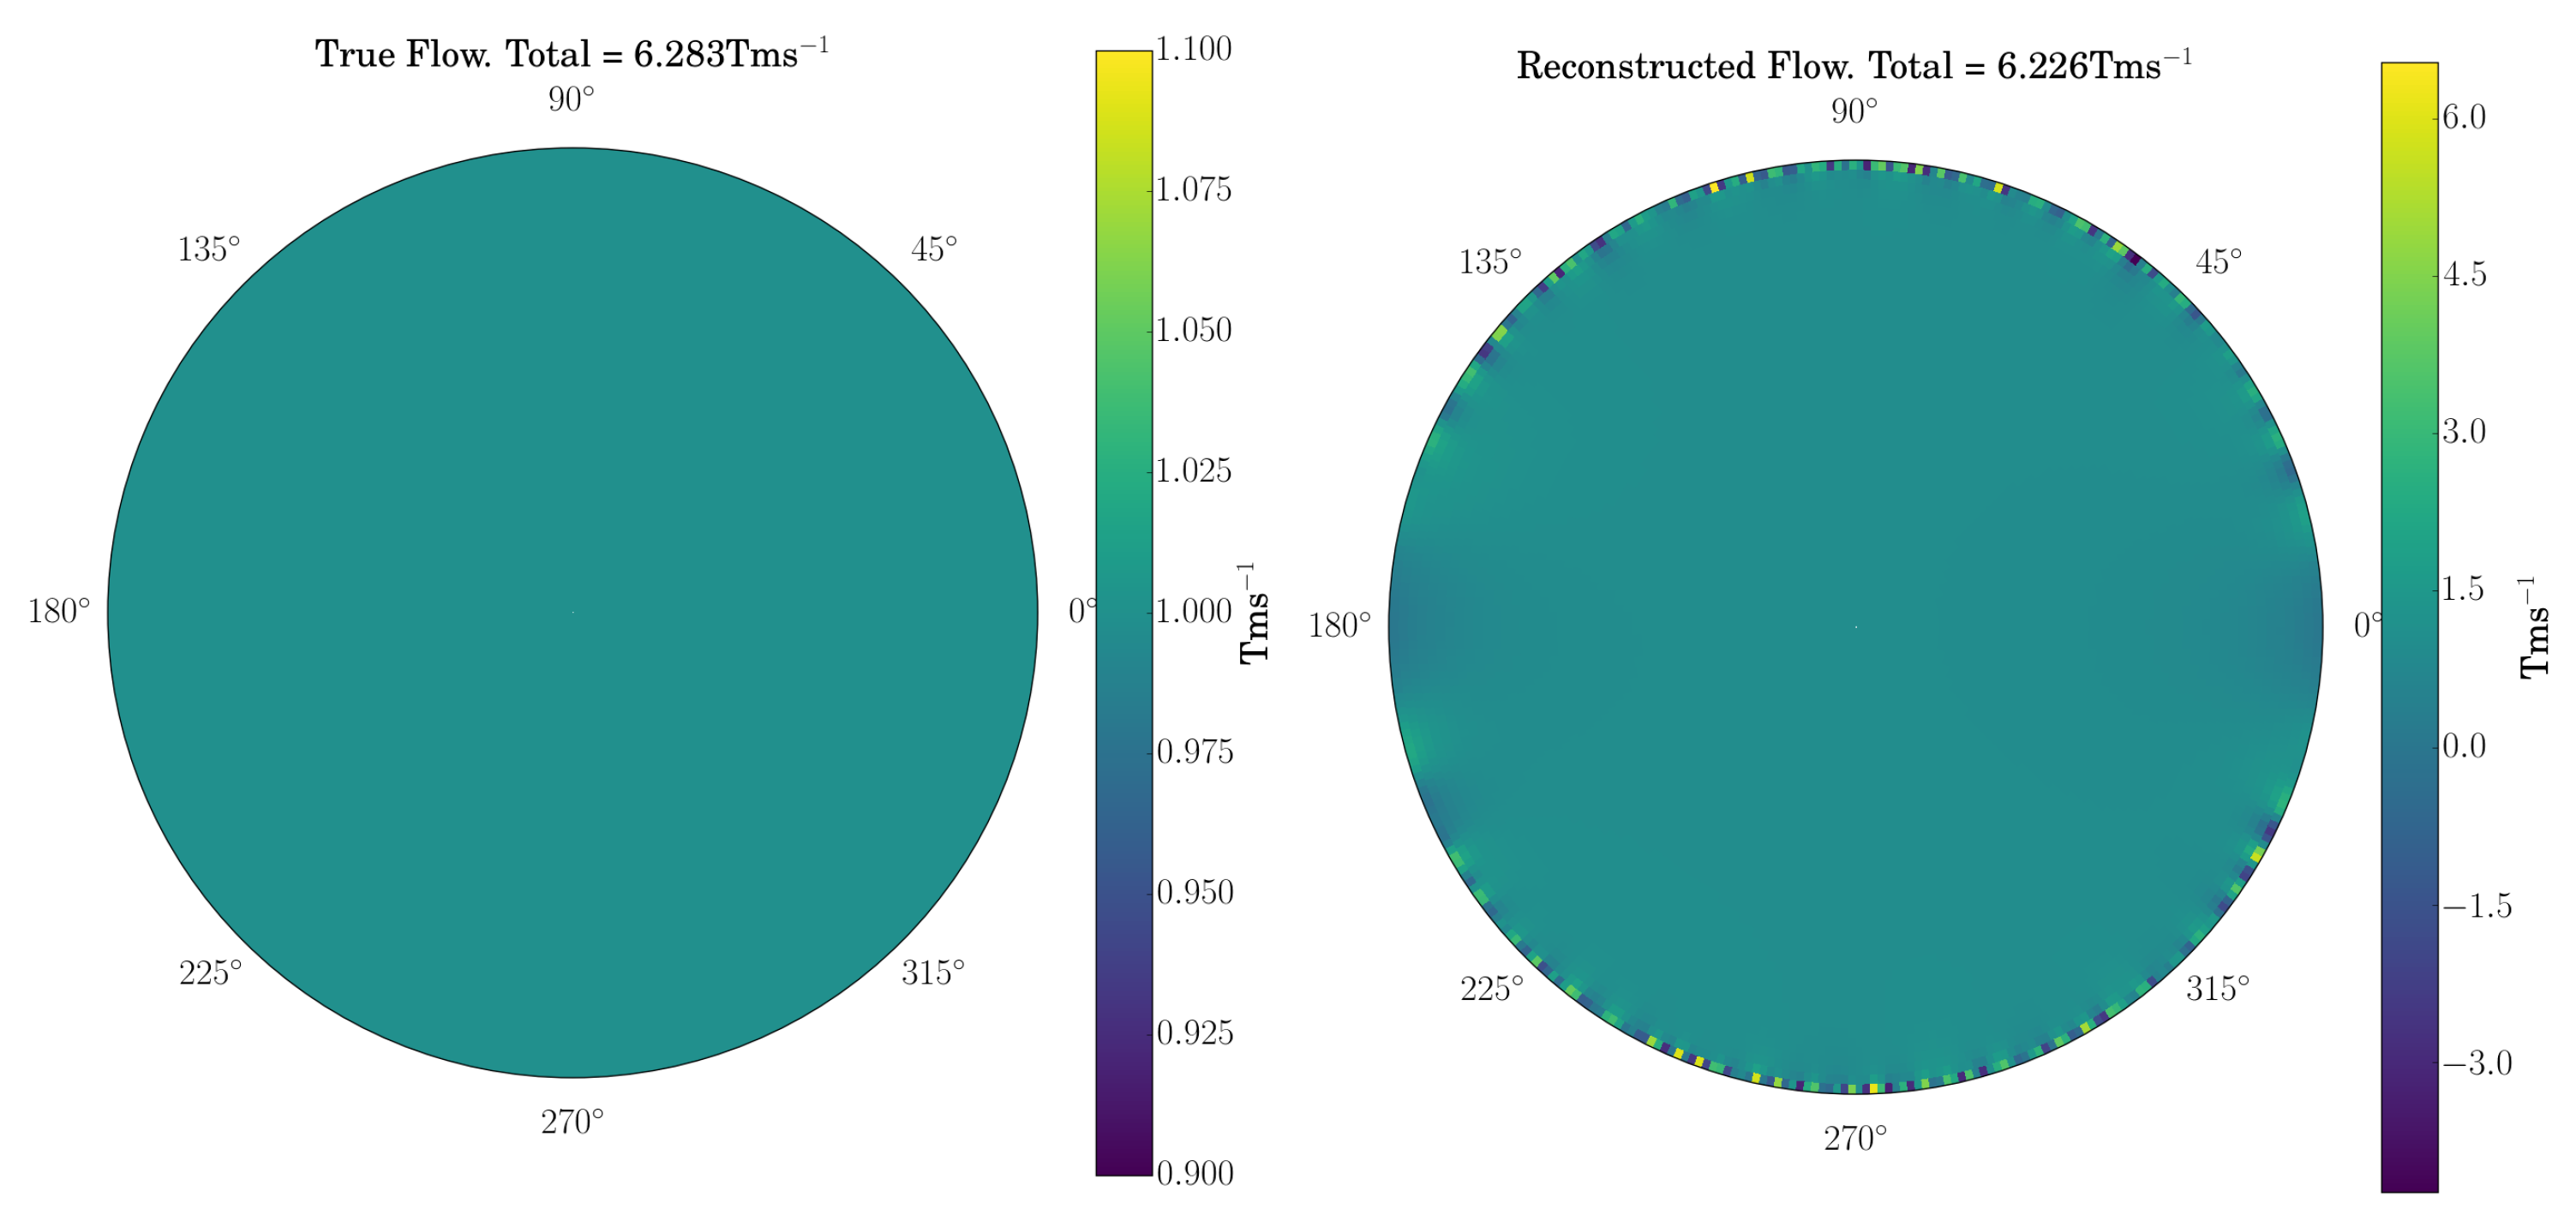
Figure 5 left is of uniform flow in the pipe section with a total, integrated flow rate of 6.283 Tms, corresponding to a point-wise flow of 1 Tms, for some constant T. A measurement is simulated by passing this through the forward map then adding iid, zero-mean Gaussian noise such that the peak signal to mean noise SNR is 20. This measurement is then projected onto the singular vector basis, truncated at , by (21). The result being Figure 5 right, with an estimated total flow rate of 6.226 Tms. The TSVD can be seen to produce peaks and troughs near the boundary, with large negative and positive values; this is an example of Gibb’s phenomenon [25].
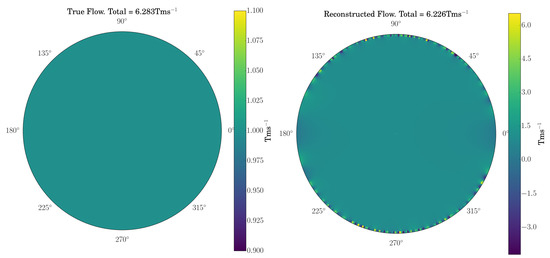
Figure 5.
The true uniform flow profile (left) and the TSVD reconstructed flow profile (right).
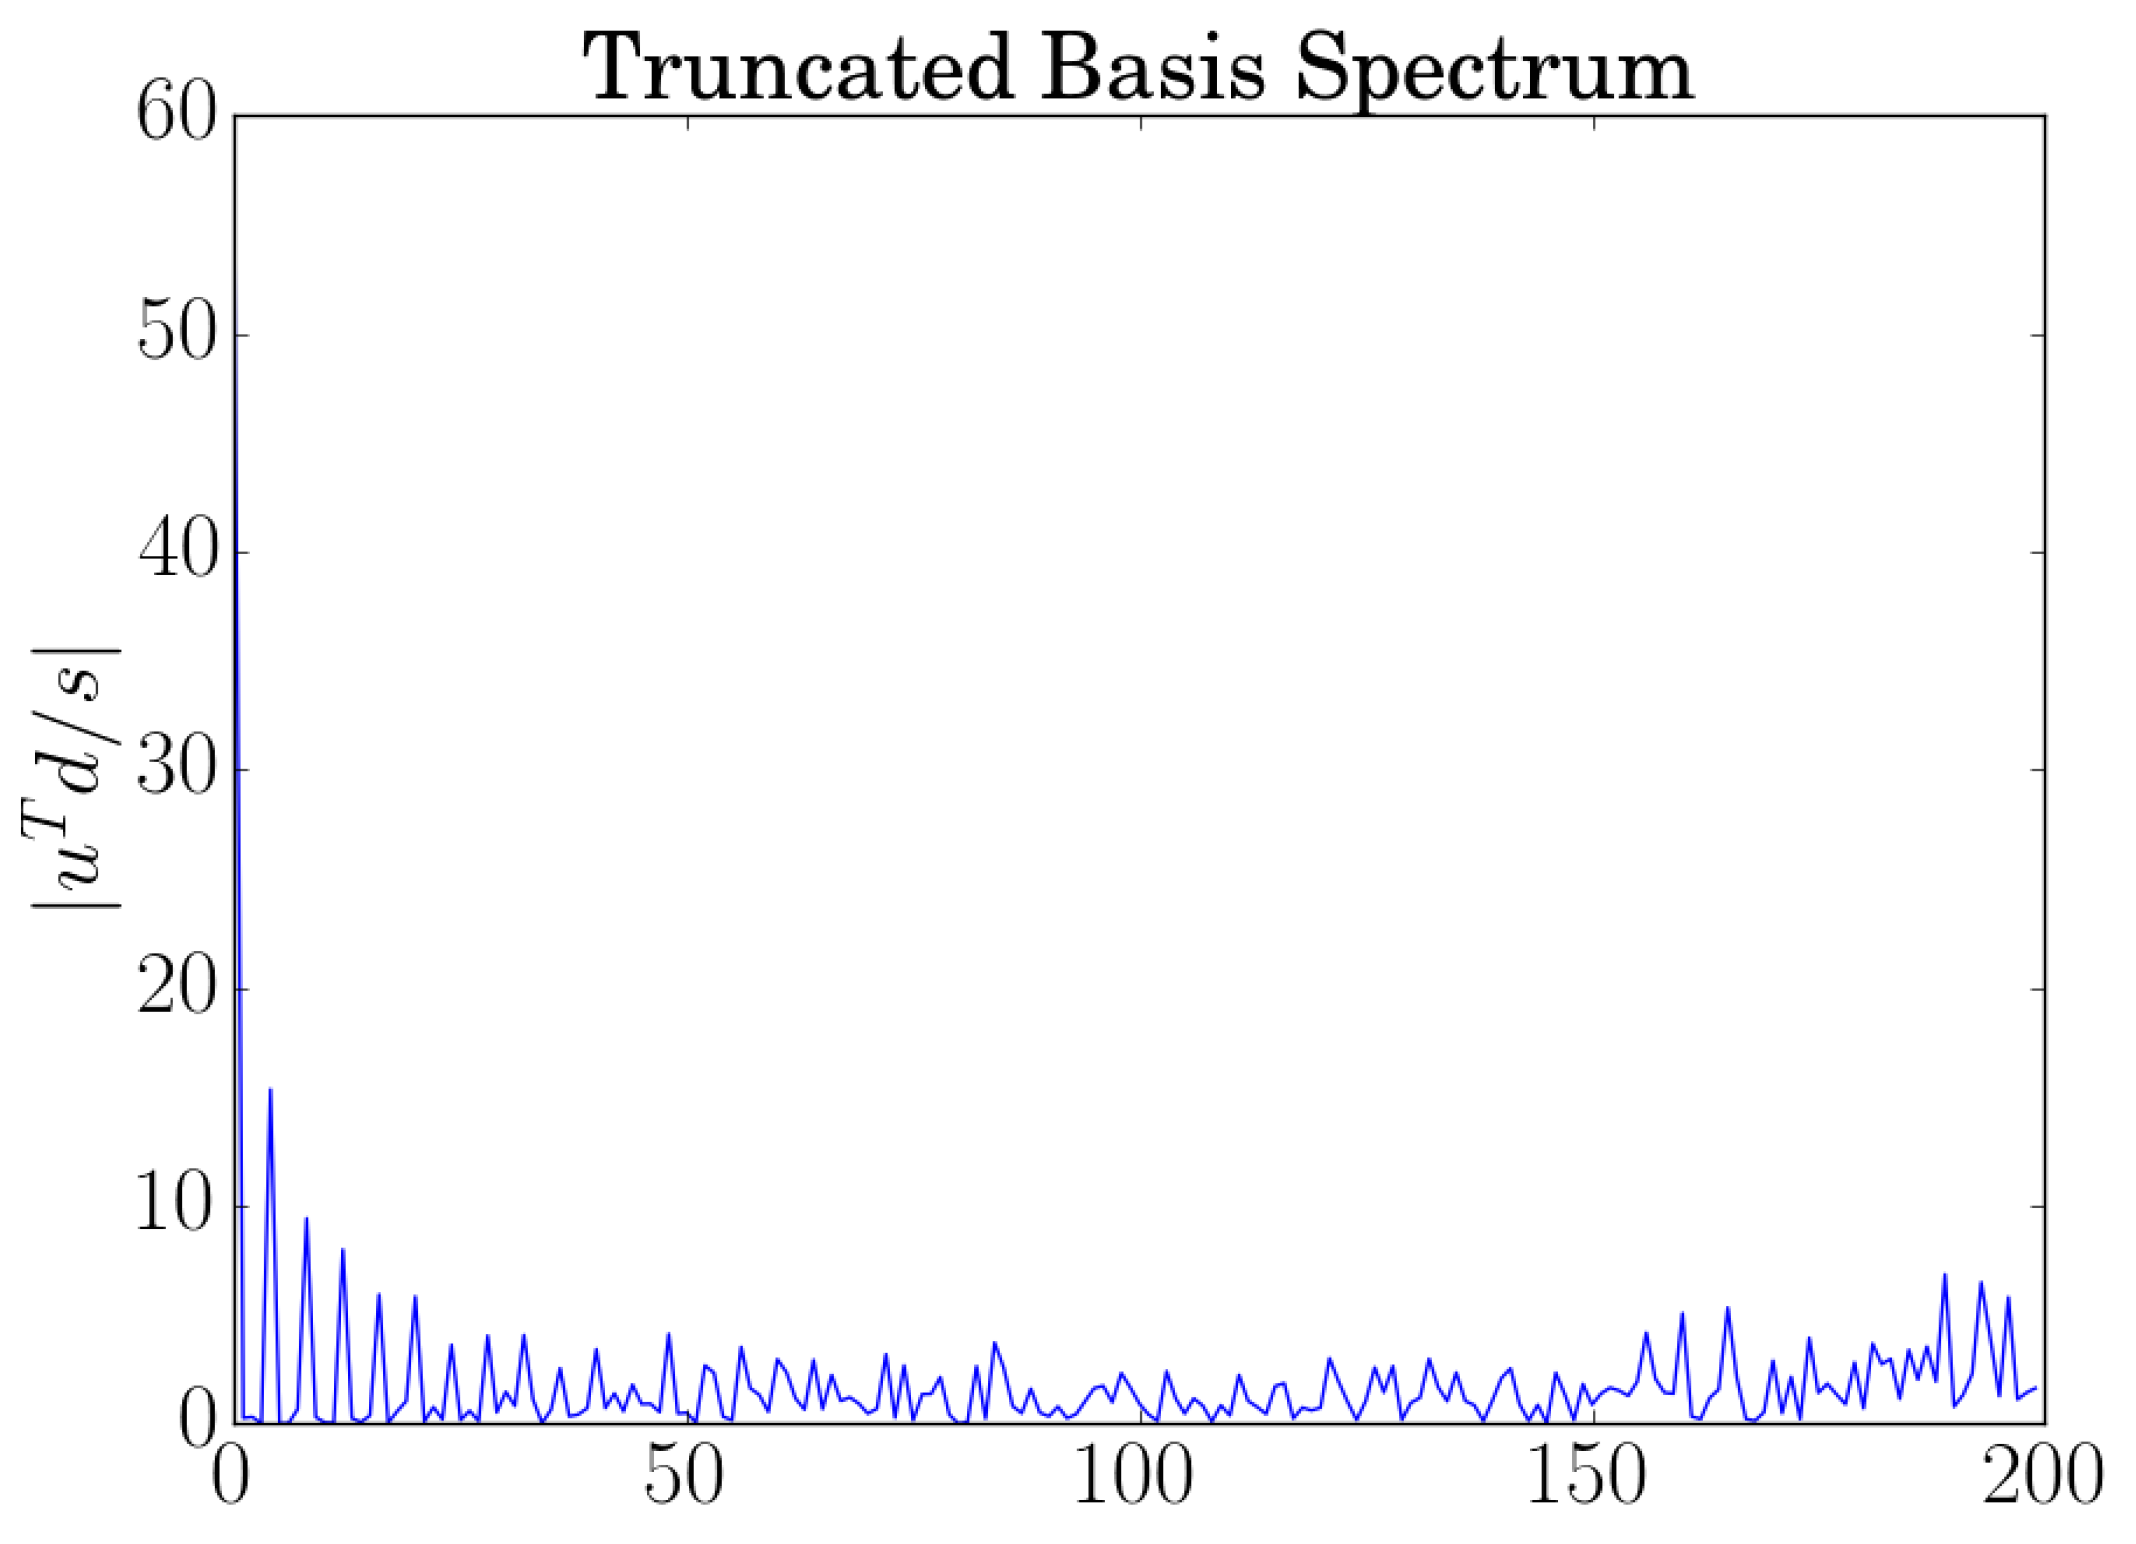
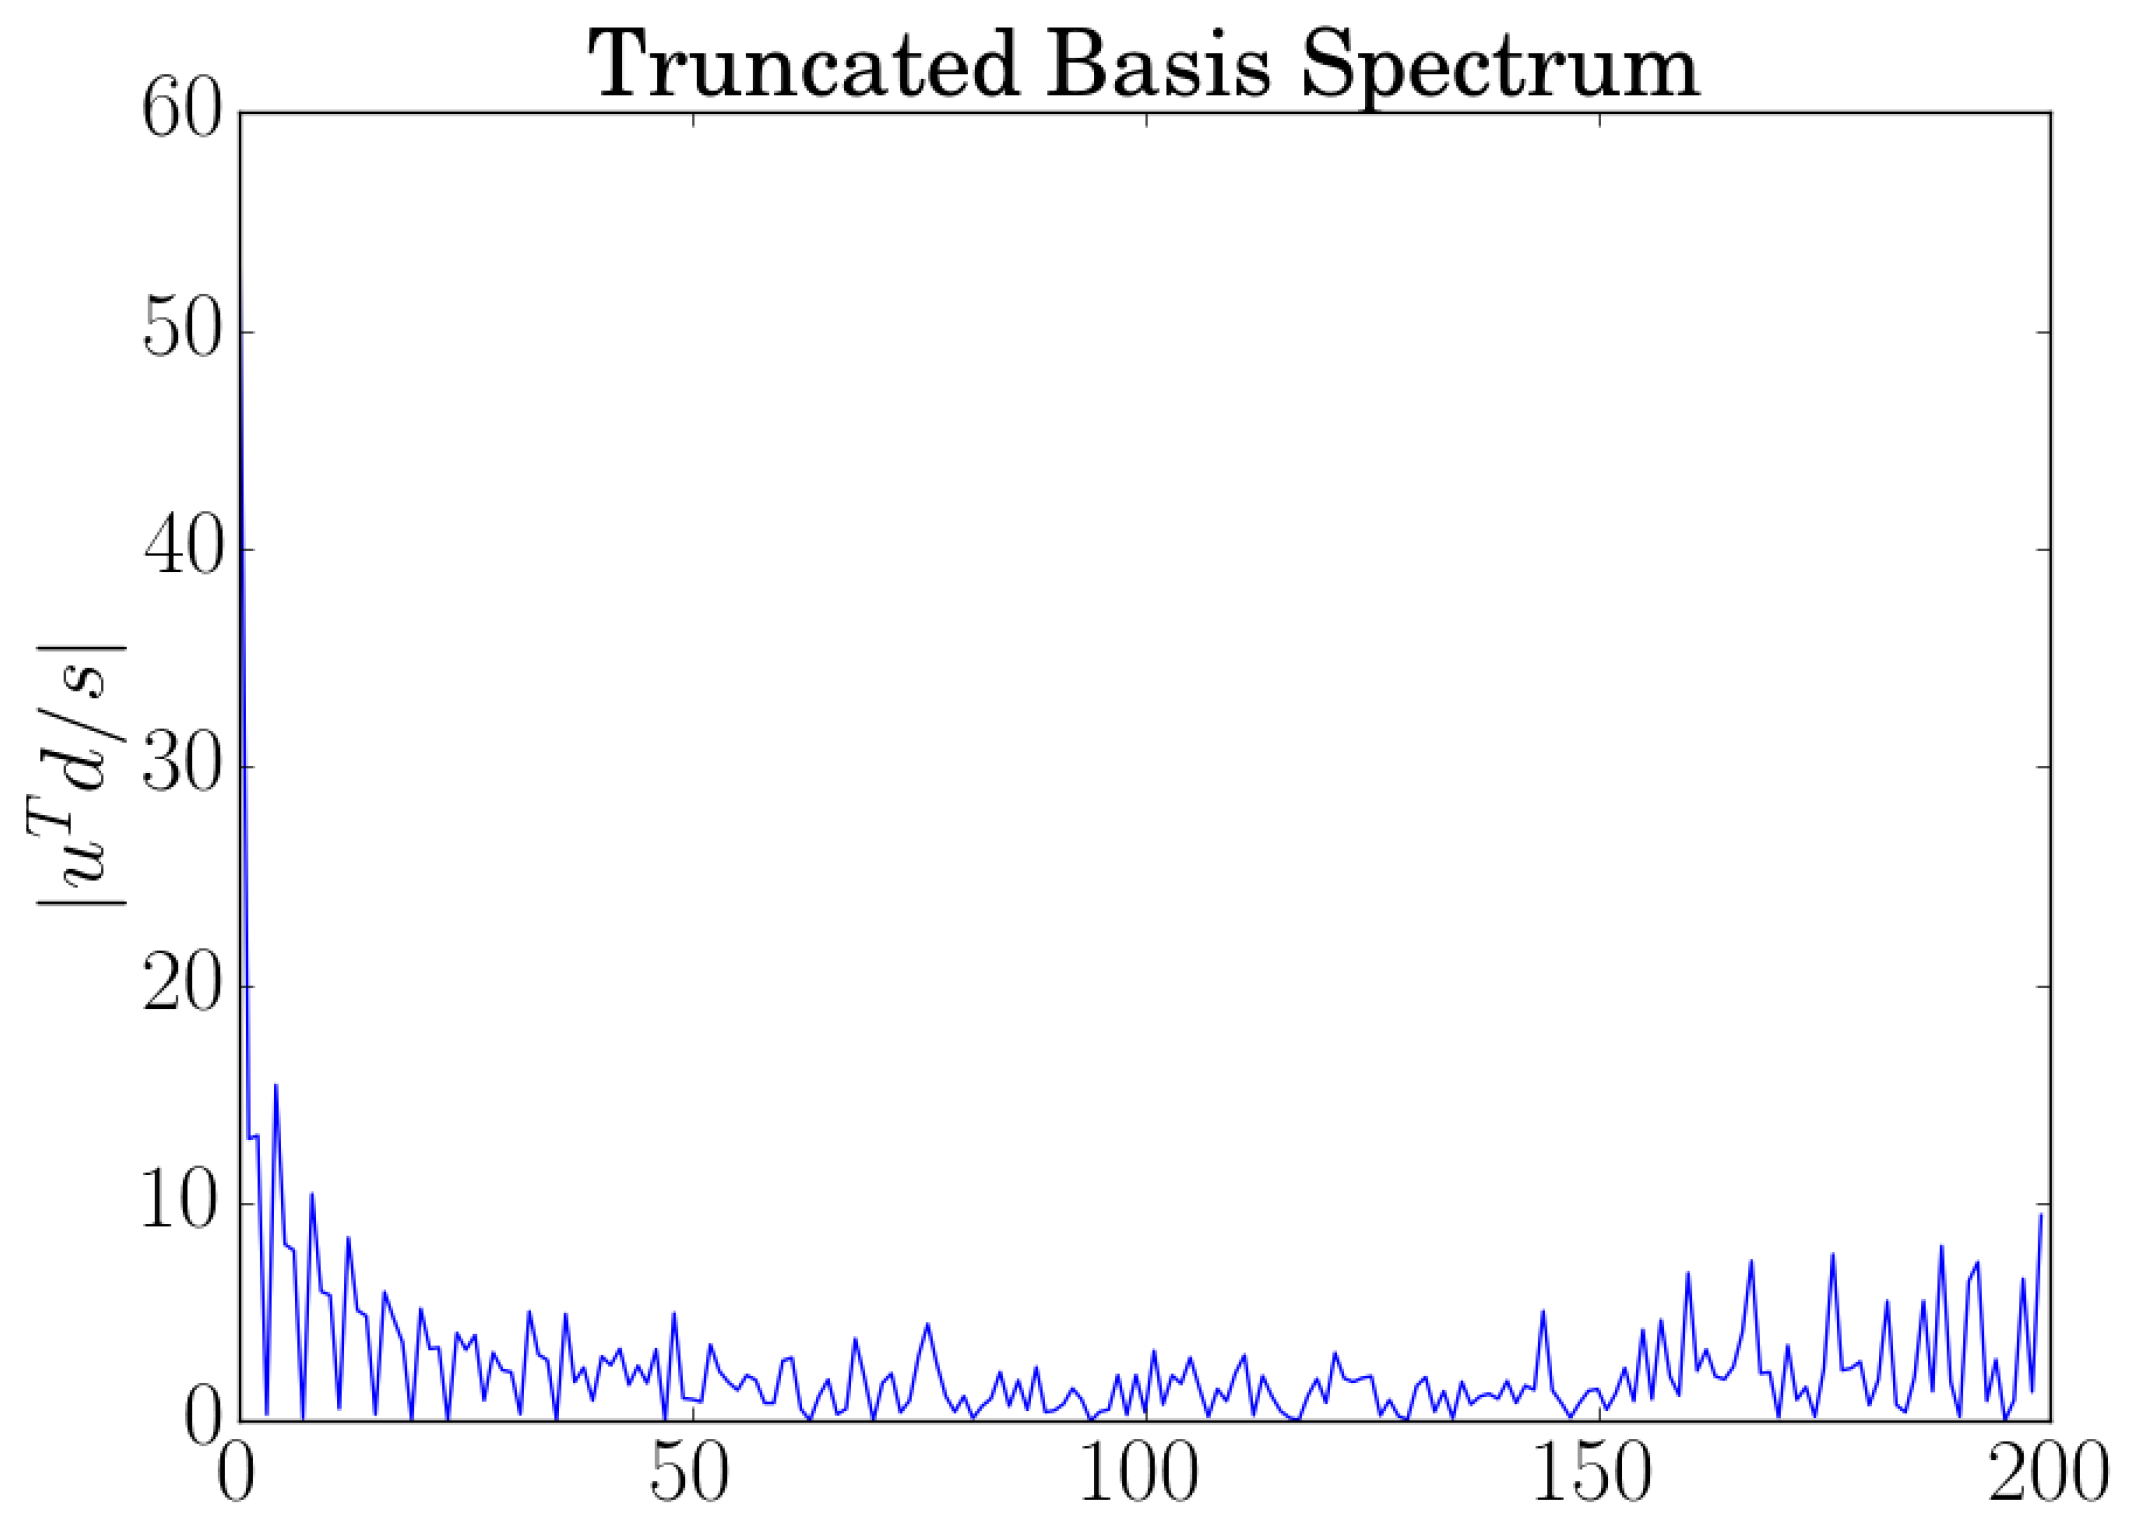
Figure 6 shows the spectrum produced by taking the inner product with the truncated basis and the measurement and it shows the proportion of each singular vector that Figure 5 right contains. A point of focus for later discussion is how few non-negligible components of the projection are in the first 50 singular vectors.
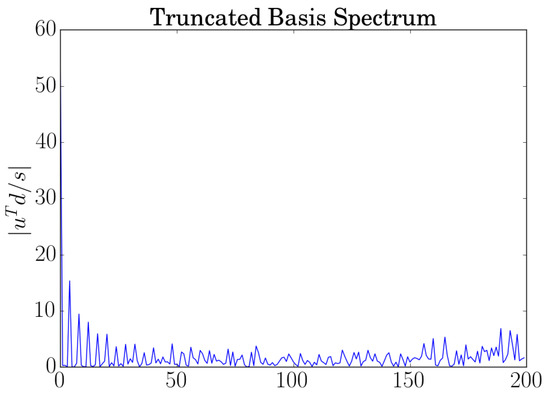
Figure 6.
The truncated basis spectrum of the reconstructed flow in Figure 5 right, as a function of index.
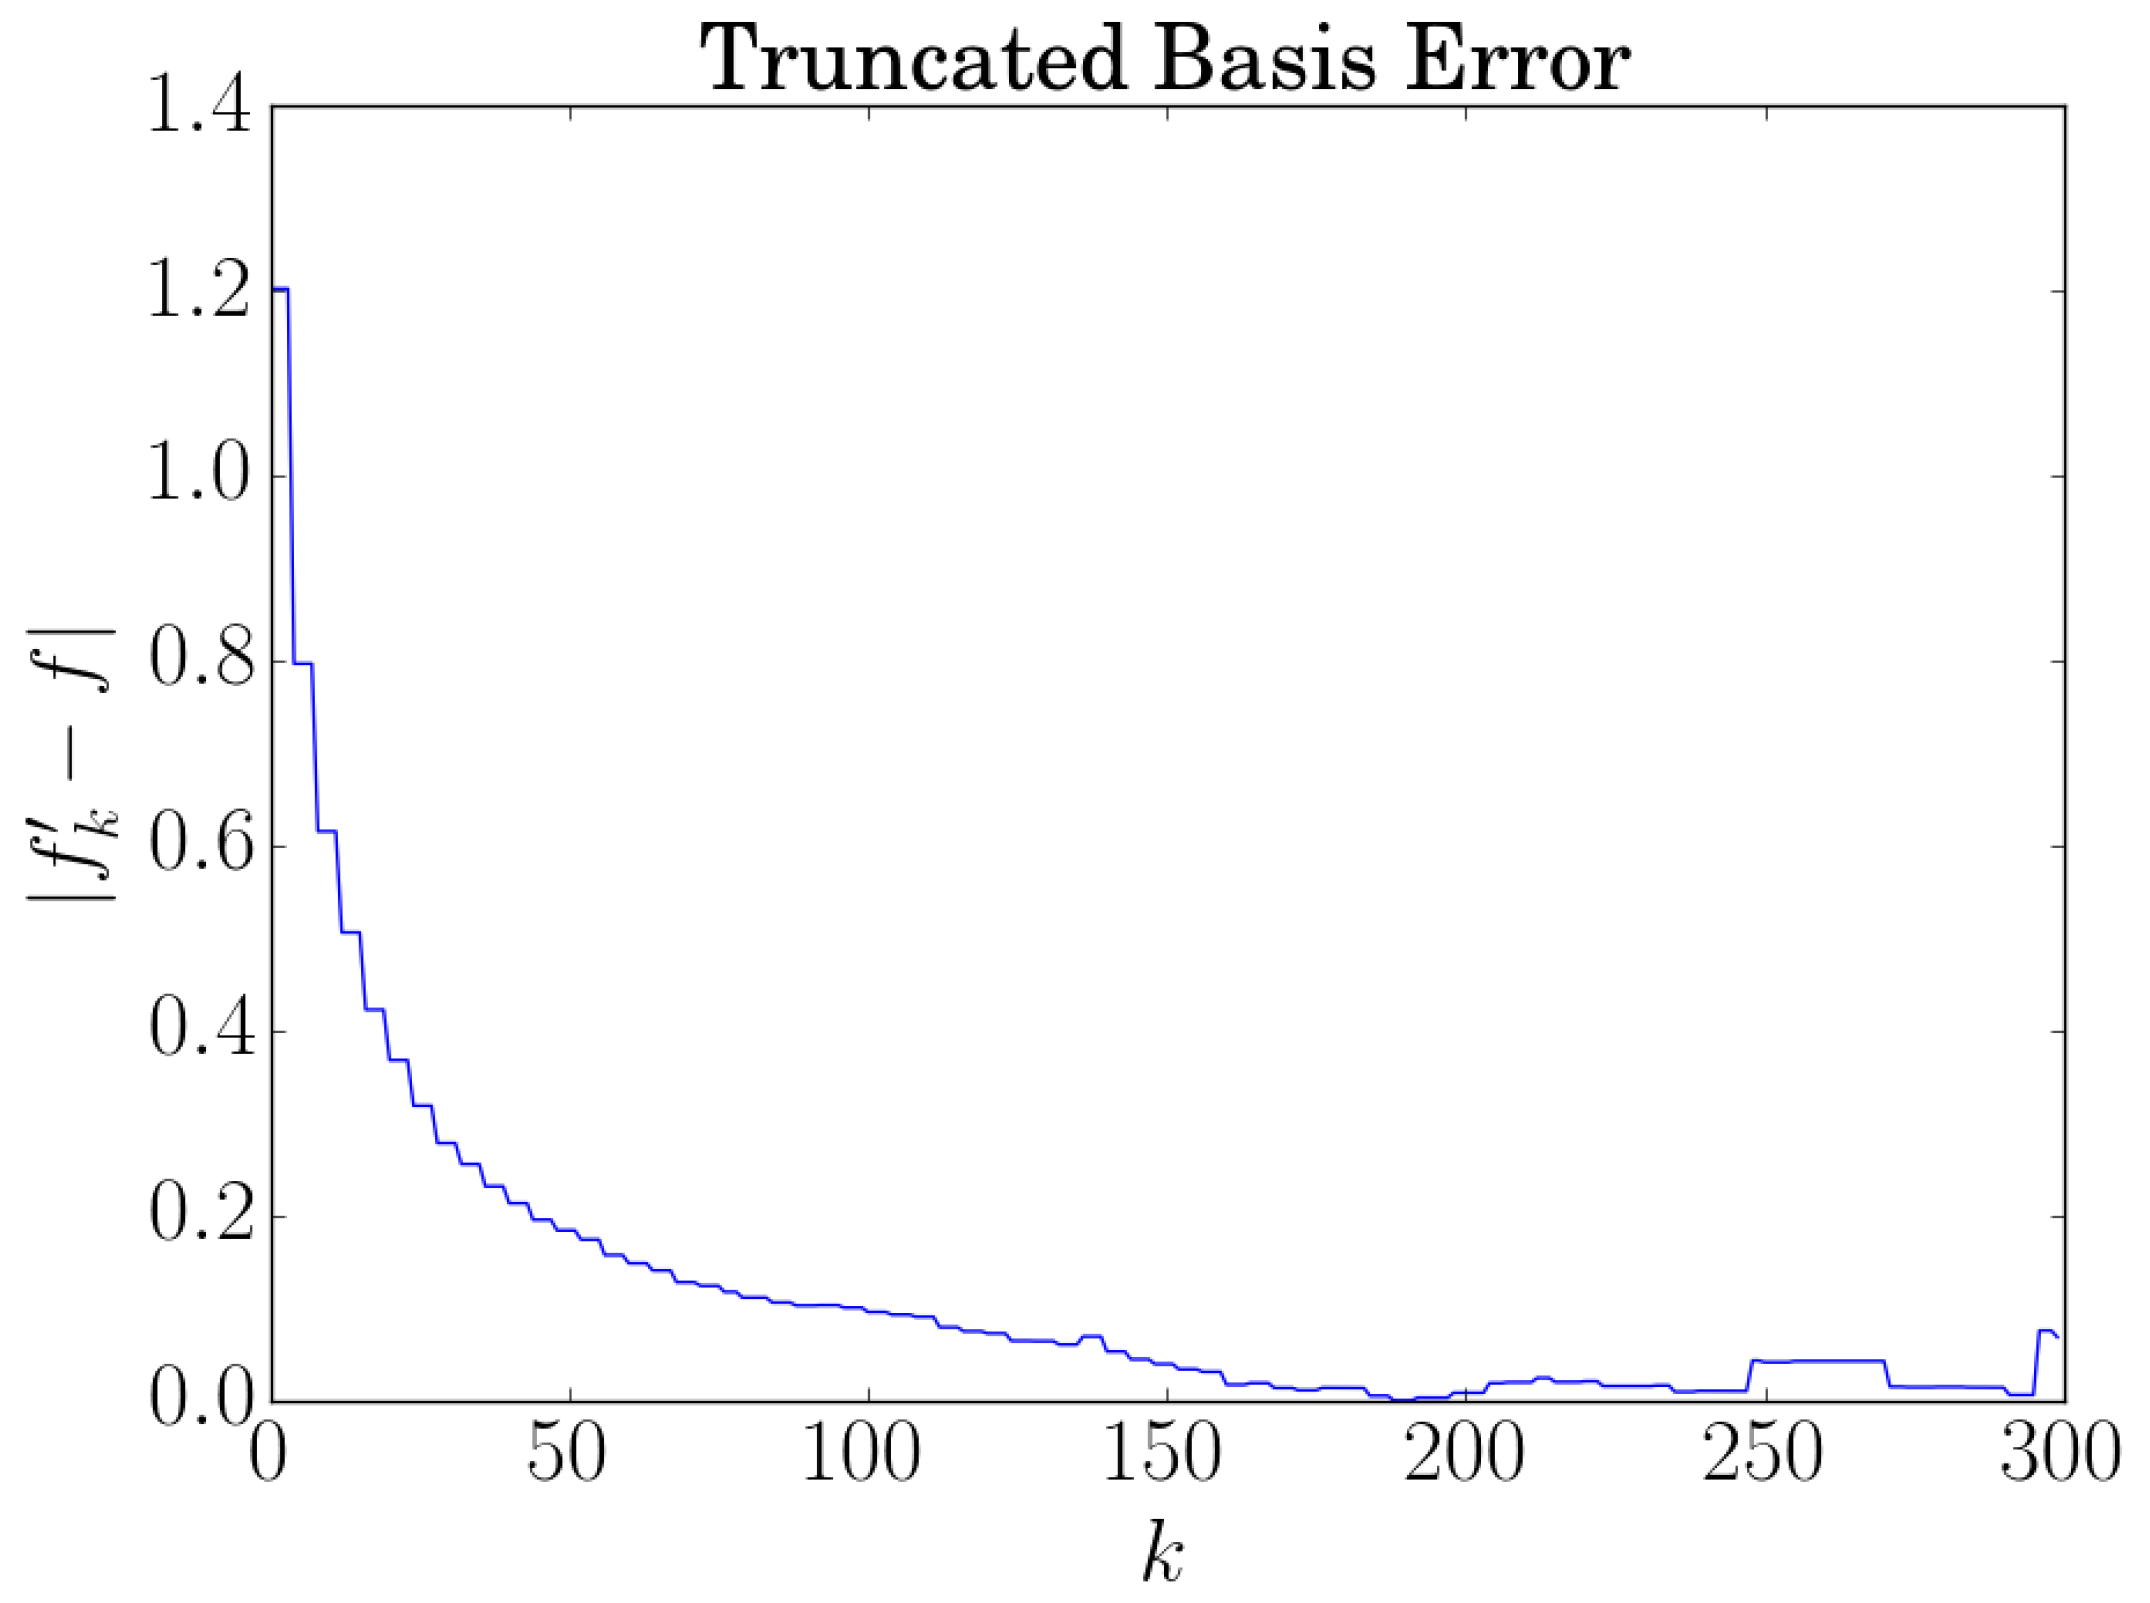
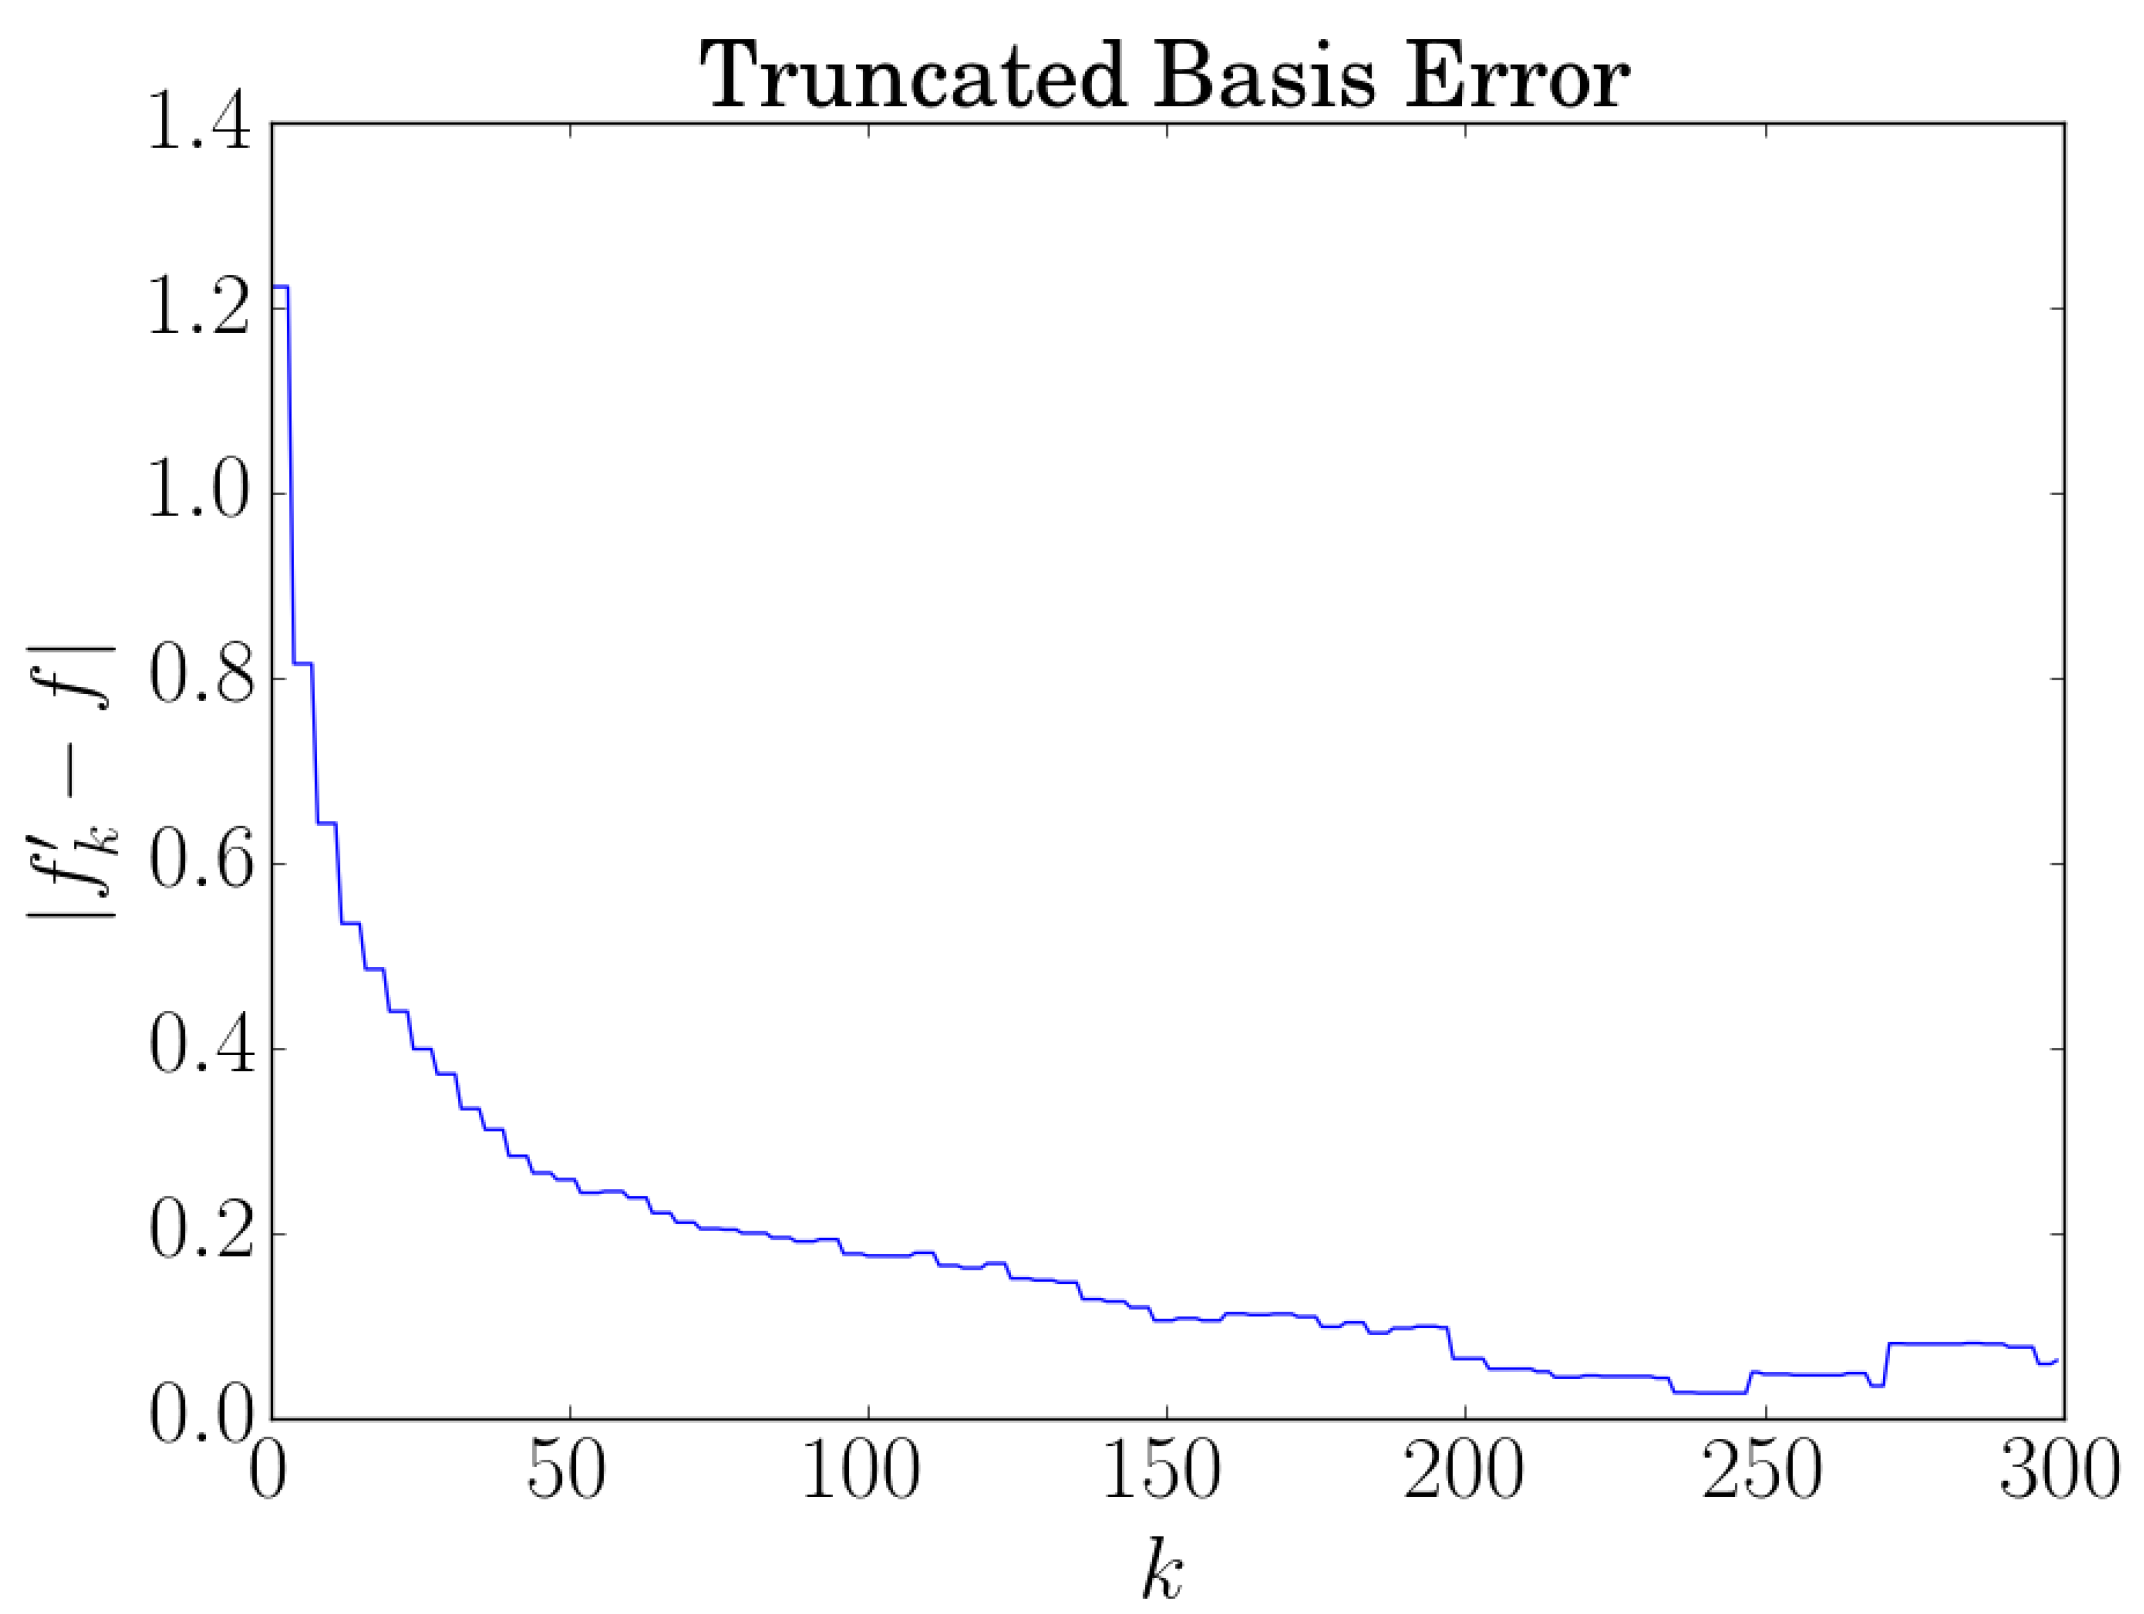
Finally, Figure 7 is a plot of the absolute difference in total flow between the true and reconstructed flow as k increases. There is a region from where the error is low. As k is taken beyond 300 the error quickly grows beyond the scale of this plot and was therefore omitted.
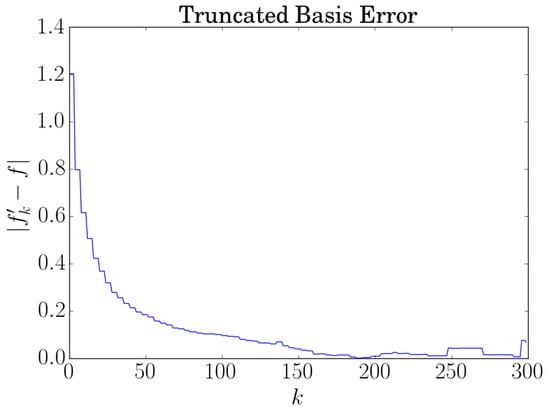
Figure 7.
Absolute total flow error between the uniform flow and the reconstructed flow for different cut-off k.
4.2. Shear Flow
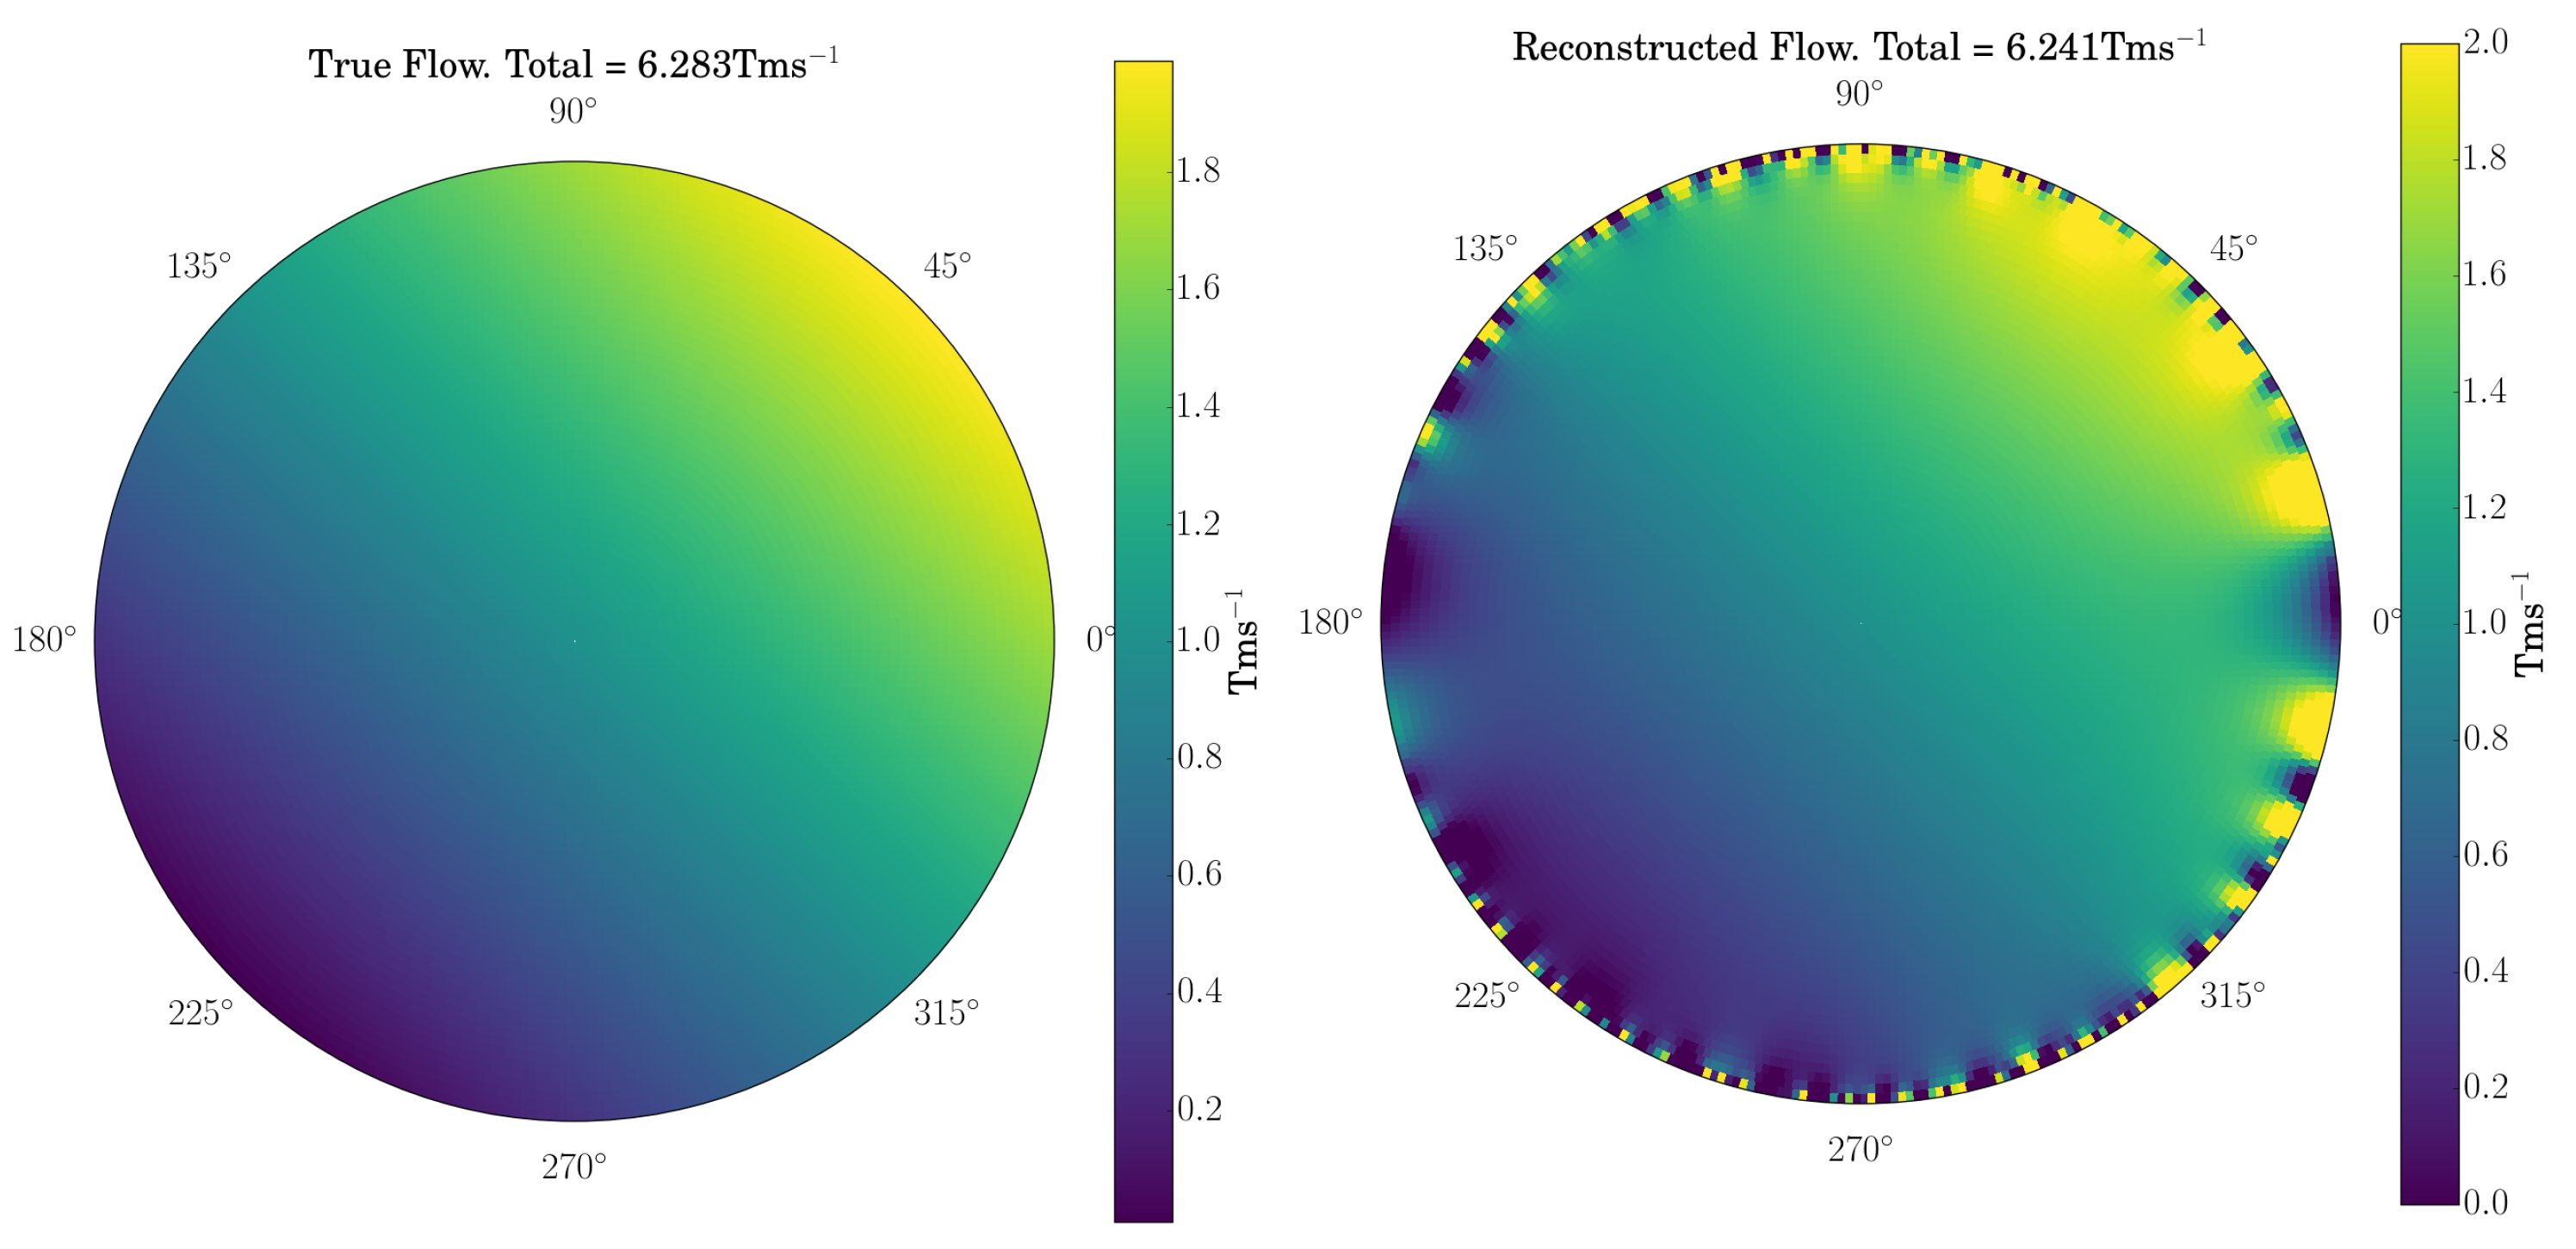
Figure 8 left is of a linear shear flow profile in the pipe as one might find in stratified flow [26]. As before, a measurement is simulated with additive iid, zero-mean Gaussian noise with a SNR of 20, and so on. The resultant reconstruction is displayed in Figure 8 right with an estimated flow rate of 6.241 Tms, compared to the true flow rate of 6.283 Tms. The scale has been clipped to match that of Figure 8 left, showing that the linear shear exists in the reconstruction. Once again there is Gibb’s phenomenon evident at the boundary.
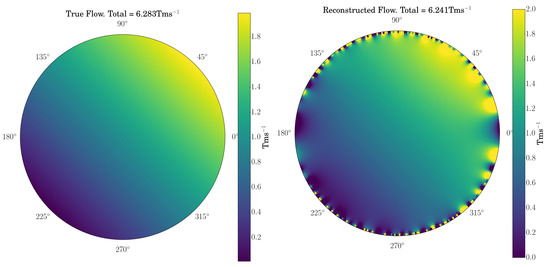
Figure 8.
The true shear flow profile (left) and the TSVD reconstructed flow profile (right).
Once again, Figure 9 is the truncated basis spectrum of the reconstruction and Figure 10 the absolute difference in total flow between the true and reconstructed flow as k increases. The plot is limited to for the same reason as before.
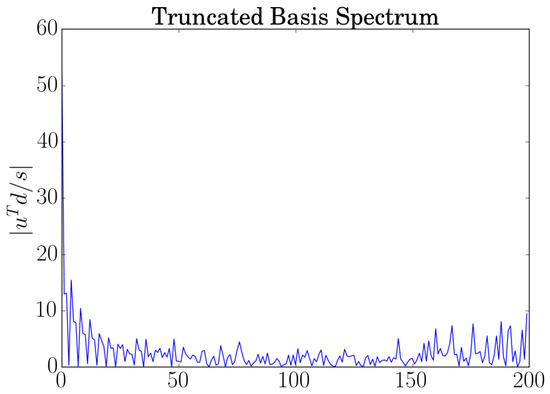
Figure 9.
The truncated basis spectrum of the reconstructed flow (Figure 8 right).
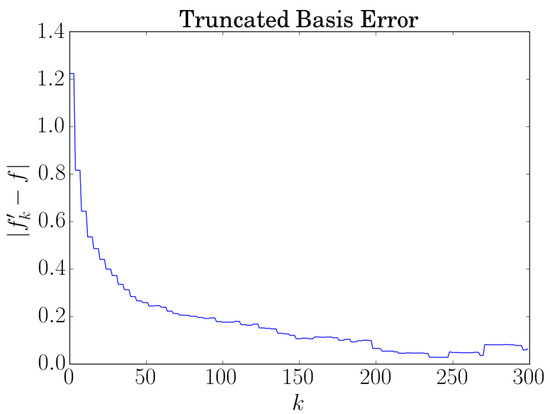
Figure 10.
Absolute total flow error between the shear flow and the reconstructed flow for different k.
4.3. Discussion
Numerical approximation allows the calculation of the singular value decomposition (SVD) of the forward map, for axial flow and constant field. The resulting singular vectors in flow show the flow distributions that complete measurement of boundary potential is sensitive to, with relative sensitivity set by the relative size of the associated singular values [24]. This analysis provides a theoretical limit to flowmeters, and establishes the extent to which they have the capability to image the spatial flow distribution at a given SNR. We find that the geometry analyzed provides a dominant singular vector of flow that has appreciable sensitivity to bulk flow, while the remaining singular vectors have increasing sensitivity only near the boundary.
The examples presented in the paper show that flowmeters can be used to reconstruct the spatial flow distribution using a TSVD. This method provides a simple kind of regularization that maps singular vectors from measurement-space to flow-space. Examples of flow tomography use a truncated singular value reconstruction, which enables reconstruction of the flow field, though with noticeable truncation error near the boundary due to Gibb’s phenomenon.
Applying the SVD to the 2-dimensional flowmeter has not been performed to the authors’ knowledge and provides new insights to the sensitivities of the system. While these results show that there are theoretically many pieces of information detectable in the flowmeter system, the vast majority of that information is at the edge of the pipe. This means that, if one were, say, interested in detecting the change in the flow profile near the edge of the pipe, then a flowmeter with many electrodes would be very useful. This is evident in previous works using Shercliff’s weight function in Figure 1, where the weight function increases in magnitude closer to the electrode positions. As most flowmeter arrangements have the electrodes around the edge, there must be increased sensitivity to flow changes near the edges.
For the case computed in the examples, of 2-dimensional reconstruction of axial flow in a circular pipe with constant field, we found that around 150 singular vectors needed to be included in the TSVD to achieve an accurate (within 1%) estimate of bulk flow when no assumptions are made on the distribution of axial flow. Accordingly, more than 150 measurements of boundary potential would be required to make such a reconstruction, and estimate of bulk flow, which seems an excessively large number. It therefore seems desirable to increase the sensitivity of EM flowmeters to flow away from the boundary, or, equivalently reduce sensitivity to flow near the boundary. Since the Neumann Green’s function in Equation (14) is fixed by geometry and the Ohmic properties of the fluid, this therefore requires reducing the term near the boundary. The non-shear boundary condition on assumes this term is 0 at boundaries, but requires assumptions on the flow that may not hold. Another solution is to ensure that at measurement electrodes, that is the imposed field is produced in a way that places electrodes at nulls of the magnetic field, perhaps by a suitable arrangement of electromagnets. This is an area for future research and analysis.
When the primary aim is to detect the total flow rate of a fluid, perhaps in a range of geometries, Figure 6 provides useful insights. This shows that approximately all singular vectors that have a non-zero inner product with the uniform flow, or, in other words, contribute to a net positive or negative flow. The most significant one is the first singular vector with the next being the fifth, at a quarter the value of the first. Therefore, the majority of the net flow information is contained in the first singular vector; Figure 3 left. This matches the work of Shercliff [10], Williams [5], and Thúrlemann [6] because if a single measurement is made, such as a potential difference from opposite sides of the circle, then the dominant contribution to the measurement is due to the first singular vector. Thus, the measurement is correlated to the total flow rate. Improving the accuracy of measurement of the total flow rate can be, seemingly paradoxically, achieved by the same means as suggested for improving spatial resolution, above, i.e., by ensuring that electrodes are at nulls of the magnetic field.
A corollary to the above points is that the system is not sensitive to any fine structures near the centre of the pipe. The accuracy of any reconstruction will thus diminish in situations where the majority flow is contained within said fine structures. However, smooth changes over the pipe are detectable, such as the linear shear in Figure 8 right.
5. Conclusions
This paper develops theory and computing to explore the spatial response of electromagnetic flowmeters. While most flowmeters focus on measuring the overall flow rate, this paper explores the response of a flowmeter to the spatial distribution of the flow and imposed magnetic field, and develops a new dipole form of the forward map. By writing the induced boundary potential in terms of the Neumann Green’s function and introducing the dipole form of the forward map we generalize previous approaches to deriving weight functions, and are able to provide a succinct intuition for the response of flowmeters to the distribution of flow within a pipe.
A detailed definition of the Neumann Green’s function is provided, along with the salient properties of the Neumann Green’s function.The dipole kernel for electromagnetic flowmeters shows how previous analyses are examples of the forward map developed here.
Reconstruction of flow distribution was implemented using a TSVD, showing that bulk flow and flow distribution can be determined, though with a quite large number of measurements. We suggest that improved accuracy of measurement of the total flow rate, and flow distribution, from relatively few measurements can be achieved by ensuring that electrodes are at nulls of the magnetic field. This is a topic of ongoing research.
In conclusion, the authors demonstrate the potential of electromagnetic flowmeters to improve the accuracy and informativeness of flow measurements in industrial settings by examining their spatial response and presenting a new dipole form of the forward map. The methods presented in this paper can easily extend to general flows in 3-dimensional domains, making them highly applicable in a variety of contexts.
Author Contributions
C.F. and M.E.K.M. contributed equally to this work. C.F. provided initial theoretical background and methods while M.E.K.M. developed the novel dipole form and produced the computed examples of flow tomography. All authors have read and agreed to the published version of the manuscript.
Funding
This research was partly funded by the New Zealand Ministry of Business, Innovation & Employment SfTI Spearhead project “Inverting Electromagnetics” via Contract No. UOOX1208.
Acknowledgments
The authors are grateful to Ian Woodhead and Ian Platt of Lincoln Agritech for assistance and leadership in this project.
Conflicts of Interest
The authors declare no conflict of interest.
Abbreviations
The following abbreviations are used in this manuscript:
| EM | Electro-Magnetic |
| SVD | Singular value decomposition |
| TSVD | Truncated singular value decomposition |
| SNR | Signal to noise ratio |
References
- Faraday, M. The Bakerian lecture: Experimental researches in electricity. Second series. Philos. Trans. R. Soc. Lond. 1832, 122, 163–194. [Google Scholar]
- Wollaston, C. Tidally induced EMFs in cables. J. Soc. Tel. Engrs. 1881, 10, 50. [Google Scholar]
- Young, F.; Gerrard, H.; Jevons, W. XIII. On electrical disturbances due to tides and waves. Lond. Edinb. Dublin Philos. Mag. J. Sci. 1920, 40, 149–159. [Google Scholar] [CrossRef]
- Deacon, G. Information from electric currents in the sea. J. Navig. 1955, 8, 117–120. [Google Scholar] [CrossRef]
- Williams, E. The induction of electromotive forces in a moving liquid by a magnetic field, and its application to an investigation of the flow of liquids. Proc. Phys. Soc. 1930, 42, 466. [Google Scholar] [CrossRef]
- Thürlemann, P.B. Methode zur Elektrischen Geschwindigkeitsmessung von Flüssigkeiten. ; Helvetica Physica Acta 1941, 14, 383–419. [Google Scholar]
- Guelke, R.; Schoute-Vanneck, C. The measurement of sea-water velocities by electromagnetic induction. J. Inst. Electr. Eng.-Part II Power Eng. 1947, 94, 71–74. [Google Scholar]
- Von Arx, W.S. An Electromagnetic Method for Measuring the Velocities of Ocean Currents from a Ship under Way; Massachusetts Institute of Technology and Woods Hole Oceanographic Institution: Cambridge, MA, USA, 1950. [Google Scholar]
- Kolin, A. An Alternating Field Induction Flow Meter of High Sensitivity. Rev. Sci. Instrum. 1945, 16, 109–116. [Google Scholar] [CrossRef]
- Shercliff, J.A. The Theory of Electromagnetic Flow-Measurement; CUP Archive: Cambridge, UK, 1962. [Google Scholar]
- Shercliff, J.A. Relation between the velocity profile and the sensitivity of electromagnetic flowmeters. J. Appl. Phys. 1954, 25, 817–818. [Google Scholar] [CrossRef]
- Sobolev, S.L. Partial Differential Equations of Mathematical Physics; Pergamon Press: Oxford, UK, 1964. [Google Scholar]
- Stakgold, I. Boundary Value Problems of Mathematical Physics: Volumes 1 and 2; Society for Industrial and Applied Mathematics: Philadelphia, PA, USA, 2000. [Google Scholar]
- Koshljakov, N.S.; Smirnov, M.M.; Gliner, E.B. Differential Equations of Mathematical Physics; North-Holland Publishing: Amsterdam, The Netherlands, 1964; p. 712. [Google Scholar]
- Bevir, M. Theory of induced voltage electromagnetic flowmeasurement. IEEE Trans. Magn. 1970, 6, 315–320. [Google Scholar] [CrossRef]
- Bevir, M. The theory of induced voltage electromagnetic flowmeters. J. Fluid Mech. 1970, 43, 577–590. [Google Scholar] [CrossRef]
- Watral, Z.; Jakubowski, J.; Michalski, A. Electromagnetic flow meters for open channels: Current state and development prospects. Flow Meas. Instrum. 2015, 42, 16–25. [Google Scholar] [CrossRef]
- Al-Khazraji, Y.; Baker, R.C. Analysis of the performance of three large-electrode electromagnetic flowmeters. J. Phys. D Appl. Phys. 1979, 12, 1423. [Google Scholar] [CrossRef]
- O’Sullivan, V. Performance of an electromagnetic flowmeter with six point electrodes. J. Phys. E Sci. Instrum. 1983, 16, 1183. [Google Scholar] [CrossRef] [PubMed]
- Teshima, T.; Honda, S.; Tomita, Y. Flow velocity tomography with magnetic flowmeter. Trans. Soc. Instrum. Control. Eng. 1995, 31, 999–1004. [Google Scholar] [CrossRef]
- Yin, S.; Li, B. A new approach for solving weight functions of electromagnetic flowmeters using resistive network modeling. J. Appl. Math. 2013, 2013, 747531. [Google Scholar] [CrossRef]
- Mitchell, B.; Zhou, Y.; Hayes, M.P.; Heffernan, B.; Platt, I.; Bailey, J.; Hunze, A.; Gao, K.; Long, N.; Woodhead, I. Non-invasive groundwater velocity measurements using a novel electromagnetic flowmeter. IEEE Trans. Instrum. Meas. 2022, 71, 1–15. [Google Scholar] [CrossRef]
- Sadybekov, M.; Torebek, B.; Turmetov, B.K. Construction of Green’s function of the Neumann problem in a ball. Eurasian Math. J. 2016, 7, 100–105. [Google Scholar]
- Fox, C. Conductance Imaging: Estimation of Isotropic Conductance Perturbations from Low-Frequency Boundary Measurements in Circular Geometries. Ph.D. Thesis, University of Cambridge, Cambridge, UK, 1989. [Google Scholar]
- Gottlieb, D.; Shu, C.W. On the Gibbs phenomenon and its resolution. SIAM Rev. 1997, 39, 644–668. [Google Scholar] [CrossRef]
- Lehtikangas, O.; Karhunen, K.; Vauhkonen, M. Reconstruction of velocity fields in electromagnetic flow tomography. Phil. Trans. R. Soc. A 2016, 374, 20150334. [Google Scholar] [CrossRef] [PubMed]
Disclaimer/Publisher’s Note: The statements, opinions and data contained in all publications are solely those of the individual author(s) and contributor(s) and not of MDPI and/or the editor(s). MDPI and/or the editor(s) disclaim responsibility for any injury to people or property resulting from any ideas, methods, instructions or products referred to in the content. |
© 2023 by the authors. Licensee MDPI, Basel, Switzerland. This article is an open access article distributed under the terms and conditions of the Creative Commons Attribution (CC BY) license (https://creativecommons.org/licenses/by/4.0/).

