

Impact of Evaluation of Freeze–Thaw Cycles on Collapse Zone at Entrance and Exit of Loess Tunnel
Abstract
:1. Introduction
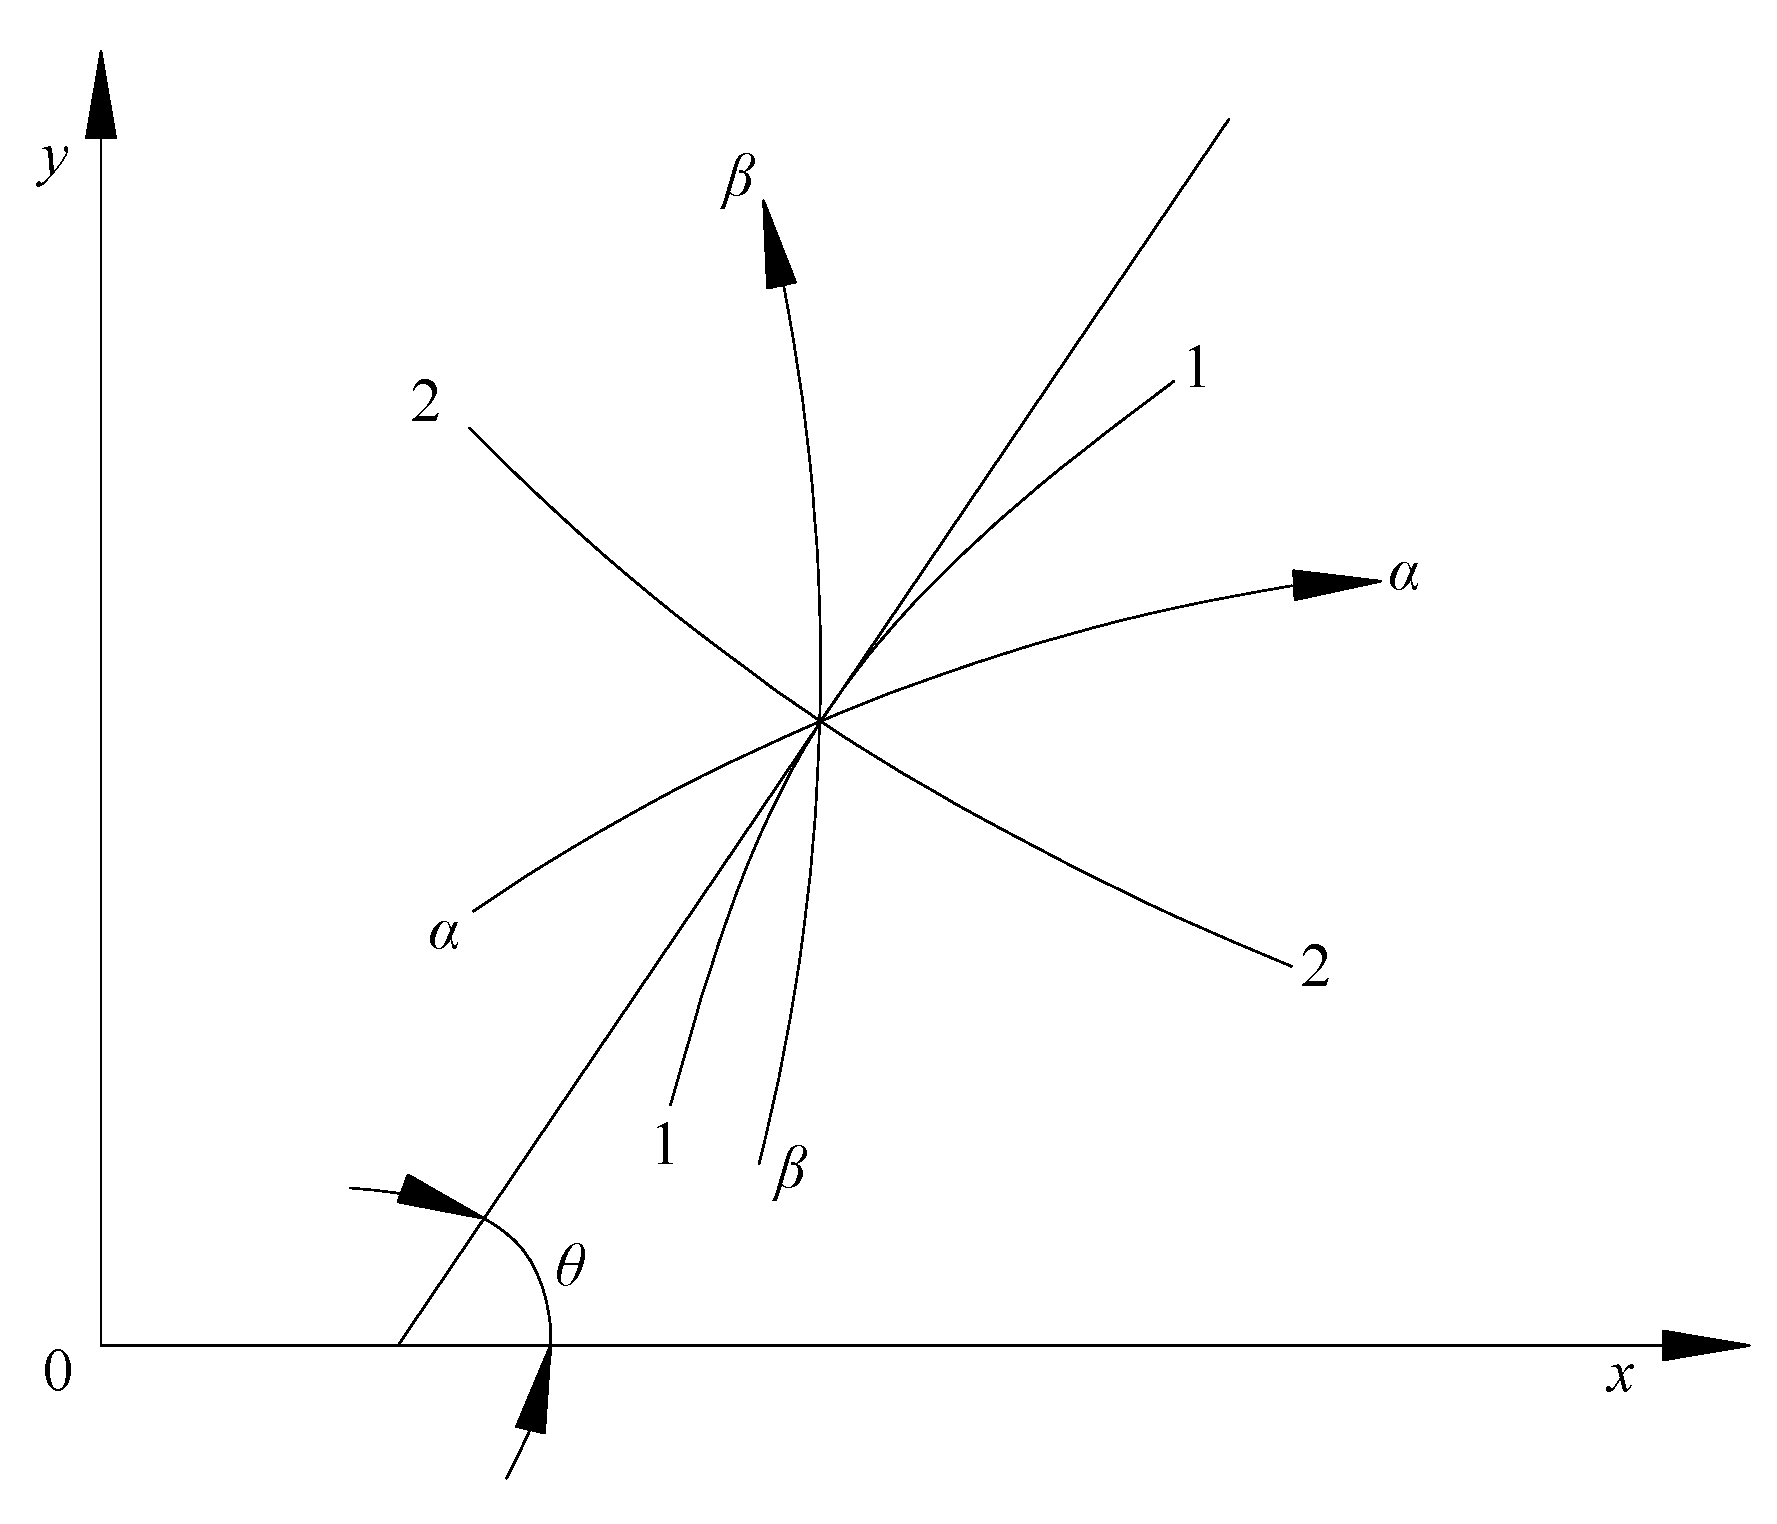
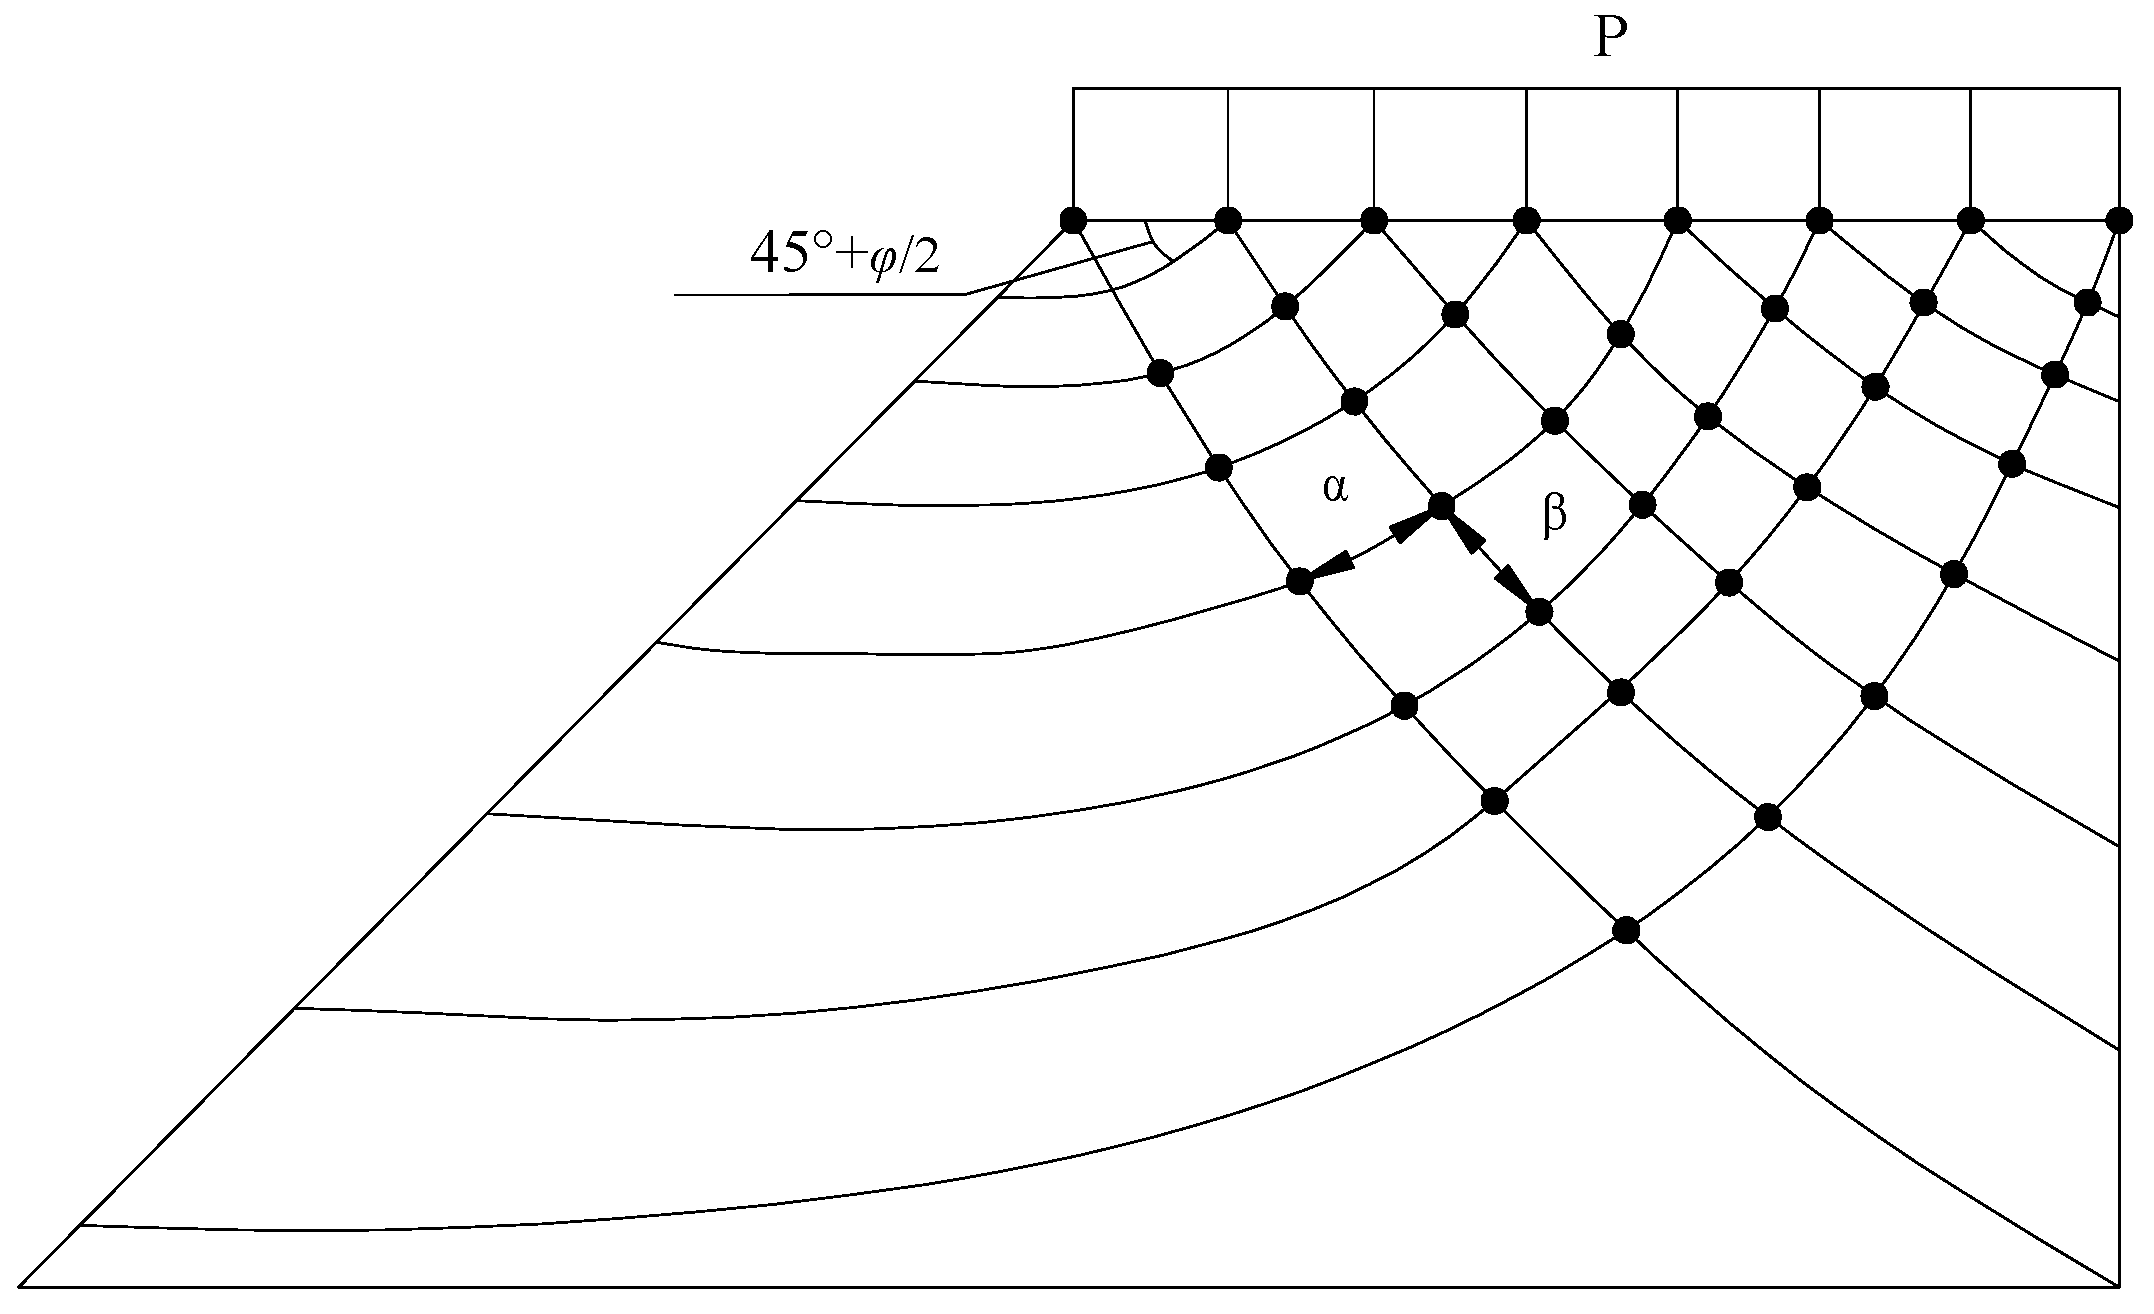
2. Principle and Procedure of Network Map
3. Research and Evaluation
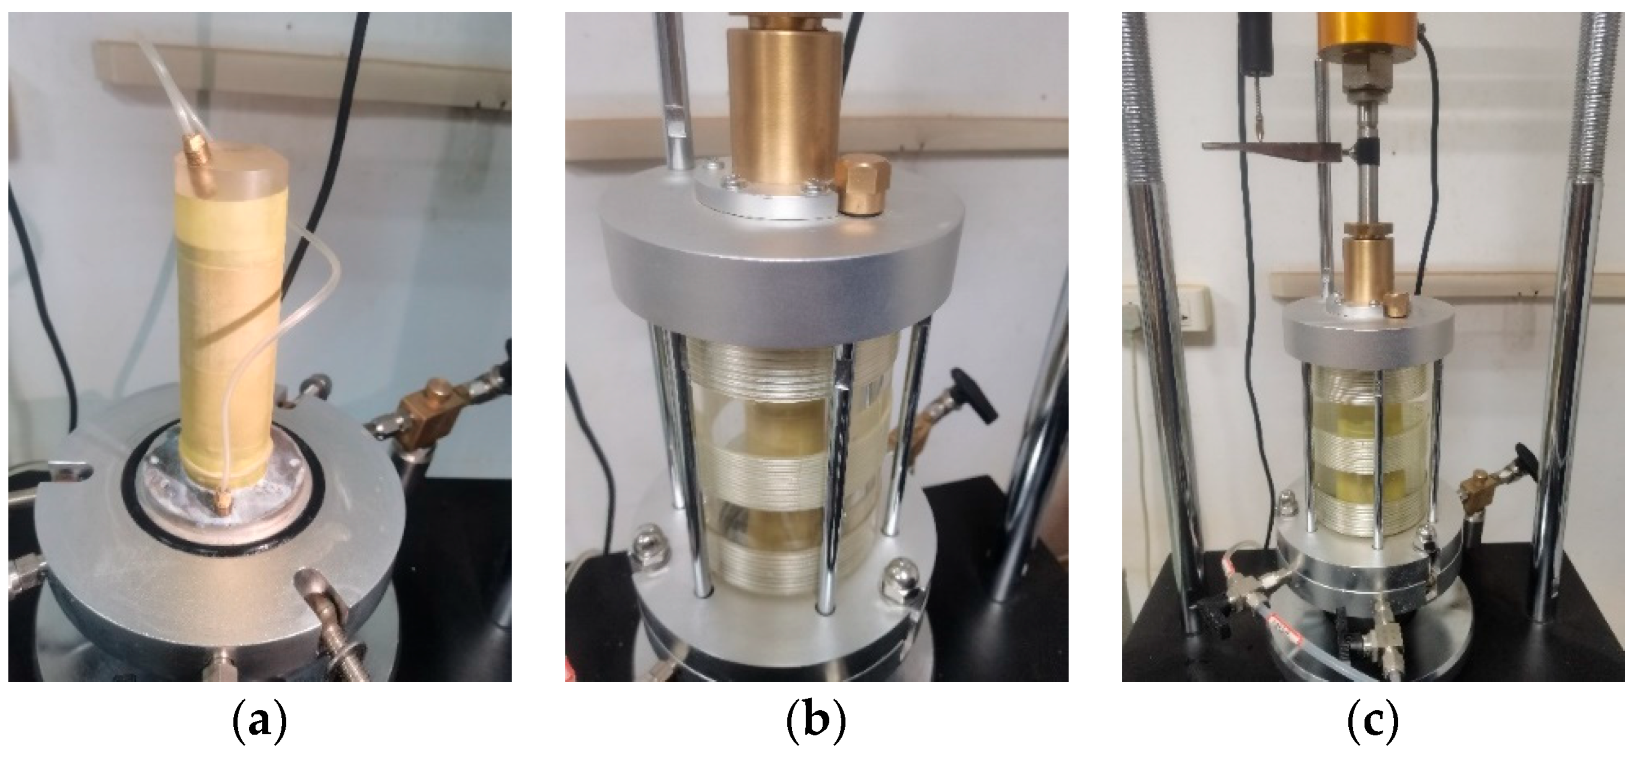
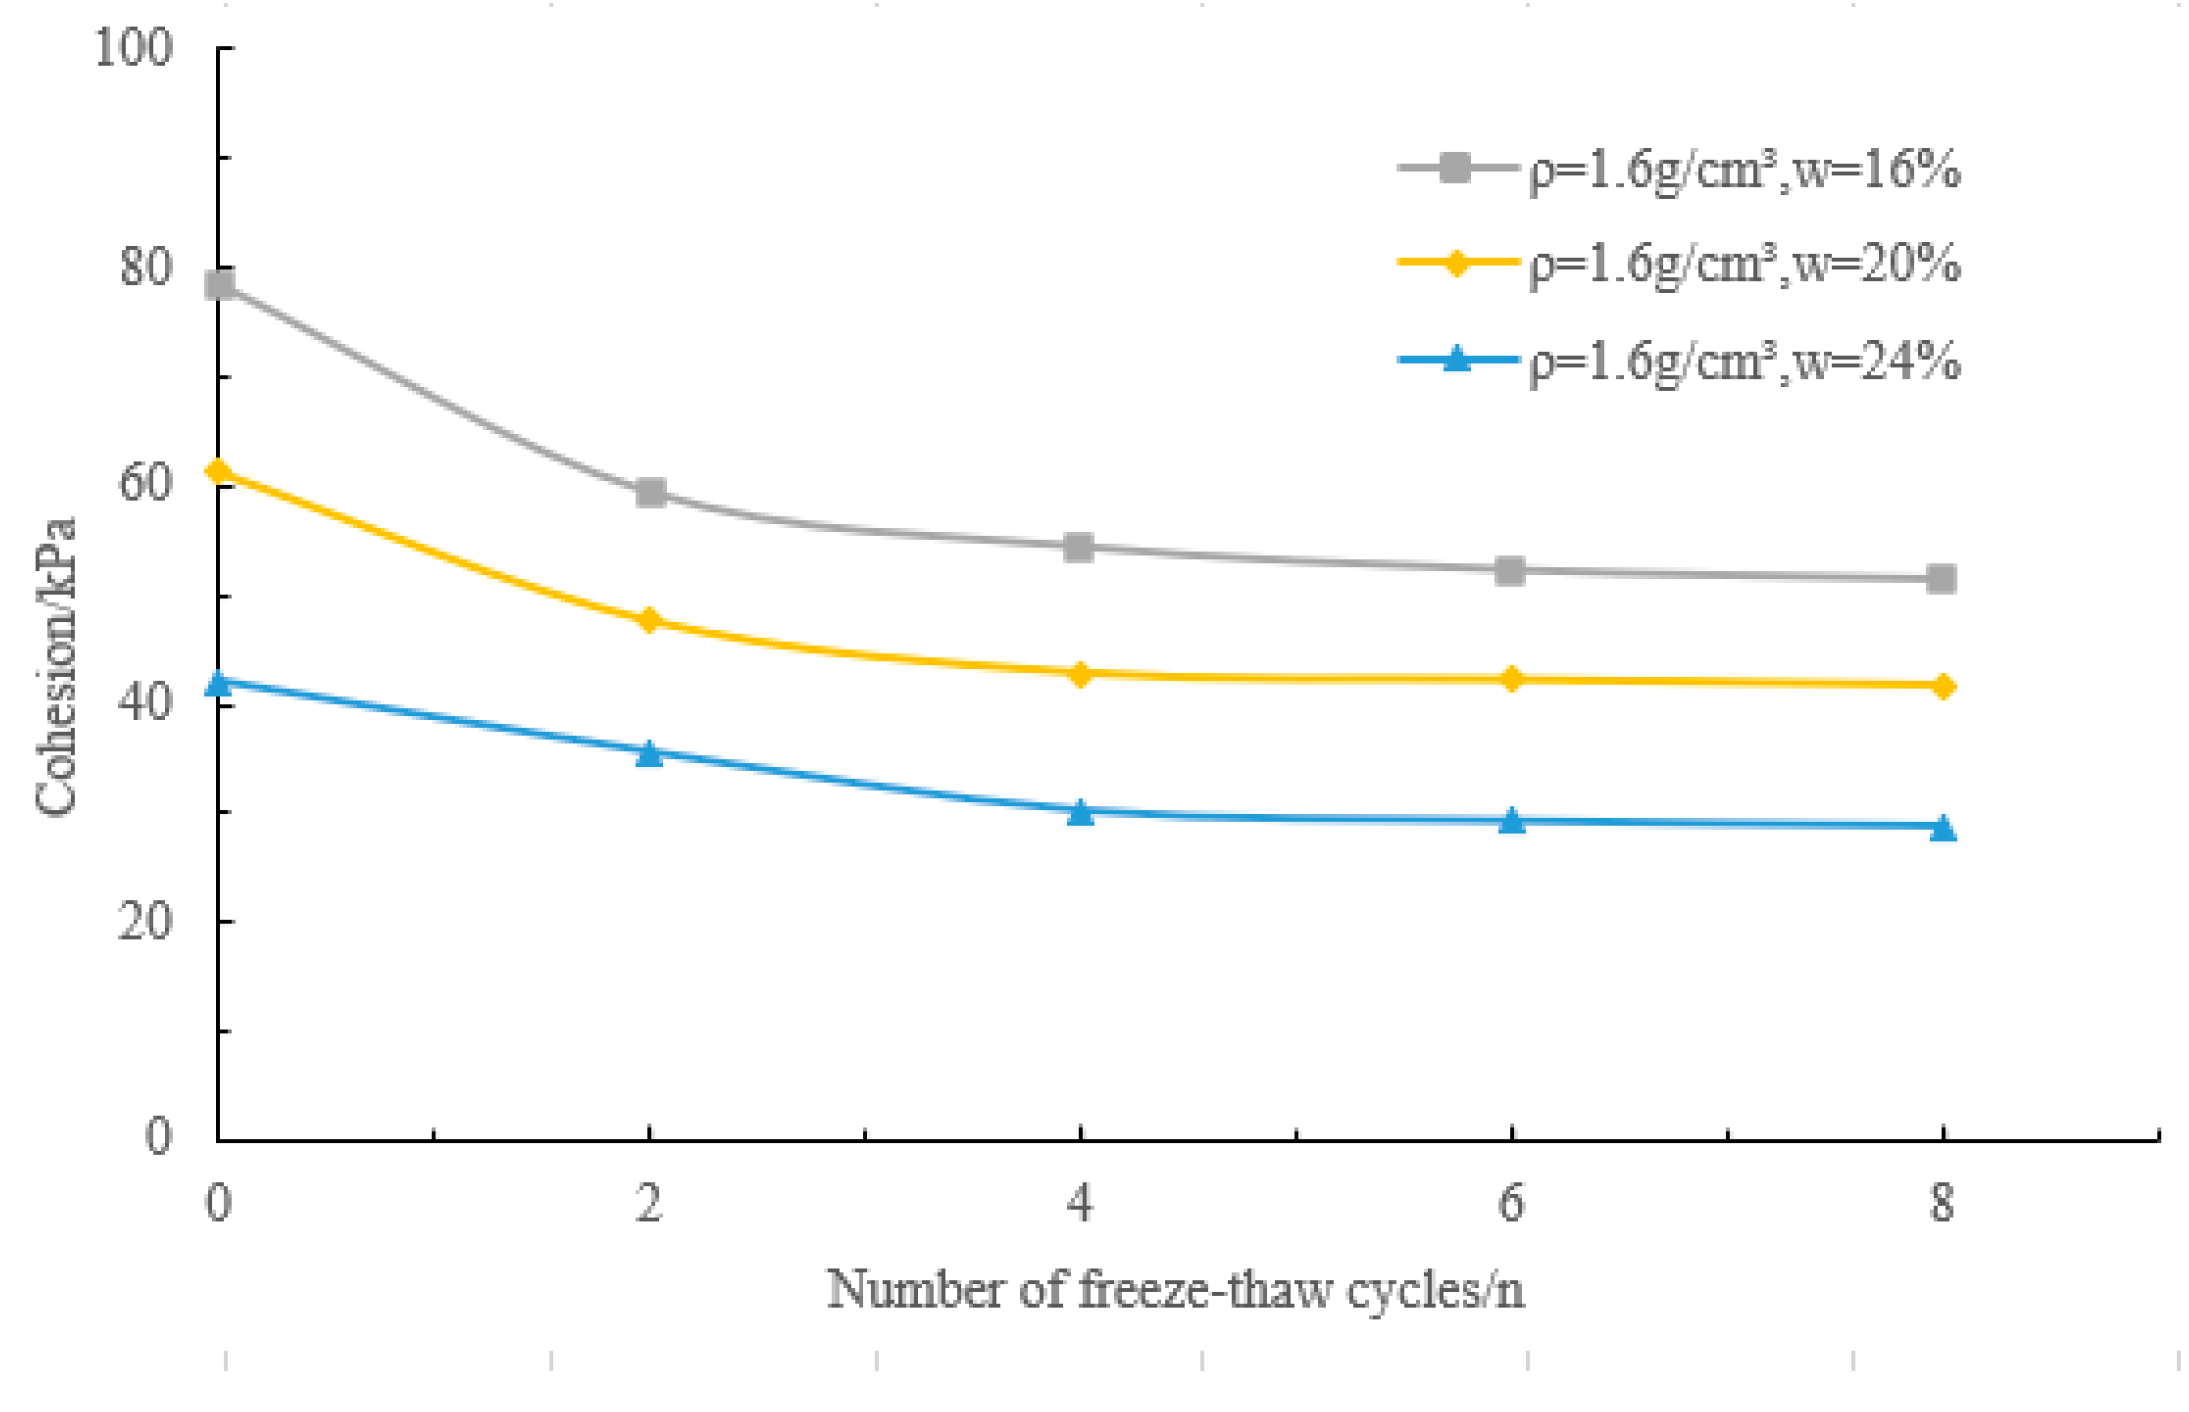
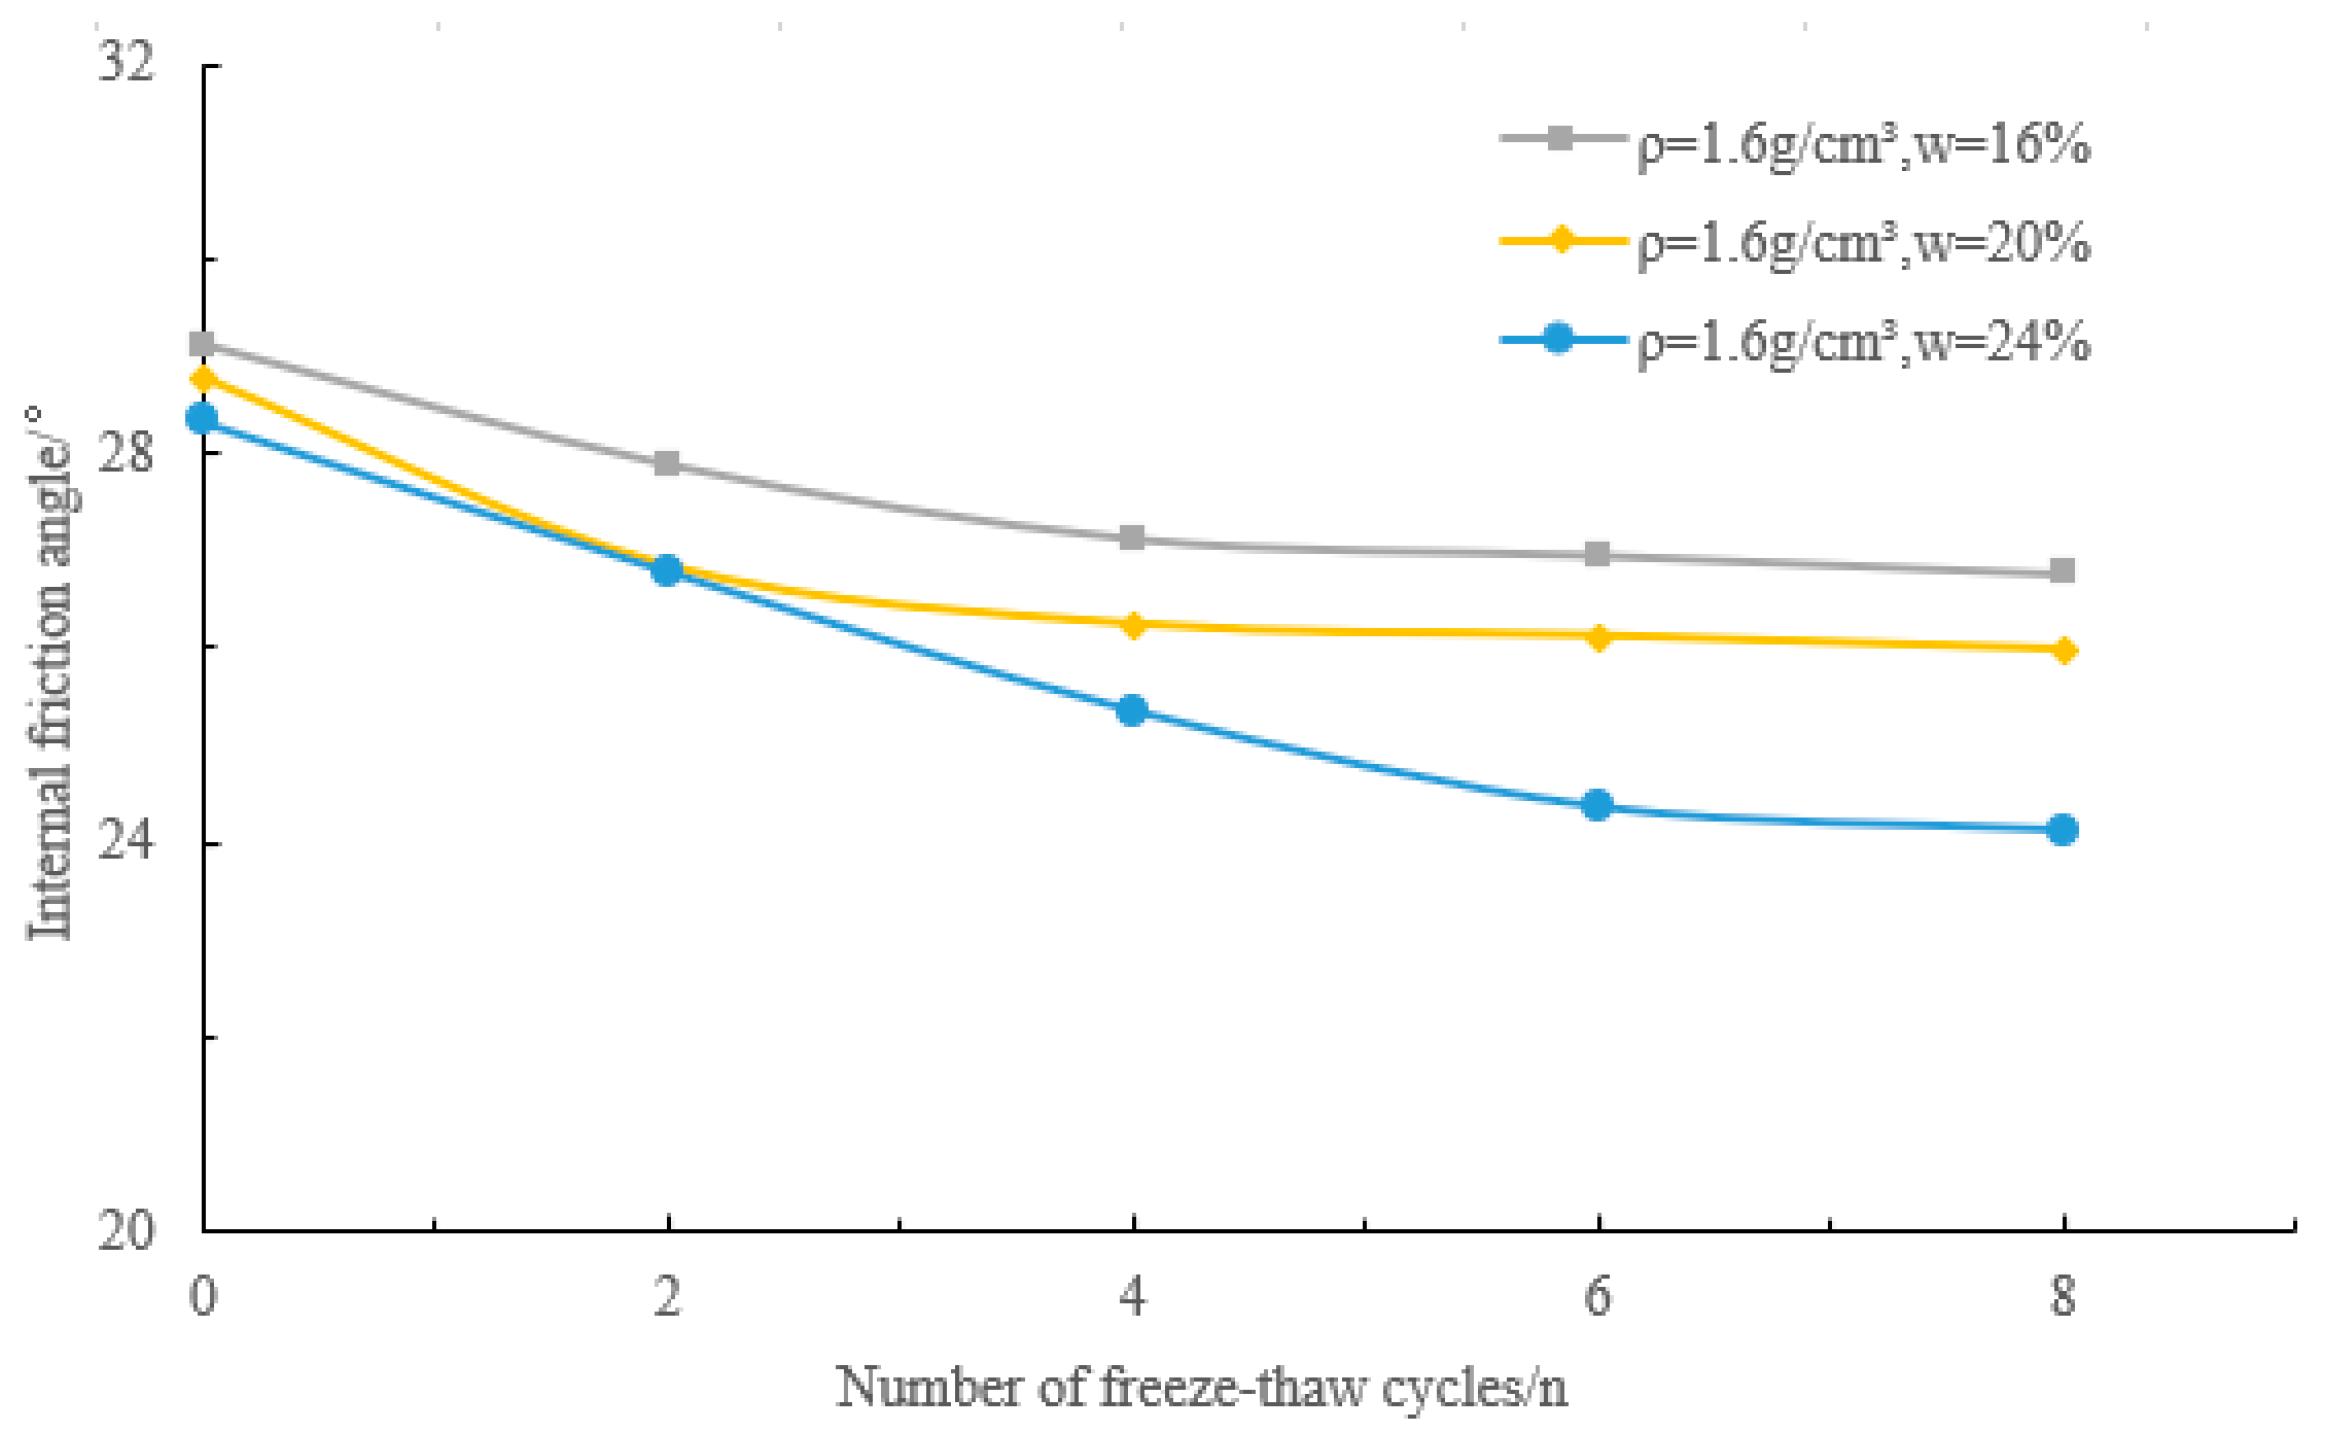
4. Results of Freeze–Thaw Cycles on Strength Degradation of Loess
5. Results
6. Conclusions
- (1)
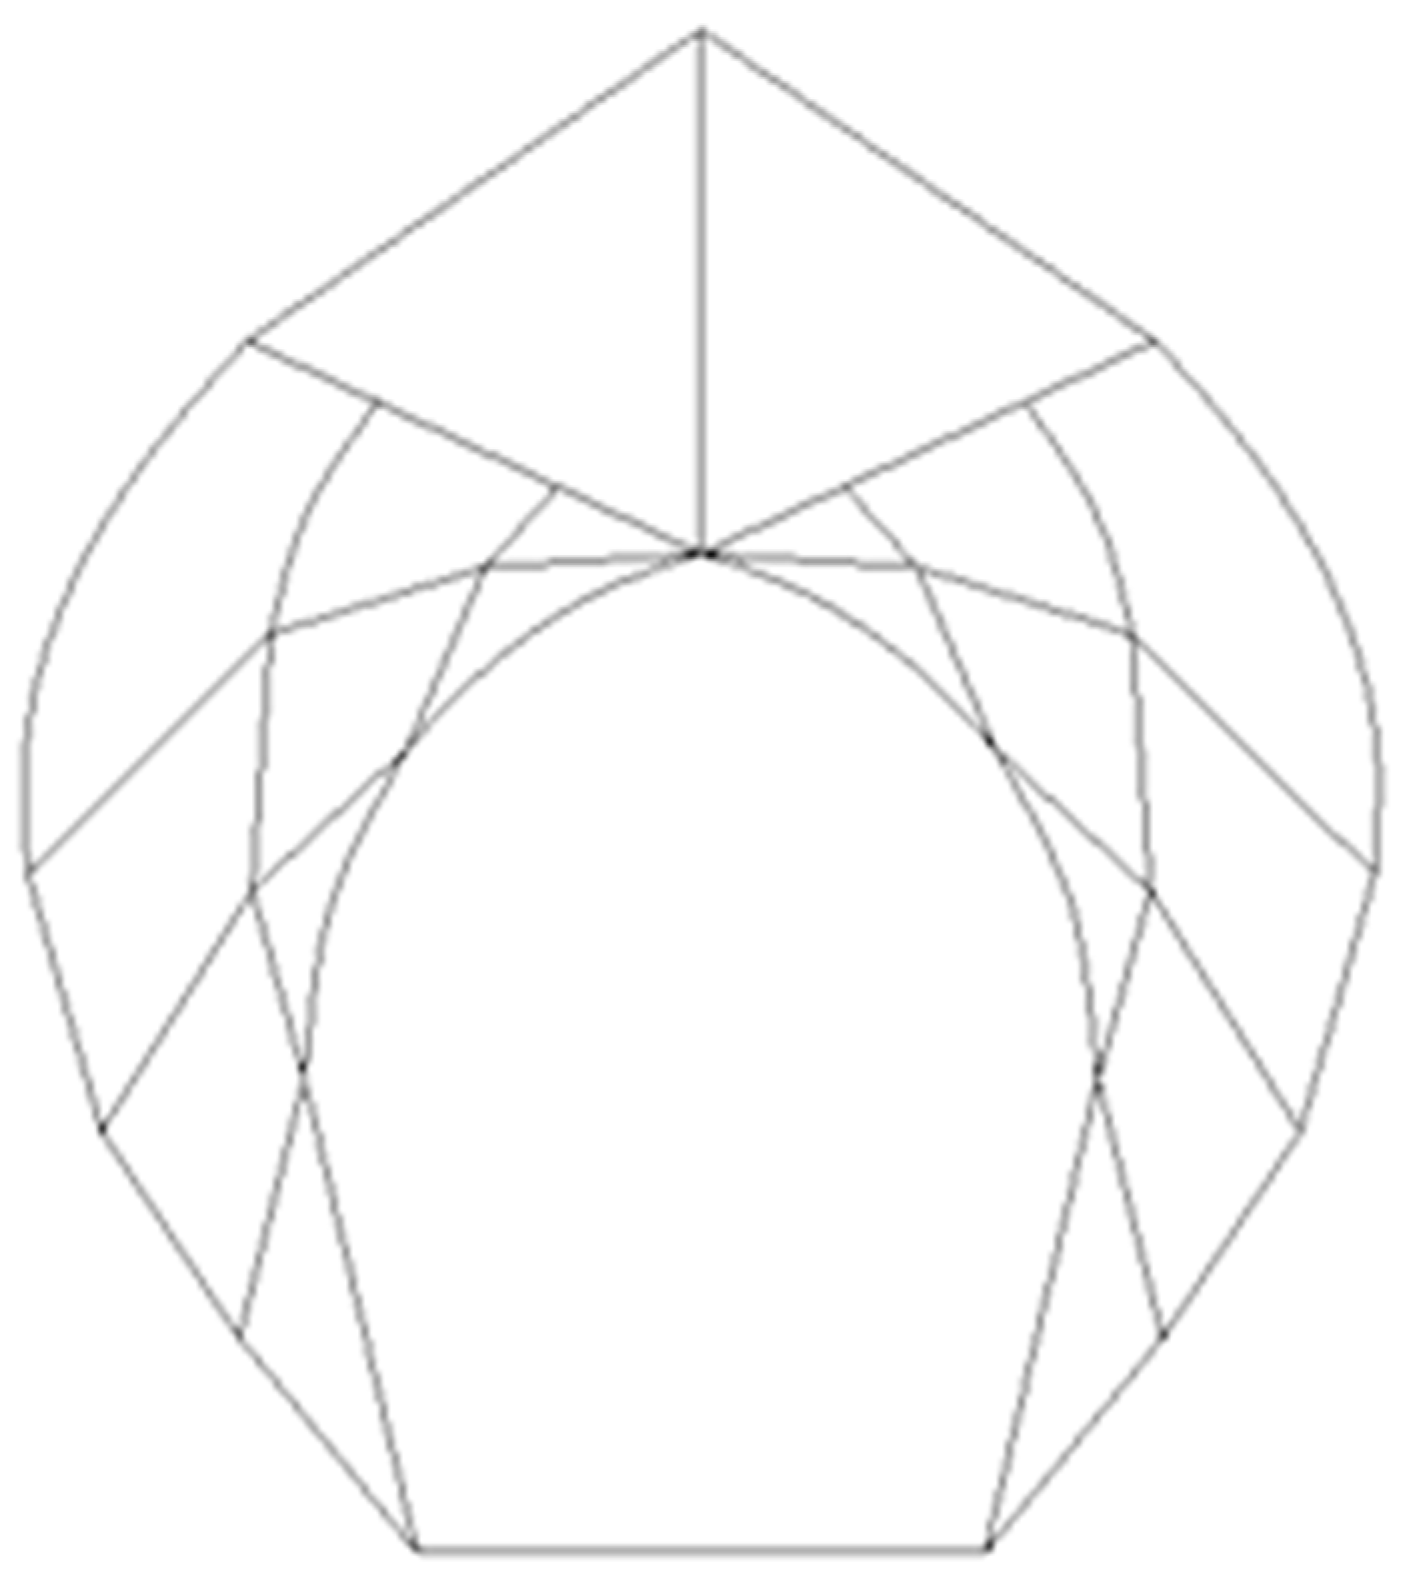
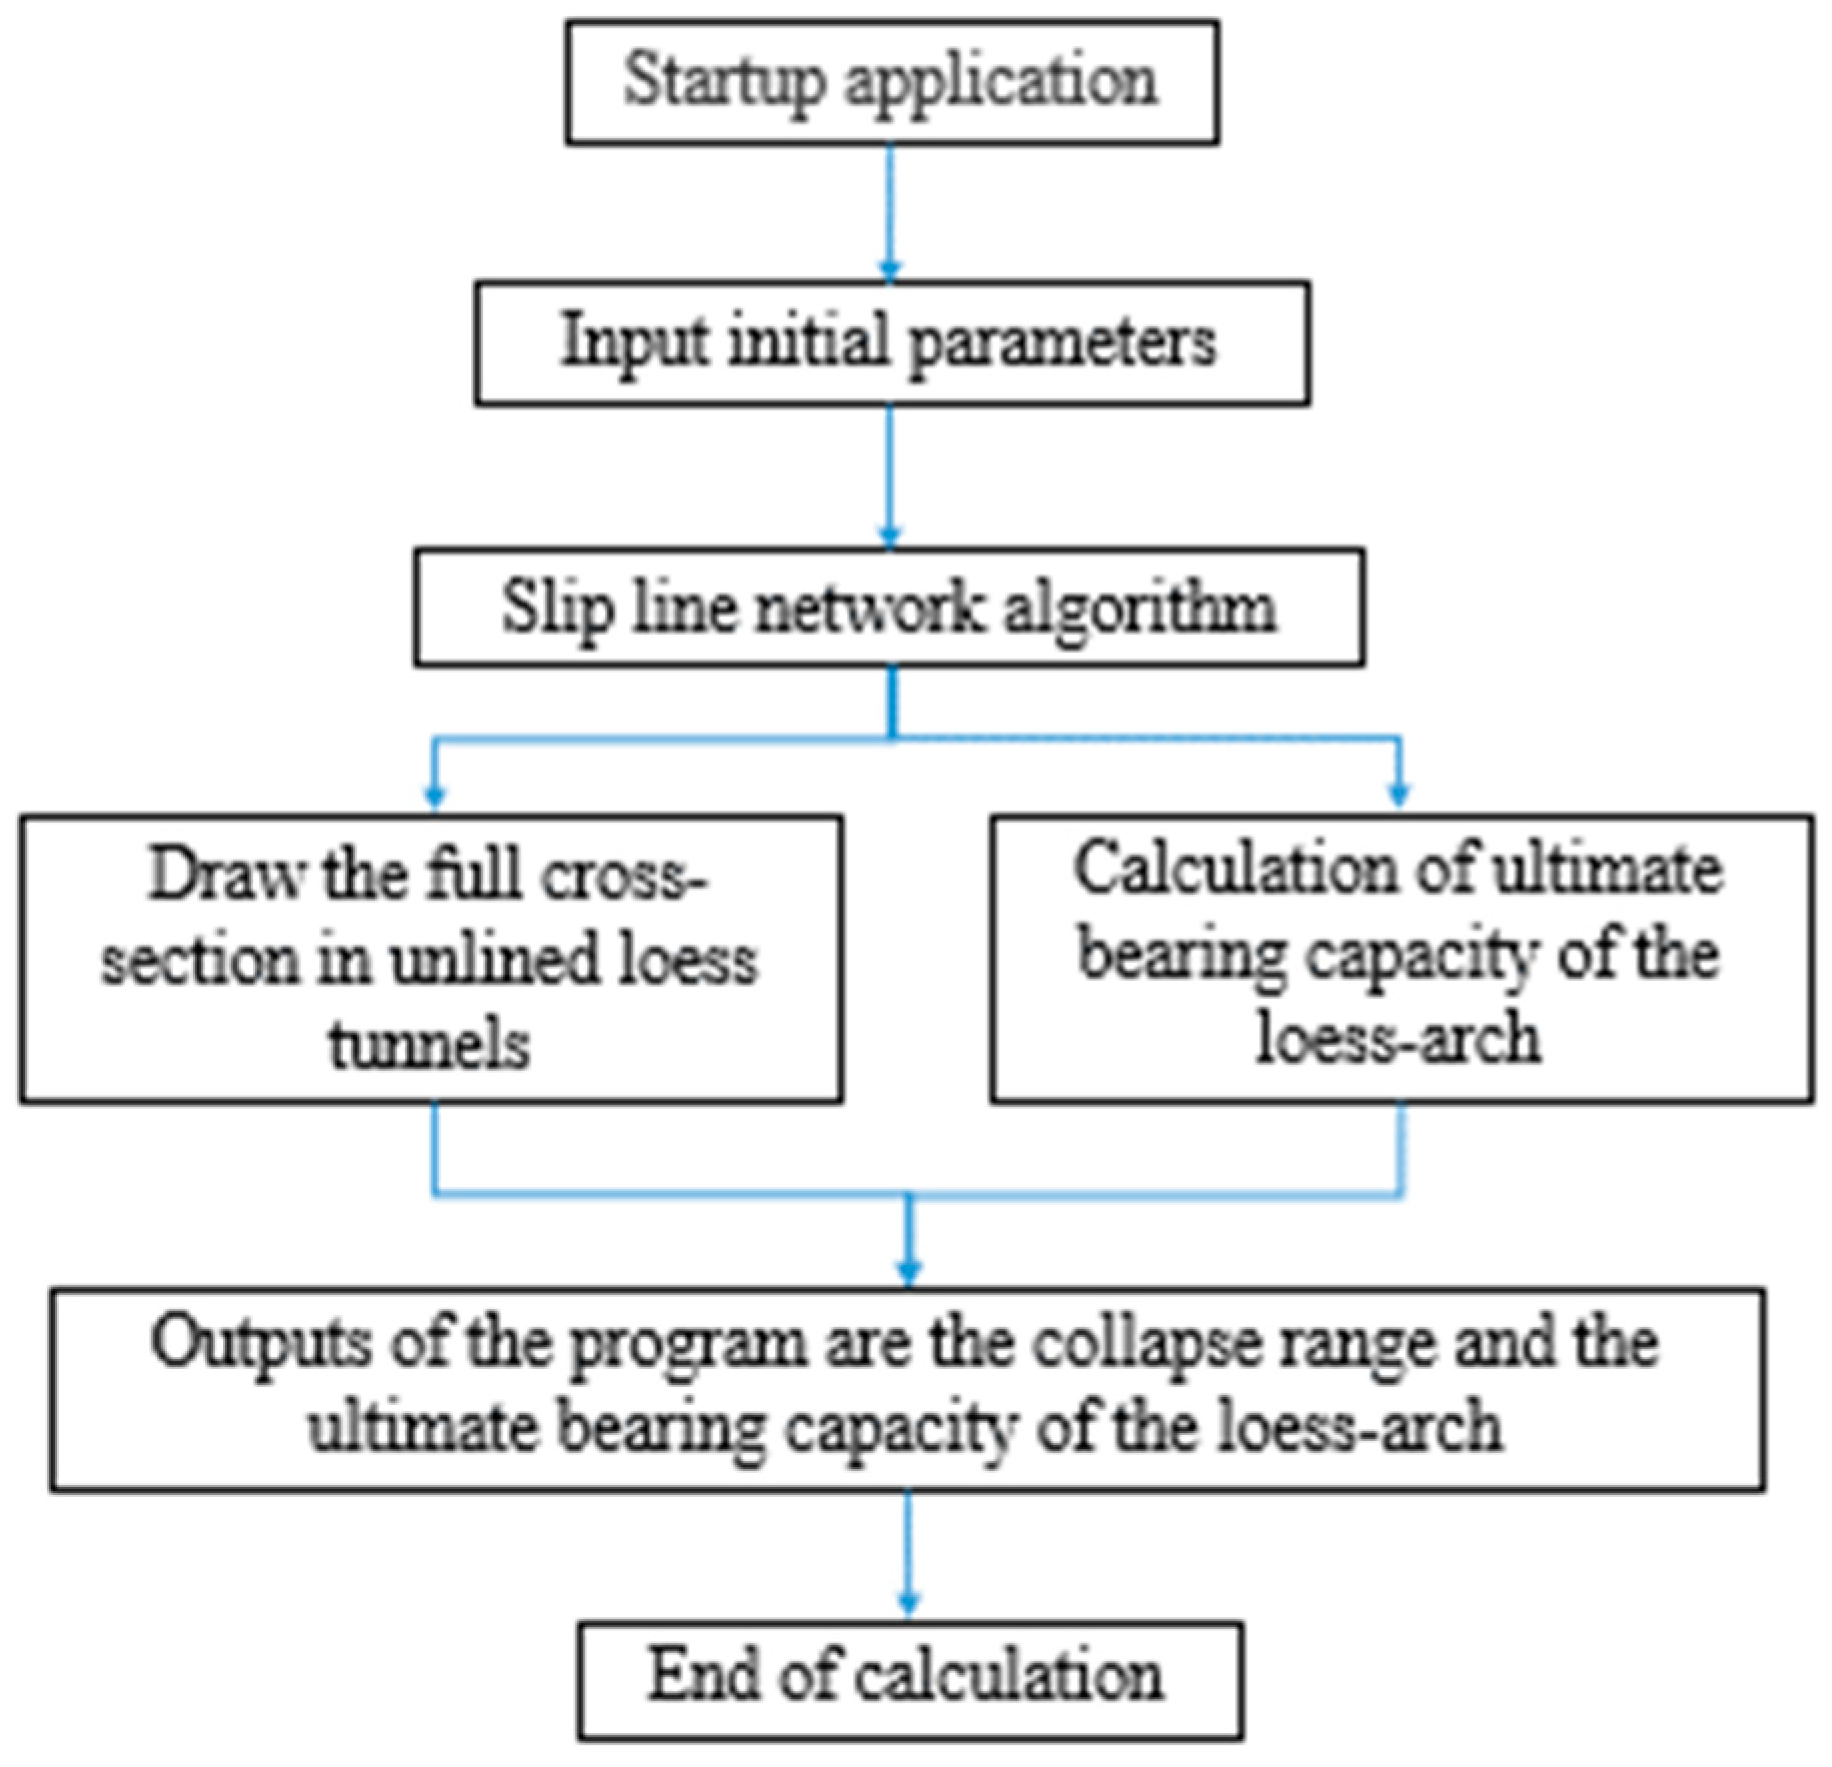
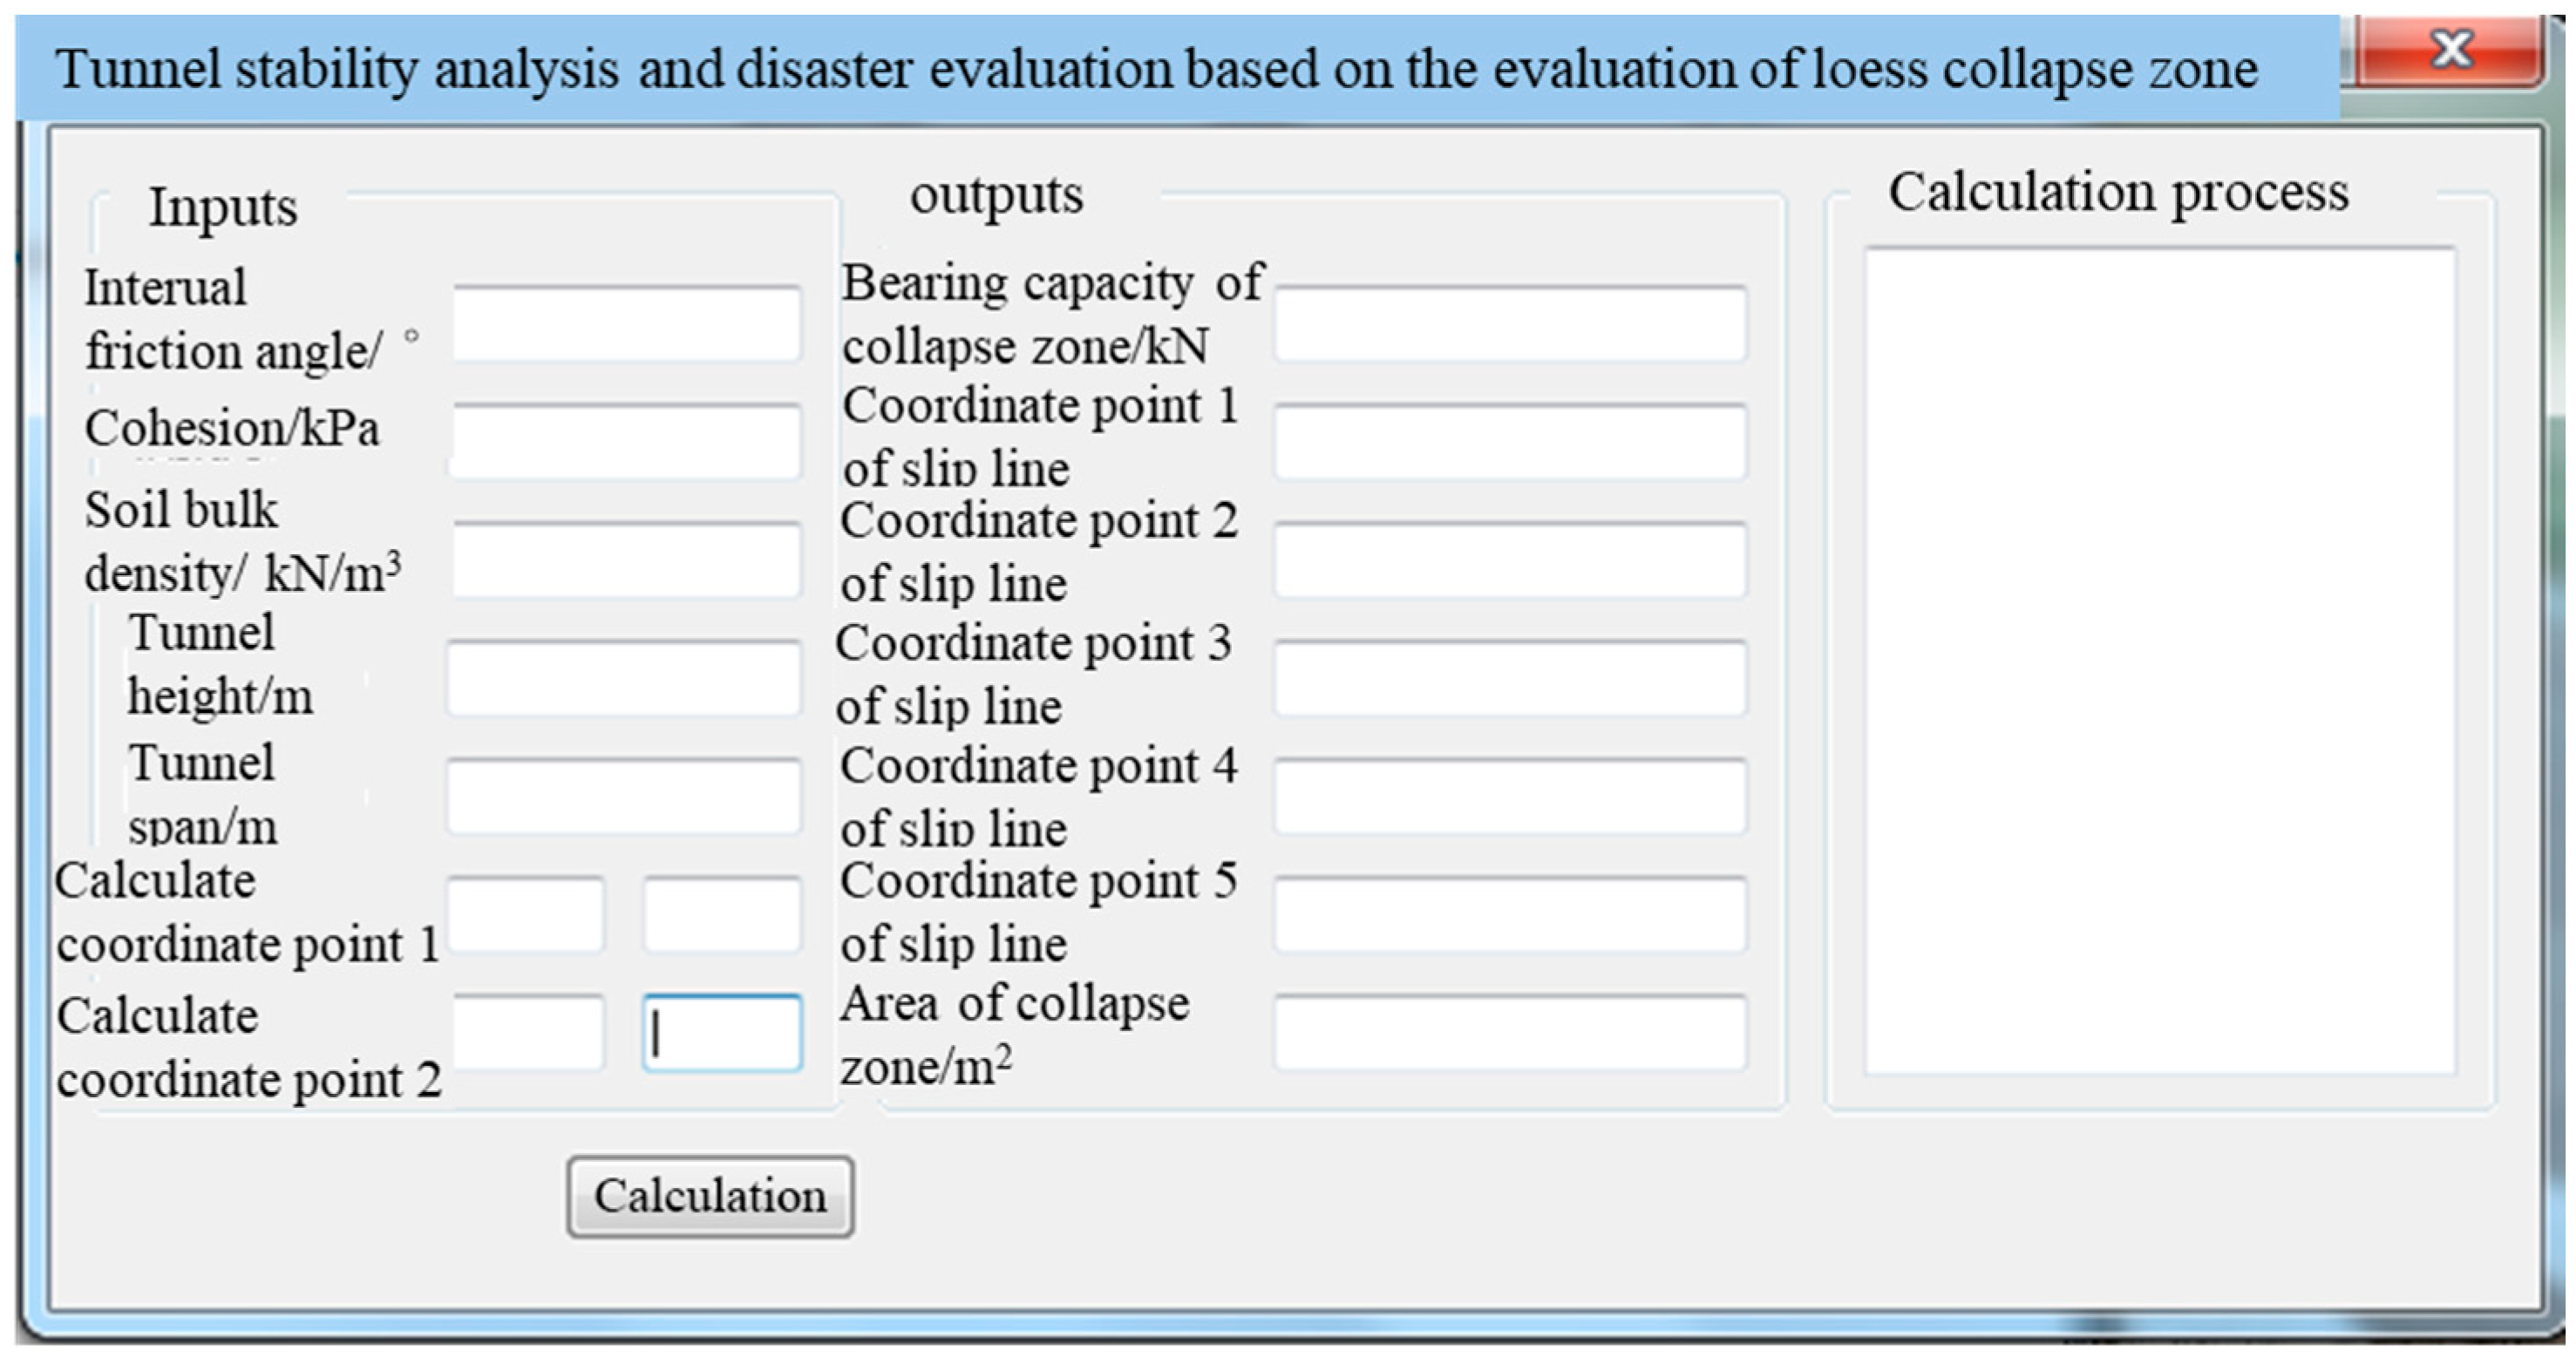
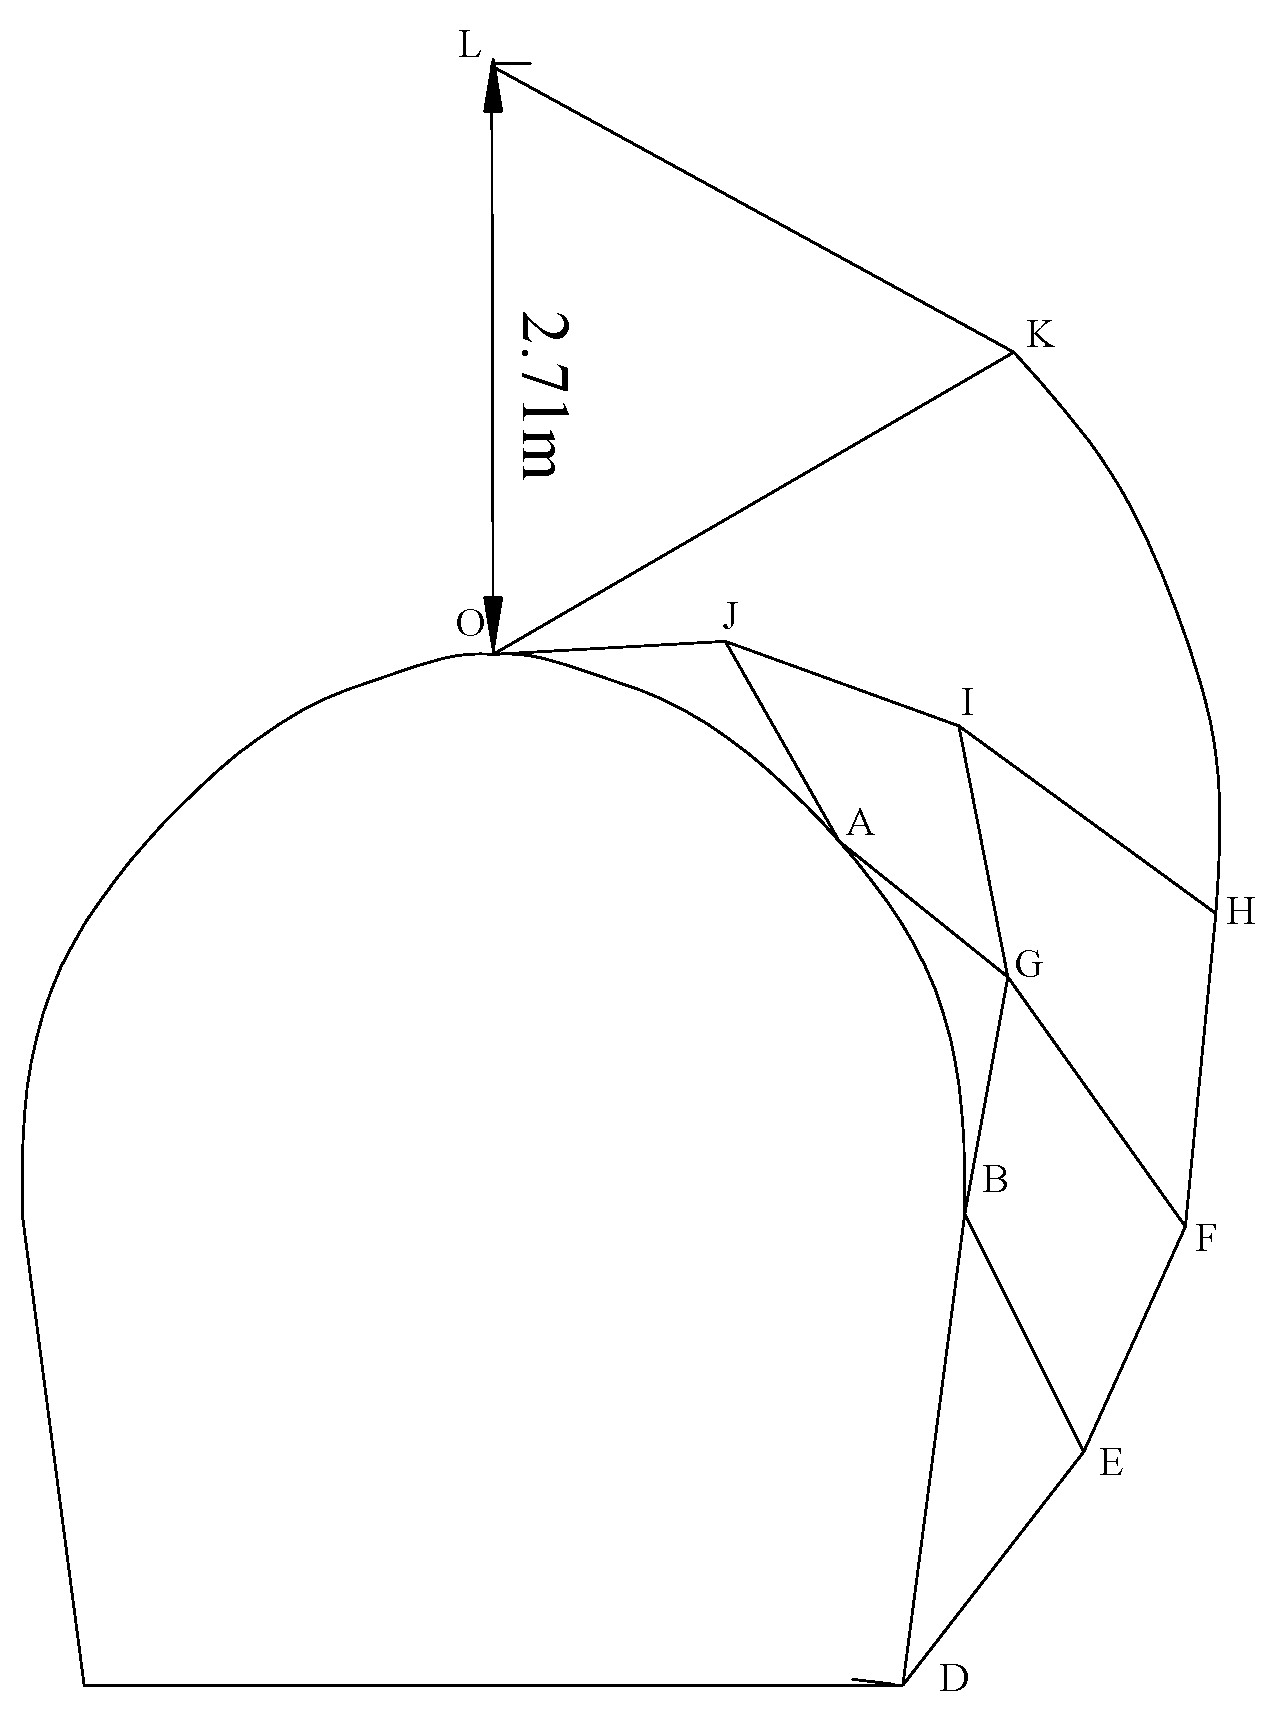
- Based on the monitoring data on the tested loess tunnel, this paper develops a visual analysis program for computing implementation of the slip line network method, which targets the collapse zone of an unlined loess tunnel. The program visualizes the calculation process, and plots the slip lines of the surrounding rock. The outputs of the program help to judge the collapse zone and ultimate bearing capacity.
- (2)
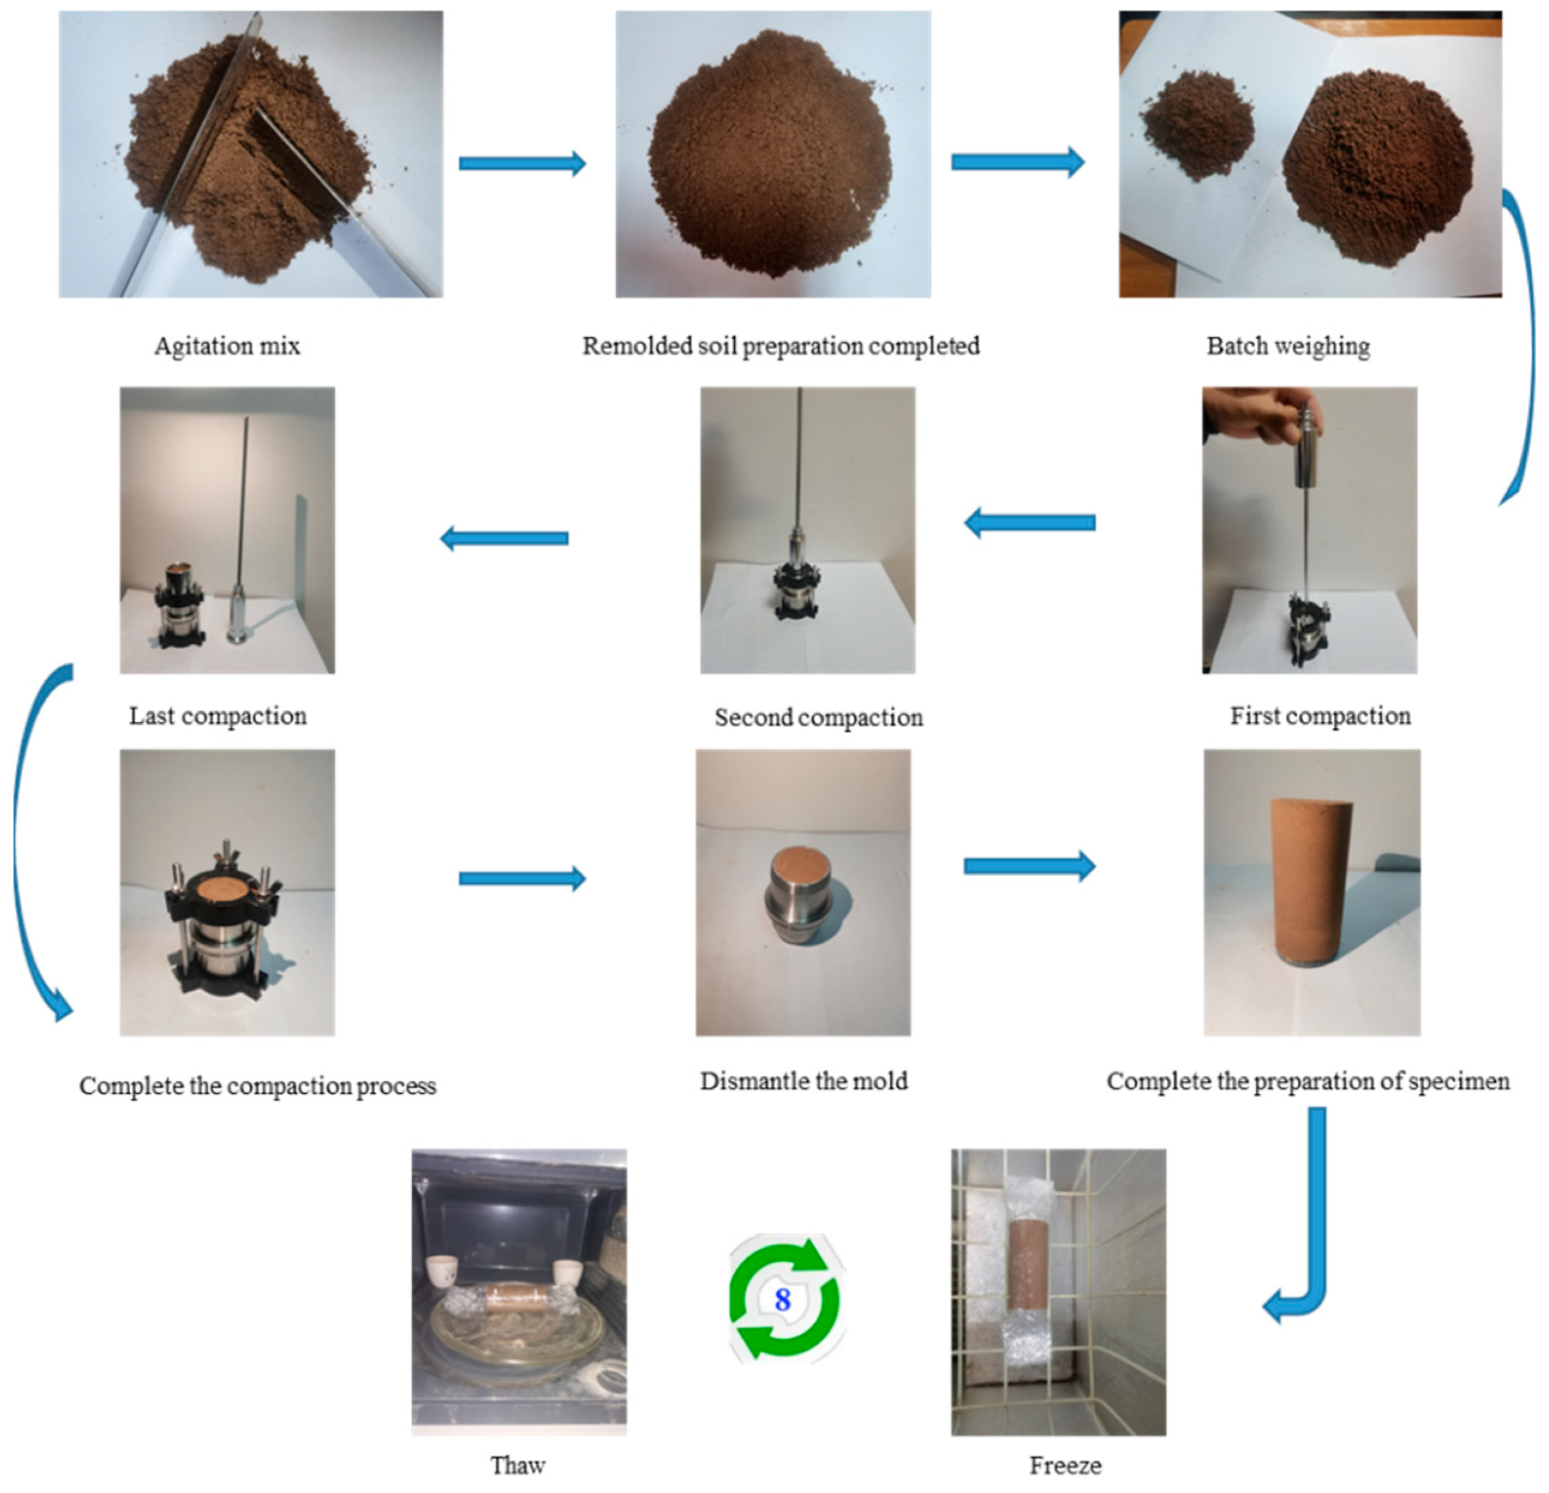
- With the increase of freeze–thaw cycle times, the cohesion and the internal friction angle of the loess strength decreased gradually in the consolidated undrained (CU) test under different freeze–thaw conditions, the cohesion of loess strength decreased by 34.48%, and the internal friction angle decreased by 15.52%. However, it is worth noting that the attenuation of cohesion was significantly greater than that of the internal friction angle.
- (3)
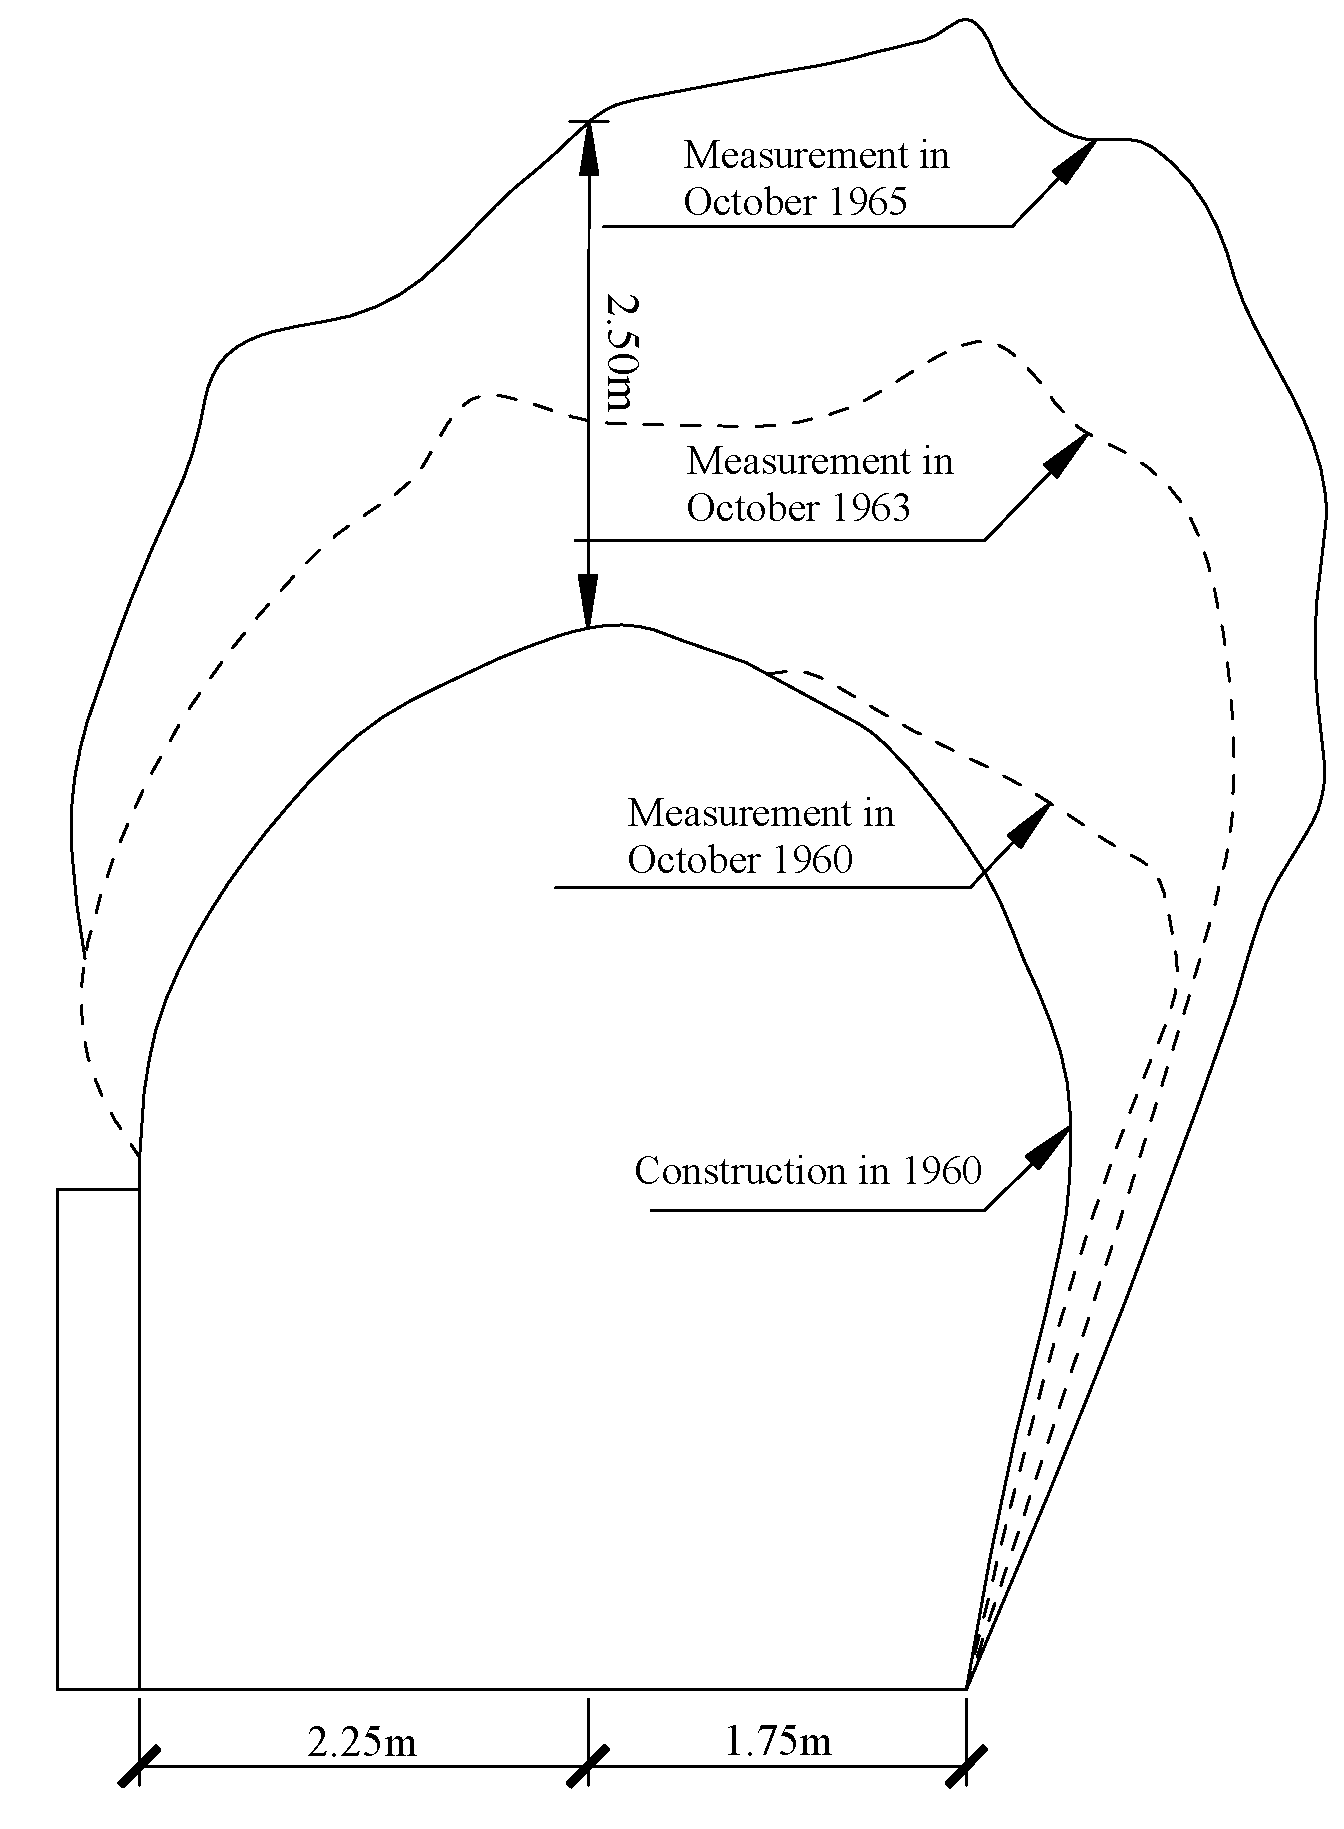
- Comparative analysis of the collapse zone area at the entrance and exit section of the loess tunnel before and after freezing and thawing, and the freeze–thaw cycles expanded by 16.13% at the maximum. As a result, the freeze–thaw cycle significantly will increase the area of the collapse zone of the loess tunnel.
Author Contributions
Funding
Data Availability Statement
Conflicts of Interest
References
- Zhou, S.G. Main geology disasters type of loess tunnel. Geol. Prospect. 2007, 43, 103–107. (In Chinese) [Google Scholar]
- Editorial Department of China Journal of Highway and Transport. Review on China’s traffic tunnel engineering research: 2022. China J. Highw. Transp. 2022, 35, 1–40. (In Chinese) [Google Scholar]
- Xing, Y.Q.; Zhang, J.Y. Three-dimensional Numerical Simulation on Construction Process of Loess Highway Tunnel. North Commun. 2015, 271, 120–122. (In Chinese) [Google Scholar]
- Shao, S.J.; Yang, C.M.; Jiao, Y.Y.; Lu, S. Engineering properties of collapsible loess tunnel. Chin. J. Geotech. Eng. 2013, 35, 1580–1590. (In Chinese) [Google Scholar]
- Xue, X.H.; Zhang, J.; Yao, G. Study on Loess Tunnel Surrounding Rock Classification Method Based on Extension Theory. Chin. J. Undergr. Space Eng. 2017, 13, 651–657. (In Chinese) [Google Scholar]
- Zhao, X.M.; Wang, L. Analysis of mechanism of loess arching. Rock Soil Mech. 2009, 30, 9–12. (In Chinese) [Google Scholar]
- Han, T.L.; Shi, J.P.; Cao, X.S. Fracturing and damage to sandstone under coupling effect of chemical corrosion and freeze-thaw cycles. Rock Mech. Rock Eng. 2016, 49, 4245–4255. [Google Scholar] [CrossRef]
- Han, T.L.; Shi, J.P.; Chen, Y.S.; Cao, X.S. Physical and mechanical properties of marble under the combined effects of chemical solutions and freeze-thaw cycles. Geotech. Test. J. 2017, 40, 1057–1070. [Google Scholar] [CrossRef]
- Han, T.L.; Li, Z.H. Mechanical characteristics and failure modes for mode-I sandstone and rock-like cracked sample exposed to freeze thawing cycle. Bull. Eng. Geol. Environ. 2021, 80, 6937–6953. [Google Scholar] [CrossRef]
- Dong, X.H.; Zhang, A.J.; Lian, J.B.; Guo, M.X. Laboratory study on shear strength deterioration of loess with long-term freezing-thawing cycles. J. Eng. Geol. 2010, 18, 887–893. (In Chinese) [Google Scholar]
- Xu, J.; Li, C.Y.; Wang, Z.Q.; Ren, J.W.; Yuan, J. Experimental analysis on the mechanism of shear strength deterioration of undisturbed loess during the freeze-thaw process. J. Civ. Environ. Eng. 2016, 38, 90–98. [Google Scholar]
- Xu, J.; Wang, Z.Q.; Ren, J.W.; Yuan, J. Experimental research on shear strength deterioration of remolded loess under the freezing-thawing cycle. J. Xi’an Univ. Archit. Technol. Nat. Sci. Ed. 2017, 49, 200–206. [Google Scholar]
- Xu, J.; Wang, Z.Q.; Ren, J.W.; Yuan, J. Comparative Test Study on Deterioration Mechanism of Undisturbed and Remolded Loess during the Freeze-thaw Process. Chin. J. Undergr. Space Eng. 2018, 14, 643–649. [Google Scholar]
- Li, S.H.; Li, Y.X.; Gao, X.Y.; Shi, D.M. Effect of freezing and thawing on shear strength of intact loess. J. Civ. Environ. Eng. 2020, 42, 48–55. [Google Scholar]
- Wang, S.L.; Lv, Q.F.; Baaj, H.; Li, X.Y.; Zhao, Y.X. Volume change behavior and microstructure of stabilized loess under cyclic freeze-thaw conditions. Can. J. Civ. Eng. 2016, 43, 865–874. [Google Scholar] [CrossRef]
- Li, J.; Zhou, X.H.; Dang, J.Q. Graphic method for the stability of loess slopes. Chin. J. Geotech. Eng. 1998, 20, 43–46. (In Chinese) [Google Scholar]
- Zhu, Y.W.; Wu, C.Q.; Cai, Y.Q. Determination of slip surface in slope based on theory of slip line field. Chin. J. Rock Mech. Eng. 2005, 24, 2609–2616. (In Chinese) [Google Scholar]
- Li, K.; Chen, G.R. Finite element analysis of slope stability based on theory of slip line field. J. Hohai Univ. Nat. Sci. 2010, 38, 191–195. (In Chinese) [Google Scholar]
- Gong, W.H.; Chen, X.L.; Qiu, J.W.; Wang, J.; Zhong, X.H. Seismic stability analysis of soil slope using theory of slip line field. Rock Soil Mech. 2017, 38, 1733–1738. (In Chinese) [Google Scholar]
- Zhang, Q.Q.; Ma, B.; Liu, S.W.; Feng, R.F. Behavior analysis on the vertically loaded bored pile socketed into weak rocks using slip-line theory arc failure surface. Comput. Geotech. 2020, 128, 103852. [Google Scholar] [CrossRef]
- Fang, H.W.; Chen, Y.F.; Hou, Z.K.; Xu, G.W. Probabilistic analysis of a cohesion-frictional slope using the slip-line field theory in a Monte-Carlo framework. Comput. Geotech. 2020, 120, 103398. [Google Scholar] [CrossRef]
- Fang, H.W.; Chen, Y.F.; Xu, Y.X. New Instability Criterion for Stability Analysis of Homogeneous Slopes. Int. J. Geomech. 2020, 20, 04020034. [Google Scholar] [CrossRef]
- Cheng, H.; Zhao, H.B.; Xu, J.F.; Qin, F.Y.; Zhang, Y.X.; Hu, L.F. Study on floor heave mechanism and control technology of roadway based on slip line field theory. J. Min. Sci. Technol. 2021, 6, 314–322. (In Chinese) [Google Scholar]
- Chen, Y.F.; Li, H.S.; Lin, H.; Wang, Y.X.; Zhao, Y.L.; Chen, Y.Z. Critical slip line recognition and extraction method of slope based on modified k-medoid clustering algorithm br. Comput. Geotech. 2023, 154, 105125. [Google Scholar] [CrossRef]
- Keshavarz, A.; Pooresmaeil, Z. Static and seismic active lateral earth pressure coefficients for c-phi soils. Geomech. Eng. 2016, 10, 657–676. [Google Scholar] [CrossRef]
- Keshavarz, A.; Pooresmaeil, Z. Evaluation of the static and seismic active lateral earth pressure for c-phi soils by the ZEL method. Sci. Iran. 2016, 23, 142–154. [Google Scholar]
- Keshavarz, A. Evaluation of the Plastic Critical Depth in Seismic Active Lateral Earth Pressure Problems Using the Stress-Characteristics Method. Acta Geotech. Slov. 2016, 13, 16–25. [Google Scholar]
- Santhoshkumar, G.; Ghosh, P. Plasticity-Based Estimation of Active Earth Pressure Exerted by Layered Cohesionless Backfill. Int. J. Geomech. 2021, 21, 06021028. [Google Scholar] [CrossRef]
- Haderka, P.; Galybin, A.N. The stress trajectories method for plane plastic problems. Int. J. Solids Struct. 2011, 48, 450–462. [Google Scholar] [CrossRef]
- Shah, N.A.; Hamed, Y.S.; Abualnaja, K.M.; Chung, J.D.; Shah, R.; Khan, A. A Comparative Analysis of Fractional-Order Kaup–Kupershmidt Equation within Different Operators. Symmetry 2022, 14, 986. [Google Scholar] [CrossRef]
- Alshammari, S.; Al-Sawalha, M.M.; Shah, R. Approximate Analytical Methods for a Fractional-Order Nonlinear System of Jaulent-Miodek Equation with Energy-Dependent Schrodinger Potential. Fractal Fract. 2023, 7, 140. [Google Scholar] [CrossRef]
- Shah, N.A.; Alyousef, H.A.; El-Tantawy, S.A.; Shah, R.; Chung, J.D. Analytical Investigation of Fractional-Order Korteweg-De-Vries-Type Equations under Atangana-Baleanu-Caputo Operator: Modeling Nonlinear Waves in a Plasma and Fluid. Symmetry 2022, 14, 739. [Google Scholar] [CrossRef]
- An, P.; Chen, H.; Sun, B.W.; Xing, Y.C.; Zhao, Q.L.; Zhou, X.G.; Wang, S.H. A minimally invasive method for reinforcing the karez tunnel in Turpan based on the high mole ratio potassium silicate. Bull. Eng. Geol. Environ. 2022, 81, 138. [Google Scholar] [CrossRef]
- Zhao, X.M.; Ni, Y.S. Long-term observation and stability analysis of surrounding rock deformation of loess tunnel. In Proceedings of the Tunnel and Underground Works Branch of China Civil Engineering Society in 12th Annual Meeting, Chongqing, China, 13–15 October 2002. [Google Scholar]
- Bai, W.S.; Li, R.J.; Zhao, X.M.; Liu, J.D.; Zou, Z.L. Based on Loess Arch Sliding Line Field Visualization Program Design and Parameter Sensitivity Analysis. J. Disaster Prev. Mitig. Eng. 2020, 40, 132–138. [Google Scholar]
- Gong, X.N. Computational Analysis of Soil Engineering; China Architecture and Building Press: Beijing, China, 2000. [Google Scholar]


| Strength Indices | Dry Density (g/cm3) | Water Content% | Number of Freeze–Thaw Cycles | ||||
|---|---|---|---|---|---|---|---|
| 0 | 2 | 4 | 6 | 8 | |||
| c/kPa | 1.60 | 16 | 78.56 | 59.45 | 56.45 | 52.33 | 51.47 |
| 20 | 61.24 | 47.64 | 42.87 | 42.26 | 41.76 | ||
| 24 | 42.16 | 35.68 | 30.29 | 29.34 | 28.86 | ||
| φ/° | 16 | 29.12 | 27.89 | 27.13 | 26.96 | 26.77 | |
| 20 | 28.78 | 26.84 | 26.24 | 26.12 | 25.98 | ||
| 24 | 28.33 | 26.79 | 25.36 | 24.37 | 24.13 | ||
| Case | Loess Parameters | Condition | Collapse Zone Parameters | ||
|---|---|---|---|---|---|
| ρd/(g/cm3) | w/% | Bearing Capacity (P)/kN | Area/m2 | ||
| Case 1-1 | 1.6 | 18 | Undisturbed loess tunnel | 2599.45 | 12.52 |
| Case 1-2 | After freeze–thaw cycles | 1534.97 | 13.66 | ||
| Case 2-1 | 20 | Undisturbed loess tunnel | 1893.07 | 12.67 | |
| Case 2-2 | After freeze–thaw cycles | 1123.37 | 14.00 | ||
| Case 3-1 | 24 | Undisturbed loess tunnel | 1104.46 | 12.88 | |
| Case 3-2 | After freeze–thaw cycles | 561.74 | 14.95 | ||
Disclaimer/Publisher’s Note: The statements, opinions and data contained in all publications are solely those of the individual author(s) and contributor(s) and not of MDPI and/or the editor(s). MDPI and/or the editor(s) disclaim responsibility for any injury to people or property resulting from any ideas, methods, instructions or products referred to in the content. |
© 2023 by the authors. Licensee MDPI, Basel, Switzerland. This article is an open access article distributed under the terms and conditions of the Creative Commons Attribution (CC BY) license (https://creativecommons.org/licenses/by/4.0/).
Share and Cite
Bai, W.; Li, R.; Li, R.; Zou, X.; Lin, G.; Zhao, X. Impact of Evaluation of Freeze–Thaw Cycles on Collapse Zone at Entrance and Exit of Loess Tunnel. Appl. Sci. 2023, 13, 6651. https://doi.org/10.3390/app13116651
Bai W, Li R, Li R, Zou X, Lin G, Zhao X. Impact of Evaluation of Freeze–Thaw Cycles on Collapse Zone at Entrance and Exit of Loess Tunnel. Applied Sciences. 2023; 13(11):6651. https://doi.org/10.3390/app13116651
Chicago/Turabian StyleBai, Weishi, Rongjian Li, Rongjin Li, Xin Zou, Guoqiang Lin, and Xuemeng Zhao. 2023. "Impact of Evaluation of Freeze–Thaw Cycles on Collapse Zone at Entrance and Exit of Loess Tunnel" Applied Sciences 13, no. 11: 6651. https://doi.org/10.3390/app13116651