Article

Substructure Pseudo-Dynamic Test Study for a Structure Including Soil–Pile–Structure Dynamic Interaction

MOE Key Laboratory of Deep Earth Science and Engineering, School of Architecture and Environment, Sichuan University, Chengdu 610065, China
*
Author to whom correspondence should be addressed.
Appl. Sci. 2023, 13(11), 6709; https://doi.org/10.3390/app13116709
Submission received: 21 April 2023 / Revised: 19 May 2023 / Accepted: 29 May 2023 / Published: 31 May 2023

Abstract

:
An improved Penzien model is proposed in this paper as a simplified model of soil–pile–structure interaction. The dynamic nonlinearity of soil under earthquake excitation is simulated by ANSYS in a free-field model and added to the original Penzien model. The improved Penzien model uses the finite element software ANSYS 2021 to simulate the dynamic nonlinearity of soil. The improved Penzien model is then used as a simplified calculation model of the numerical substructure. A substructure pseudo-dynamic test based on the improved Penzien model is carried out. The realization of the substructure pseudo-dynamic test verifies the feasibility and effectiveness of this method, which provides a convenient test method for the study of soil–pile–structure interaction in general laboratories. Soil and structure interaction reduces the acceleration of the structure, and the response exhibited a hysteresis phenomenon because of the nonlinear characteristics of the soil. The influences of soil–pile–structure interaction on velocity and displacement are very complex. The conclusions are reasonable, which proves that the substructure pseudo-dynamic test method of soil–pile–structure dynamic interaction using the improved Penzien model is feasible.

1. Introduction

Seismic analysis and structural design of buildings and other engineering structures in China are often based on the assumption that the foundation is a rigid half-space and the bottoms of the structures are fixed. The NIST GCR 12-917-21 report [1] and FEMA P-58 [2] proposed the consideration of soil–structure interactions in seismic analysis. It is well known that soil–structure interaction (SSI) can significantly affect the seismic response of superstructures, especially those on soft soil foundations [3,4,5,6]. Soil–structure interaction, one of the major subjects in the domain of earthquake engineering, has been paid comprehensive attention by international scholars for more than forty years, from the field’s inceptive works [7,8], analytical formulations [9,10,11,12], and numerical simulations [13,14] to recent experimental works [15,16,17,18,19].
The whole SSI system can be tested using a shaking table to simulate seismic excitation [17,20,21,22]. Centrifuge tests [23,24,25], and forced vibration tests [26,27,28,29,30] are also used to study the SSI system. Shaking table tests and centrifuge tests have some limitations. In shaking table tests, the soil stress level is lower than that of the prototype soil because superstructures can only use small-scale models and the model size creates significant scaling effects, which results in different dynamic responses in the prototype soil and the model soil. By increasing the field acceleration of the model in the centrifuge test, the soil stress level can be simulated as equal to or close to that of the prototype soil. However, most current centrifuge equipment cannot carry out large-scale model tests, so the model size effect in centrifuge tests needs more attention [31]. Forced vibration tests cannot adequately capture the radiation of energy away within the relatively small dimensions of laboratory models (Lisa et al., 2015). There are many cases where seismic loading produced nonlinear SSI responses [25,32,33]. However, the forced vibration field test of shallow foundations did not cause a nonlinear soil response, which led to a substantial change in the soil properties relative to those for small-strain (elastic) conditions. Forced vibration tests are affected by field test conditions.
Given the limited test conditions of these three test methods, there is another alternative test method, the substructure pseudo-dynamic test, which was first proposed in 1985 [34]. The whole system is divided into two coupled parts. One part is called the experimental substructure and is a particularly interesting or strong nonlinear structure in the whole structural system, which can be easily damaged by an earthquake. The rest of the system is called the numerical substructure. At present, many countries and regions have built networked laboratories for substructure pseudo-dynamic tests, for example the network for earthquake engineering simulation (NEES) in America [35,36], the distributed hybrid experiments at Kyoto University in Japan [37,38], the internet-based simulation for earthquake engineering (ISEE) developed by the National Center for Research on Earthquake Engineering (NCREE) in Taiwan [39,40,41,42], and the networked structural laboratories (NetSLab) studied by Hunan University in China [43,44]. A large number of studies have used this method to study structural dynamic responses [45,46], but most studies did not consider the effect of soil–structure interaction. With the development of this test method, few substructure pseudo-dynamic tests referred to the study of soil–structure interaction. A comprehensive pseudo-dynamic hybrid simulation system, Ul-SimCor, was developed to conduct multi-platform hybrid simulation experiments on the soil–foundation–structure interaction system [47], and four analysis platforms (Abaqus, FedeasLab, OpenSees, and Zeus-NL) were integrated into a versatile multi-platform analysis tool. A remotely collaborative substructure pseudo-dynamic test program for beam bridges, which considers soil–pile group interaction, was developed by the NetSLab method. A series of virtual substructure pseudo-dynamic tests on beam bridges were conducted, and the results were compared with the calculation results by SAP2000 [48,49]. Chang and Kim presented a new algorithm for substructure pseudo-dynamic tests to simulate the SSI effect without using a physical soil box [48]. The SSI effect was considered according to numerical analysis, and an experiment for the superstructure mounted on shake tables was performed. The relative response of the superstructure was predicted using a third-order polynomial extrapolation and updated by solving the coupled equilibrium equations.
Some simplified models of soil–structure interaction can be used to analyze the numerical substructure. The swaying-rocking model (SR) presented by Lysmer and Westman [49] sets horizontal springs and rotational springs related to the horizontal displacement of the foundation at the structural base to simulate the movement of soil, in which the input ground vibration of the foundation is only the acceleration response of the foundation surface. It is a relatively simple calculation model, but its main disadvantage is that it cannot reflect the nonlinear problem between the soil and foundation under earthquake input and it is difficult to accurately determine the relevant parameters. McClelland and Focht [50] first proposed the Winkler foundation beam model. The pile is regarded as a beam in a soil medium, and the dynamic impedance of the soil to the pile is simulated by independent springs and dampers with continuous distribution. It is a very effective simplified model to study the dynamic interaction between the soil and piles because of its simplicity, practicality, clarity of physical concepts, and low computational requirements. However, the Winkler foundation beam model also has certain limitations, as the coefficient of spring and damper and the volume of soil involved in vibration have not been well solved. Therefore, many scholars have developed improvements based on the assumptions of the Winkler foundation beam model, and one of the most widely used is the Penzien model [51]. The model can reflect the essential mass, stiffness, damping, non-uniformity, and nonlinearity of the layered soil characteristics in the soil and pile interaction, but the parameter determination in the model is complex. The model finds it difficult to deal with complex terrain, and the nonlinearity of soil is calculated by an approximate method. Calculation models for adjacent structures and only a structure with piled foundations considering PSSI (pile-soil-structure interaction) were established based on the Penzien model regarding the effects of PSSI on vibration control. Researchers [52,53,54] used the Penzien model to build the integral finite-element model of a long-span cable-stayed bridge to analyze the long-period seismic response of the bridge on the soft foundation. The PSSI model did not consider the dynamic nonlinearity of soil. An improved Penzien model by Clough and Penzien [55] was utilized to simulate the soil–pile interaction effect considering the dynamic characteristics of the soil–pile system [56]. In the improved model, the horizontal spring stiffness between the piles and the layered soils was calculated using Winkler’s assumption and the Mindlin formula. The vertical equivalent shear modulus and the equivalent damping of the layered soils were simulated by the computer program SHAKE91 [57].
Shaking table tests, forced vibration tests, and centrifuge tests require excellent experimental equipment and lab and site conditions, and their applications in many laboratories have been limited. Most research using the substructure pseudo-dynamic tests studied the seismic performance of the bridge structures, and few scholars studied the building structures. Scholars have also studied substructure pseudo-dynamic test systems, for example NEES, ISEE, NetSLab, and Ul-SimCor, but these systems cannot be replicated and promoted in most general laboratories, and most researchers have difficulty using these systems in research. In the analysis of soil–pile–structure interaction (SPSI), the most basic problem is to correctly describe the mechanical state of the soil near the piles and to consider the influence of SPSI on the structural mechanical behavior. In these substructure pseudo-dynamic tests considering the dynamic interaction between soil and structure, the soils in most tests were linear and the dynamic nonlinearity of the soil was not considered. The calculation method of the numerical substructure is also very important in the substructure pseudo-dynamic test. This paper mainly presents a substructure pseudo-dynamic test method for building structures considering the soil–pile–structure interaction with the pile group, which is relatively easy to do in most laboratories. An improved Penzien model that combines the finite element software ANSYS is presented in this paper, and the shear deformation and dynamic nonlinearity of soil around piles are considered. The pile group foundation is integrated into a single pile, and the dynamic nonlinearity of the soil under earthquake excitation is simulated by ANSYS. The improved Penzien model is then used as a simplified calculation model of the numerical substructure for substructure pseudo-dynamic testing considering the interaction between soil and structure.

2. Improved Penzien Model

2.1. Model Details

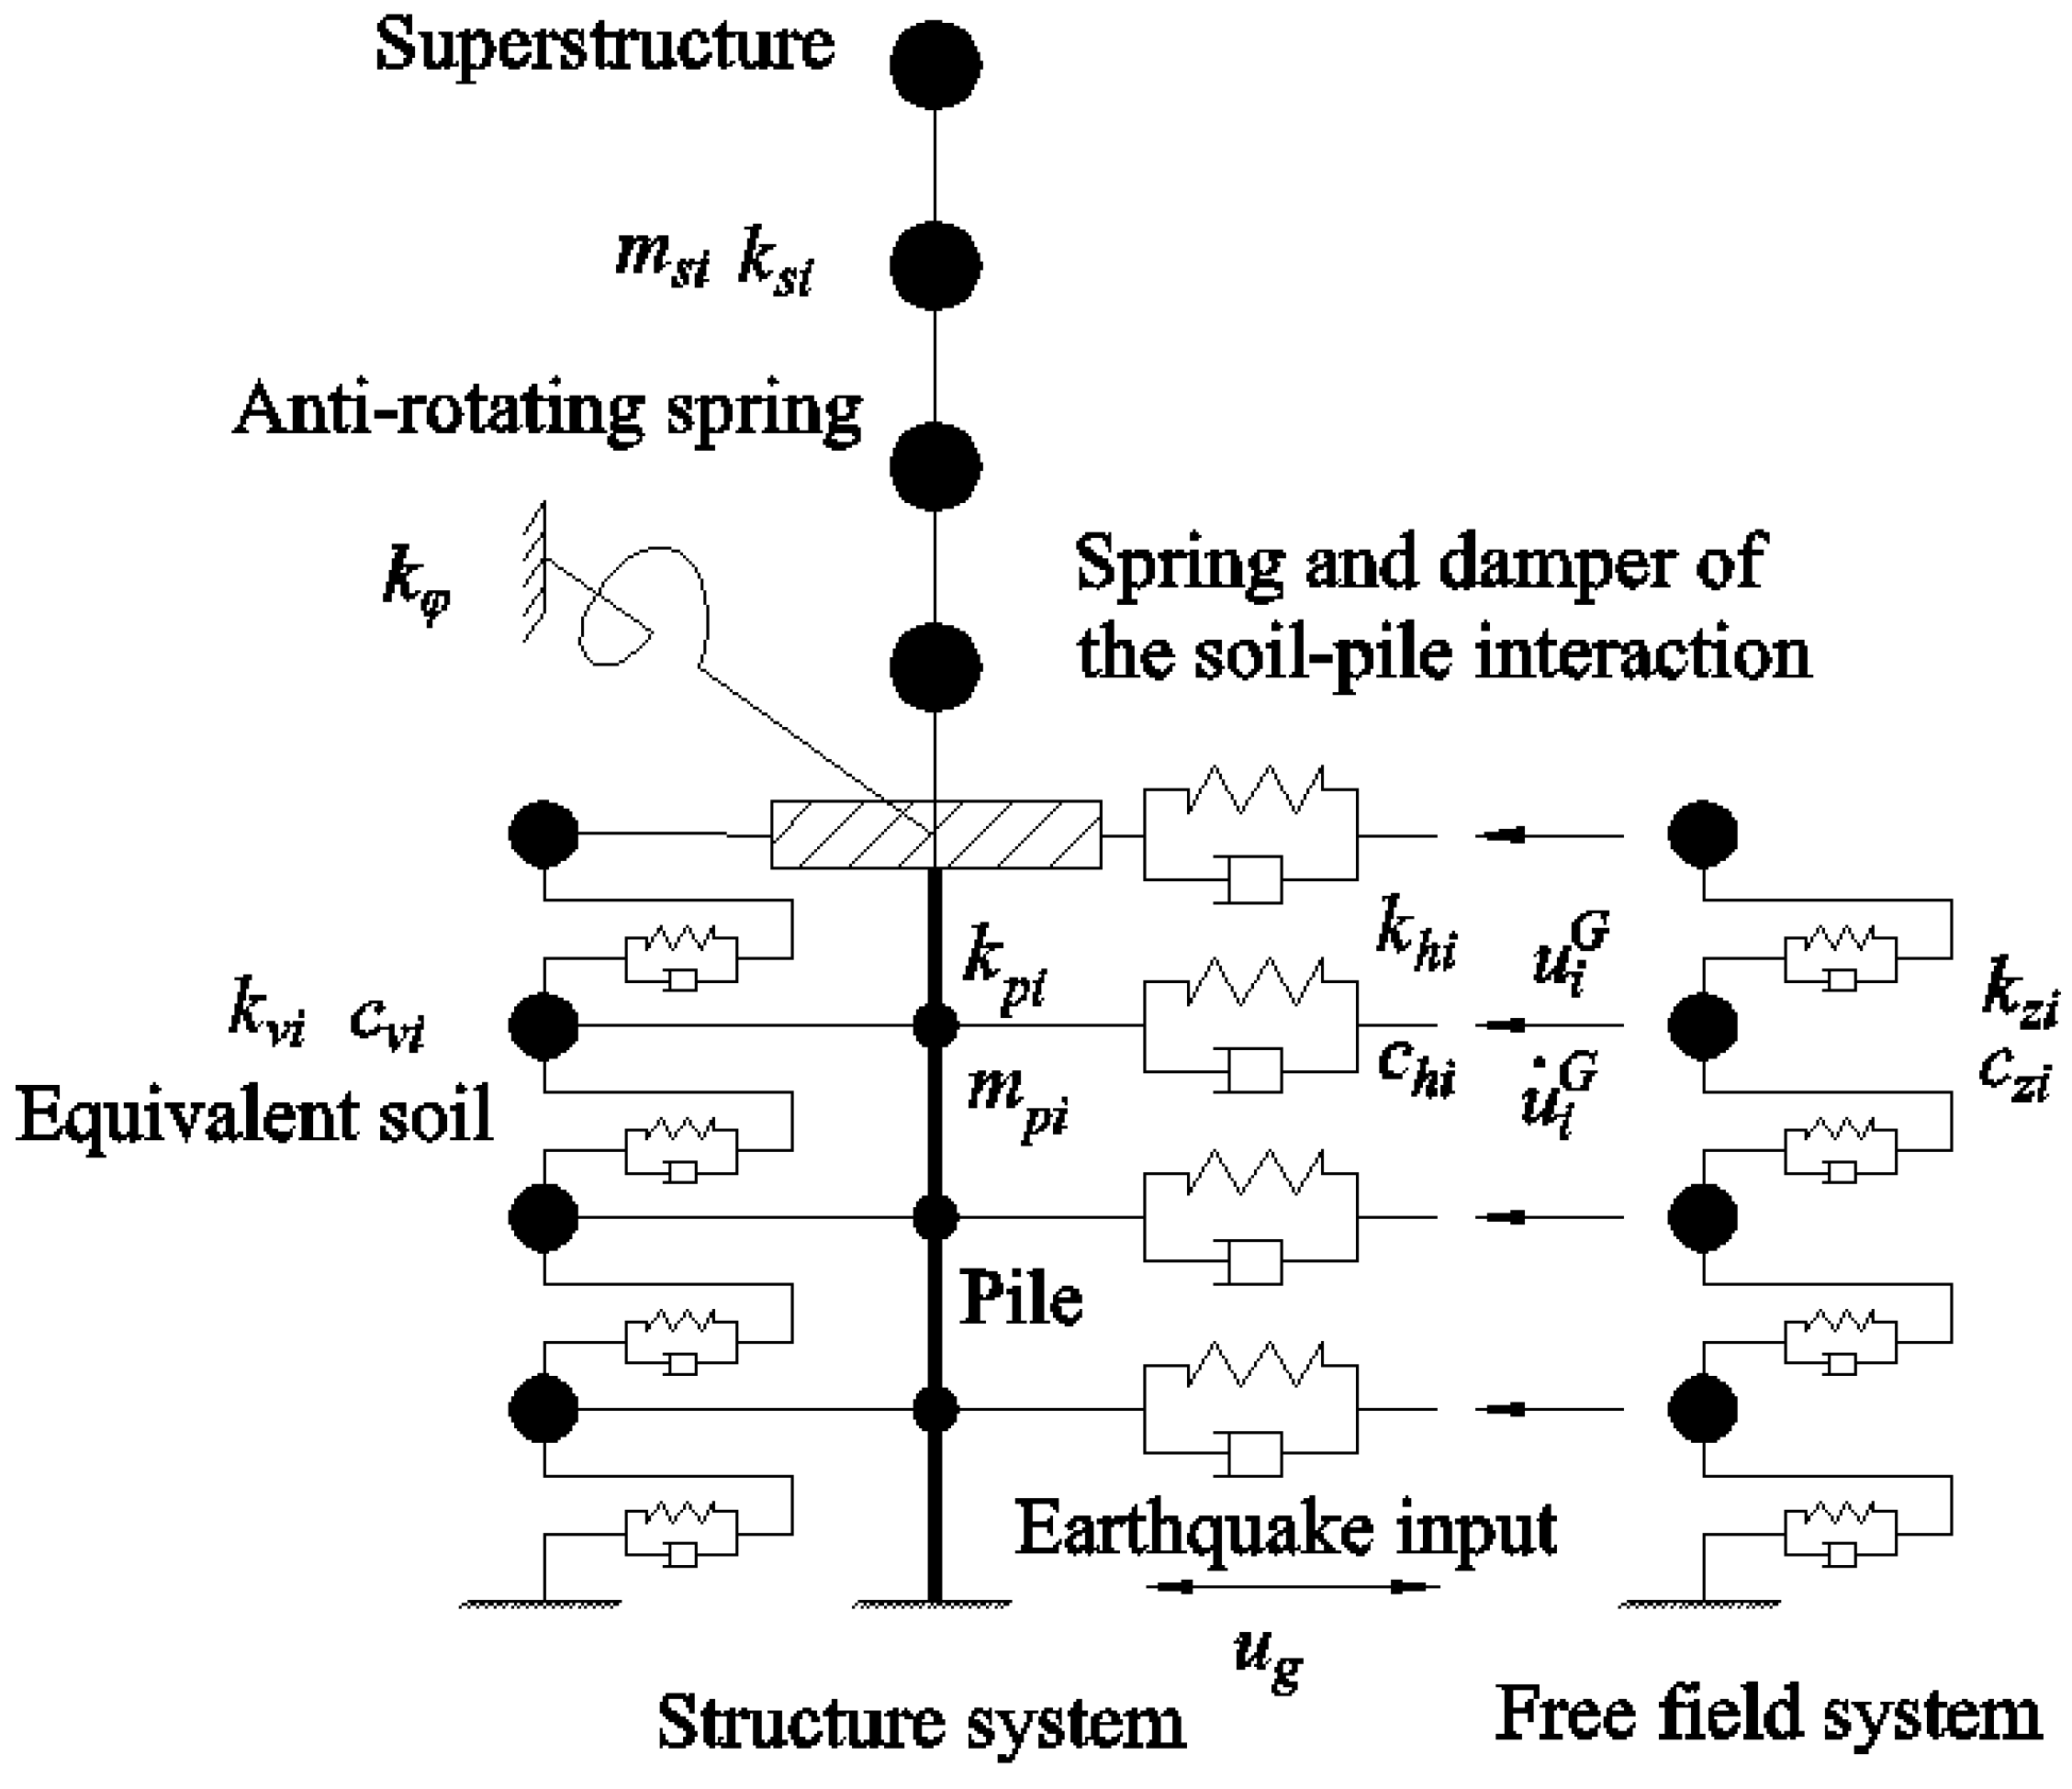
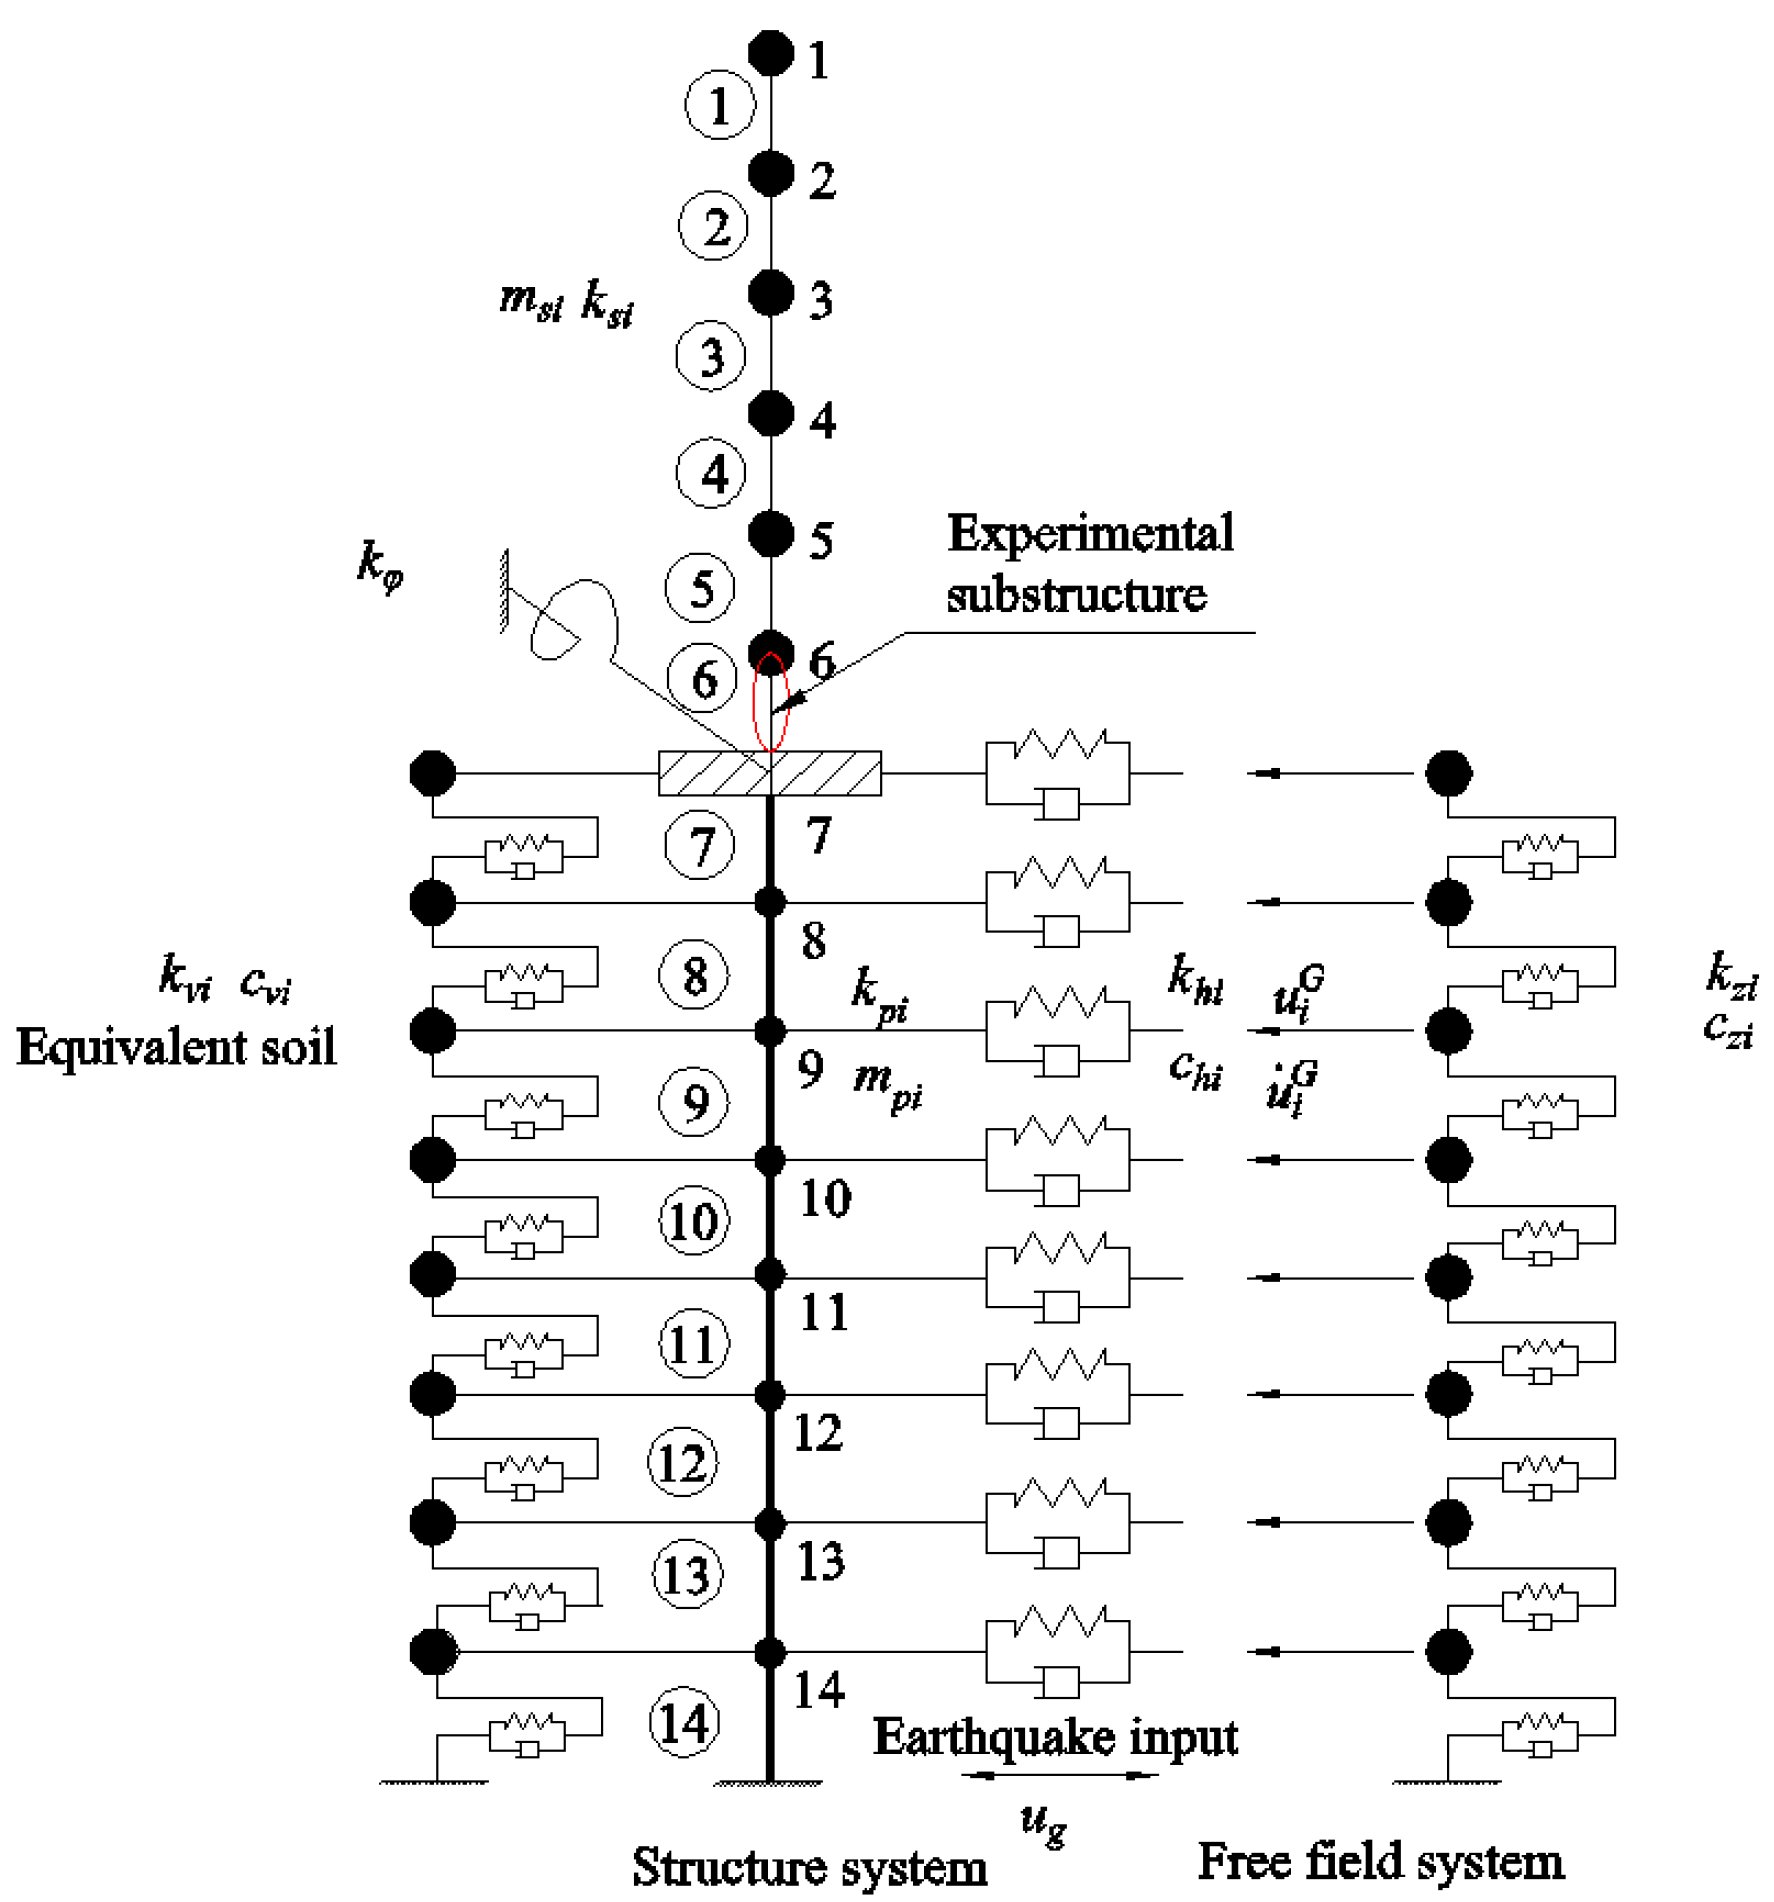
The Penzien model is composed of the superstructure, pile, and equivalent soil, as shown in Figure 1 [51]. The soil is divided into different layers according to its properties, and the masses of the soil layers are concentrated at the interfaces of each soil layer. The model simplifies the superstructure and piles into a series-wound multi-mass system. All piles are combined into one pile, and an equivalent rotational spring is added to the pile head to replace the anti-rotational stiffness of the original pile foundation. The pile foundation is divided into several elements according to the soil layers. The mass of the pile is concentrated at the interface of each horizontal soil layer. The effect of additional soil mass is simulated by the additional mass directly connected to the pile. The interaction between the soil and pile is represented by the horizontal springs and dampers of the soil–pile interaction. The horizontal ground motion displacement of each layer of the free field is input at the other end of the horizontal spring and damper.
In the improved Penzien model, the additional soil mass is given a more specific physical meaning, as shown in Figure 2. The soil around the pile in a certain range is considered attached to the pile, and they move together. Yang’s [58] results showed that the response of the structure in taking one time the area of the pile cap as the additional soil area is almost the same as that in taking 10 times the area of the pile cap. Thus, in the improved model, the range of the soil around the pile is taken as one times the area of the pile cap. The soil around the pile is called the equivalent soil, to which shear springs and dampers are added. The free field model is added to change the multi-point input problem of the original Penzien model into a dynamic response problem in the relative coordinate system input only by the bedrock, in which the coordinate origin of the coordinate system is at the bottom of the pile. The relative coordinate system makes the calculation easier. Based on the Penzien model, the following improvements are presented in this paper. The finite element software ANSYS is used to realize the dynamic nonlinearity simulation of the soil, which is applied to the free field mass system [59,60]. The improved Penzien model is composed of two parts: the structure system, including the superstructure, the pile, and the equivalent soil; and the free-field system. The free field is represented by the soil column per unit area, and the free-field system is simplified into a shear mass system. The site soil is divided into different horizontal soil layers according to their properties, and the soil masses are concentrated at the interface of each soil layer. The superstructure, the pile, and the interactions between the soil and pile are the same as in the previous Penzien model. The improved Penzien model is used as the analytical model for the soil–pile–structure interaction based on the following assumptions:
  • Only the horizontal translational degrees of the foundation soil and the free field are considered.
  • Vertical and torsion effects of the structure are not considered.
  • The pile foundation under the bearing pile cap maintains synchronous movement and can be combined.
  • The interactions between pile groups are ignored.
The motion equation of the improved Penzien model is as follows:
M U ¨ + C U ˙ + K U = M U ¨ g + C h U ˙ G + K h U G
where U , U ˙ , and U ¨ denote the displacement, velocity, and acceleration vectors of the structure system, respectively. U G and U ˙ G are the displacement and velocity vectors of the free-field system, and they are obtained by the ANSYS finite element model. M, C, and K are the mass, damping, and stiffness matrixes of the structure system, respectively. K h and C h refer to the stiffness and damping matrixes of soil and pile interaction, respectively. U ¨ g is the input earthquake acceleration.
ANSYS was used to calculate the dynamic response of the free field. The acceleration vector of the free field is obtained and then substituted into Equation (1). In the calculation process, the dynamic shear modulus and damping ratio of the soil after each time step can be calculated, and then the stiffness and damping of the soil can be calculated for the substructure pseudo-dynamic testing. The calculation of the free field and the parameter determination of the improved Penzien model are described in detail below.

2.2. Dynamic Response of the Free Field

2.2.1. Equation of Motion

In the improved Penzien model, the motion of the pile foundation is caused not only by the inertial force of the structural system but also by the motion of the free field. Before analyzing the seismic response of the structure system, it is necessary to analyze the seismic response of the free field and solve its motion equation. The dynamic equation of the free field is as follows:
M G U ¨ G + C G U ˙ G + K G . U G = M G U ¨ g
where U G , U ˙ G , and U ¨ G denote the displacement, velocity, and acceleration vectors of the free-field system, respectively. M G , C G , and K G are the mass, damping, and stiffness matrixes of the multi-mass system of the free field, respectively. The soil column per unit area can be calculated according to the shear multi-mass system because of the soil deformation caused by the shear deformation, and the shear stiffness and damping of soil can be considered by connecting springs and dampers between the soil layers. The displacement and velocity of the free field calculated by Equation (2) are applied to Equation (1).

2.2.2. Dynamic Nonlinearity Model of Soil

The site soil has strong nonlinear properties, and the dynamic nonlinearity of the site soil was simulated using an equivalent linear model first presented by Seed [61,62]. The soil in the model is a viscoelastic medium, and the equivalent shear modulus G and equivalent damping ratio D are used to express the basic characteristics of the relationship between dynamic stress and dynamic strain. G and D are expressed as functions of the dynamic strain. Hardin and Drnevich [63] improved the soil model through experiments and first presented the empirical relationship in the prediction Gd/Gmax~γd, the Hardin–Drnevich model. The equations are shown in Equations (3)–(5).
G d G max = 1   -   H γ d
where
H γ d = γ d / γ r 1 + γ d / γ r
γ r = τ max / G max
Gd, Gmax, γd, and γr denote the dynamic shear modulus, maximum dynamic shear modulus, dynamic shear strain, and reference shear strain, respectively. Gmax is determined according to Equation (6). When γd is large enough, the ultimate value of the soil shear strength as the asymptotic line is taken as τmax. In general, τmax is the value when γd is 0.1%.
G max = ρ v s 2
where ρ and v s are the density and shear wave velocity of the soil.
Martin [64] and Martin and Seed [65] improved the Hardin–Drnevich model and proposed a formula to better describe the relationship between the shear stress and the shear strain in soil. The soil model is called the Davidenkov foundation model. The Davidenkov model has been applied to the dynamic nonlinearity simulation of soil in the shaking table test considering the interaction between the soil and structure [59,60,66,67], and the accuracy of the model to simulate the soil nonlinearity was proven. Equation (4) was improved and is shown in Equation (7).
H ( γ d ) = γ d / γ 1 2 B 1 + γ d / γ 1 2 B A
where A, B, and γ1 are the fitted parameters according to the soil characteristics. γ1 is no longer the reference shear strain in Equation (5) and denotes only a fitted parameter here. When A and B are equal to 1.0 and 0.5, respectively, the equations in the Davidenkov foundation model are the same as those in the Hardin–Drnevich model.
The empirical damping ratio formula proposed by Chen [68] is used to express the relationship between the damping ratio and shear modulus ratio, as shown in Equation (8).
D / D max = 1 G d G max β
where Dmax and D are the maximum damping ratio and damping ratio, respectively, and β denotes a shape factor of the curve D~γd. Further, Equation (8) is modified as follows.
D = D min + D 0 1 G d G max β
where Dmin, D0, and β are fitted parameters according to the soil characteristics.

2.2.3. Calculation Process of Soil Dynamic Nonlinearity

The stiffness and damping of each soil layer of the free field in the improved Penzien model are calculated as follows.
k z i = G i A f h i
c z i = 2 D i ω k z i
where Af and ω represent the soil area and fundamental frequency of the free field, respectively. Af is equal to the soil area of the free field in the ANSYS finite element model. Gi, Di, and hi are the dynamic shear modulus, the damping ratio, and the thickness of the soil layer i, respectively. Gi and Di are obtained from the results of the ANSYS finite element model of the free field by the following calculation process.
Ge et al. [68] used the finite element model of a shaking table test to verify the accuracy of the Davidenkov foundation model used in the ANSYS software to simulate the dynamic nonlinearity of soil. The results of the shaking table test were in good agreement with those of the numerical model. Therefore, the Davidenkov model used in this paper is well-proven. The calculation formulas of the stiffness and damping of the soil in the improved Penzien model can be obtained by substituting the calculation results from ANSYS into Equations (10) and (11). Thus, the dynamic nonlinearity simulation of soil is realized in the improved Penzien model. The calculation process of the soil dynamic nonlinearity is as follows: firstly, the initial dynamic shear modulus Gi and the initial damping ratio Di are substituted for the initial analysis. Enter the post-processor and the average shear strain of soil is calculated. The dynamic shear modulus Gi+1 and the initial damping ratio Di+1 are then calculated using Equations (3), (6), (7), and (9), which are the relationship equations between the dynamic shear modulus and shear strain, and between the damping ratio and shear strain. Thirdly, the dynamic shear modulus Gi+1 and damping ratio Di+1 are used for the restarting analysis based on the previous analysis. Another dynamic shear modulus and damping ratio are calculated again through Equations (3), (6), (7), and (9). The two groups of the dynamic shear modulus and the damping ratio are compared with each other until the differences between the two rounds of before-and-after calculations are within the permissible values. Fourthly, the average dynamic shear model and damping ratio of each soil layer in this time step are obtained, and the stiffness and damping of each soil layer in the Penzien model are then calculated using Equations (10) and (11). The iteration step stops and the following step then starts, repeating the above calculation process until the earthquake input is completed. The calculation flowchart is shown in Figure 3.

2.3. Parameter Determination of the Improved Penzien Model

This section mainly describes the parameter determination methods for the stiffness and damping of the horizontal spring of the interaction between the soil and pile, the stiffness and damping of the equivalent soil system, and the bending stiffness of the pile cap in the Penzien model.

2.3.1. Stiffness and Damping of Soil–Pile Interaction

Penzien thought that Winkler’s hypothesis was correct by analyzing the half-space theory, so the average displacements of the pile planes at different depths under the horizontal unit force can be solved according to the Mindlin formula, and then the reciprocal is the horizontal spring stiffness of the interaction between soil and pile in each soil layer [51]. The calculation formula for khi is as follows:
k h i = 8 π E i 3 2 3 r 2 r 2 h i 2 r 2 z i + h i z i 2 + z i 3 r 2 + h i + z i 2 1 2 z i 3 2 r 2 z i ( r 2 + z i 2 ) 1 2 + arsinh h i z i r + arsinh h i + z i r 2 3 z i h i r 2 + h i z i 2 1 2 z i r 2 + z i 2 1 2 + r 2 z i + h i z i 2 + z i 3 r 2 + h i + z i 2 3 2 r 2 z i + z i 3 r 2 + z i 2 3 2 1
r = 64 I u π 4
where Ei, hi, and zi are the elastic modulus, the soil thickness, and the vertical distance from the soil center to the soil surface of the soil layer i, respectively. r denotes the equivalent inertia radius of the equivalent single pile. Iu is the sum of the inertia moments of all the single piles.
The method proposed by Lysmer et al. [69] is used to determine the damping coefficient, and the viscous damper is used to simulate the radiation damping of the wave energy dissipating to the semi-infinite site soil. The method is used to simulate the horizontal damping of the interaction between the soil and pile, and the damping chi of the interaction between the soil and pile in soil layer i is calculated by Equations (14) and (15).
c h 1 = 2 r h 1 ρ 1 v p 1 + v s 1
c h i = 2 r h i ρ i v p i + v s i + h i + 1 ρ i + 1 v p i + 1 + v s i + 1
v p i = λ i + 2 G i / ρ i
v s i = G i / ρ i
λ i = μ i E i / 1 + μ i 1 2 μ i
where vpi, vsi, and μ represent the longitudinal wave velocity, shear wave velocity, and Poisson’s ratio of the soil layer I, respectively. Gi and ρi are the shear moduli and the density of soil, respectively, and λi is the Lame coefficient.

2.3.2. Stiffness and Damping of the Equivalent Soil System

To use an idealized model to more reasonably reflect the motion of the foundation soil near the piles in an actual soil and pile interaction system, and quantitatively determine the mass of the equivalent soil system, Penzien [51] put forward the energy equivalent principle to determine the mass of the equivalent soil system. Namely, under earthquake excitation, the produced motion energy of the actual boundary soil near the piles relative to the natural ground movement was equal to the motion energy of the equivalent mass in the same motion. The following formula was obtained.
m e i = h h + + 1 3 ψ u 2 + ψ v 2 + ψ w 2 ρ i d x d y d z
where ψu = ψu(x,y,z), ψv = ψv(x,y,z), and ψw = ψw(x,y,z) are the displacement fields of the soil in the three directions x, y, and z under the interaction of the pile groups, which are determined by the Mindlin solution for an elastic half-space. h is the thickness of the soil.
However, in practical analysis, Equation (19) is too complicated and contains two infinite integrals, so the calculation is too complex. In practical application, an empirical formula is often used to calculate the mass of the equivalent soil; that is, the mass of the equivalent soil is assumed to be the mass of the same area as the area of the pile cap and the same thickness as the actual thickness of soil layer. Therefore, the calculation formula for the mass of the equivalent soil is shown in Equation (20).
m v i = ρ i A h i
The interlayer shear stiffness of the equivalent soil system is determined by Equation (21). The damping of the equivalent soil system adopts proportional stiffness damping, and its calculation formula is given in Equation (22).
k v i = G i A h i
c v i = 2 D i ω k v i

2.3.3. Bending Stiffness of Pile Cap

The improved Penzien model adopts combined piles, so it is necessary to add a bending resistance spring in the center of the pile cap. Assuming that the pile cap has a unit angle of rotation (φ = 1) in the plane, the axial force of each pile acts on the platform to form a bending resistance stiffness kφ.
k φ = i = 1 Q x i N i = i = 1 Q x i E b A b l x i = E b A b l i = 1 Q x i 2
where Q, Ab, and Eb represent the number of the single pile, the section area of the single pile, and the elastic modulus of piles, respectively. Ni is the axial force of the single pile i. xi is the horizontal projection of the distance from the axis of the single pile i to the center of the pile cap. l denotes the distance between the bottom of the pile cap and the fixed end of the pile.

3. Matrix of the Improved Penzien Model

3.1. Mass and Stiffness Matrixes of Pile Group

3.1.1. Mass Matrix of Pile Group

The lumped mass matrix is adopted to distribute the mass of the beam elements evenly to the nodes. The mass matrix of the equivalent single pile in section i is as follows:
M p i = m p i L p i 0.5 0 0 0 0 0 0 0 0 0 0.5 0 0 0 0 0
where mpiLpi is the total mass of the equivalent pile element in section i.
The element mass matrix is integrated into the total mass matrix of the equivalent single pile, and the total mass matrix is a 2 × (N + 1)-order matrix, which is divided into partitions as follows.
M P = M p 11 M p 12 M p 21 M p 22
where Mp11 and Mp22 are the mass partition matrixes of the translational degree of freedom and the rotational degree of freedom, respectively. Mp12 and Mp21 are the translational and rotational coupling degrees of freedom. They are as shown in Equations (26) and (27). The horizontal vibration is only considered under horizontal earthquake excitation, so the inertial forces generated by the rotational degrees of freedom of the nodes are ignored. Only the horizontal degree of freedom is considered by means of the static condensation method, and the order of the mass matrix is reduced by half.
M p 11 = 0.5 1 ... 1 1 ... 1 0 ( N + 1 ) × ( N + 1 )
M P 12 = M p 21 = M p 22 = 0 0 0 0 0 ... 0 0 0 0 0 0 ... 0 0 0 0 0 ( N + 1 ) × ( N + 1 )

3.1.2. Stiffness Matrix of Pile Group

Starting from the basic case of two symmetrical piles in a pile group, the equivalent element stiffness matrix in this case is obtained by superimposing the lateral displacement and the angle of rotation at both ends of the element. This is then extended to the case of a pile group with n symmetrically arranged piles [70]. The relationship between the force and displacement of the pile group in section i can be obtained as follows.
V i M i V j M j = 12 a i 6 a i l i 12 a i 6 a i l i 6 a i l i b i 6 a i l i c i 12 a i 6 a i l i 12 a i 6 a i l i 6 a i l i c i 6 a i l i b i u i θ i u j θ j
a i = n E p I p 1 + ϕ i l i 3
b i = 4 + ϕ i n E p I p 1 + ϕ i l i + E p J p l i
c i = 2 ϕ i n E p I p 1 + ϕ i l i E p J p l i
J p = k = 1 n A p r k 2
ϕ i = 12 E p I p η G p A p l i 2
where Vi and Vj are the shear forces at both ends of the equivalent pile element, respectively. Mi and Mj denote the bending moments at both ends of the equivalent pile element, respectively. ui and uj represent the displacements at both ends of the equivalent pile element, respectively, and θi and θj are the angles of rotation at both ends of the equivalent pile element, respectively. a, b, and c are the replacement parameters in order to simplify the matrix form. li is the length of the equivalent pile element in section i. n, Ep, Ip, Ap, rk, and Gp denote the total number of piles, the elastic modulus of the equivalent pile element, the inertia moment of a single pile, the area of a single pile, the distance from the section core of the pile k to the neutral axis of the pile cap, and the shear modulus of the equivalent pile element, respectively. η is the coefficient of uneven distribution of shear stress at the pile section. Ignoring the shear strain, η is equal to 0. η is 10/9 and 1.2, when the pile section is circular and rectangular, respectively.
Assuming that the pile cap is rigid, the equivalent single pile integrated by the pile group is divided into N elements according to the soil layer. The equivalent element stiffness matrix of the equivalent single pile is formed for each element, and the total stiffness matrix of the equivalent single pile is then formed after integrating the element stiffness matrixes of the N elements. The total stiffness matrix Kp of the equivalent single pile is a 2 × (N + 1)-order matrix, and the equations of the force and displacement of the equivalent single pile are as follows.
V M = K p u θ = K p 11 K p 12 K p 21 K p 22 u θ
V = V 1 , V 2 , V 3 ........ V N + 1 T
M = M 1 , M 2 , M 3 ......... M N + 1 T
u = u 1 , u 2 , u 3 ......... u N + 1 T
θ = θ 1 , θ 2 , θ 3 , ........ θ N + 1 T
K p 11 = 12 a 1 12 a 1 12 a 1 12 a 1 + 12 a 2 12 a 2 ... ... ... 12 a i 1 12 a i 1 + 12 a i 12 a i 12 a i 12 a i + 12 a i + 1 12 a i + 1 ... ... ... 12 a N 1 12 a N 1 + 12 a N 12 a N 12 a N 12 a N
K p 12 = 6 a 1 l 1 6 a 1 l 1 6 a 1 l 1 6 a 1 l 1 + 6 a 2 l 2 6 a 2 l 2 . . . . . . . . . 6 a i 1 l i 1 6 a i 1 l i 1 + 6 a i l i 6 a i l i 6 a i l i 6 a i l i + 6 a i + 1 l i + 1 6 a i + 1 l i + 1 . . . . . . . . . 6 a N 1 l N 1 6 a N 1 l N 1 + 6 a N l N 6 a N l N 6 a N l N 6 a N l N
K p 21 = 6 a 1 l 1 6 a 1 l 1 6 a 1 l 1 6 a 1 l 1 + 6 a 2 l 2 6 a 2 l 2 . . . . . . . . . 6 a i 1 l i 1 6 a i 1 l i 1 + 6 a i l i 6 a i l i 6 a i l i 6 a i l i + 6 a i + 1 l i + 1 6 a i + 1 l i + 1 . . . . . . . . . 6 a N 1 l N 1 6 a N 1 l N 1 + 6 a N l N 6 a N l N 6 a N l N 6 a N l N
K p 22 = b 1 c 1 c 1 b 1 + b 2 c 2 ... ... ... c i 1 b i 1 + b i c i c i b i + b i + 1 c i + 1 ... ... ... c N 1 b N 1 + b N c N c N b N
Considering only the horizontal vibration under horizontal earthquake excitation, the whole stiffness matrix needs to be condensed. The specific steps are as follows. The equation of motion of the equivalent single pile is shown as follows:
M p 11 M p 12 M p 21 M p 22 u ¨ θ ¨ + C p 11 C p 12 C p 21 C p 22 u ˙ θ ˙ + K p 11 K p 12 K p 21 K p 22 u θ = M p 11 M p 12 M p 21 M p 22 u ¨ g 0
where Cp11, Cp12, Cp21, and Cp22 are the damping matrixes of the translational degree of freedom, the translational and rotational coupling degree of freedom, the translational and rotational coupling degree of freedom, and the rotational degree of freedom of the equivalent single pile, respectively.
Considering only horizontal earthquake excitation, Equation (43) can be simplified to:
M p 11 0 0 0 u ¨ θ ¨ + C p 11 0 0 0 u ˙ θ ˙ + K p 11 K p 12 K p 21 K p 22 u θ = M p 11 0 0 0 u ¨ g 0
By expanding Equation (44), Equations (45) and (46) can be obtained:
M p 11 { u ¨ } + C { u ˙ } + K p 11 u + K p 12 θ = M p 11 { u ¨ g }
K p 21 · u + K p 22 θ = 0
Equation (46) can be transferred to:
θ = K p 22 1 K p 21 u
Substitute Equation (47) into Equation (46) to get:
M p 11 { u ¨ } + C { u ˙ } + K p 11 K p 12 · K p 22 1 · K p 21 · u = M 11 { u ¨ g }
Therefore, the stiffness matrix of the equivalent single pile is:
K p 11 = K p 11 K p 12 · K p 22 1 · K p 21

3.2. Mass and Stiffness Matrixes of the Superstructure

The superstructure system is simplified into a shear multi-mass system, with the mass concentrated at the height of each layer. Only horizontal vibration is considered, and the influence of rotational degrees of freedom is ignored. The total mass matrix of the superstructure is:
M s = m s n ... m s i ... m s 2 m s 1
where n and msi are the number of layers and the mass of layer i in the superstructure system, respectively.
The stiffness matrix of the superstructure is as follows.
K s = k s , n k s n k s , n k s , n + k s , n 1 k s , n 1 ... ... ... k s , i + 1 k s , i + 1 + k s , i k s , i k s , i k s , i + k s , i 1 k s , i 1 ... ... ... k s , 3 k s , 2 + k s , 3 k s , 2 k s , 2 k s , 2 + k s , 1
Ksi is the shear stiffness of the floor i of the superstructure and is calculated by the following equation.
k s i = i = 1 m α c 12 i c h = i = 1 m α c 12 E I i h 3
For the first floor:
α c = K 2 + K K = i 1 + i 2 + i 3 + i 4 2 i c
For the other floors:
α c = 0.5 + K 2 + K K = i 1 + i 2 2 i c
where αc and ic are the correction factor for column stiffness and the line stiffness of the column, respectively. i1, i2, i3, and i4 are the line stiffness of the beams intersecting with columns. m denotes the number of every floor.

3.3. Mass and Stiffness Matrixes of the Equivalent Soil System

The equivalent soil system is a multi-mass shear model. The mass matrix and stiffness matrix are shown in Equations (55) and (56). mvi and kvi are calculated according to Equations (20) and (21), respectively.
M v = m v n ... m v i ... m v 2 m v 1
K v = k v , n k v , n k v , n k v , n + k v , n 1 k v , n 1 ... ... ... k v , i + 1 k v , i + 1 + k v i k v i k v i k v i + k v , i 1 k v , i 1 ... ... ... k v , 3 k v , 2 + k v , 3 k v , 2 k v , 2 k v , 2 + k v , 1

3.4. Damping Matrix of Structure System

The structure system consists of three parts, namely, the superstructure, the pile group foundation, and the equivalent soil. Due to the differences in the composition materials and properties of the three parts, the substructure method recommended by Chopra [71] is adopted. That is, the damping of each substructure is calculated separately, and then assembled into the whole damping matrix of the structure system. The damping of each substructure uses Rayleigh damping. According to Equation (57), the vibration modes and frequencies of the whole structure system are solved.
K M ω 2 = 0
K = K s K p 11 + K v
M = M s M p 11 + M v
The damping matrixes of the superstructure and pile group are calculated according to the following equations.
C s = α s M s + β s K s
C p = α p M p 11 + β p K p 11
α s = ξ s 2 ω i ω j ω i + ω j
β s = ξ s 2 ω i + ω j
α p = ξ p 2 ω i ω j ω i + ω j
β p = ξ p 2 ω i + ω j
where Cs and Cp are the damping matrixes of the superstructure system and pile group system. αp, βp, αs, and βs denote the Rayleigh damping constants of the superstructure and pile group systems. ωi and ωj are the frequencies of mode i and mode j of the structure system. ξp and ξs represent the damping ratios of mode i and mode j of the pile group system and superstructure systems. Then, the damping matrix of the structure system is:
C = C s C p 11 + C v

4. Substructure Pseudo-Dynamic Test of Soil–Pile–Structure İnteraction

On the basis of the above theoretical analysis, the improved Penzien model was used in the substructure pseudo-dynamic tests. One was a substructure pseudo-dynamic test considering soil–pile–structure interaction (SPSI), and the other did not have the soil and piles without considering SPSI, in which the bottom of the superstructure was fixed. They are named the SPSI model and the No-SPSI model, respectively.

4.1. Experimental Substructure

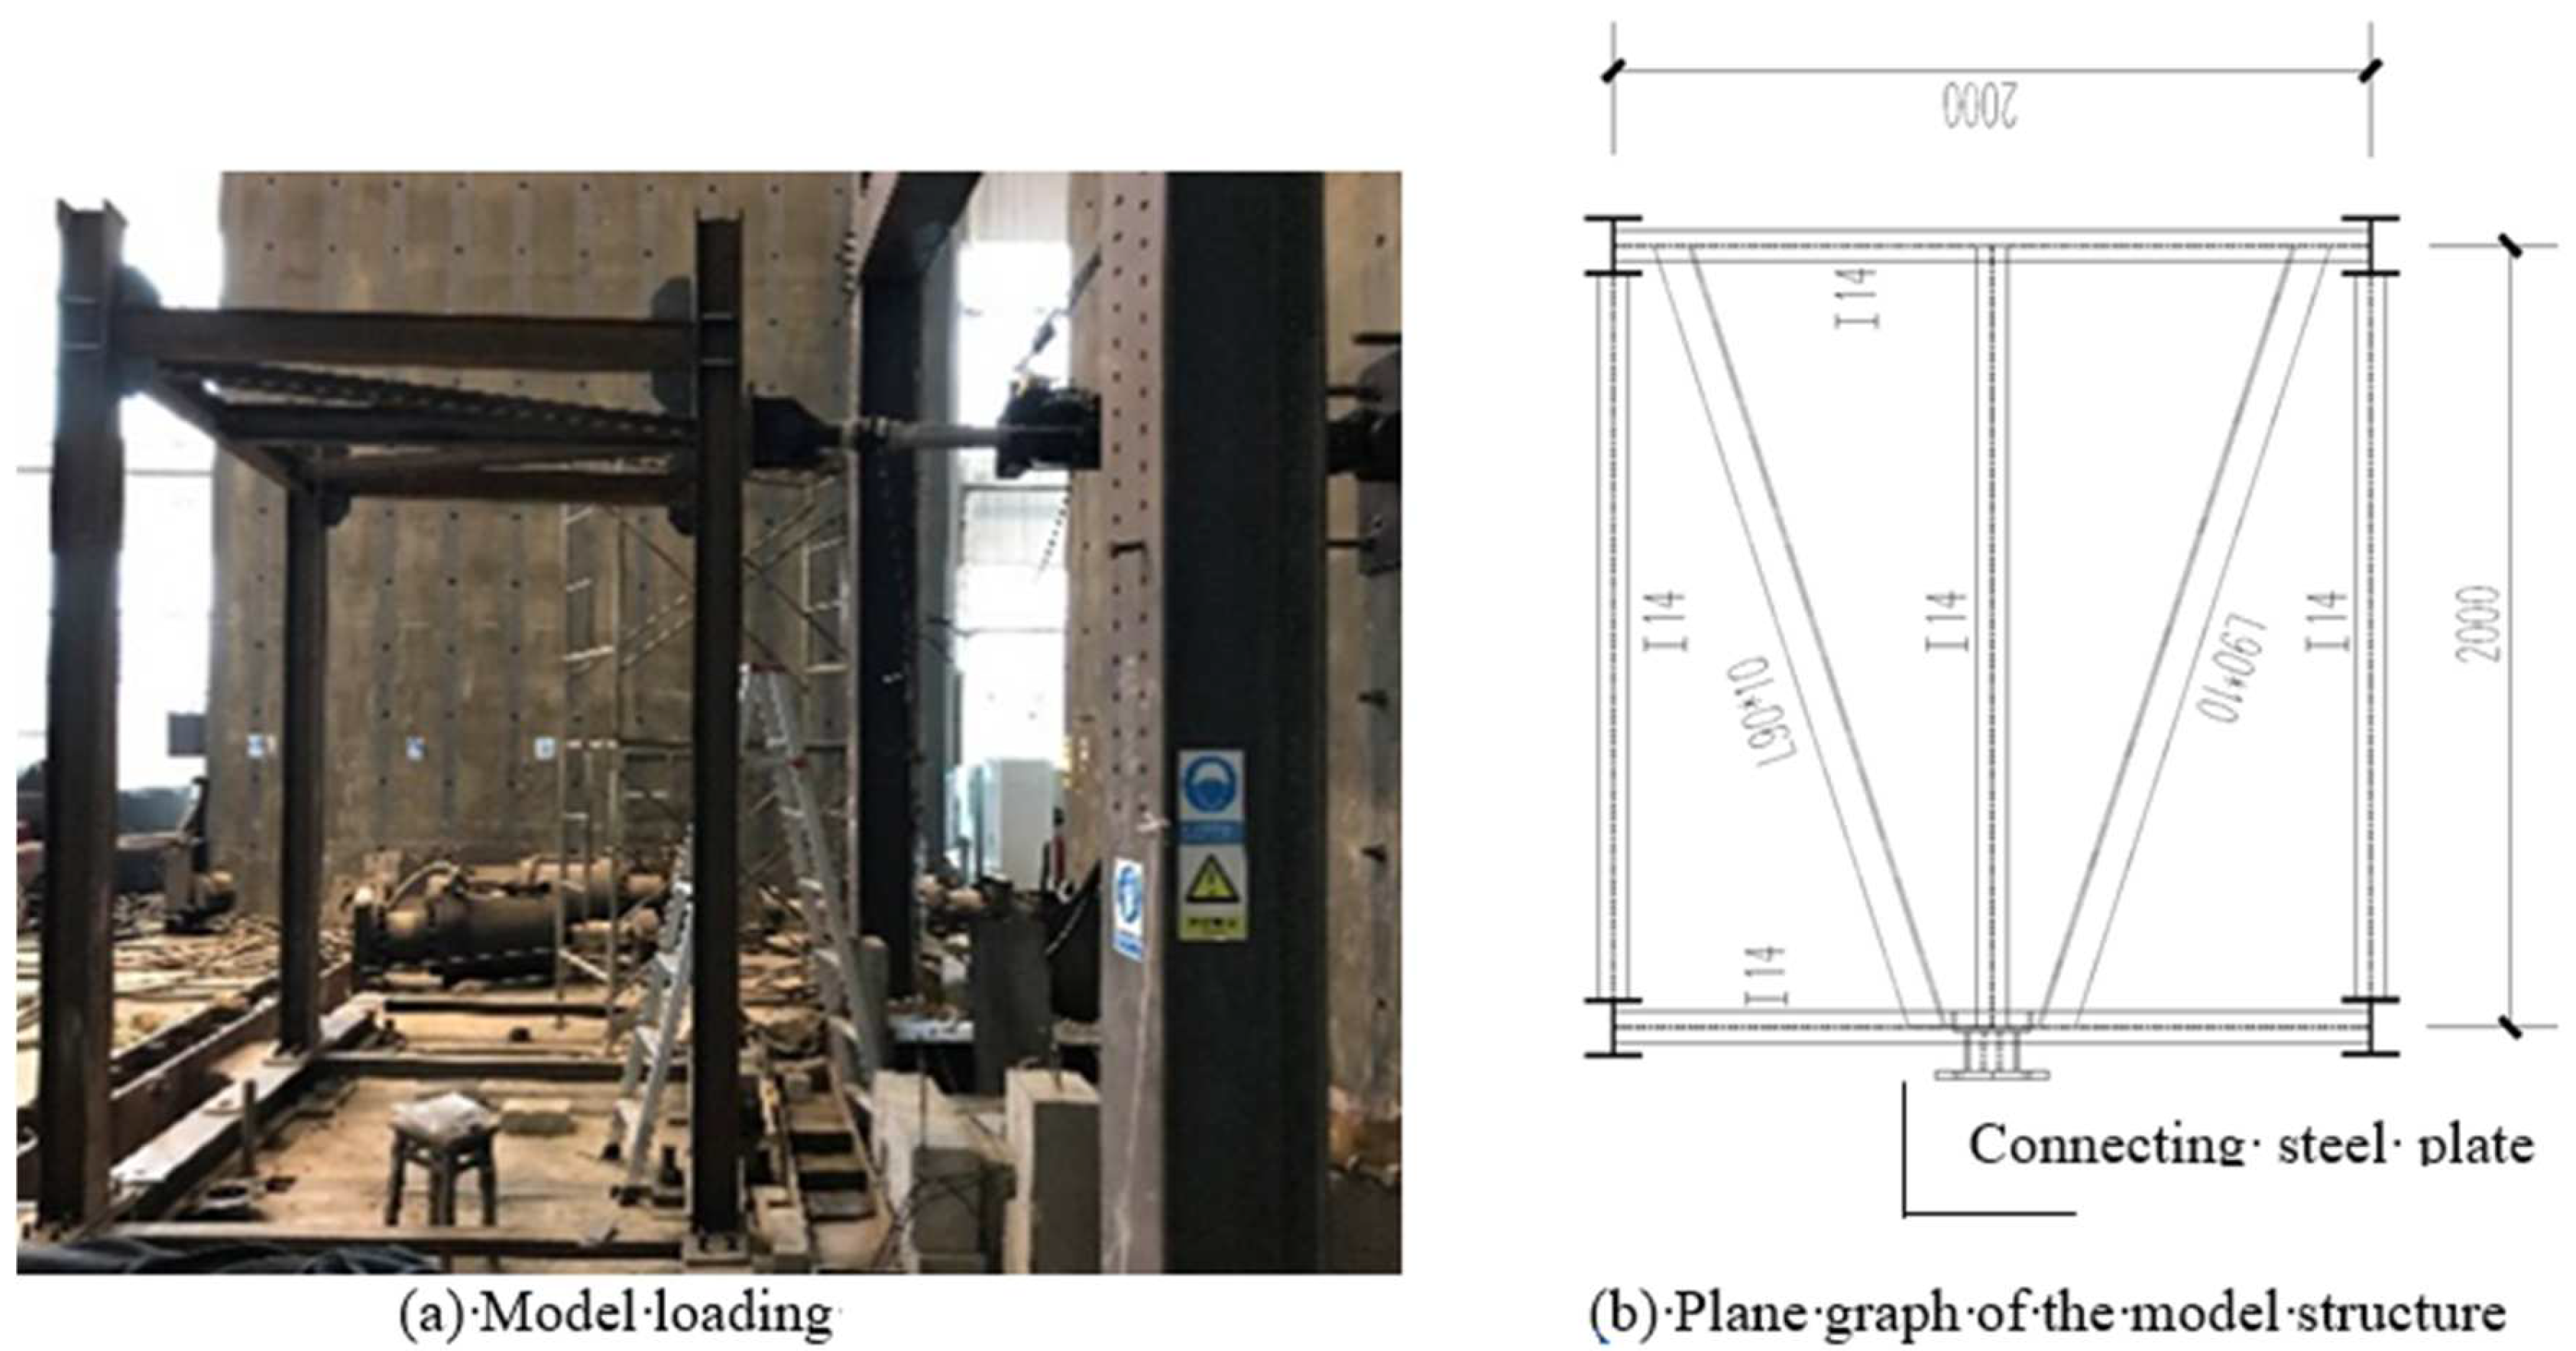
The superstructure was a 6-story steel frame structure. The first floor was used as the experimental substructure, and the other floors and the soil were the numerical substructures. The test model was a frame structure with a design ratio of 1:1, and the test model was a single-story, single-span, single-truss structure. The story height of the structure was 2.6 m, and the spans in both horizontal directions were 2 m. The columns of this model were made from wide flange hot rolled H-section steel with a height of 150 mm, a width of 150 mm, a web thickness of 7 mm, and a flange thickness of 10 mm. The beams were I-section steel with the dimensions 140 mm × 88 mm × 6 mm. The lap steels of each layer were equilateral angle steels with the dimension of 90 mm × 10 mm. The superstructure was made of Q235 steel with a yield strength of 235 MPa and an elastic modulus of 2.06 × 10⁵ MPa. The schematic diagram of the model is shown in Figure 4.
The connection between the actuator and the test steel frame model was located in the middle of the main beam. The test system consisted of the reaction wall, the hydraulic servo loading system, the test model, the displacement sensor, and the MTS793 control system. The actuator was produced by an MTS company in the United States, with an ultimate thrust of 250 KN, a horizontal range of 250 mm, a force accuracy of 0.01 KN, and a displacement accuracy of 0.01 mm. The input motion selected was the El-central earthquake, whose peak acceleration was adjusted to 0.1 g and 0.2 g according to the seismic code [72] corresponding to the seismic fortification intensity of 6 degrees and 7 degrees, respectively. The first 15 s wave of the El-central earthquake including peak acceleration value was selected for a total of 750 steps, and the time step was 0.02 s. The acceleration history of the El-central earthquake is shown in Figure 5.

4.2. Numerical Substructure

4.2.1. Soil Parameters

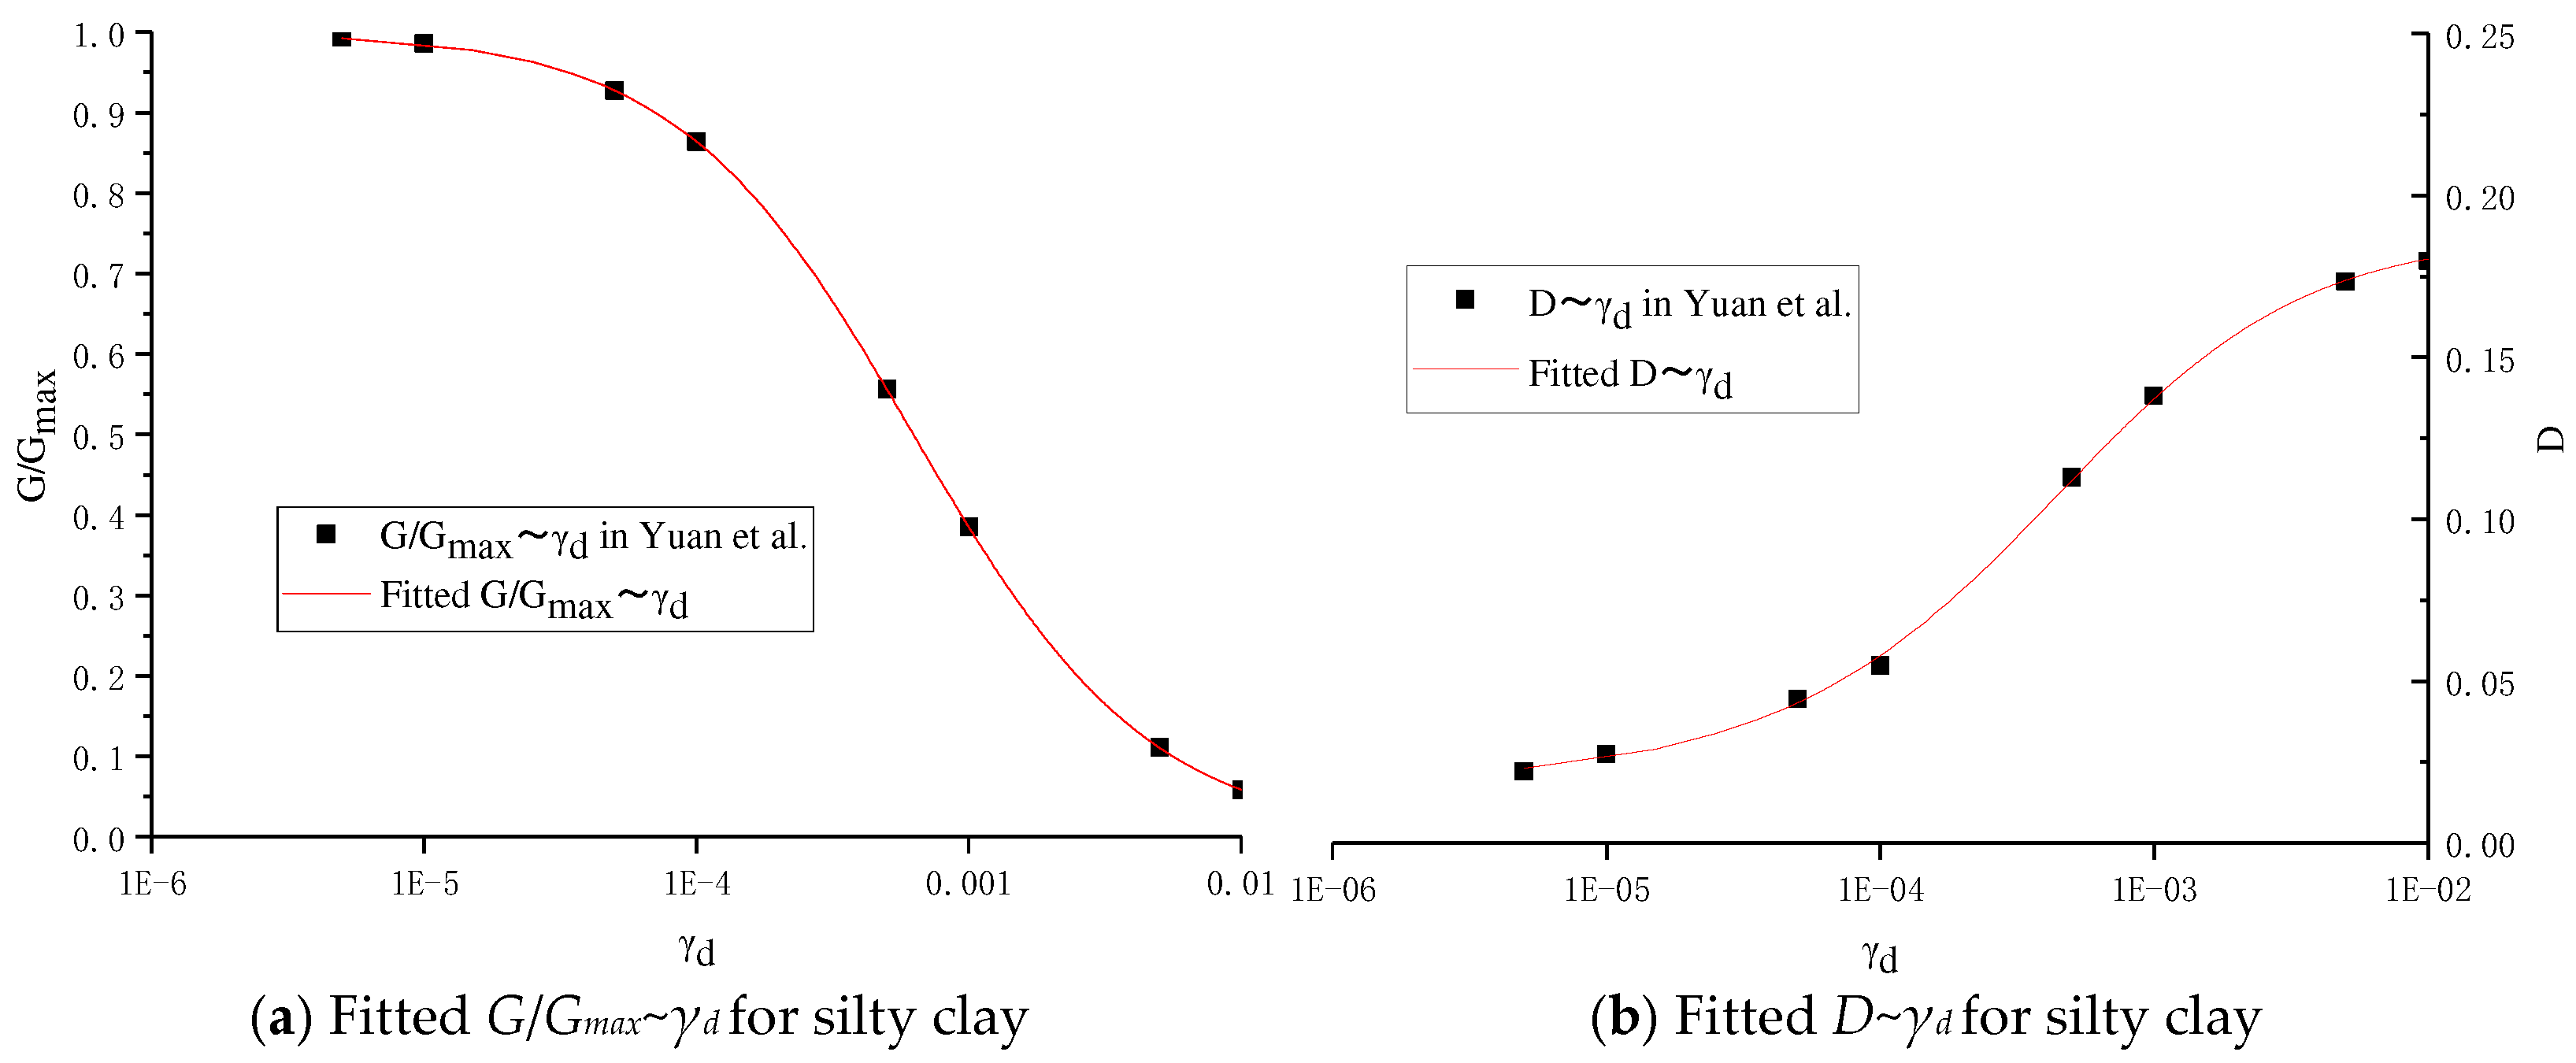
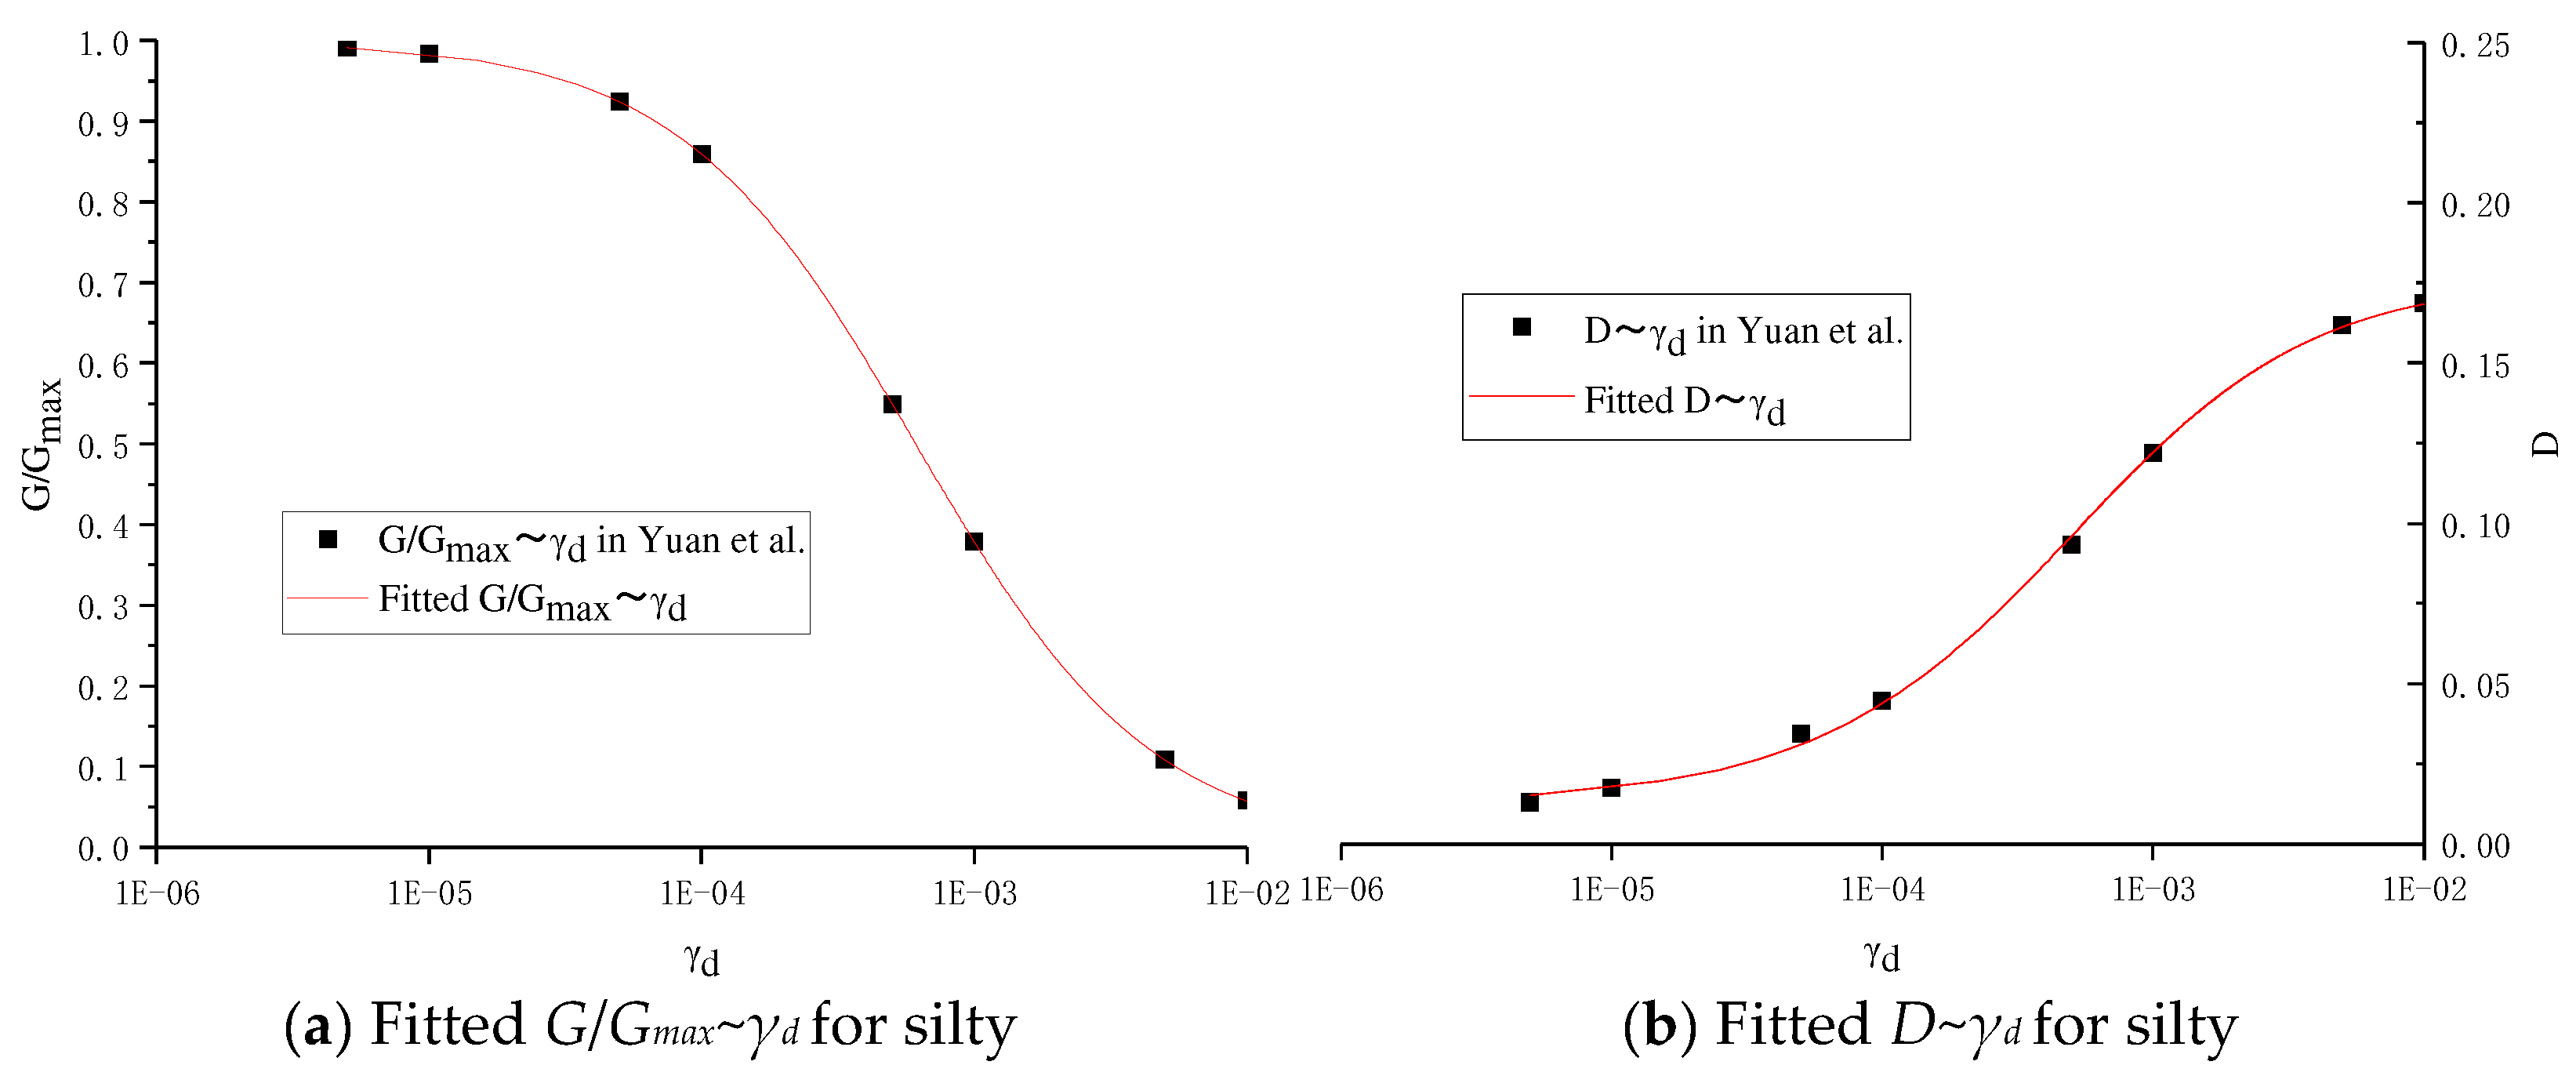
The soil was divided into three layers, consisting of type II site soil. The first layer was clay with a thickness of 4 m, the second layer was silty clay with a thickness of 4 m, and the third layer was silt with a thickness of 8 m. The material parameters of the soil are shown in Table 1. In the MATLAB program, each layer was divided to a height of 2.5 m. Yuan et al. [73] studied the dynamic shear modulus ratio (G/Gmax) and damping ratio (D) of different kinds of soils, including clay, silty clay, silt, sand, muck, and mucky soil, in more than 10 different areas of China by free vibration testing using the resonant column apparatus. The change curves of the dynamic shear modulus ratio G/Gmax and damping ratio D with shear strain γ for various soils were obtained. The curves of the dynamic shear modulus ratio G/Gmax and damping ratio D changing with shear strain were selected from the literature for clay, silty clay, and silt in this paper. The data extracted from the curves are shown in Table 2. The parameters in Equations (7) and (9) were fitted according to the data in Table 2 and used in the calculations in the improved Penzien model, as shown in Table 3. The fitted G/Gmax~γd and D~γd curves are shown in Figure 6, Figure 7 and Figure 8.

4.2.2. Details of the Numerical Substructure Model

The numerical substructure, considering the effect of SPSI, included the superstructure with five floors, the pile group, and the soil. The section sizes and material parameters of the superstructure were the same as the experimental substructure. The height of each floor was 2 m. The pile group was a 2 by 2 circular concrete pile with a diameter of 40 cm and a length of 16 m. The material was C30 concrete with an elastic modulus of 2.6 × 10⁴ MPa and a specific mass of 2500 kg/m3. The numerical substructure of the test without considering the influence of SPSI only included the superstructure with five floors, and the parameters of the superstructure were the same as the numerical substructure of the test considering the effect of SPSI.
The improved Penzien model was used to calculate the numerical substructure, and the calculation program was compiled using MATLAB. The integral method of the substructure pseudo-dynamic test was the PC-Newmark method with explicit and implicit combinations. The motion equation form of the PC-Newmark method is as follows:
M a i + 1 + C ¯ I v i + 1 + C ¯ E v i + 1 + K ¯ I d i + 1 + r ¯ i + 1 = f i + 1
where C ¯ I and C ¯ E denote the damping matrixes of the numerical substructure and the experimental substructure, respectively. The damping matrix of the SPSI system is C = C ¯ I + C ¯ E , and K ¯ I is the stiffness matrix of the numerical substructure. r ¯ i + 1 represents the restoring force measured from the experimental substructure after applying the predicted displacement.
The displacement and velocity calculation formulas of the PC-Newmark method are shown in Equations (68)–(71).
d ¯ i + 1 = d i + Δ t v i + Δ t 2 1 2 β a i
v ¯ i + 1 = v i + Δ t 1 γ a i
d i + 1 = d ¯ i + 1 + Δ t 2 β a i + 1
v i + 1 = v ¯ i + 1 + Δ t γ a i + 1
where d ¯ i + 1 and v ¯ i + 1 are the predicted displacement and the predicted velocity, respectively. d i + 1 and v i + 1 denote the calibrated displacement and the calibrated velocity, respectively.
Combined with the improved Penzien model, Equation (67) is modified to Equation (72):
M a i + 1 + C ¯ I v i + 1 + C ¯ E v i + 1 + K ¯ I d i + 1 + r ¯ i + 1 = M a g , i + 1 + C h v i + 1 G + K h d i + 1 G
The substructure pseudo-dynamic test steps are as follows: first, substitute the result of the previous step into Equations (68) and (69), and calculate the prediction displacement and the prediction velocity of step i + 1. The corresponding displacement of the experimental substructure in the prediction displacement is then loaded on the test specimen, and the restoring force on the specimen is measured at the same time. Third, the acceleration, the calibrated displacement, and the calibrated velocity in step i + 1 are calculated according to Equations (72), (70), and (71), respectively. Calculate the predicted value in the next step and repeat the above operation until the end of the experiment.
Because the parameters of the improved Penzien model and the derivation of the dynamic coefficient matrix are described in detail in Section 3, this section only describes the boundary treatment of the unmentioned numerical substructure stiffness matrix and the restoring force vector. According to the number of each element shown in Figure 9, assemble the element stiffness matrix into the overall stiffness matrix. When element 6 is used as the test substructure, the corresponding stiffness matrix of the numerical substructure is K ¯ I , which is shown in Equation (73). The restoring force vector is shown in Equation (77).
K ¯ I = A B B T E
A = k 1 1 k 1 2 0 0 0 0 k 2 1 k 2 2 + k 2 3 0 0 0 0 k 3 2 k 3 3 + k 3 4 0 0 0 0 k 4 3 k 4 4 + k 4 5 0 0 0 0 k 5 4 k 5 5 + k 5 6 0 0 0 0 k 6 5 k 6 6
B = 0 0 0 0 0 0 0 0 0 0 0 0 0 0 0 0 0 0 0 0 0 0 0 0 0 0 0 0 0 0 0 0 0 0 0 0 0 0 0 0 0 0 0 0 0 0 0 0
E = k 7 7 + k v , 1 k 7 8 k v , 1 0 0 0 0 0 0 k 8 7 k v , 1 k 8 8 + + k v , 2 k 8 9 k v , 2 0 0 0 0 0 0 k 9 8 k v , 2 k 9 9 + + k v , 3 k 9 10 k v , 3 0 0 0 0 0 0 k 10 9 k v , 3 k 10 10 + + k v , 4 k 10 11 k v , 4 0 0 0 0 0 0 k 11 10 k v , 4 k 11 11 + + k v , 5 k 11 12 k v , 5 0 0 0 0 0 0 k 12 11 k v , 5 k 12 12 + + k v , 6 k 12 13 k v , 6 0 0 0 0 0 0 k 13 12 k v , 6 k 13 13 + + k v , 7 k 13 14 k v , 7 0 0 0 0 0 0 k 14 13 k v , 7 k 14 14 + + k v , 8
r ¯ i + 1 = 0 0 0 0 0 r i + 1 r i + 1 0 0 0 0 0 0 0 T

4.3. Results

4.3.1. Acceleration Time History

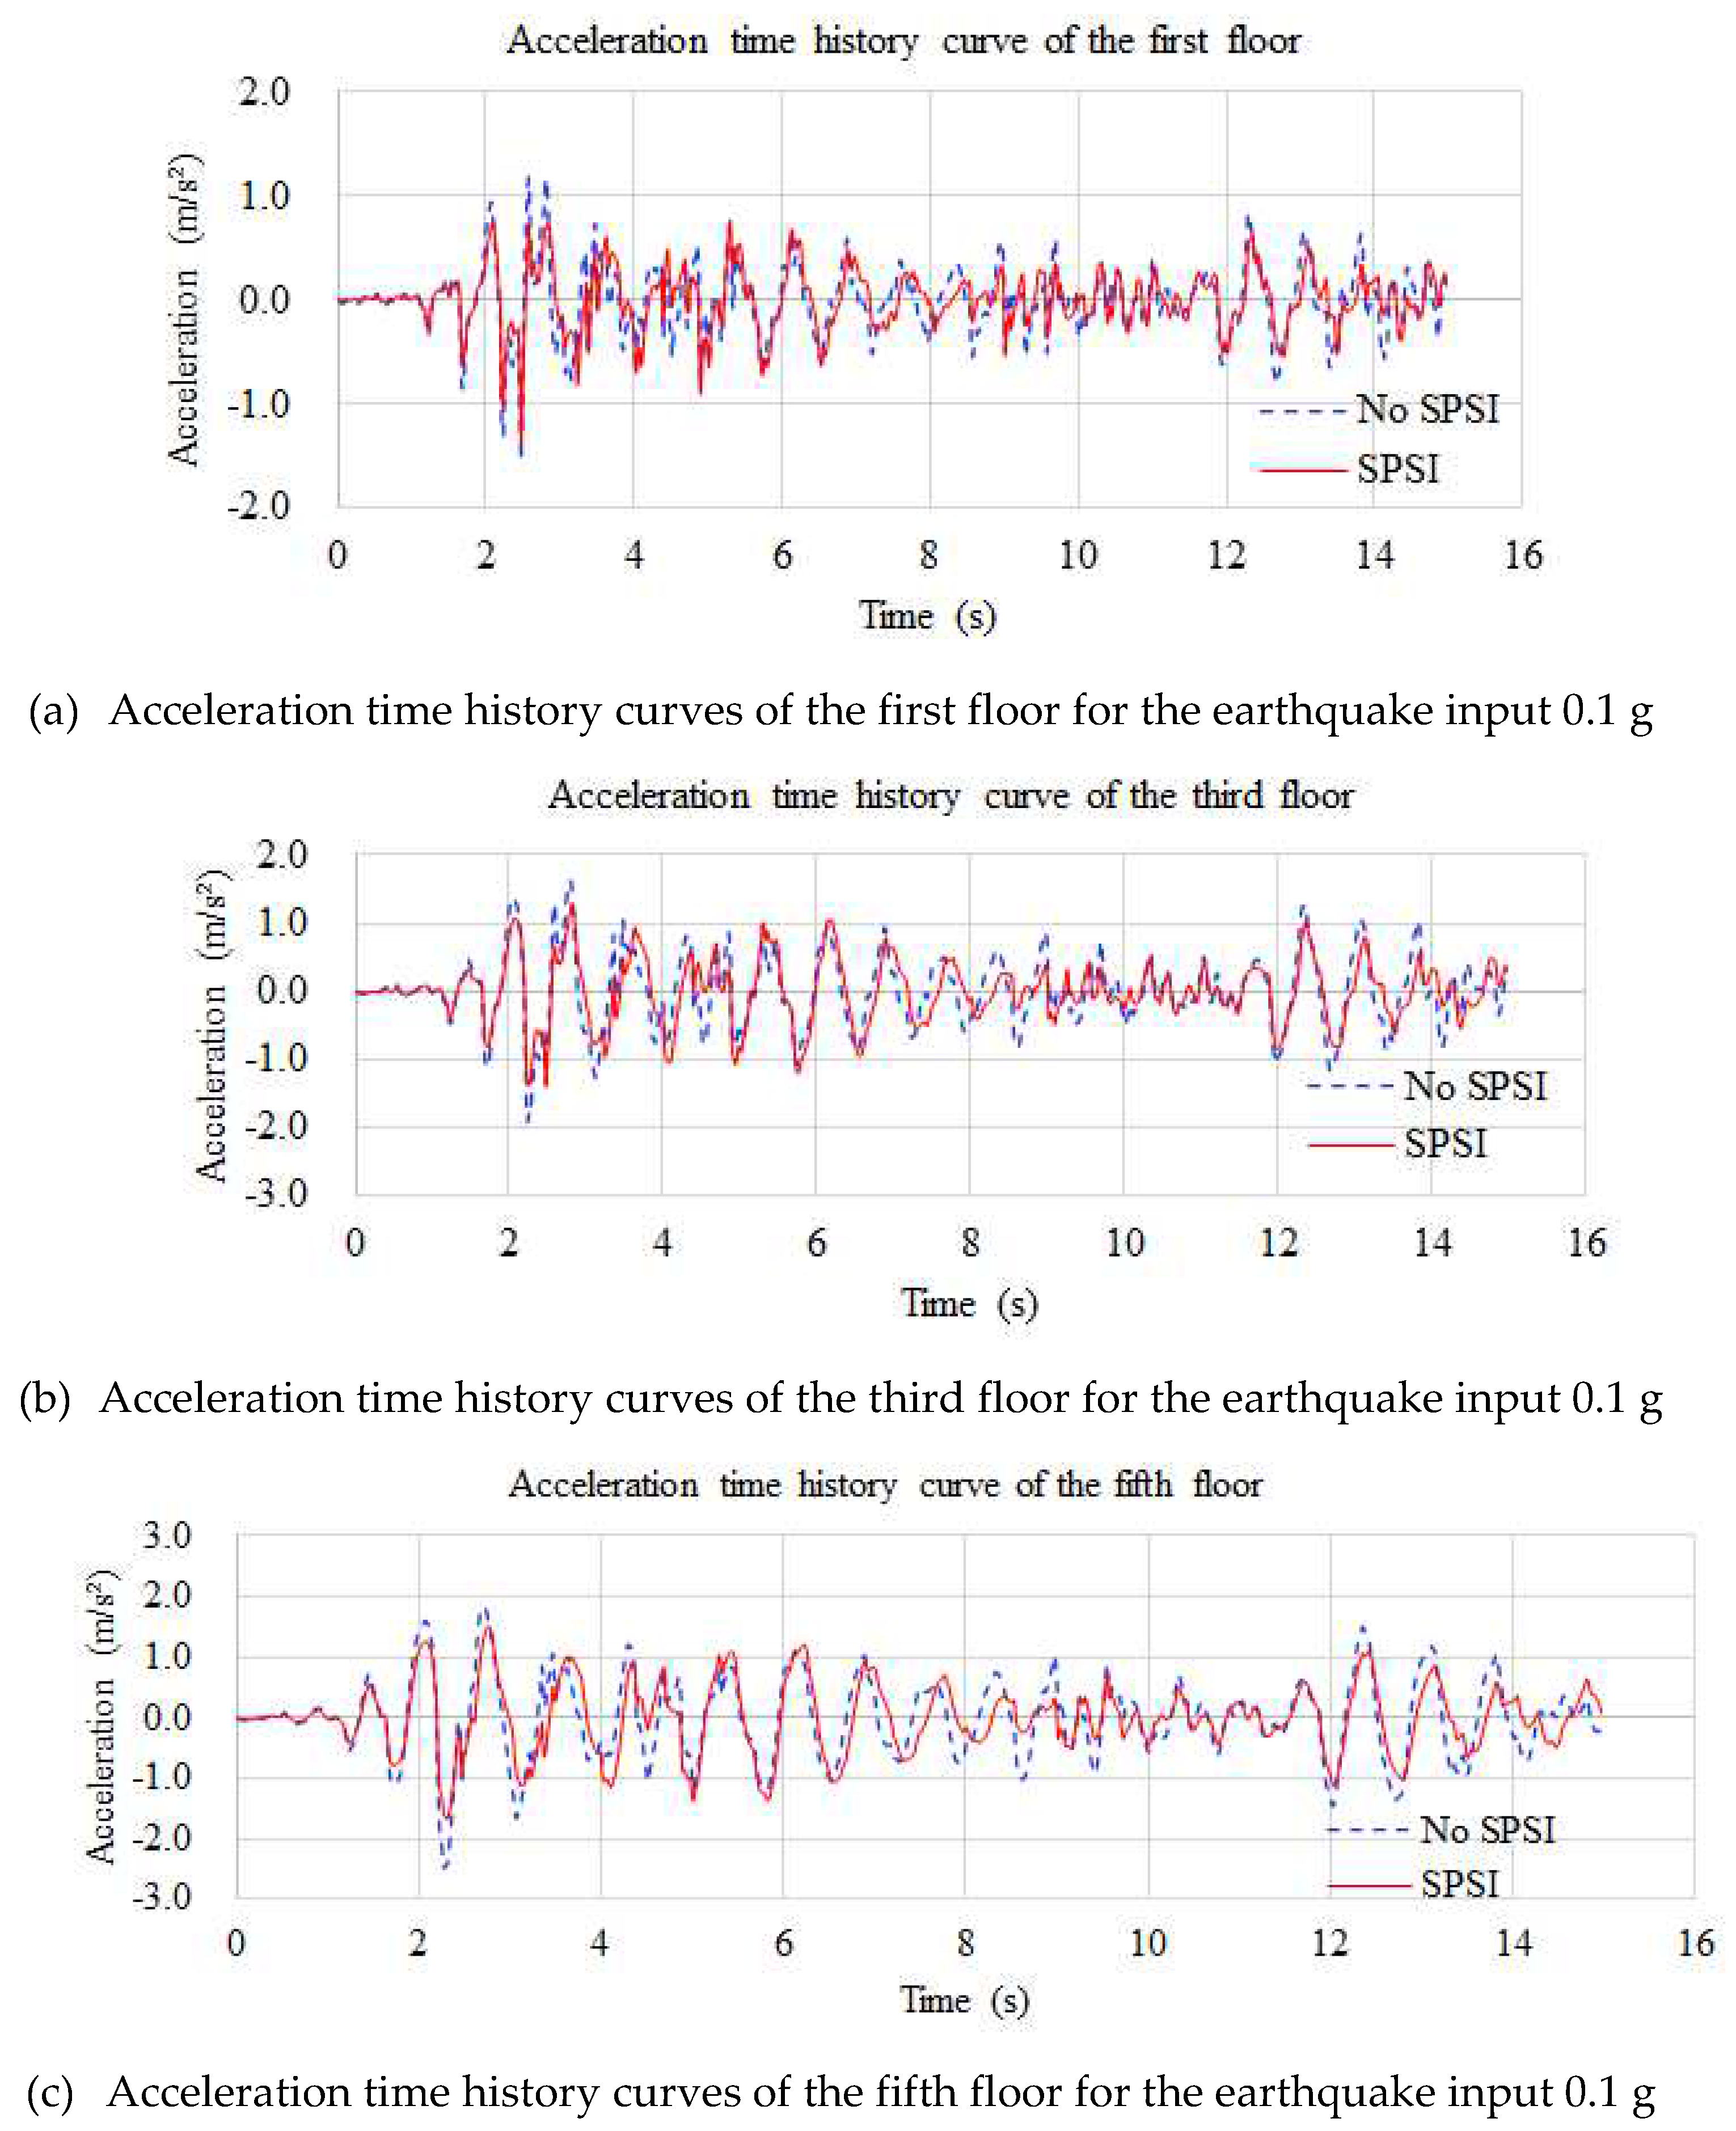
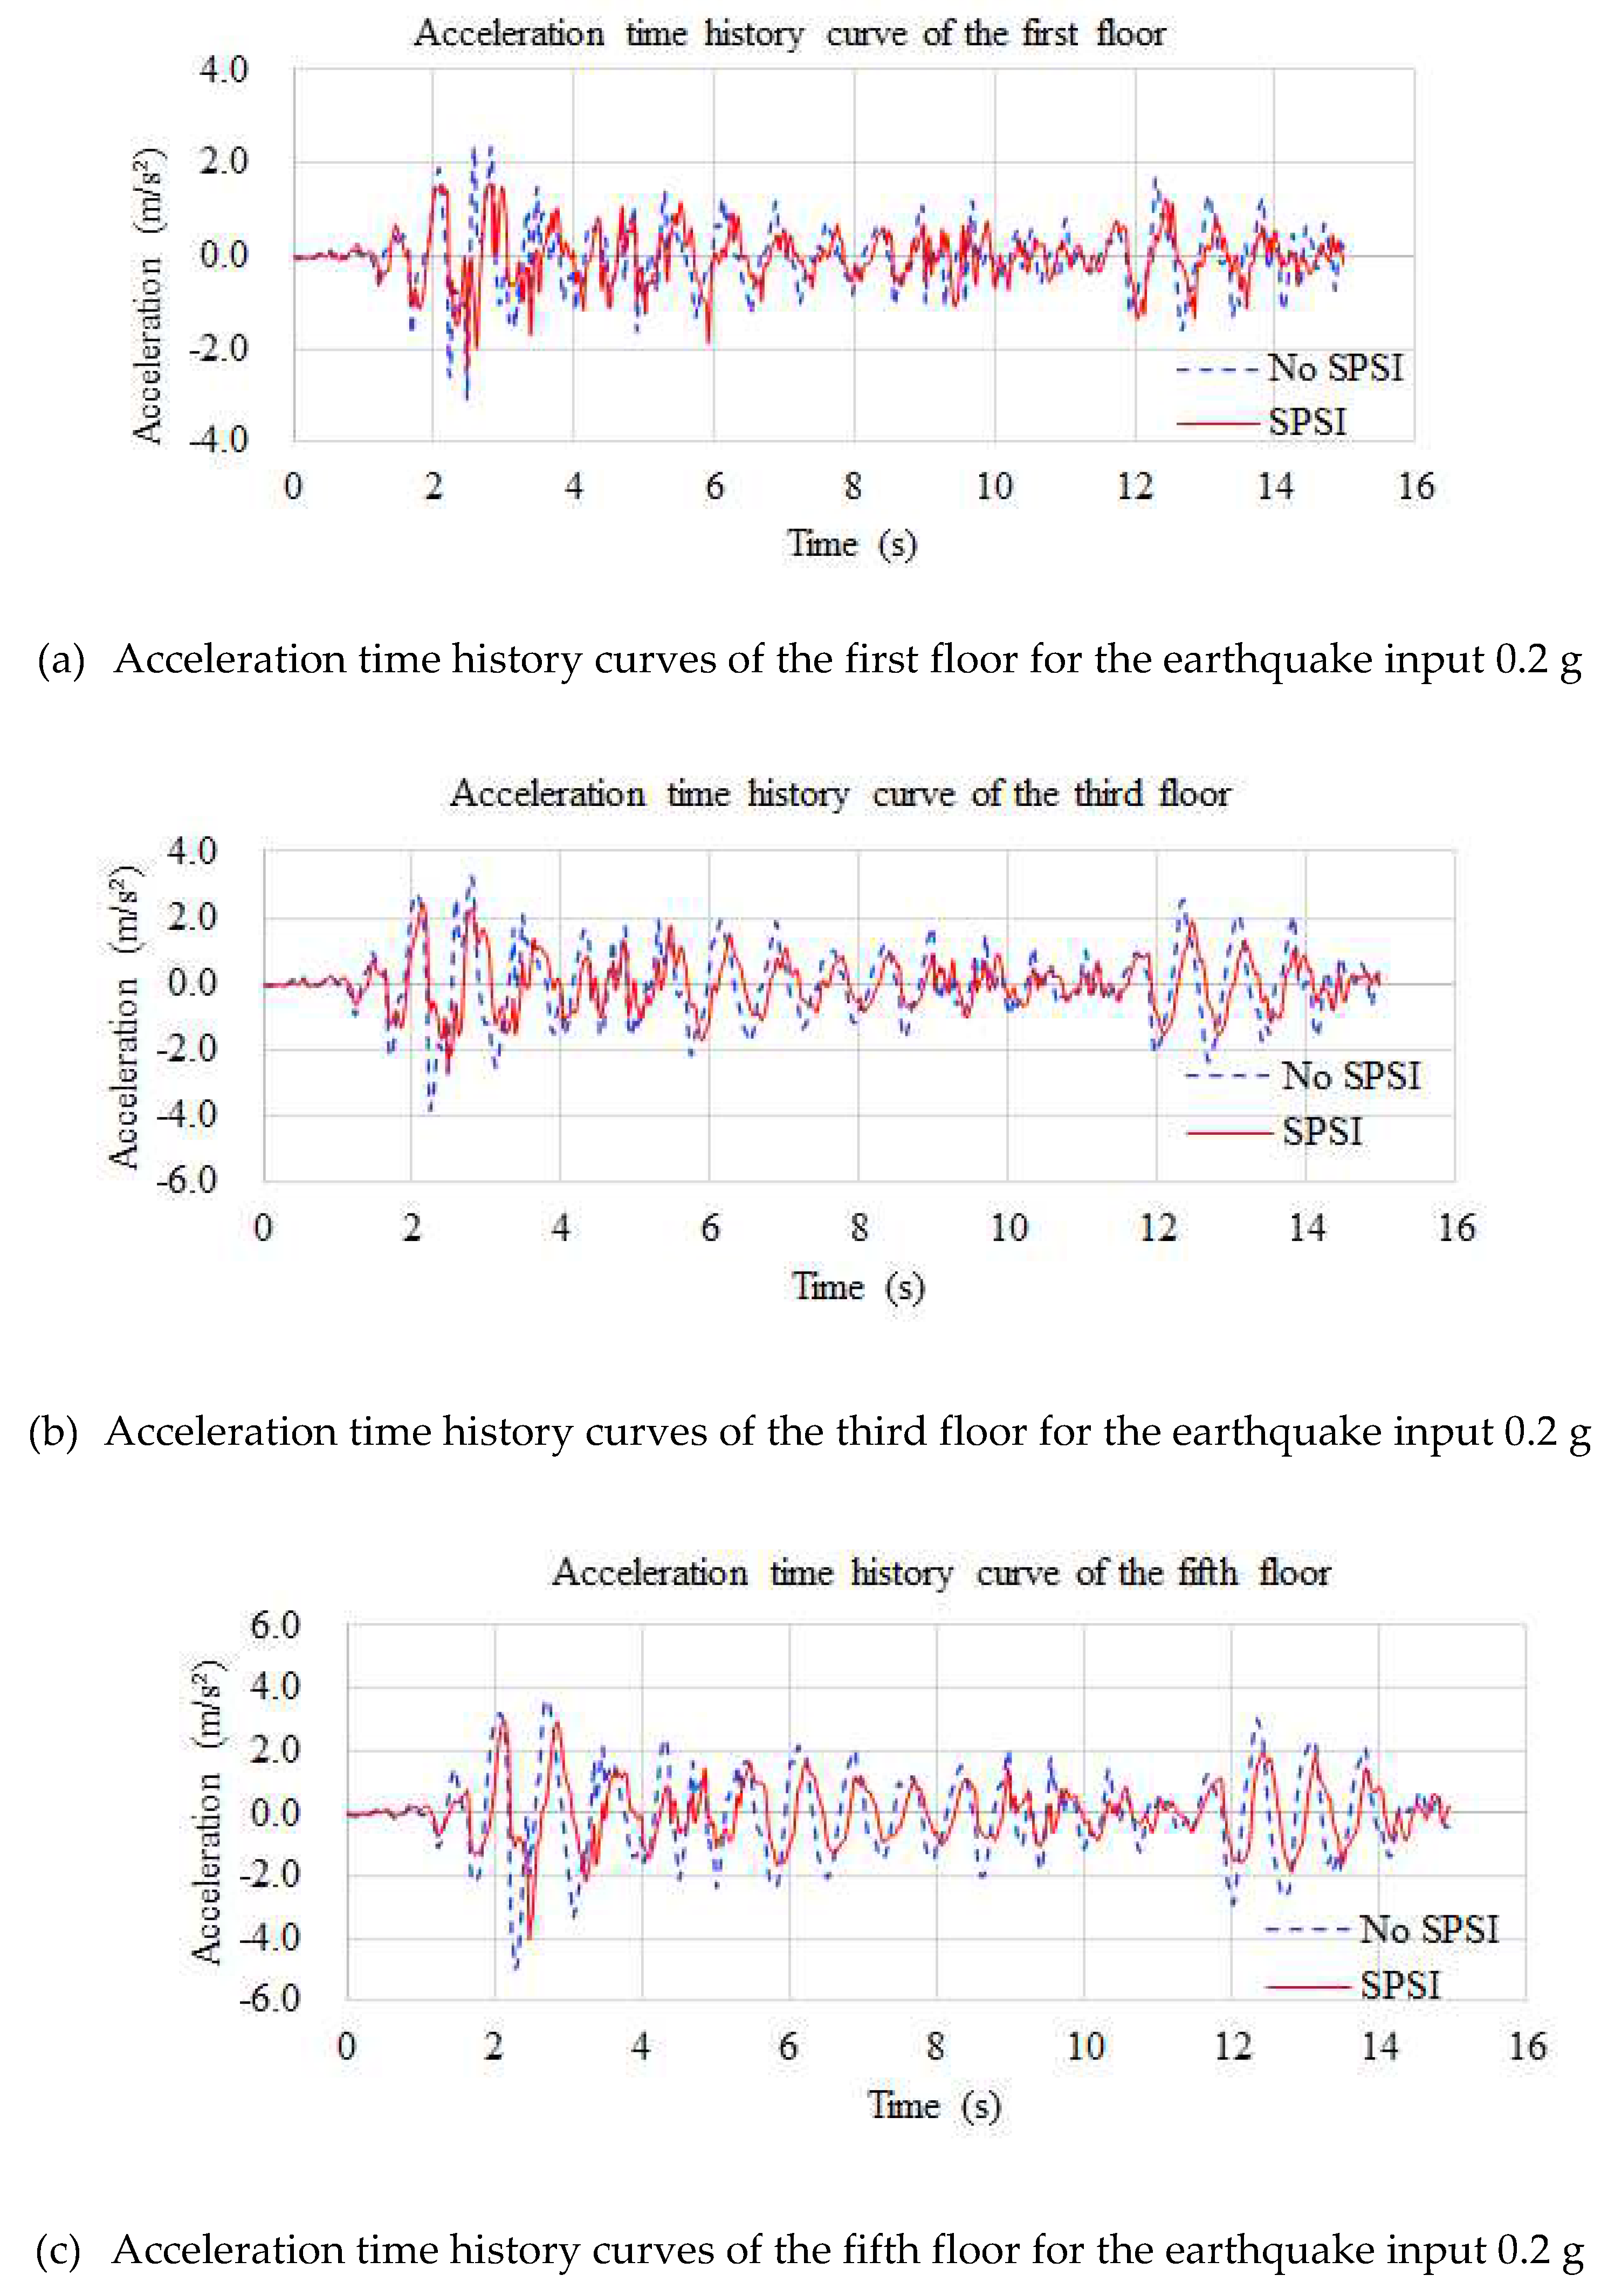
Table 4 shows the peak accelerations of each floor of the superstructures in the two models, with and without the effect of SPSI. The acceleration time history curves of the first, third, and fifth floors are shown in Figure 10 and Figure 11. In general, when the effect of SPSI was included, the peak acceleration of the superstructure was reduced, and the maximum difference was up to 33%. This conclusion was consistent with that in the references of Ge et al. [67], Ge et al. [59], and Ge et al. [60]. When the peak value of the earthquake input was 0.1 g, the differences in the peak accelerations of each floor of the superstructure between the two models including the effect of SPSI and not including the effect of SPSI were 9%, 15%, 27%, 30%, 32%, and 31%, respectively, and the corresponding differences were 22%, 30%, 33%, 27%, 19%, and 16%, respectively, when the peak value of the earthquake input was 0.2 g. As the peak value of the earthquake input increased, the effects of the lower floors (the 1st to 3rd floors) due to the soil and structure interaction were larger, while the effects of the higher floors (the 4th to 6th floors) were less. This reason is attributed to the fact that the dynamic nonlinearity characteristics of the soil and structure interaction are more significant with the increase in the earthquake input, and the lower structures are closer to the soil, so the effect is larger.
With the increase in the time step, the acceleration responses of the model including the influence of SPSI lagged behind those of the model without the influence of SPSI, and the lag time was longer under the earthquake input of 0.2 g. Further, the lag phenomenon was more obvious for higher floors. The main reason is that the soil dynamic nonlinearity is significant in the soft soil foundation under the excitation of the earthquake, resulting in intensifying the nonlinear dynamic interaction between soil and structure, and the nonlinearity dynamic interaction between the soil and structure further affects the propagation of the earthquake wave.

4.3.2. Acceleration Response Spectra

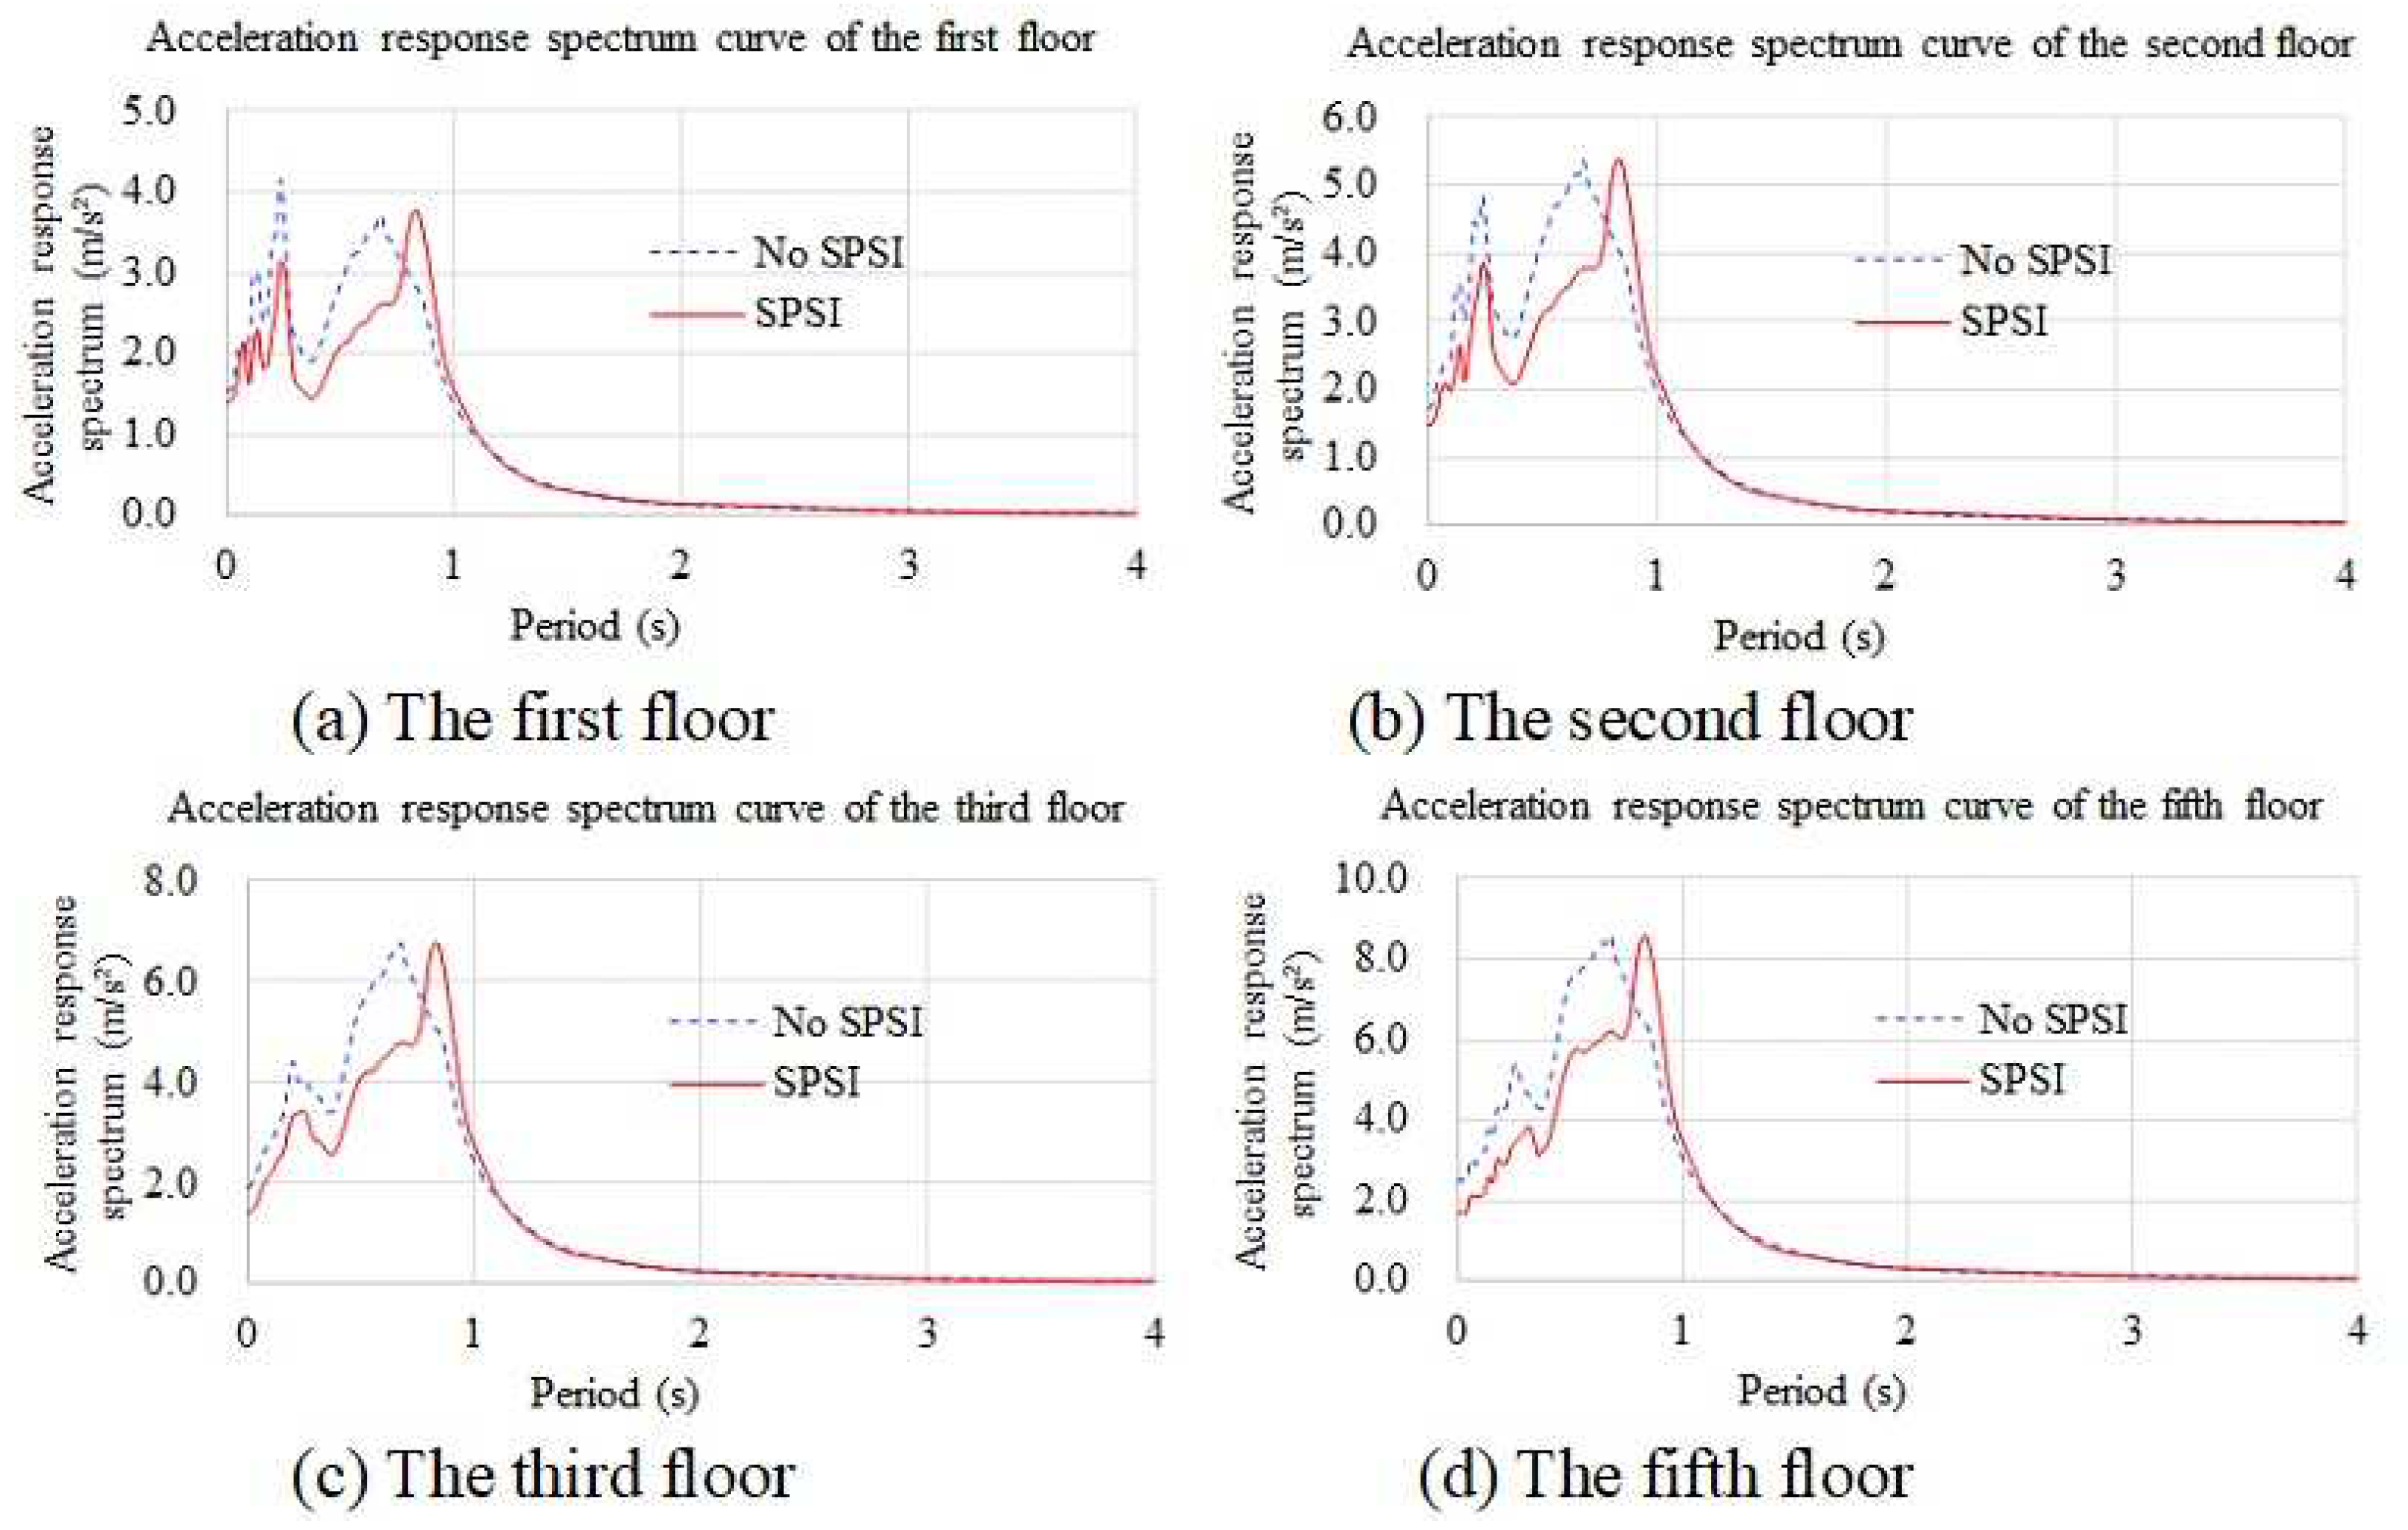
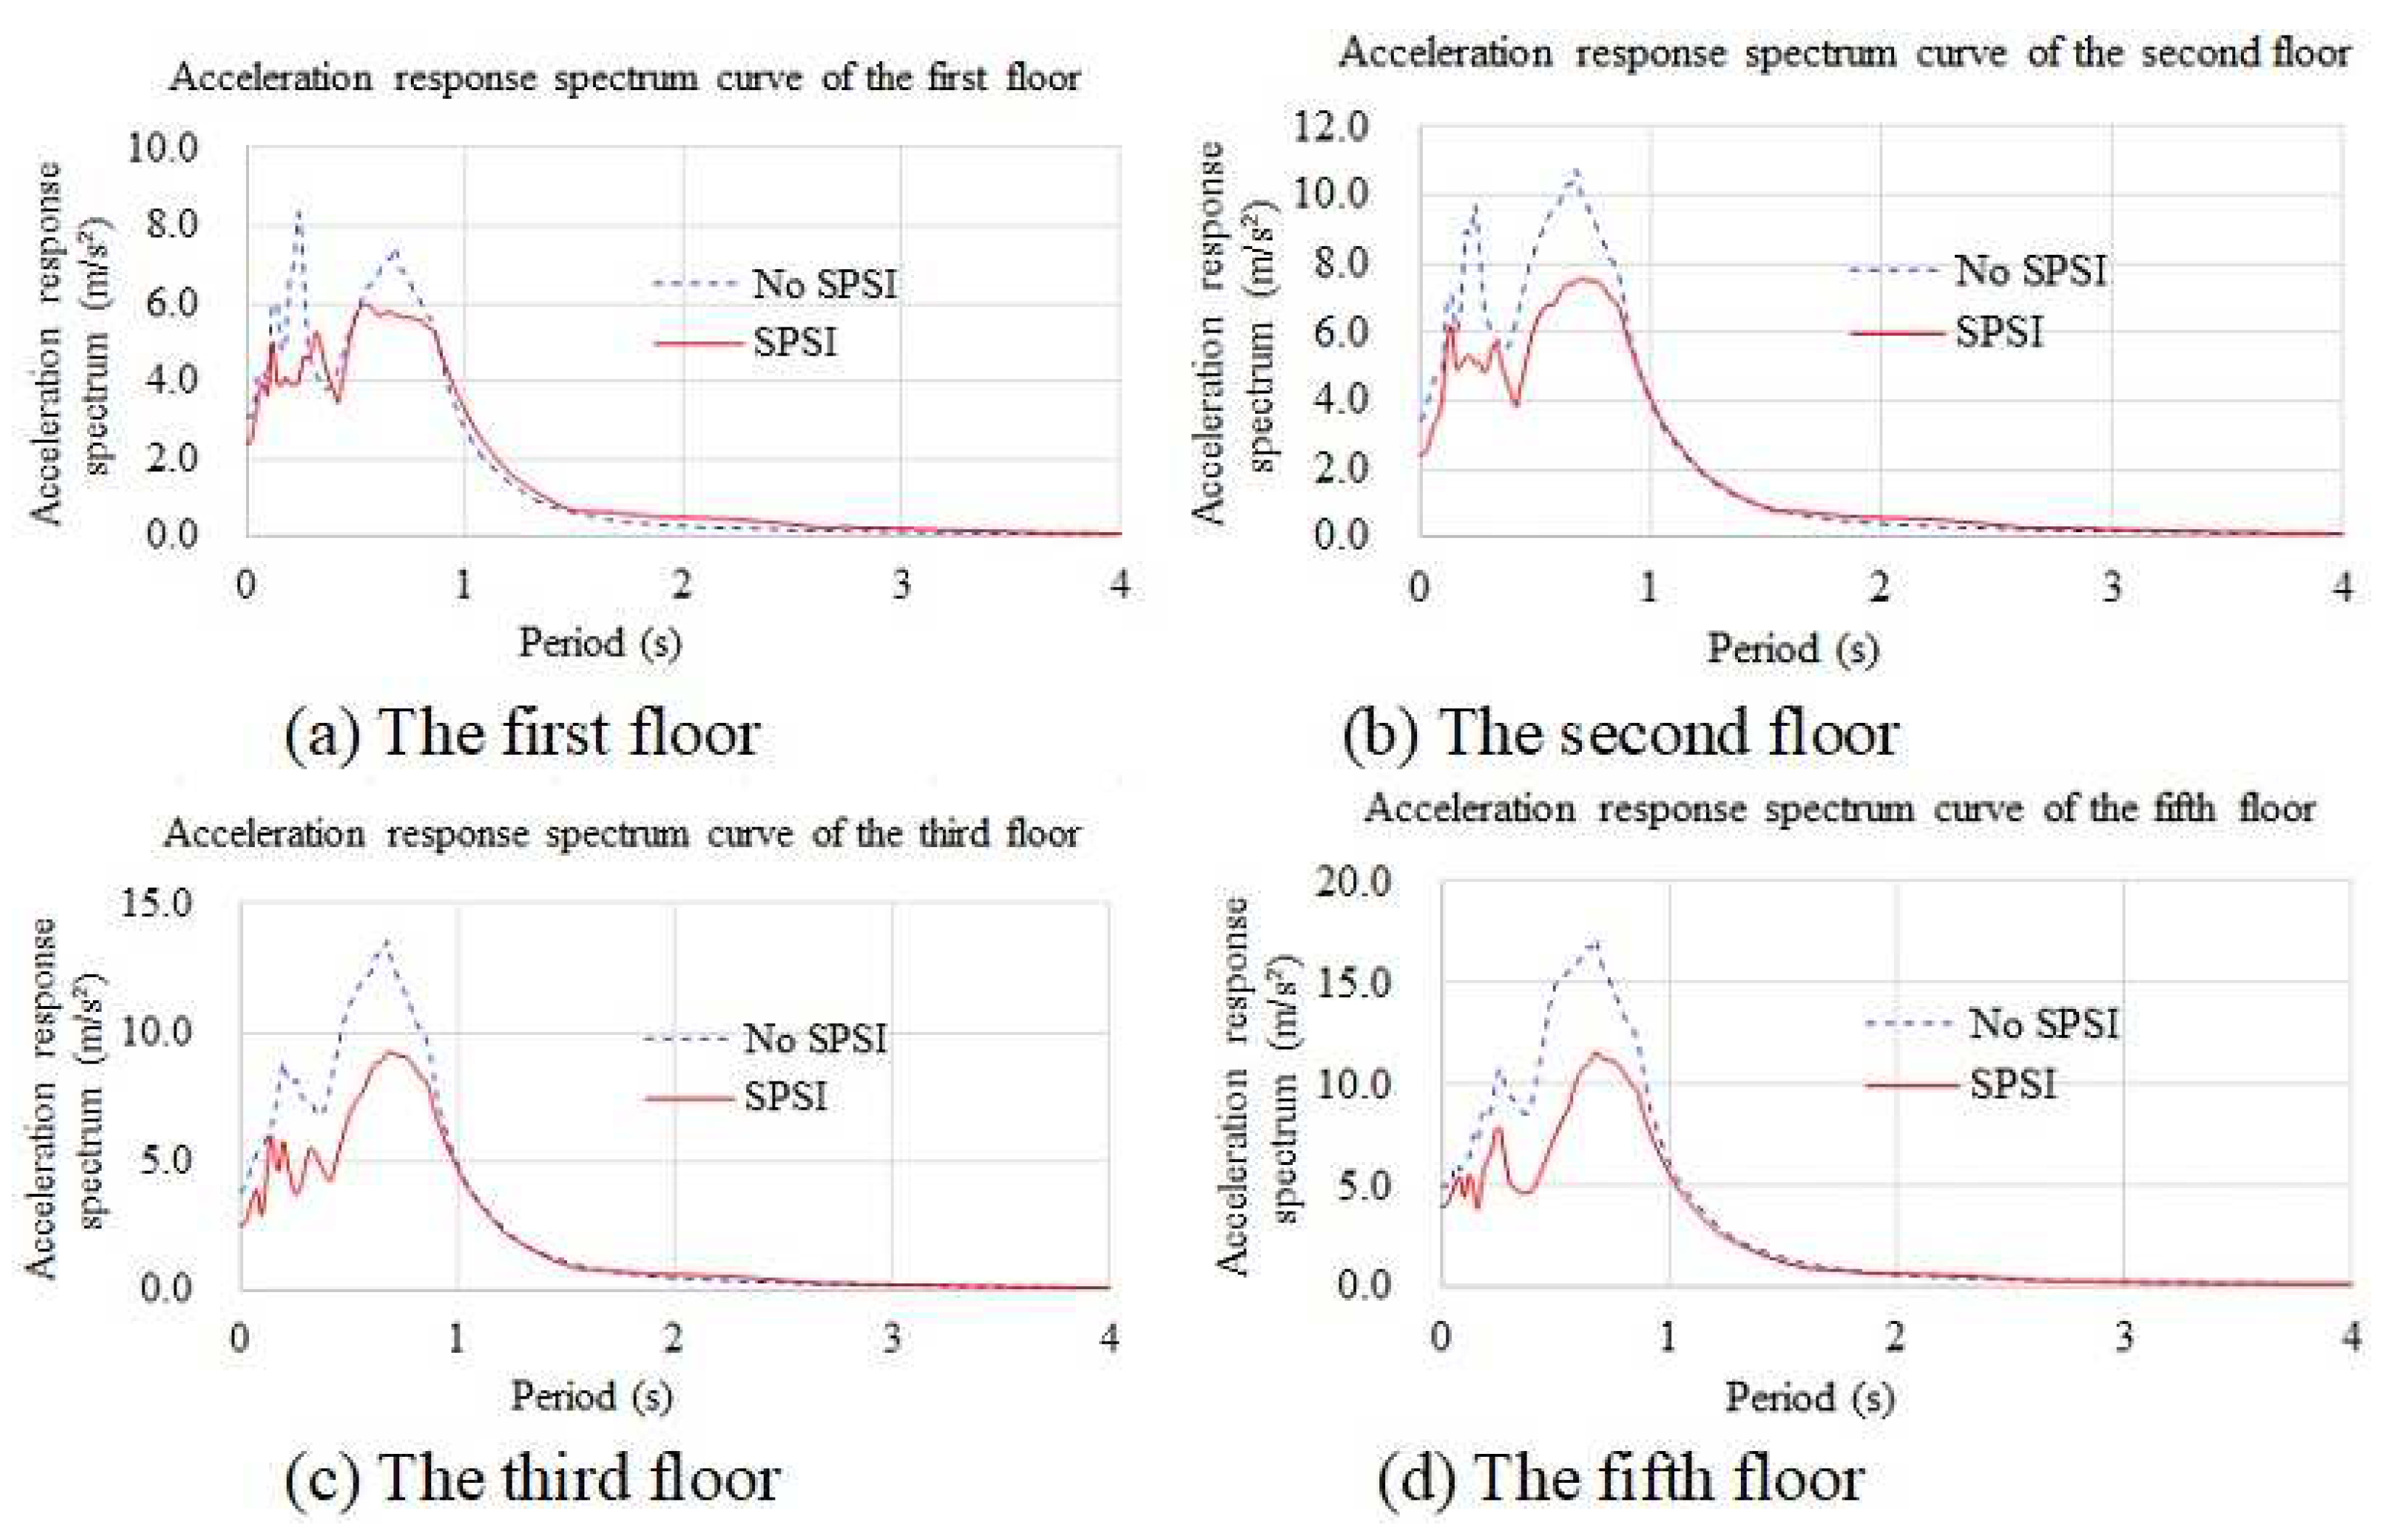
The acceleration response spectra of the structures in the two models, SPSI and No SPSI, are shown in Figure 12 and Figure 13. When the natural vibration periods of the superstructures were less than 1 s, the acceleration response spectrum values in the No-SPSI model were greater than those in the SPSI model, and when the natural vibration periods of the superstructures were greater than 1 s, the acceleration response spectra in the two models were almost equal to each other. On the first and second floors, the acceleration response spectra in the two models had two larger spectral values. Whether the SPSI effect has an influence on the acceleration response spectra depends on the period range of the structure. Structures with natural vibration periods less than 1 s are greatly affected by SPSI, while structures with natural vibration periods greater than 1 s are almost not affected by SPSI. Overall, the SPSI effect reduces the acceleration response spectrum. When the earthquake input is large, the decrease obviously increases.

4.3.3. Velocity Response Spectra

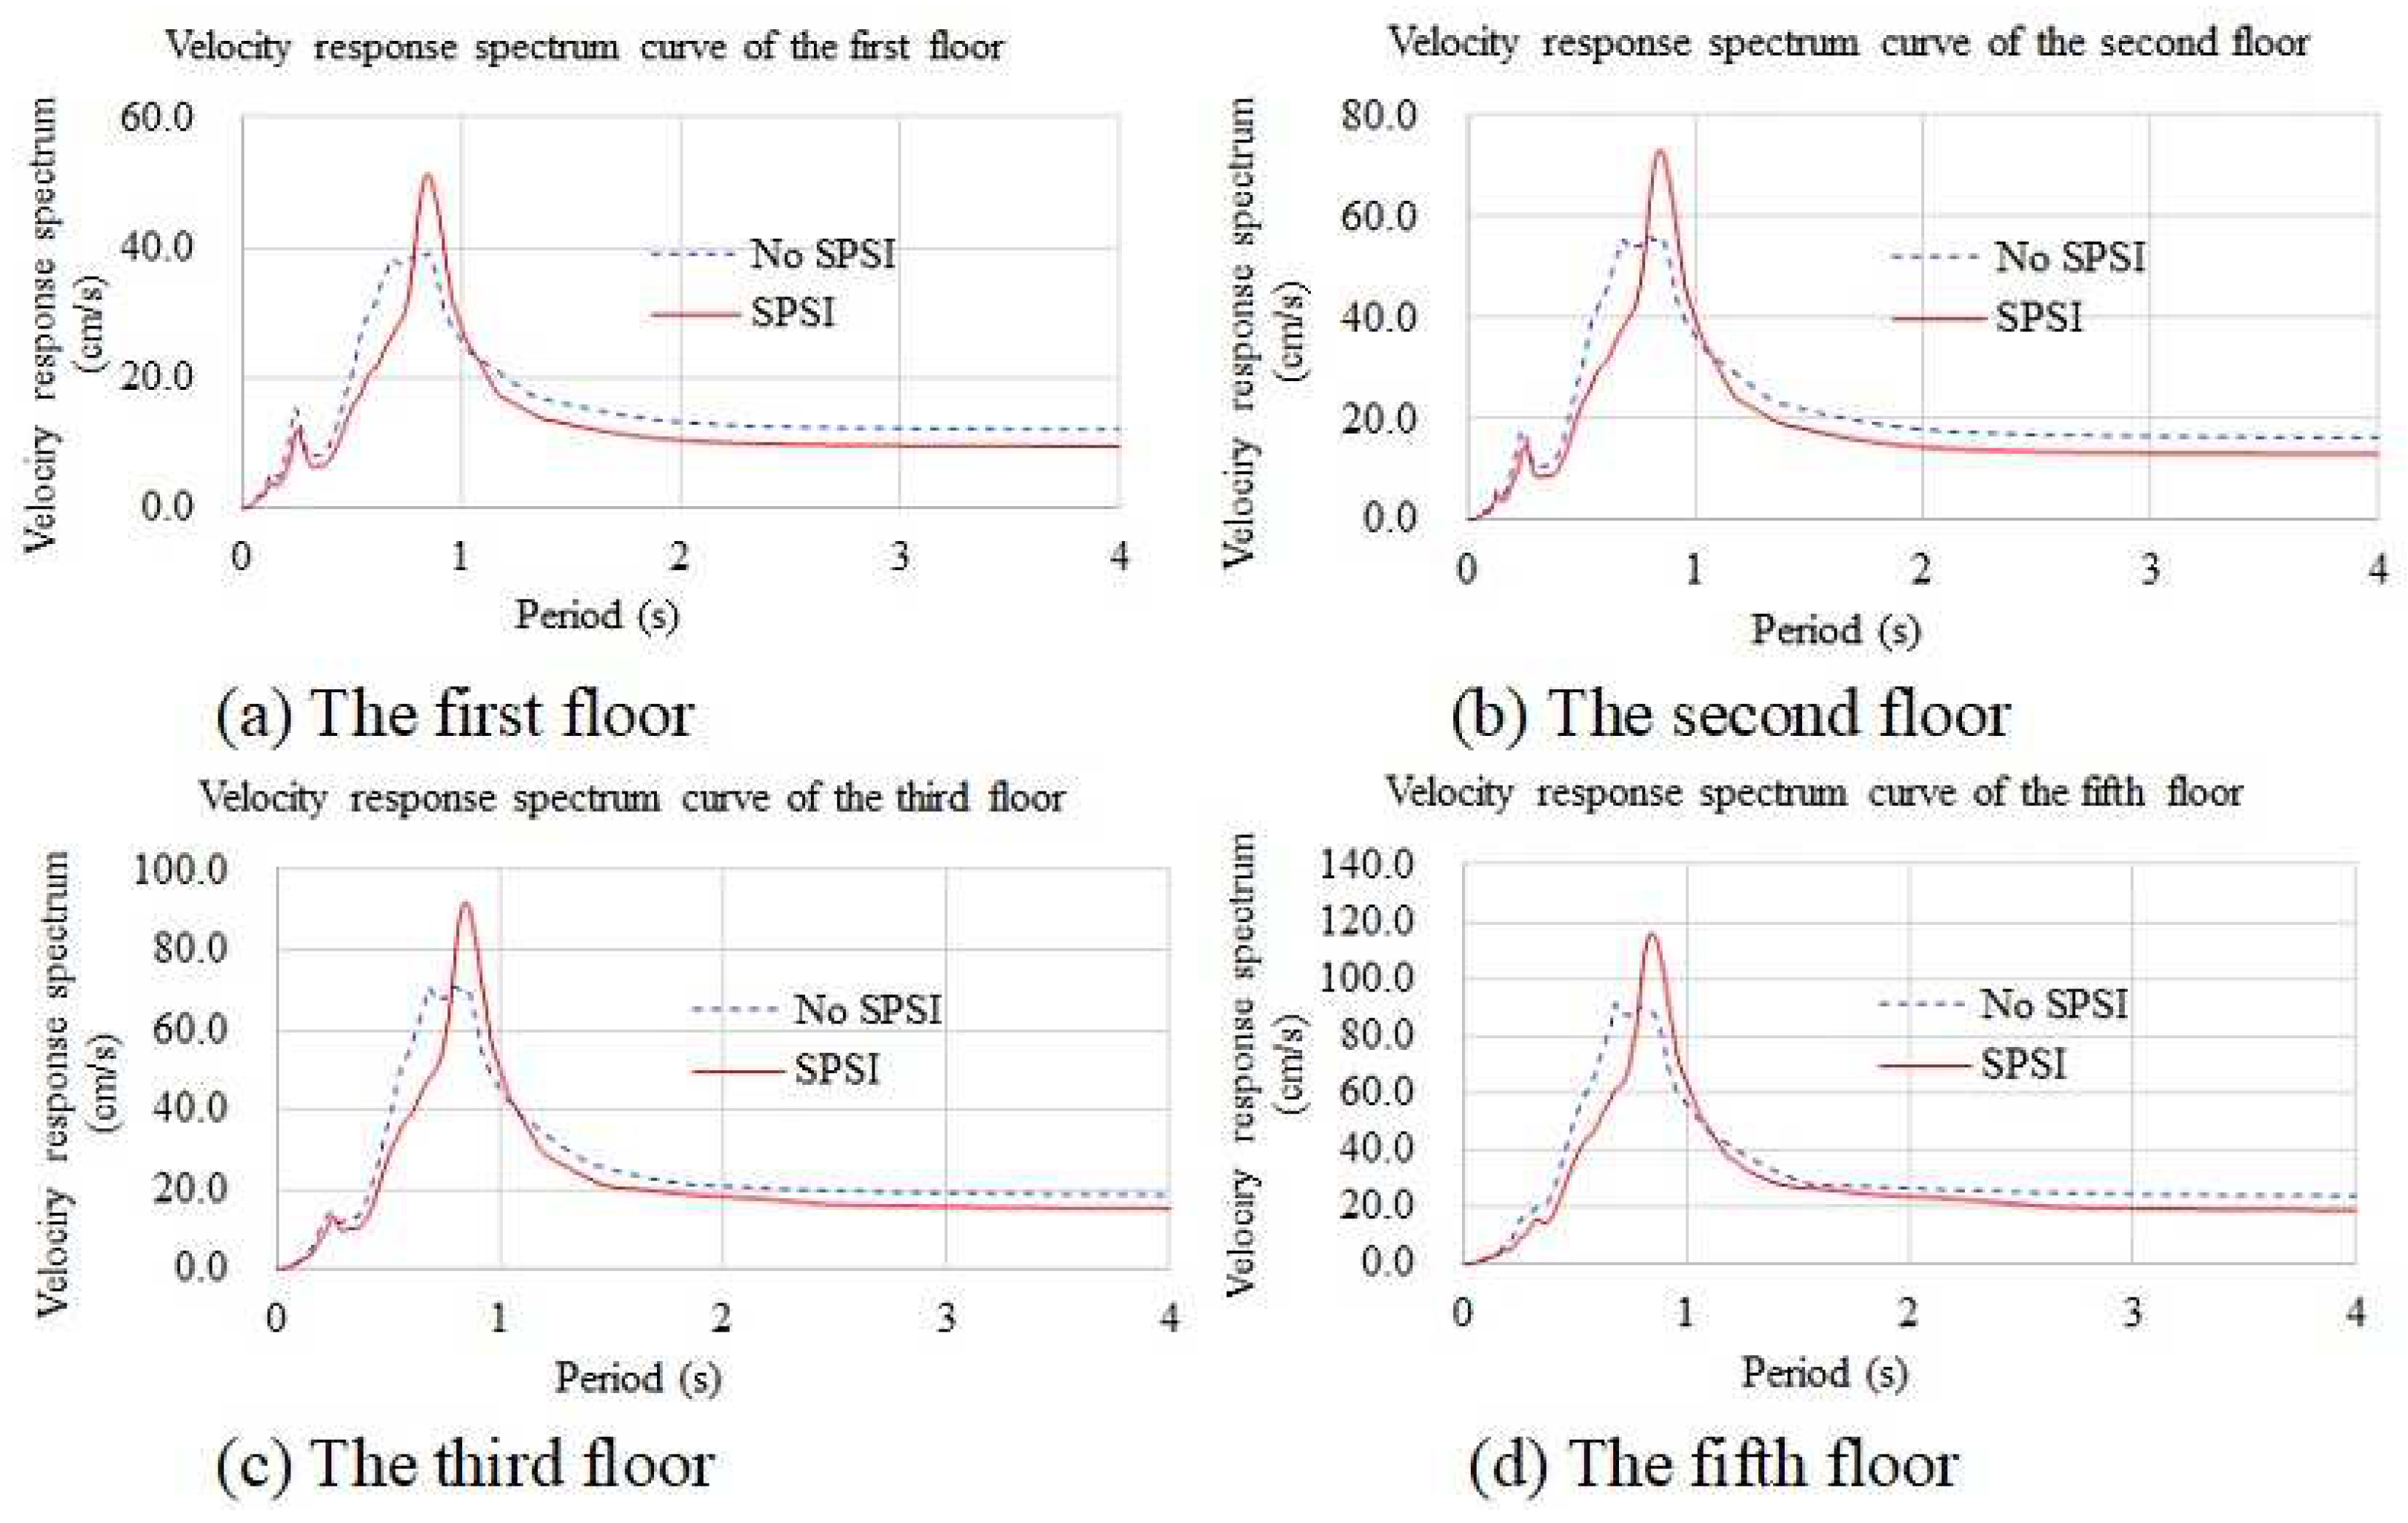
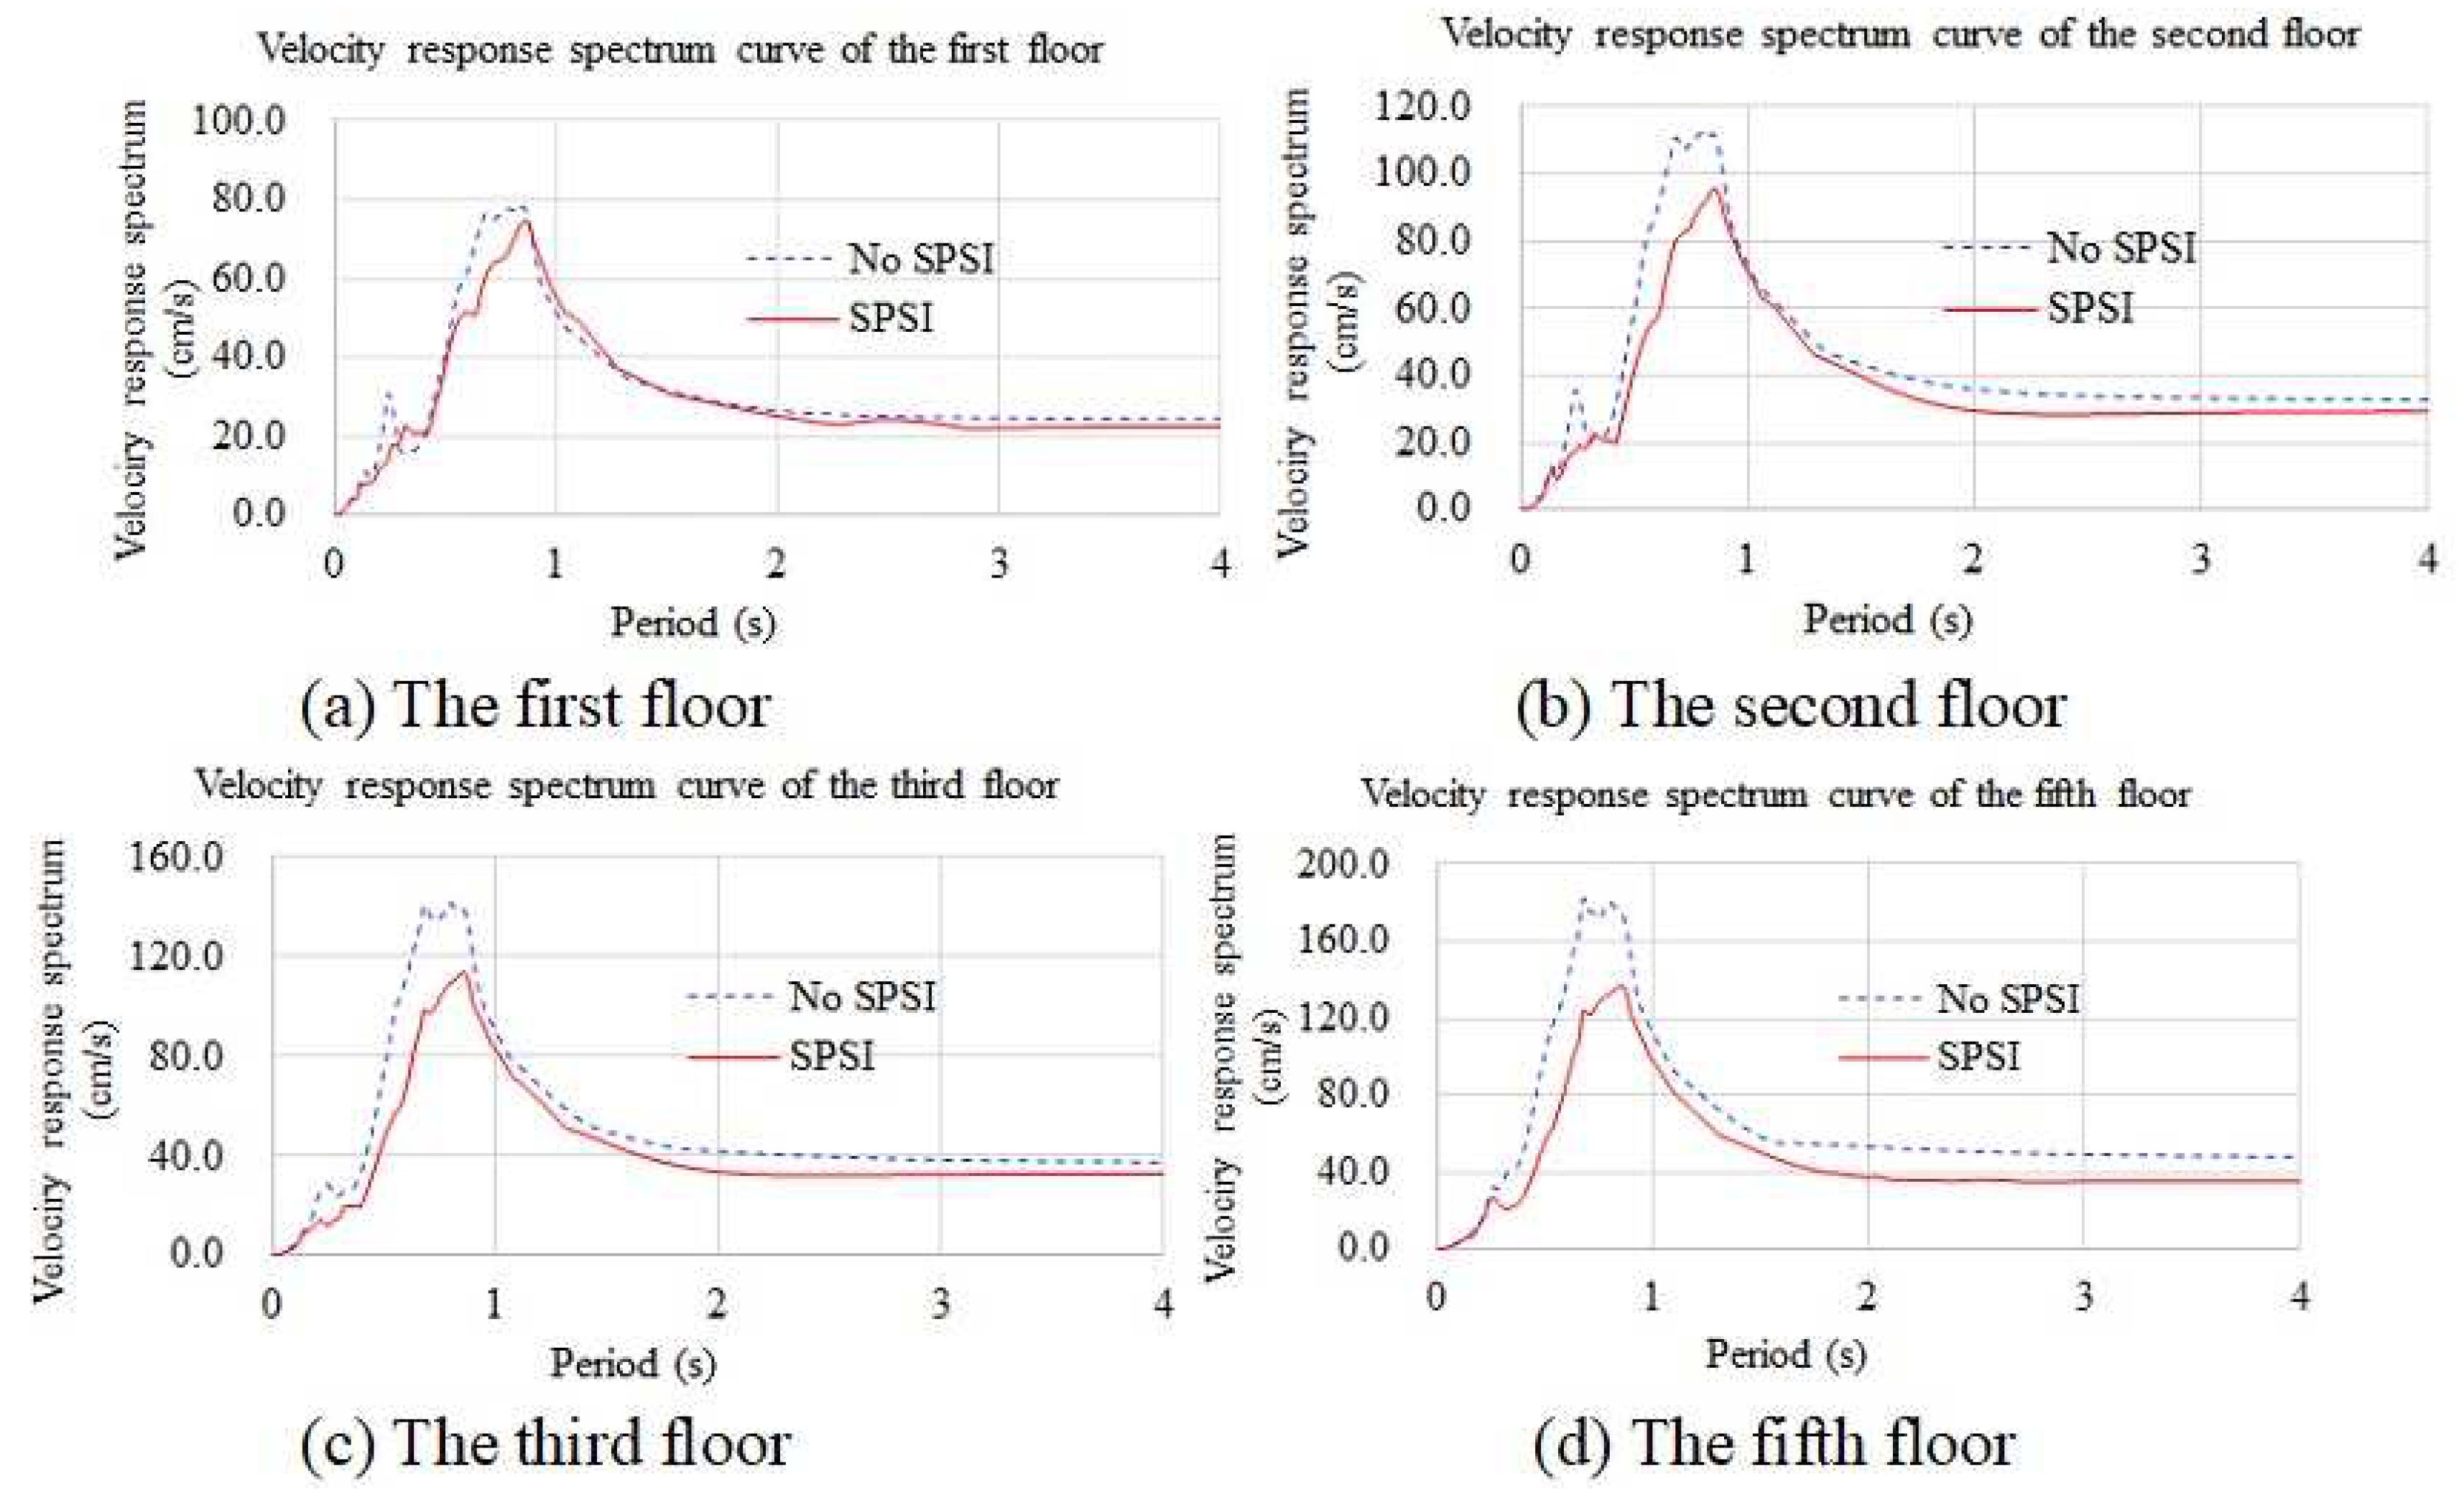
The velocity response spectra of the two models, No SPSI and SPSI, are shown in Figure 14 and Figure 15. The velocity response spectra of the structures whose natural vibration periods range from 0.5 s to 1 s were mainly affected by SPSI. For structures with natural vibration periods greater than 1 s and less than 0.5 s, the velocity response spectrum values of the SPSI model were all smaller than those of the No SPSI model. However, the difference between the two models was very small, and the influence of the SPSI effect was very small. For structures whose natural vibration periods ranged from 0.5 s to 1 s, the influence of SPSI was more complex. When the earthquake input peak value was 0.1 g, the dynamic interaction between soil and structure increased the velocity response spectrum value of the superstructure, while when the earthquake input peak value was 0.2 g, it was the opposite.

4.3.4. Displacement Response Spectra

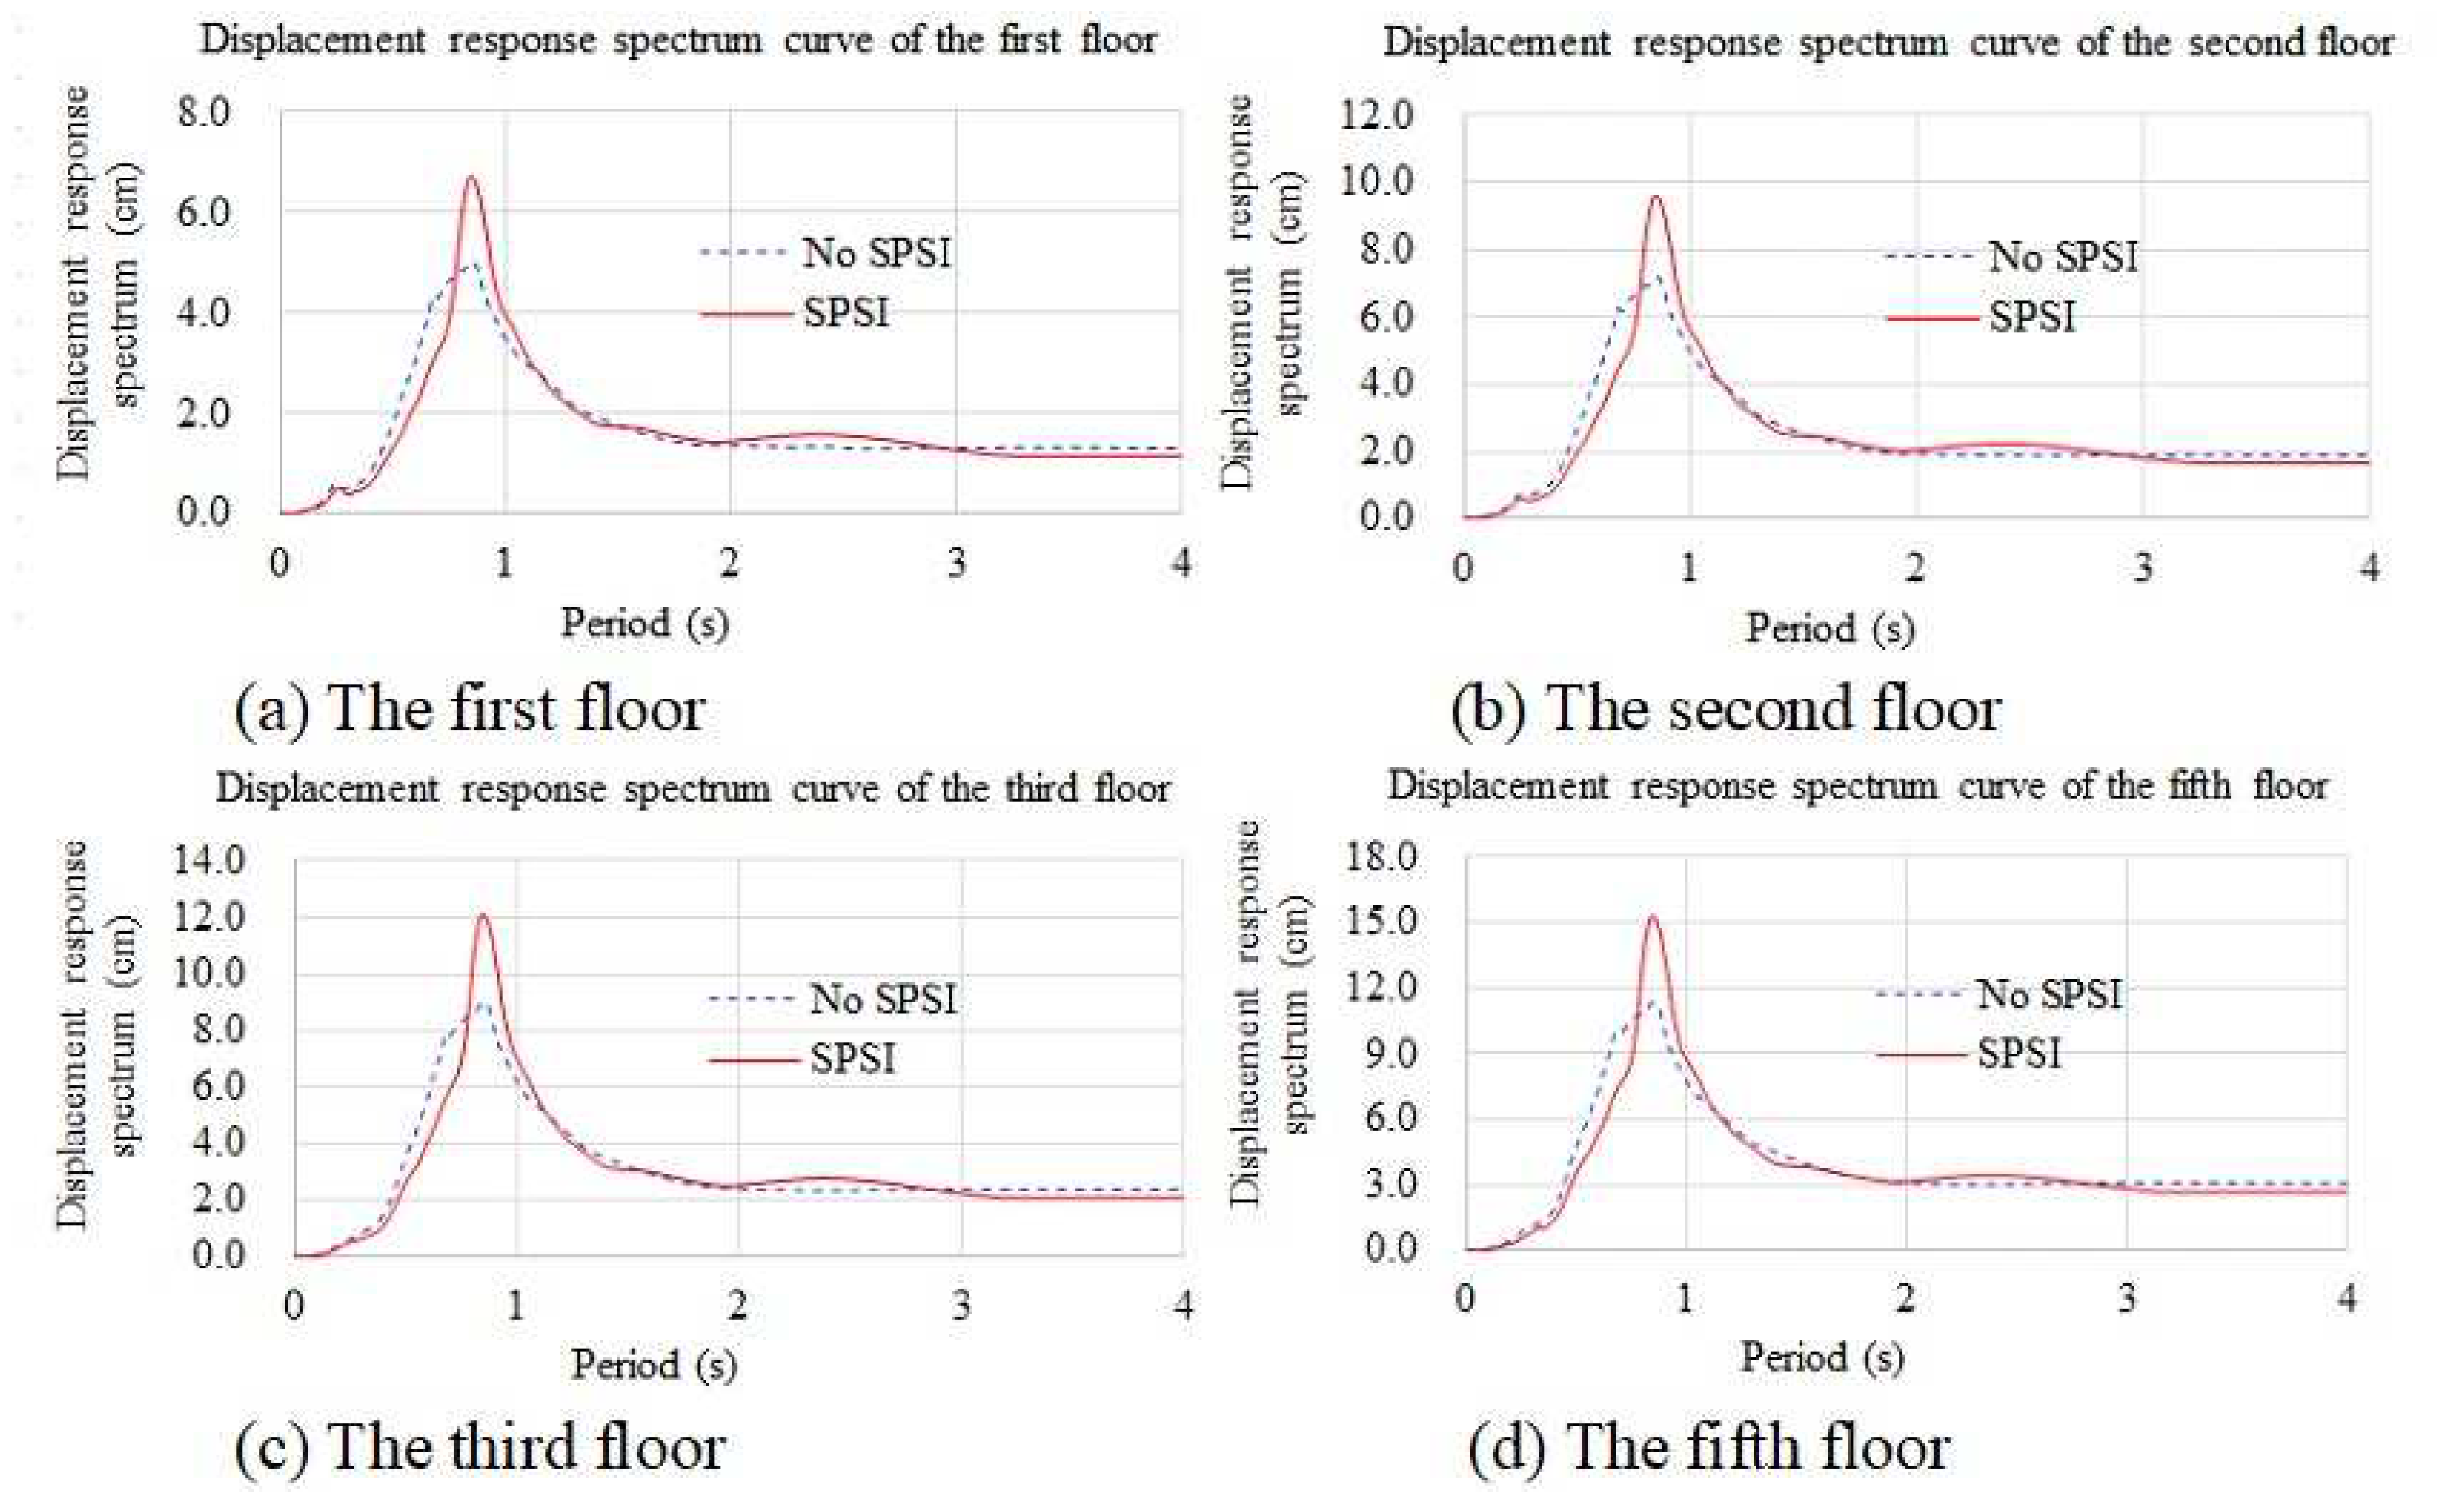
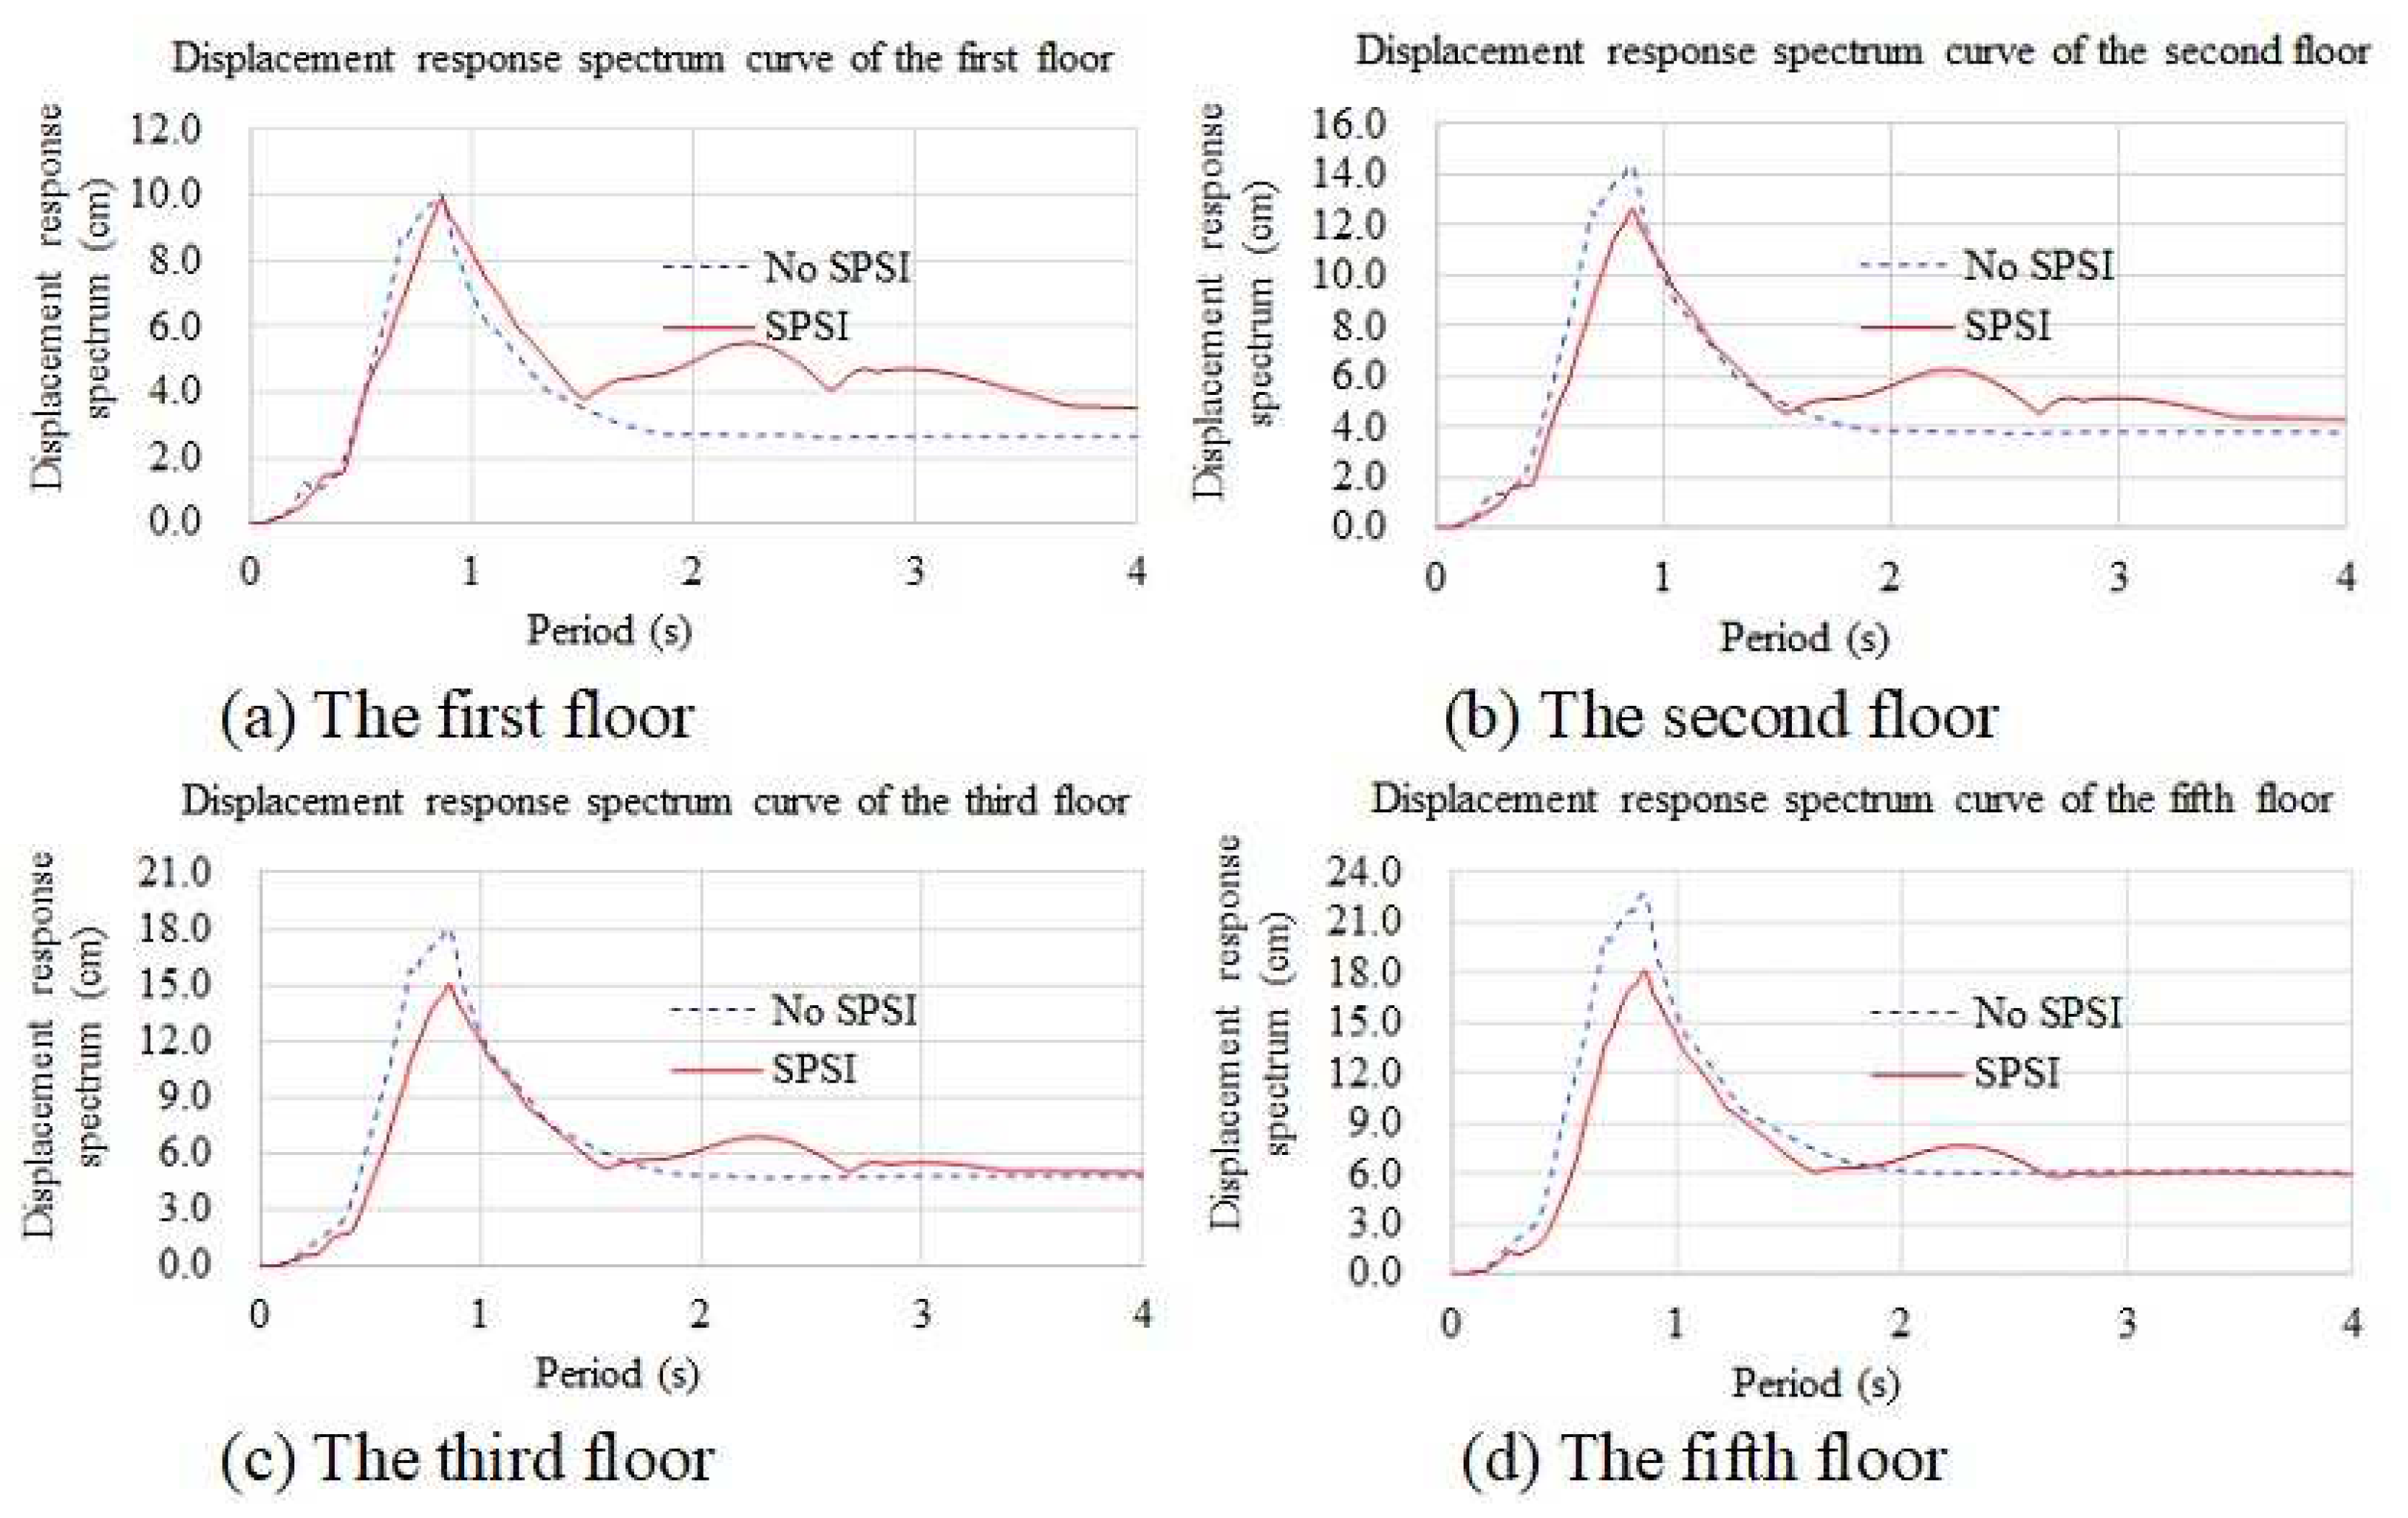
Figure 16 and Figure 17 are displacement response spectrum curves of the superstructures in the SPSI model and the No-SPSI model. When the earthquake input peak value was 0.1 g, the SPSI mainly affected the structures whose natural vibration periods ranged from 0.5 s to 1 s, and the displacement response spectrum values in the SPSI model were greater than those in the No-SPSI model. However, when the earthquake input peak value was 0.2 g, for structures with natural vibration periods less than 1.5 s, there was little difference between the displacement response spectrum values in the two models for the first and second floors. In this situation, the SPSI mainly affected structures with natural vibration periods greater than 1.5 s, and the SPSI increased the displacement response spectrum values of structures with natural vibration periods greater than 1.5 s. For structures above the third floor, the SPSI increased the influence on structures with natural vibration periods in the range of 0.5 s to 1 s and reduced the displacement response spectrum values of the superstructure.

5. Conclusions

Based on the original Penzien model, an improved Penzien model was developed by combining it with ANSYS finite element software to simulate the soil dynamic nonlinearity and analyze the dynamic interaction between the soil–pile–structure. The method was then applied to the substructure pseudo-dynamic test of soil–pile–structure dynamic interaction, which was realized experimentally in the lab. The substructure pseudo-dynamic test of the soil–pile–structure dynamic interaction proposed in this paper simulates the dynamic nonlinearity action of the soil. It does not need particularly good test instruments or complex test systems and can be adopted as the test method commonly used by researchers.
In the improved Penzien model, ANSYS was used to calculate the dynamic response of the free field, and the obtained soil acceleration was substituted into the dynamic equation. In the ANSYS model, the Davidenkov model has been applied to the dynamic nonlinearity simulation of soil considering the interaction between the soil and structure.
Considering the interaction between soil and structure, the interaction reduced the acceleration of the structure, and the response appeared to indicate a hysteresis phenomenon because of the nonlinear characteristics of the soil. The influences of SPSI on the velocity and displacement were very complex. For different input amplitude values, it had the opposite influence law. Under the small earthquake inputs, SPSI increased the velocity response and the displacement response for natural vibration periods ranged from 0.5 s to 1.5 s, while under the large earthquake inputs, the opposite law was observed. For the velocity response, the differences between the SPSI and no-SPSI models for natural vibration periods greater than 1.5 s are very small, but the differences are very large for the displacement response under the large earthquake input, and SPSI decreased the displacement response. More earthquake waves and earthquake input amplitudes are needed to study the effect of SPSI on velocity and displacement. The conclusions are reasonable, which proves that the substructure pseudo-dynamic test method of soil–pile–structure dynamic interaction using the improved Penzien model is feasible.

Author Contributions

Conceptualization, F.X.; methodology, Q.G.; software, T.Z. and Y.L.; validation, Q.G. and T.Z.; formal analysis, M.R.; investigation, J.C.; resources, Q.G.; data curation, Q.G.; writing—original draft preparation, Q.G.; writing—review and editing, Q.G.; visualization, Q.G.; supervision, Q.G.; project administration, Q.G. and Y.L.; funding acquisition, Q.G. and F.X. All authors have read and agreed to the published version of the manuscript.

Funding

The financial support of the Subproject of the National Natural Science Foundation of China (Grant No.: 51508357); the science and technology innovation cooperation plan between Hong Kong, Macao, and Taiwan, and the international scientific and technological innovation cooperation of Sichuan province, China (Grant No.: 2019YFH0120).

Institutional Review Board Statement

Not applicable.

Informed Consent Statement

Not applicable.

Data Availability Statement

Not applicable.

Acknowledgments

The authors are grateful to the laboratory technicians for their assistance in making the specimens.

Conflicts of Interest

The authors declare no conflict of interest.

References

  1. NIST GCR 12-917-21; Soil-Structure Interaction for Building Structures. NEHRP Consultants Joint Venture: Gaithersburg, MA, USA, 2012.
  2. FEMA P-58; Development of Next Generation Performance-Based Seismic Design Procedures for New and Existing Buildings. Federal Emergency Management Agency: Washington, DC, USA, 2018.
  3. Chopra, A.K.; Gutierrez, J.A. Earthquake response analysis of multistory buildings including foundation interaction. Earthq. Eng. Struct. Dyn. 1974, 3, 65–77. [Google Scholar] [CrossRef]
  4. Ghannad, M.A.; Jahankhah, H. Site-dependent strength reduction factors for soil–structure systems. Soil. Dyn. Earthq. Eng. 2007, 27, 99–110. [Google Scholar] [CrossRef]
  5. Khoshnoudian, F.; Ahmadi, E.; Nik, F.A. Inelastic displacement ratios for soil–structure systems. Eng. Struct. 2013, 57, 453–464. [Google Scholar] [CrossRef]
  6. Gharad, A.M.; Sonparote, R.S. Study of direct finite element method of analysing soil-structure interaction in a simply supported railway bridge subjected to resonance. IJST-T. Civ. Eng. 2019, 43, 273–286. [Google Scholar] [CrossRef]
  7. Veletsos, A.S.; Verbic, B. Vibration of viscoelastic foundations. Earthq. Eng. Struct. Dyn. 1973, 2, 87–102. [Google Scholar] [CrossRef]
  8. Mita, A.; Yoshida, K.; Kumagai, S.; Shioya, K. Soil structure interaction experiment using impulse-response. Earthq. Eng. Struct. Dyn. 1989, 18, 727–744. [Google Scholar] [CrossRef]
  9. Veletsos, A.S.; Verbic, B. Basic response functions for elastic foundations. J. Eng. Mech. Div.-ASCE 1974, 100, 189–202. [Google Scholar] [CrossRef]
  10. Mylonakis, G.; Nikolaou, S.; Gazetas, G. Footings under seismic loading: Analysis and design issues with emphasis on bridge foundations. Soil Dyn. Earthq. Eng. 2006, 26, 824–853. [Google Scholar] [CrossRef]
  11. Asadi-Ghoozhdi, H.; Attarnejad, R. The effect of nonlinear soil-structure interaction on the ductility and strength demands of vertically irregular structures. Int. J. Civ. Eng. 2020, 18, 1209–1228. [Google Scholar] [CrossRef]
  12. Amiri, A.M.; Ghanbari, A.; Derakhshandi, M. Analytical model for natural frequency of SDOF system considering soil-pile-structure interaction. Int. J. Civ. Eng. 2018, 16, 1399–1411. [Google Scholar] [CrossRef]
  13. Casciati, S.; Borja, R.L. Dynamic FE analysis of South Memnon Colossus including 3D soil-foundation-structure interaction. Comput. Struct. 2004, 82, 1719–1736. [Google Scholar]
  14. Amorosi, A.; Boldini, D.; di Lerniac, A. Dynamic soil-structure interaction: A three-dimensional numerical approach and its application to the Lotung case study. Comput. Geotech. 2017, 90, 349–354. [Google Scholar] [CrossRef]
  15. Galvin, P.; Romero, A. A 3D time domain numerical model based on half-space Green’s function for soil-structure interaction analysis. Comput. Mech. 2014, 53, 1073–1085. [Google Scholar] [CrossRef]
  16. Jiang, S.Y.; Du, C.B.; Sun, L.G. Numerical analysis of sheet pile wall structure considering Soil–structure interaction. Geomech. Geoengin. 2018, 16, 309–320. [Google Scholar]
  17. Sarlak, A.; Saeedmonir, H.; Gheyratmand, C. Numerical and experimental study of soil–structure interaction in structures resting on loose soil using laminar shear box. Int. J. Eng. Sci. 2017, 30, 1654–1663. [Google Scholar]
  18. Kildashti, K.; Dolatshahi, K.M.; Mirghaderi, R. A case study on the soil–pile–structure interaction of a long span arched structure. Struct. Infrastruct. Eng. 2016, 12, 1614–1633. [Google Scholar] [CrossRef]
  19. Chen, S.S.; Shi, J.Y.; Wu, Y.Y. Numerical damage localisation for building systems including dynamic soil–structure interaction. Struct. Infrastruct. Eng. 2019, 15, 362–375. [Google Scholar] [CrossRef]
  20. Li, P.Z.; Yang, J.P.; Lu, Z. Shaking table test and theoretical analysis of the pile–soil–structure interaction at a liquefiable site. Struct. Des. Tall Spec. Build. 2018, 27, e1513. [Google Scholar] [CrossRef]
  21. Aldimashki, M.M.; Brownjohn, J.M.W.; Bhattacharya, S. Experimental and analytical study of seismic soil–pile–structure interaction in layered soil half-space. J. Earthq. Eng. 2014, 18, 655–673. [Google Scholar] [CrossRef]
  22. Chau, K.T.; Shen, C.Y.; Guo, X. Nonlinear seismic soil–pile–structure interactions: Shaking table tests and FEM analyses. Soil. Dyn. Earthq. Eng. 2009, 29, 300–310. [Google Scholar] [CrossRef]
  23. Martakis, P.; Taeseri, D.; Chatzi, E.; Laue, J. A centrifuge-based experimental verification of Soil–structure Interaction effects. Soil. Dyn. Earthq. Eng. 2017, 103, 1–14. [Google Scholar]
  24. Trombetta, N.W.; Mason, H.B.; Hutchinson, T.C.; Zupan, J.D.; Bray, J.D.; Kutter, B.L. Nonlinear soil–foundation–structure and structure–soil–structure interaction: Centrifuge test observations. J. Geotech. Geoenviron. 2014, 140, 04013057. [Google Scholar]
  25. Buenker, J.M.; Brandenberg, S.J.; Stewart, J.P. Centrifuge testing of soil-structure interaction effects on cyclic failure potential of fine-grained soil. Earthq. Spectra 2021, 37, 1177–1198. [Google Scholar] [CrossRef]
  26. Lisa, M.S.; Salih, T.; Michael, J.G.; George, M.; Jonathan, P.S. Evaluation of soil–structure interaction effects from system identification of structures subject to forced vibration tests. Soil. Dyn. Earthq. Eng. 2019, 116, 747–760. [Google Scholar]
  27. Zangeneh, A.; Svedholm, C.; Andersso, A.; Pacoste, C.; Karoumi, R. Identification of soil–structure interaction effect in a portal frame railway bridge through full-scale dynamic testing. Eng. Struct. 2018, 159, 299–309. [Google Scholar] [CrossRef]
  28. Lisa, M.S.; Michael, J.G.; Robert, L.N.; Jonathan, P.S. Field-testing of structure on shallow foundation to evaluate soil–structure interaction effects. Earthq. Spectra 2015, 31, 2511–2534. [Google Scholar]
  29. Choi, J.S.; Yun, C.B.; Kim, J.M. Earthquake response analysis of the Hualien soil–structure interaction system based on updated soil properties using forced vibration test data. Earthq. Eng. Struct. Dyn. 2001, 30, 1–26. [Google Scholar] [CrossRef]
  30. Sugawara, Y.; Uetake, T.; Kobayashi, T.; Yamaya, H. Forced vibration test of the Hualien large scale soil structure interaction model (part 2). Nucl. Eng. Des. 1997, 172, 273–280. [Google Scholar]
  31. Liu, J.B.; Zhao, D.D.; Zhang, X.B.; Wang, W.H. Dynamic centrifuge model tests on an unconfined soil foundation. Chin. J. Geotech. Eng. 2013, 35, 980–987. [Google Scholar]
  32. Luco, J.E.; Wong, H.L. Forced vibration of the Lotung containment model: Theory and observations. J. Eng. Mech. 1990, 116, 845–861. [Google Scholar] [CrossRef]
  33. Stewart, J.P.; Fenves, G.L.; Seed, R.B. Seismic soil-structure interaction in buildings II: Empirical findings. J. Geotech. Geoenviron. 1999, 125, 38–48. [Google Scholar] [CrossRef]
  34. Nakashima, M.; Takai, H. Use of Substructures in Pseudo Dynamic Testing; Building Research Institute of Japan, Ministry of Construction: Tsukuba, Japan, 1995. [Google Scholar]
  35. Pauschke, J.; Anderson, T.L.; Goldstein, S.N. Construction status of the George E. Brown, Jr. Network for earthquake engineering simulation. In Proceedings of the 7th US National Conference on Earthquake Engineering, Boston, MA, USA, 21–25 July 2002; pp. 9–19. [Google Scholar]
  36. Stojadinovic, B.; Mosqueda, G.; Mahin, S.A. Event-driven control system for geographically distributed hybrid simulation. J. Struct. Eng. 2006, 132, 68–77. [Google Scholar] [CrossRef]
  37. Sugiura, K.; Nagata, N.; Suzuka, Y. Internet related structural testing. In Proceedings of the Eighth KKNN Seminar on Civil Engineering, Singapore, 30 November–1 December 1998; pp. 219–224. [Google Scholar]
  38. Takashi, Y.; Kazutoshi, N.; Eiichi, W. International collaborative pseudo dynamic testing method for continuous elevated bridges by using Internet. Adv. Exp. Struct. Eng. 2005, 18, 371–376. [Google Scholar]
  39. Yang, Y.S.; Wang, K.J.; Wang, S.J.; Hsu, C.W.; Tsai, K.C.; Hsien, S.H. Networked pseudo-dynamic testing part I: Database approach. Earthq. Eng. Struct. Dyn. 2007, 36, 2291–2306. [Google Scholar] [CrossRef]
  40. Wang, S.J.; Wang, K.J.; Yang, Y.S.; Cheng, W.C.; Yeh, C.C.; Tsai, K.C. Networked pseudo-dynamic testing part II: Application protocol Approach. Earthq. Eng. Struct. Dyn. 2007, 36, 2307–2323. [Google Scholar] [CrossRef]
  41. Yang, Y.S.; Wang, S.J.; Wang, K.J.; Tsai, K.C.; Hsien, S.H. ISEE: Internet-based Simulations for earthquake engineering, Part I: The database approach. In Proceeding of the 13th World Conference on Earthquake Engineering, Vancouver, BC, Canada, 1–6 August 2004; p. 1910. [Google Scholar]
  42. Wang, K.J.; Wang, S.J.; Yang, Y.S.; Cheng, W.C.; Tsai, K.C. ISEE: Internet-based simulations for earthquake engineering, Part II: The application protocol approach. In Proceeding of the 13th World Conference on Earthquake Engineering, Vancouver, BC, Canada, 1–6 August 2004; p. 1548. [Google Scholar]
  43. Xiao, Y.; Hu, Q.; Guo, Y.R.; Yi, W.J.; Zhu, P.S. A network platform for remote pseudo-dynamic testing. J. Build. Struct. 2005, 2, 122–128. [Google Scholar]
  44. Guo, Y.R.; Zeng, D.; Xiao, Y. Development of a remotely collaborative pseudo-dynamic testing platform for bridge structures. J. Hunan Univ. Nat. Sci. 2009, 36, 1–6. [Google Scholar]
  45. Kohh, H.H.; Tsai, K.C.; Tsai, C.Y.; Tsai, C.Y.; Wang, K.J. Bidirectional substructure pseudo-dynamic tests and analysis of a full-scale two-story buckling-restrained braced frame. Earthq. Eng. Struct. Dyn. 2016, 45, 1085–1107. [Google Scholar]
  46. Chen, Z.X.; Xu, G.S.; Wu, B.; Sun, Y.T.; Wang, H.D.; Wang, F.L. Equivalent force control method for substructure pseudo-dynamic test of a full-scale masonry structure. Earthq. Eng. Struct. Dyn. 2014, 43, 969–983. [Google Scholar] [CrossRef]
  47. Kwon, O.S.; Elnashai, A.S.; Spencer, B.F. A framework for distributed analytical and hybrid simulations. Struct. Eng. Mech. 2008, 30, 331–350. [Google Scholar] [CrossRef]
  48. Chang, M.; Kim, J.K. Pseudo-dynamic test for soil–structure interaction analysis using shake tables. KSCE J. Civ. Eng. 2019, 23, 2313–2323. [Google Scholar] [CrossRef]
  49. Lysmer, J.; Westman, R.A. Dynamic response of footing to vertical loading. J. Soil Mech. Found. Div. Am. Soc. Civ. Eng. 1996, 92, 1965–1991. [Google Scholar]
  50. McClelland, B.; Focht, J.A.J. Soil modulus for laterally loaded piles. Trans. Am. Soc. Civ. Eng. 1958, 123, 1049–1086. [Google Scholar] [CrossRef]
  51. Penzien, J.; Scheffy, C. Seismic analysis of bridge on long piles. J. Eng. Mech. 1964, 90, 223–254. [Google Scholar] [CrossRef]
  52. Zou, L.H.; Huang, K.; Wang, L.Y. Vibration control of adjacent buildings considering pile-soil-structure interaction. J. Vib. Control 2011, 18, 684–695. [Google Scholar] [CrossRef]
  53. Zou, L.H.; Fang, L.K.; Huang, K.; Wang, L.Y. Vibration Control of Soil-structure Systems and Pile-soil-structure Systems. KSCE J. Civ. Eng. 2012, 16, 794–802. [Google Scholar]
  54. Duan, L.; Zhao, R.X. Analysis of Long-period Seismic Response of Long-span Cable-stayed Bridge Considering Soil-structure Interaction. J. Highw. Transp. Res. Dev. 2012, 9, 76–82. [Google Scholar]
  55. Clough, R.W.; Penzien, J. Dynamics of Structures; McGraw-Hill: New York, NY, USA, 1993. [Google Scholar]
  56. Wen, S.L.; Dai, G.L.; Yu, Z.W.; Chen, F.; He, X.H. Interaction between continuous welded rail and long-span steel truss arch bridge of a high-speed railway under seismic action. Struct. Infrastruct. Eng. 2018, 14, 1051–1064. [Google Scholar]
  57. Idriss, I.M.; Sun, I.J. User’s Manual for SHAKE91: A Computer Program for Conducting Equivalent Linear Seismic Response Analyses of Horizontally Layered Soil Deposits; Center for Geotechnical Modeling, Department of Civil & Environmental Engineering, University of California: Davis, CA, USA, 1992. [Google Scholar]
  58. Yang, C.Y. Theoretical Model Study and Parameter Analysis of Pile-Soil-Structure Dynamic Interaction; Tongji University: Shanghai, China, 2003. [Google Scholar]
  59. Ge, Q.; Xiong, F.; Xie, L.W.; Chen, J.; Yu, M.J. Dynamic interaction of soil-structure cluster. Soil Dyn. Earthq. Eng. 2019, 123, 16–30. [Google Scholar] [CrossRef]
  60. Ge, Q.; Xiong, F.; Chen, J.; Yao, Z.Y. Effects of soil–structure cluster interactions on ground motions. Struct. Des. Tall Spec. Build. 2020, 29, 1–16. [Google Scholar] [CrossRef]
  61. Idriss, I.M.; Seed, H.B. Seismic response of horizontal soil layers. Am. Soc. Civil Engr. J. Soil Mech. 1968, 94, 1003–1031. [Google Scholar] [CrossRef]
  62. Seed, H.B.; Idriss, I.M. Soil Moduli and Damping Factors for Dynamic Response Analysis; Report No. EERC70-10; Earthquake Engineering Research Center, University of California: Berkeley, CA, USA, 1970. [Google Scholar]
  63. Hardin, B.O.; Drnevich, V.P. Shear modulus and damping in soils: Design equations and curves. J. Soil Mech. Found. Div. Am. Soc. Civ. Eng. 1972, 98, 667–691. [Google Scholar] [CrossRef]
  64. Martin, P.P. Nonlinear Method for Dynamic Analysis of Ground Response. Ph.D. Thesis, University of California, Berkeley, CA, USA, 1975. [Google Scholar]
  65. Martin, P.P.; Seed, H.B. One-dimensional dynamic ground response analyses. ASCE J. Soil Mech. Found. Div. 1982, 108, 935–952. [Google Scholar] [CrossRef]
  66. Chen, B.; Lv, X.L.; Li, P.Z.; Chen, Y.Q. Modelling of dynamic Soil–structure interaction by ANSYS program. Earthq. Eng. Eng. Vib. 2002, 22, 126–131. [Google Scholar]
  67. Ge, Q.; Xiong, F.; Zhang, J.; Chen, J. Shaking table test of dynamic interaction of soil–high-rise buildings. Eur. J. Environ. Civ. Eng. 2017, 21, 249–271. [Google Scholar] [CrossRef]
  68. Chen, G.X.; Liu, X.Z. Experimental study on dynamic shear modulus and damping ratio of recently deposited soils in Nanjing and its neighboring areas. J. Disaster Prev. Mitig. 2014, 24, 168–176. [Google Scholar]
  69. Lysmer, J.; Udaka, T.; Tsai, C.F. A Computer Program for Approximate 3-D Analysis of Soil-Structure Interaction Problems; Report No. EERC 75-30; Earthquake Engineering Research Center, College of Engineering, University of California: Berkeley, CA, USA, 1975. [Google Scholar]
  70. Yan, S.C.; Du, Y.P. Seismic response analysis of TV tower-pile-soil interaction system. China Civ. Eng. J. 1991, 24, 71–79. [Google Scholar]
  71. Chopra, A.K. Dynamics of Structures: Theory and Applications to Earthquake Engineering, 4th ed.; Prentice Hall: Upper Saddle River, NJ, USA, 2012. [Google Scholar]
  72. GB50010-2010; Code for Seismic Design of Buildings (2016 Version). China Architecture and Industry Press: Beijing, China, 2010.
  73. Yuan, X.M.; Sun, R.; Sun, J.; Meng, S.J.; Shi, Z.J. Laboratory experimental study on dynamic shear modulus ratio and damping ratio of soils. Earthq. Eng. Eng. Vib. 2000, 20, 133–139. [Google Scholar]
Figure 1. Penzien model.
Applsci 13 06709 g001
Figure 2. Improved Penzien model.
Applsci 13 06709 g002
Figure 3. Flowchart for the calculation process of soil dynamic nonlinearity.
Applsci 13 06709 g003
Figure 4. Schematic diagram of the test model.
Applsci 13 06709 g004
Figure 5. Acceleration time history of the El-central earthquake.
Applsci 13 06709 g005
Figure 6. Fitted G/Gmax~γd and D~γd curves for clay.
Applsci 13 06709 g006
Figure 7. Fitted G/Gmax~γd and D~γd curves for silty clay.
Applsci 13 06709 g007
Figure 8. Fitted G/Gmax~γd and D~γd curves for silty.
Applsci 13 06709 g008
Figure 9. Element number of the substructure pseudo-dynamic test.
Applsci 13 06709 g009
Figure 10. Acceleration time history curves for the earthquake input 0.1 g.
Applsci 13 06709 g010
Figure 11. Acceleration time history curves for the earthquake input 0.2 g.
Applsci 13 06709 g011
Figure 12. Acceleration response spectra for the earthquake input 0.1 g.
Applsci 13 06709 g012
Figure 13. Acceleration response spectra for the earthquake input 0.2 g.
Applsci 13 06709 g013
Figure 14. Velocity response spectra for the earthquake input 0.1 g.
Applsci 13 06709 g014
Figure 15. Velocity response spectra for the earthquake input 0.2 g.
Applsci 13 06709 g015
Figure 16. Displacement response spectra for the earthquake input 0.1 g.
Applsci 13 06709 g016
Figure 17. Displacement response spectra for the earthquake input 0.2 g.
Applsci 13 06709 g017
Table 1. Soil material parameters.
Soil TypeHeight (m)Shear Wave Velocity m/sDensity
(kg/m3)
Poisson’s RatioDamping RatioShear Modulus
(MPa)
Elasticity Modulus (MPa)
Clay413519800.220.012048.8
Silty clay421020100.240.013996.7
Silty833020100.260.0156141.1
Table 2. Data of the curves of the dynamic shear modulus ratio G/Gmax and damping ratio D changing with shear strain γ.
Soil TypeParameterShear Strain γ (10−4)
0.050.10.5151050100
ClayG/Gmax0.99540.98970.94650.89750.63470.46470.14780.0798
D0.03420.04080.06080.07160.12840.17030.24020.2543
Silty clayG/Gmax0.99360.98580.92740.86340.55630.38510.11120.0589
D0.02230.02760.04470.05490.11310.13830.17350.1798
SiltyG/Gmax0.99190.98390.92420.85910.54950.37880.10870.0575
D0.01290.01740.03420.04450.09340.12200.16200.1689
Table 3. Fitted values of parameters in the Davidenkov model.
Soil TypeABγDminD0β
Clay1.017120.498528.47 × 10−40.036990.232880.88074
Silty clay1.022370.498126.07 × 10−40.018330.169410.72872
Silty1.000030.499986.10 × 10−40.012350.164160.84408
Table 4. Peak accelerations of each floor of the superstructures.
FloorAcceleration (m/s2)
(for Input 0.1 g)
Difference (%)Acceleration (m/s2)
(for Input 0.2 g)
Difference (%)
SPSINo SPSISPSINo SPSI
61.8232.657−314.4535.319−16
51.6862.466−323.9784.933−19
41.5512.214−303.2144.427−27
31.4021.914−272.5543.833−33
21.4701.722−152.4063.446−30
11.3991.539−92.4123.080−22
Disclaimer/Publisher’s Note: The statements, opinions and data contained in all publications are solely those of the individual author(s) and contributor(s) and not of MDPI and/or the editor(s). MDPI and/or the editor(s) disclaim responsibility for any injury to people or property resulting from any ideas, methods, instructions or products referred to in the content.