Article

Double-Bend and Semi-Spherical Energy Deflectors’ Blast Load Efficiency—A Comparative Study

Faculty of Mechanical Engineering, Military University of Technology, Sylwestra Kaliskiego 2 Street, 00-908 Warsaw, Poland
*
Author to whom correspondence should be addressed.
Appl. Sci. 2023, 13(11), 6752; https://doi.org/10.3390/app13116752
Submission received: 10 May 2023 / Revised: 30 May 2023 / Accepted: 31 May 2023 / Published: 1 June 2023
(This article belongs to the Section Mechanical Engineering)

Abstract

:
The experience of recent military missions clearly shows the importance of protecting vehicles and the people they carry from mines and IEDs. This protection can be achieved in many ways, using both active and passive solutions. One of the most popular solutions is using energy deflectors, which, thanks to their appropriately selected shape, can dissipate the energy from the detonation of an explosive charge, thus reducing the blast wave loading on the protected structure. The article presents the research results on two innovative groups of deflectors—double-bend and semi-spherical, characterized by a better ability to disperse energy than traditionally used V-shaped deflectors. Several possible geometric shapes differing in critical dimensions were selected, and both experimental studies and numerical analyses were carried out. A ballistic pendulum was used to measure individual deflectors’ performances. The tests proved the tested solutions’ increased effectiveness compared with V-shaped deflectors.

1. Introduction

The experience of NATO forces during the conflicts in Iraq and Afghanistan has shown the importance of protecting vehicles and crews from mines and IEDs. Between 1970 and 2016, more than 170,000 terrorist attacks occurred worldwide, and more than half of these attacks involved an explosive device [1]. Most of these attacks took place in Iraq and Afghanistan.
Increasing the protection of vehicles (crews), aerospace vehicles, marine vessels, nuclear power plants, and other critical infrastructures from blast waves from detonating devices containing an explosive is possible by:
  • Increasing the distance from the explosive;
  • Using energy-absorbing panels;
  • Appropriate shaping of the vehicle bottom—the use of deflectors.
Detonating a charge placed on a surface generates a hemispherical pressure wave with high dynamics and a maximum pressure of several tens of gigapascals. The intensity of the propagating blast wave decreases rapidly with increasing distance from the charge. As a consequence, the ability of the propagating blast wave to transfer momentum to the object decreases. In the case of charges placed in the ground, the ejected soil is another factor causing damage. The influence of the ejected soil on the object decreases with increasing distance, as in a blast wave case. The presence of a deflector causes the reduction in the blast wave loading on the structure due to wave reflection, whereas in the case of energy-absorbing panels, the blast wave acting on the panel causes its plastic deformation and cracking/destruction, crushing the internal structure of the panel and reducing both the maximum load value and the transmitted impulse value transmitted to the protected structure.
The first available publications in this area considered the loading of a solid plate with a shock wave propagated in water [2,3]. In this work, a one-dimensional fluid–structure interaction model was developed, showing that using a solid plate with sufficiently low inertia can reduce the intensity of both the transmitted and reflected waves. This work was further developed by Kambouchev et al. and Hutchinson for the case of highly compressible fluids such as air [4,5]. Using Rankine–Hugoniot relationships for highly compressible gases, Wang et al. developed a new fluid–structure interaction model, which was verified experimentally [6].
Energy-absorbing panels are made of at least two sheets of material with a lightweight core and are characterized by high stiffness and bending strength at relatively low weight. Due to their construction, energy-absorbing panels deflect less than the corresponding solid panels under low-intensity blast wave loading [7]. Bending, fracturing of all panel components, and crushing of the panel core is essential for higher-intensity blast pulse values [7,8]. The studies of the structural responses of the sandwich structures with metal face sheets and different kinds of cores have been conducted experimentally [7,9,10] and numerically [7,11]. Panels with different filling core types, continuous [10,11] and discrete [7,8,12,13,14], were investigated. Much investigation has been performed on aluminum foam-filled panels because of their properties, including high energy absorption capabilities [9,11]. The research also included analyses of the projectile/fragments’ impacts on the panels and the coupled blast wave and fragments’ impacts on the panels [15,16].
It should be noted that studies of panels with discrete structures can be divided into studies before the popularization of different types of printing methods [17,18,19] of various materials (polymers [18], metals [17,19,20,21]) and after the popularization of this type of printing. The first work concerned the study of panels with a core made by traditional methods in the forms of honeycomb [7,12,18], lattice (trust) [8,13], and cone [14], made of both metals [7,8,12] and composites [14]. Furthermore, the development of various printing methods has made it possible to produce various structures, including auxetic structures with a negative Poisson’s ratio [22,23].
The impedance of soil is significantly greater than that of air, so the ejected soil action causes more deformation and damage to energy-absorbing panels than does blast wave action. This effect was studied experimentally [24,25] and numerically [24,25,26].
One of the first published studies of V-shaped plates for blast resistance was performed using a ballistic pendulum [27]. The V-shaped plates with deflection angles from 60° to 180° loaded with blast waves from the detonations of small charges (2.5–13 g) were tested. Nurick and Lockley showed that with decreasing deflector angles, the effectiveness of the deflector increases, as a more significant portion of the blast wave is reflected. This research, conducted experimentally and numerically, was continued by Nurick et al. [28]. In addition to confirming the earlier results, their study showed that an increase in the impulse (smaller distance or more significant charge) results in more deflection of the V-shaped plates. It was also found that the deflection of V-shaped plates is less for plates characterized by a smaller angle. Zhao et al. [29] studied various modifications of plates with the dilation angle of 154° loaded with an impact of granular material slugs driven by a blast wave from the detonation of 1 g PETN [29,30]. They also determined the Head Injury Criterion (HIC) index for the analyzed cases. The use of a V-shaped plate allowed for an approximately 100-fold reduction in acceleration and a similar reduction in HIC index values. Anderson studied not only the process of momentum transfer to the plate for non-deformable plates with angles of 90° and 120°, but also the effect of soil hydration on this process [31]. Increasing the density of the sand by hydration increased the momentum transferred, whereas decreasing the deflector angle decreased the momentum. In turn, numerical analyses reflecting a real structure loaded with a blast wave from the detonations of charges with masses of 14, 17, and 21 kg showed that a deflector with an opening angle of 160° is inferior to a flat plate [32]. Trajkovski et al. studied, using the finite element method coupled with the smoothed particle method, the effects of centric and non-centric blast wave loadings of a V-shaped plate and U-shaped plate [33]. In all the cases analyzed, the V-shaped plate better dispersed blast waves for any loading. An aluminum foam sandwich panel with V-shaped and double-V-shaped face plates was studied by Li and others [34] using the finite element method implemented in AUTODYN software. The use of aluminum foam increased the performance of the V-shaped panel.
On the other hand, for the double-V-shaped face panel, the results depended on the proper selection of the stiffness of the front and back panel sides. Stanislawek and Morka used Ls-Dyna software to study blast wave interactions with multiple-V-shaped deflectors [35]. Studies showed that usage of the multi-V-shaped deflectors results in an increase in the force peak in comparison with a single-V-shaped deflector.
As can be seen from the literature review, to date the main focus of deflector research has been on V-shaped deflectors. Multi-V-shaped systems have also been investigated; however, the results for these have not been satisfactory. For this reason, in this paper we focus on two different shapes, namely semi-spherical and double-bend. A number of these types of deflectors with different characteristic dimensions were selected for the study, and the effects of these dimensions on their performance was determined using a ballistic pendulum test stand. The carried-out tests proved that the selected deflectors are characterized by higher energy dispersion capacity than the traditional V-shape while maintaining identical external dimensions.

2. Materials and Methods

2.1. Ballistic Pendulum

There are several methods for determining deflectors’ effectiveness in their ability to absorb or dissipate energy from the detonation of an explosive charge. One of them is using a classical ballistic pendulum. The principle of its operation is based on the use of the principle of conservation of momentum. In the traditional solution, the ballistic pendulum is built in the form of a massive beam with a plate suspended on ropes. On the plate is attached the tested energy-consuming element. Detonation of the explosive charge, placed at a certain distance from the plate, causes the formation of a high-pressure wave, which then acts on the attached energy deflector, causing its deformation and deflection of the pendulum. Thus, the kinetic energy of the detonation products is not entirely converted into kinetic energy of the pendulum movement; however, the principle of conservation of momentum is preserved. It is important to remember to carefully place the explosive charge in the pendulum’s axis to ensure that the pendulum only moves in one plane.
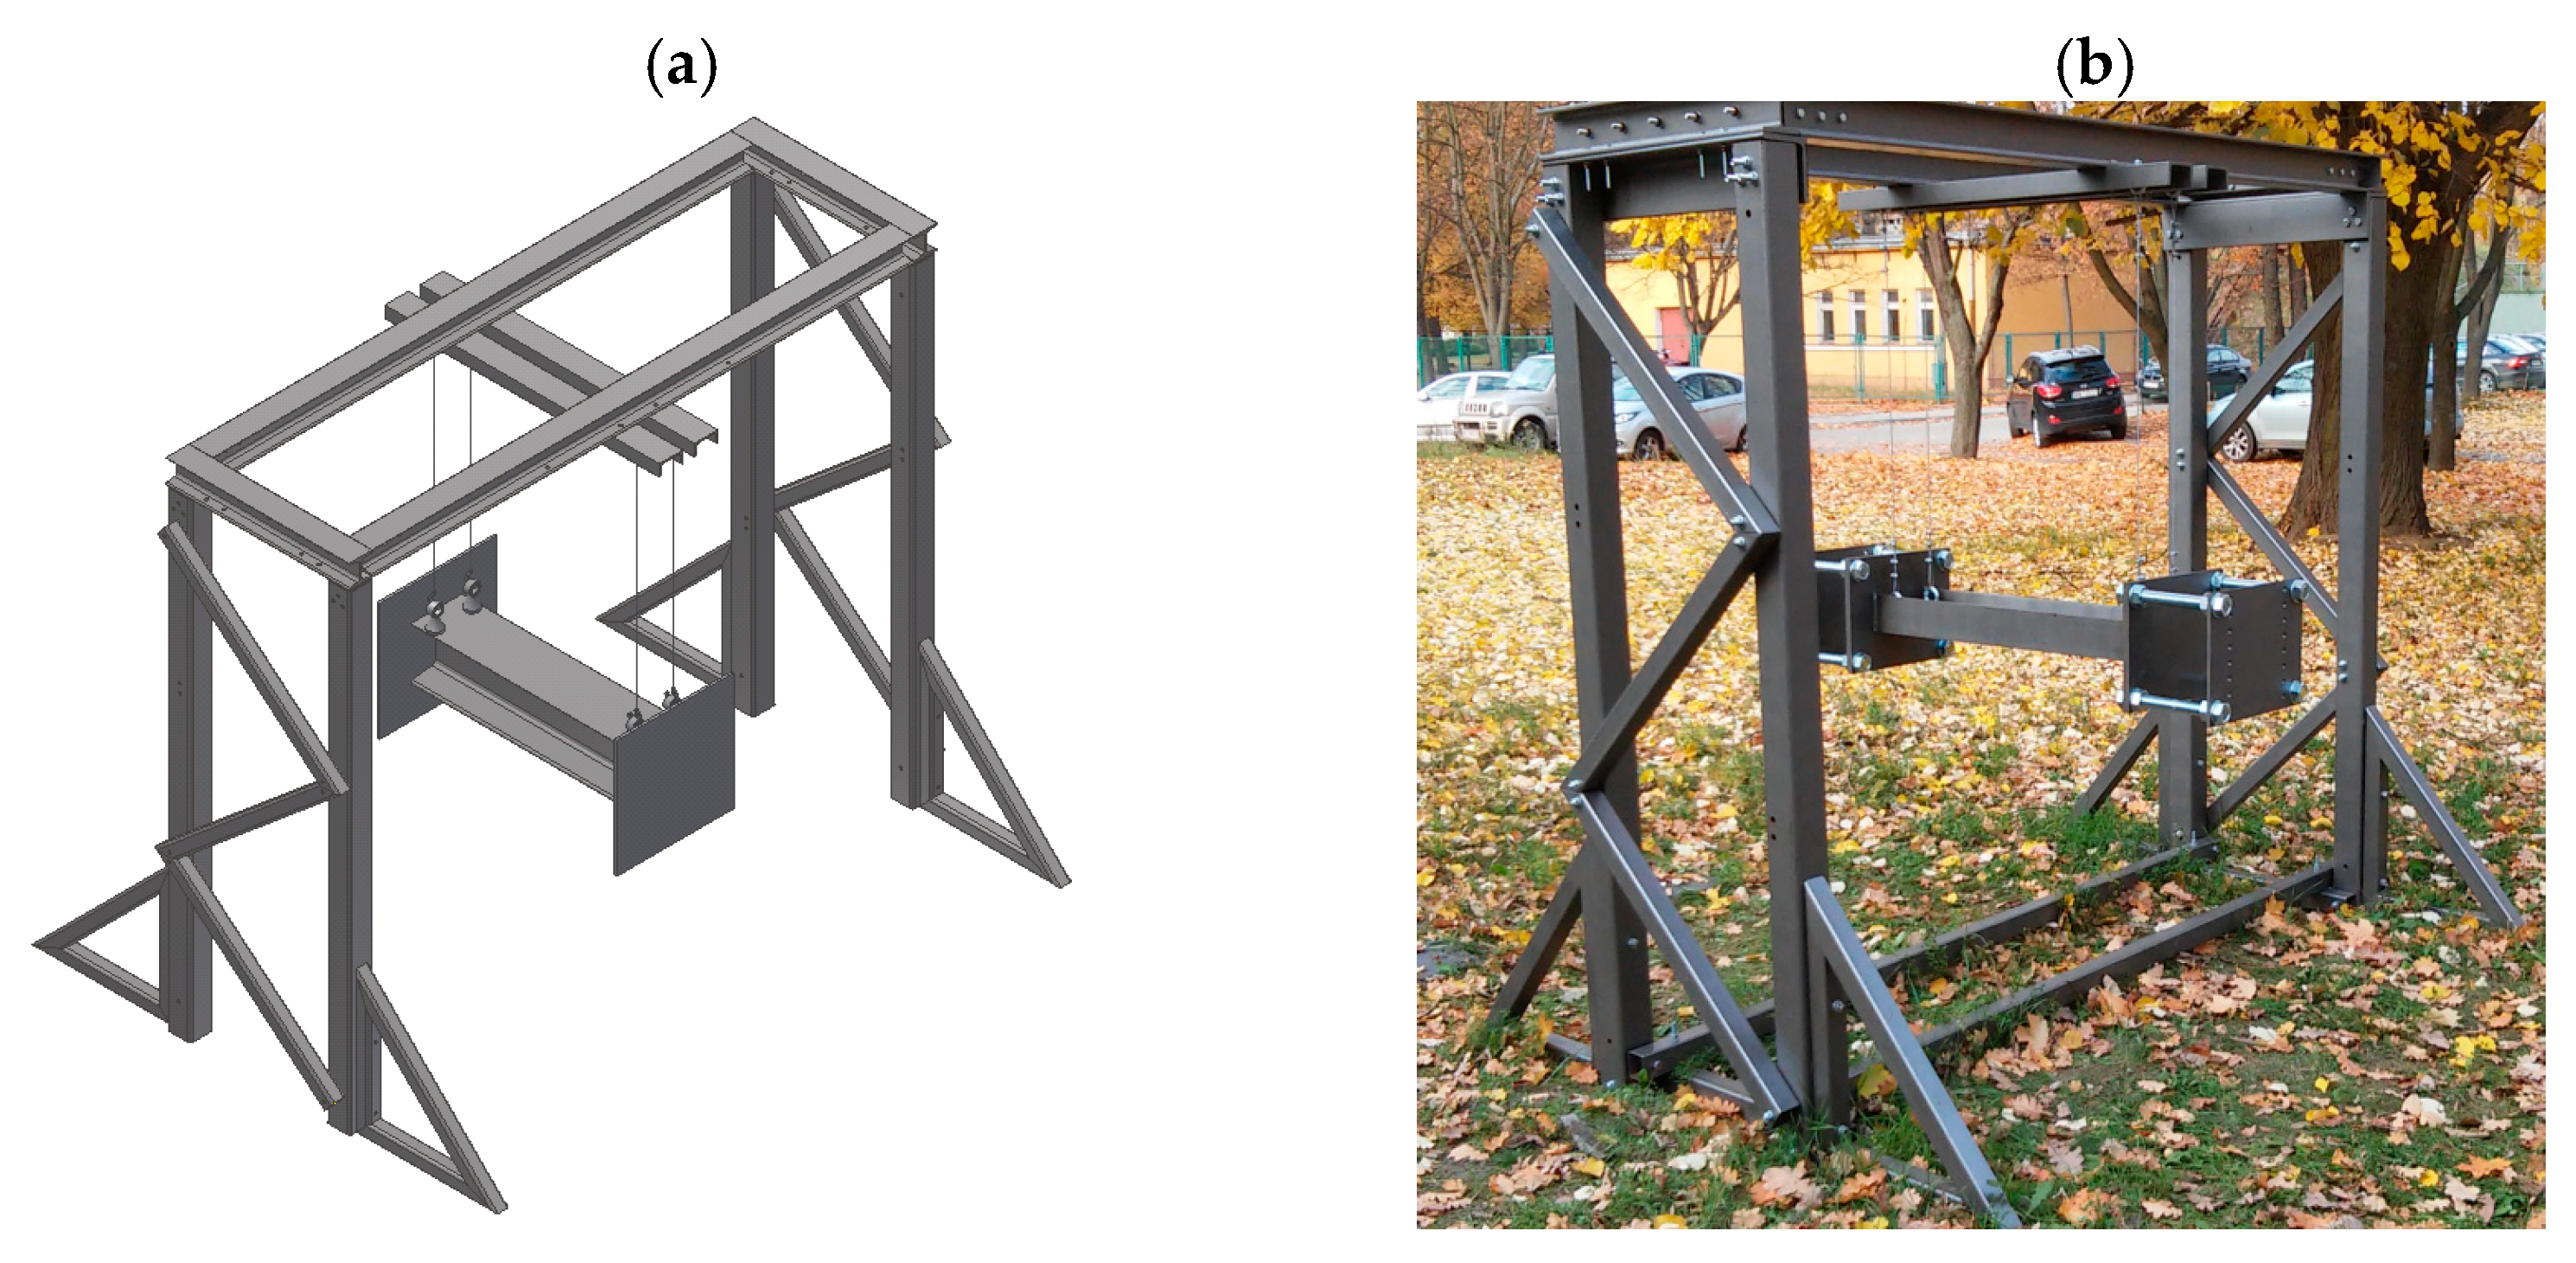
The experimental test stand was constructed at the Institute of Mechanics and Computational Engineering at the Military University of Technology. It took the form of a classical ballistic pendulum and consisted of the following main components:
  • The main pendulum beam, made of I-beam 220;
  • Steel plates (10 mm thick) attached directly to the pendulum beam at both ends;
  • Spacers (200 mm long) made of 24 mm diameter threaded rod;
  • Steel plates (20 mm) attached to the spacers and placed at the ends of the pendulum.
The plates were equipped with many holes, allowing the test energy dissipation systems to be attached. The schematic diagram of the test stand is shown in Figure 1.
The pendulum was attached to a frame made of closed steel sections using four steel cables with a diameter of 5 mm. The individual components’ dimensions and thicknesses were selected to ensure their operation only in the elastic range. In order to maintain symmetry and uniformity of loading during testing, an identical energy deflector was mounted at both ends of the pendulum beam. The test stand is presented in Figure 2.
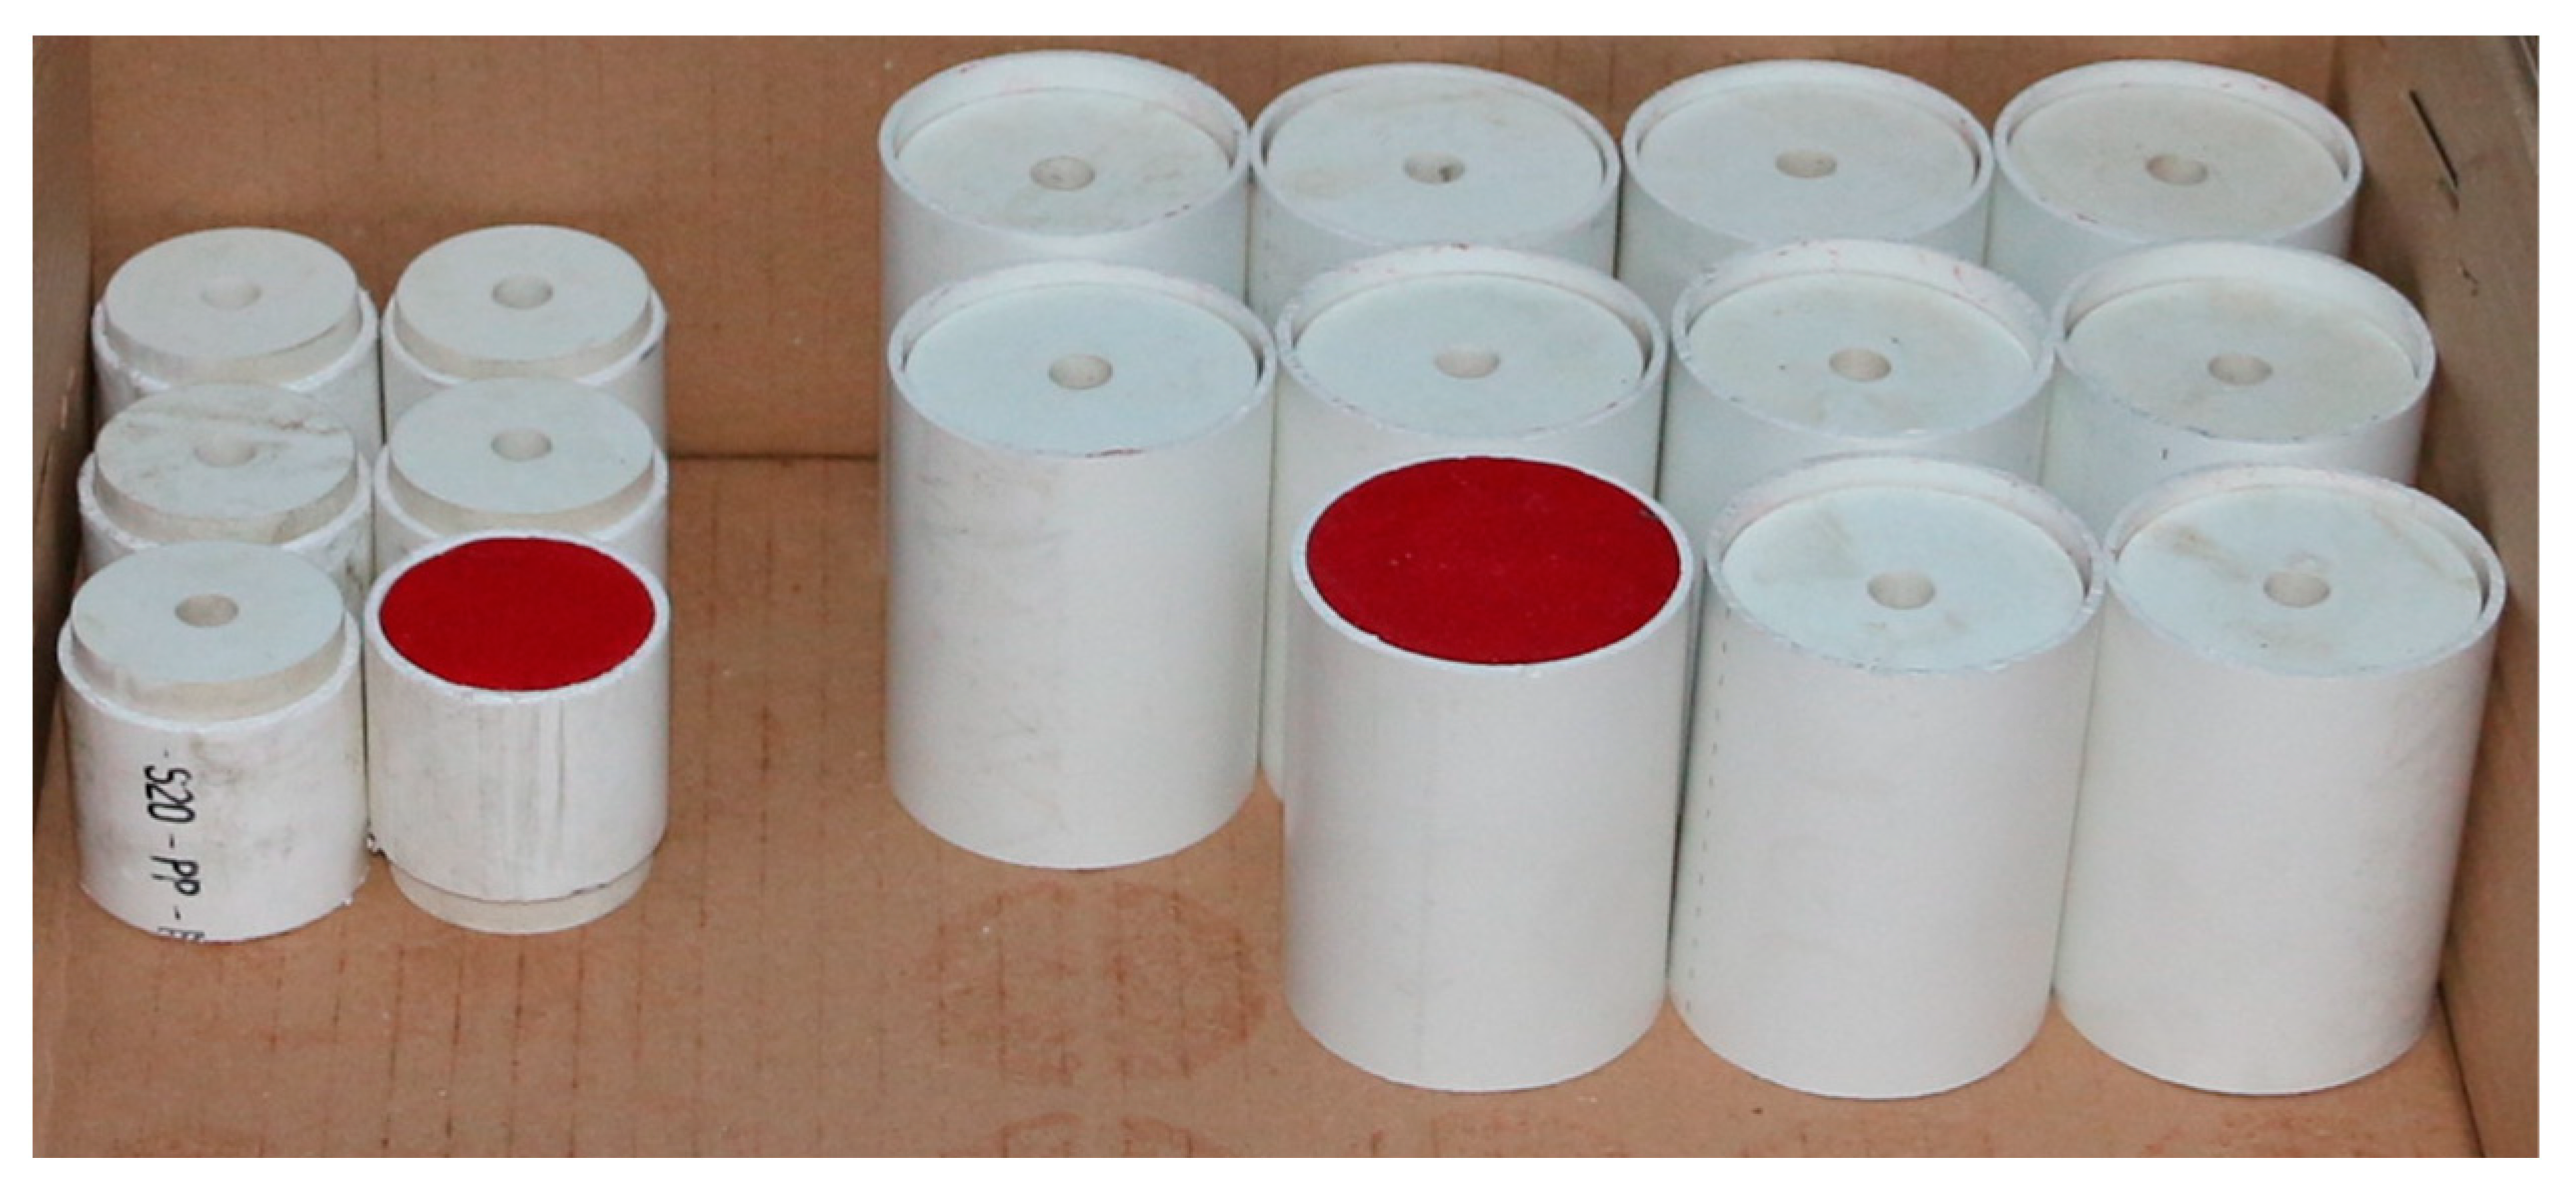
As part of the experimental study, the front part of the pendulum was dynamically loaded through the pressure wave generated by the detonation of the explosive charge. The plastic explosive used was Semtex A1 in the form of cylinders with a length-to-diameter ratio close to 1 and weights of 50 g and 100 g (Figure 3). The charges were placed on Styrofoam at various distances from the pendulum. Distances were always measured from the front plate of the pendulum.
The energy dissipation efficiency of the various structures under study was measured by recording the maximum swing of the pendulum. For this purpose, a Phantom V12 camera was used, which allows for recording high-speed phenomena due to its ability to conduct recordings at a high number of frames per second. Two markers were placed on the beam of a pendulum (halfway and at its ends) to determine the maximum swing. The technique of tracking the change in markers’ positions over time in the TEMA software made it possible to determine accurately the swing of the pendulum. Additional markers were also placed on pendulum’s frame to control whether unwanted displacement of the entire stand occurred during testing. However, compared to the energy released by the detonated charges, its mass was large enough that such a phenomenon did not occur. The ballistic pendulum’s swing was recorded at a speed of no less than 5000 fps.

2.2. Energy-Dissipating Systems under Study

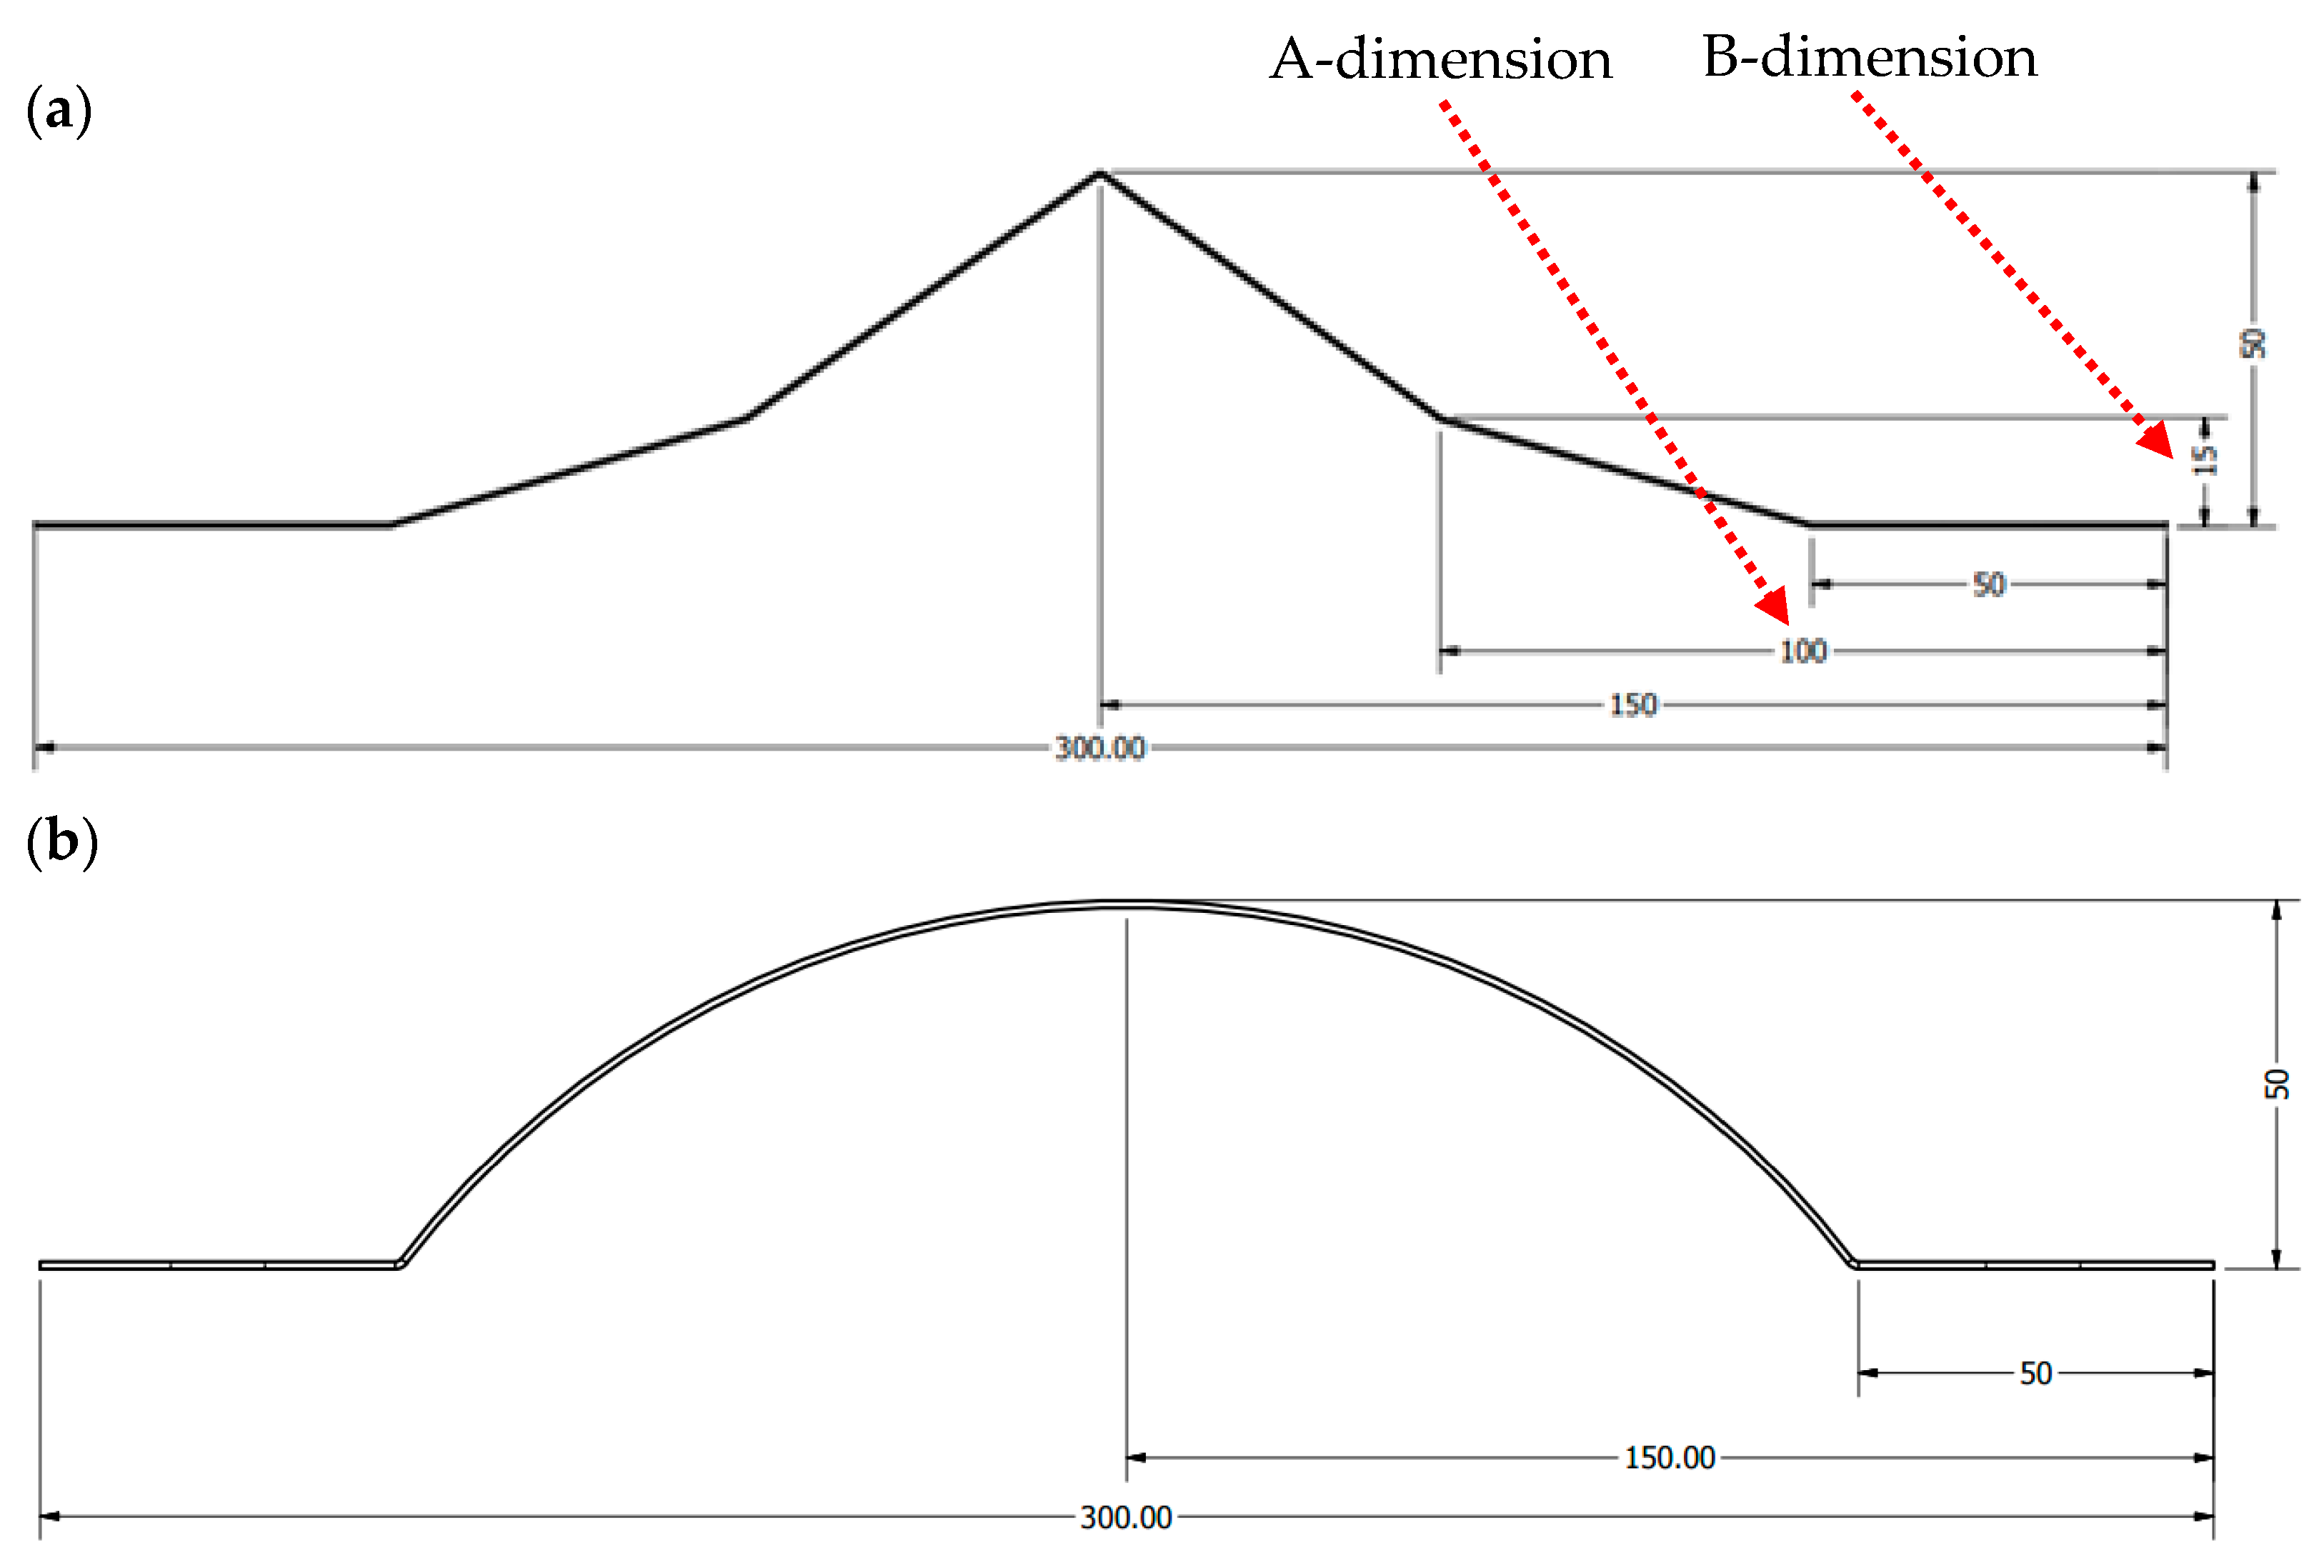
Energy deflectors with semi-spherical and double-bend shapes were selected for experimental studies. The geometric dimensions of the proposed systems are shown in Figure 4. The dimensions of the double-bend deflector are characterized by two primary values, which we call A-size and B-size. The distance in the horizontal plane from the edge of the deflector to the second bend is “A-dimension”, while the same distance but in the vertical plane is “B-dimension” (Figure 4a). In the case of semi-spherical deflectors, the leading dimension was the radius of the arc of its working part (Figure 4b). For both types of deflectors, the outer dimensions were identical at 300 × 300 mm and the thickness was 3 mm.
The deflectors were made of 40H steel (41Cr4). It is often used for all kinds of structures, and is characterized by high mechanical strength, ductility, and plasticity. In addition, its machining is easy, while its availability is high and its cost is relatively low. For this reason, it is often used to make parts subjected to significant loads, which is why it was chosen to make the deflectors presented in the article.
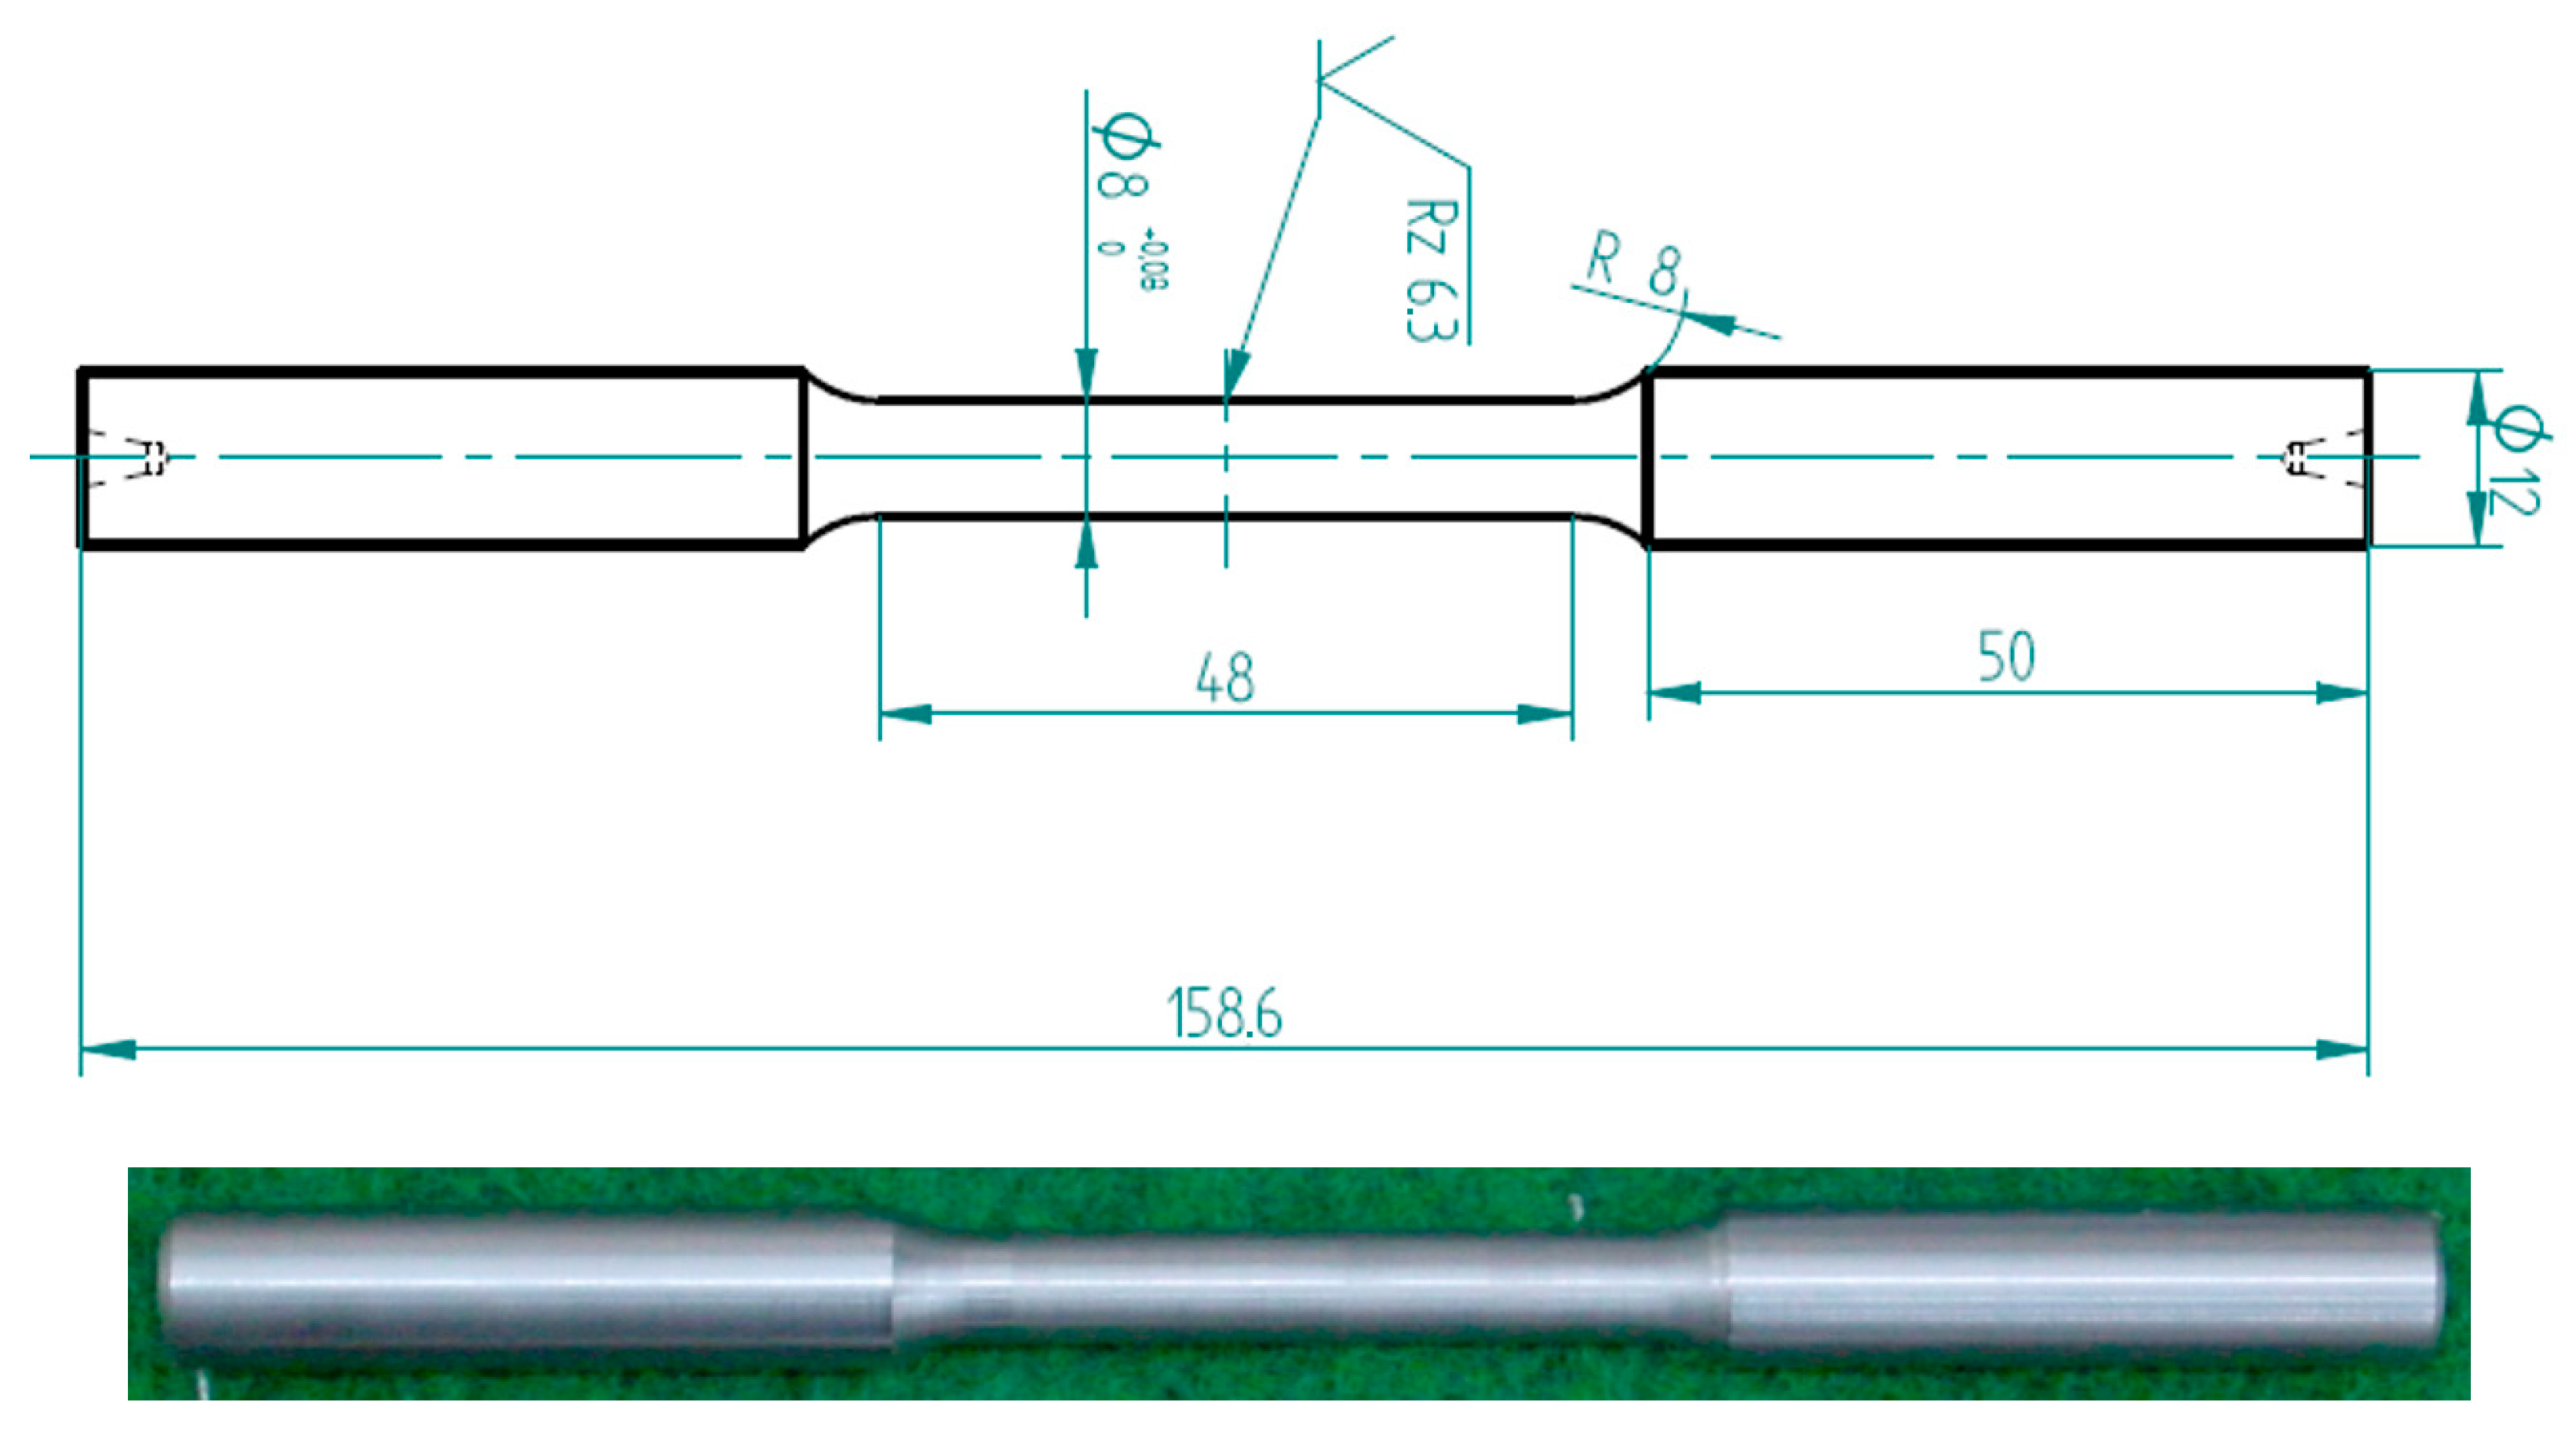
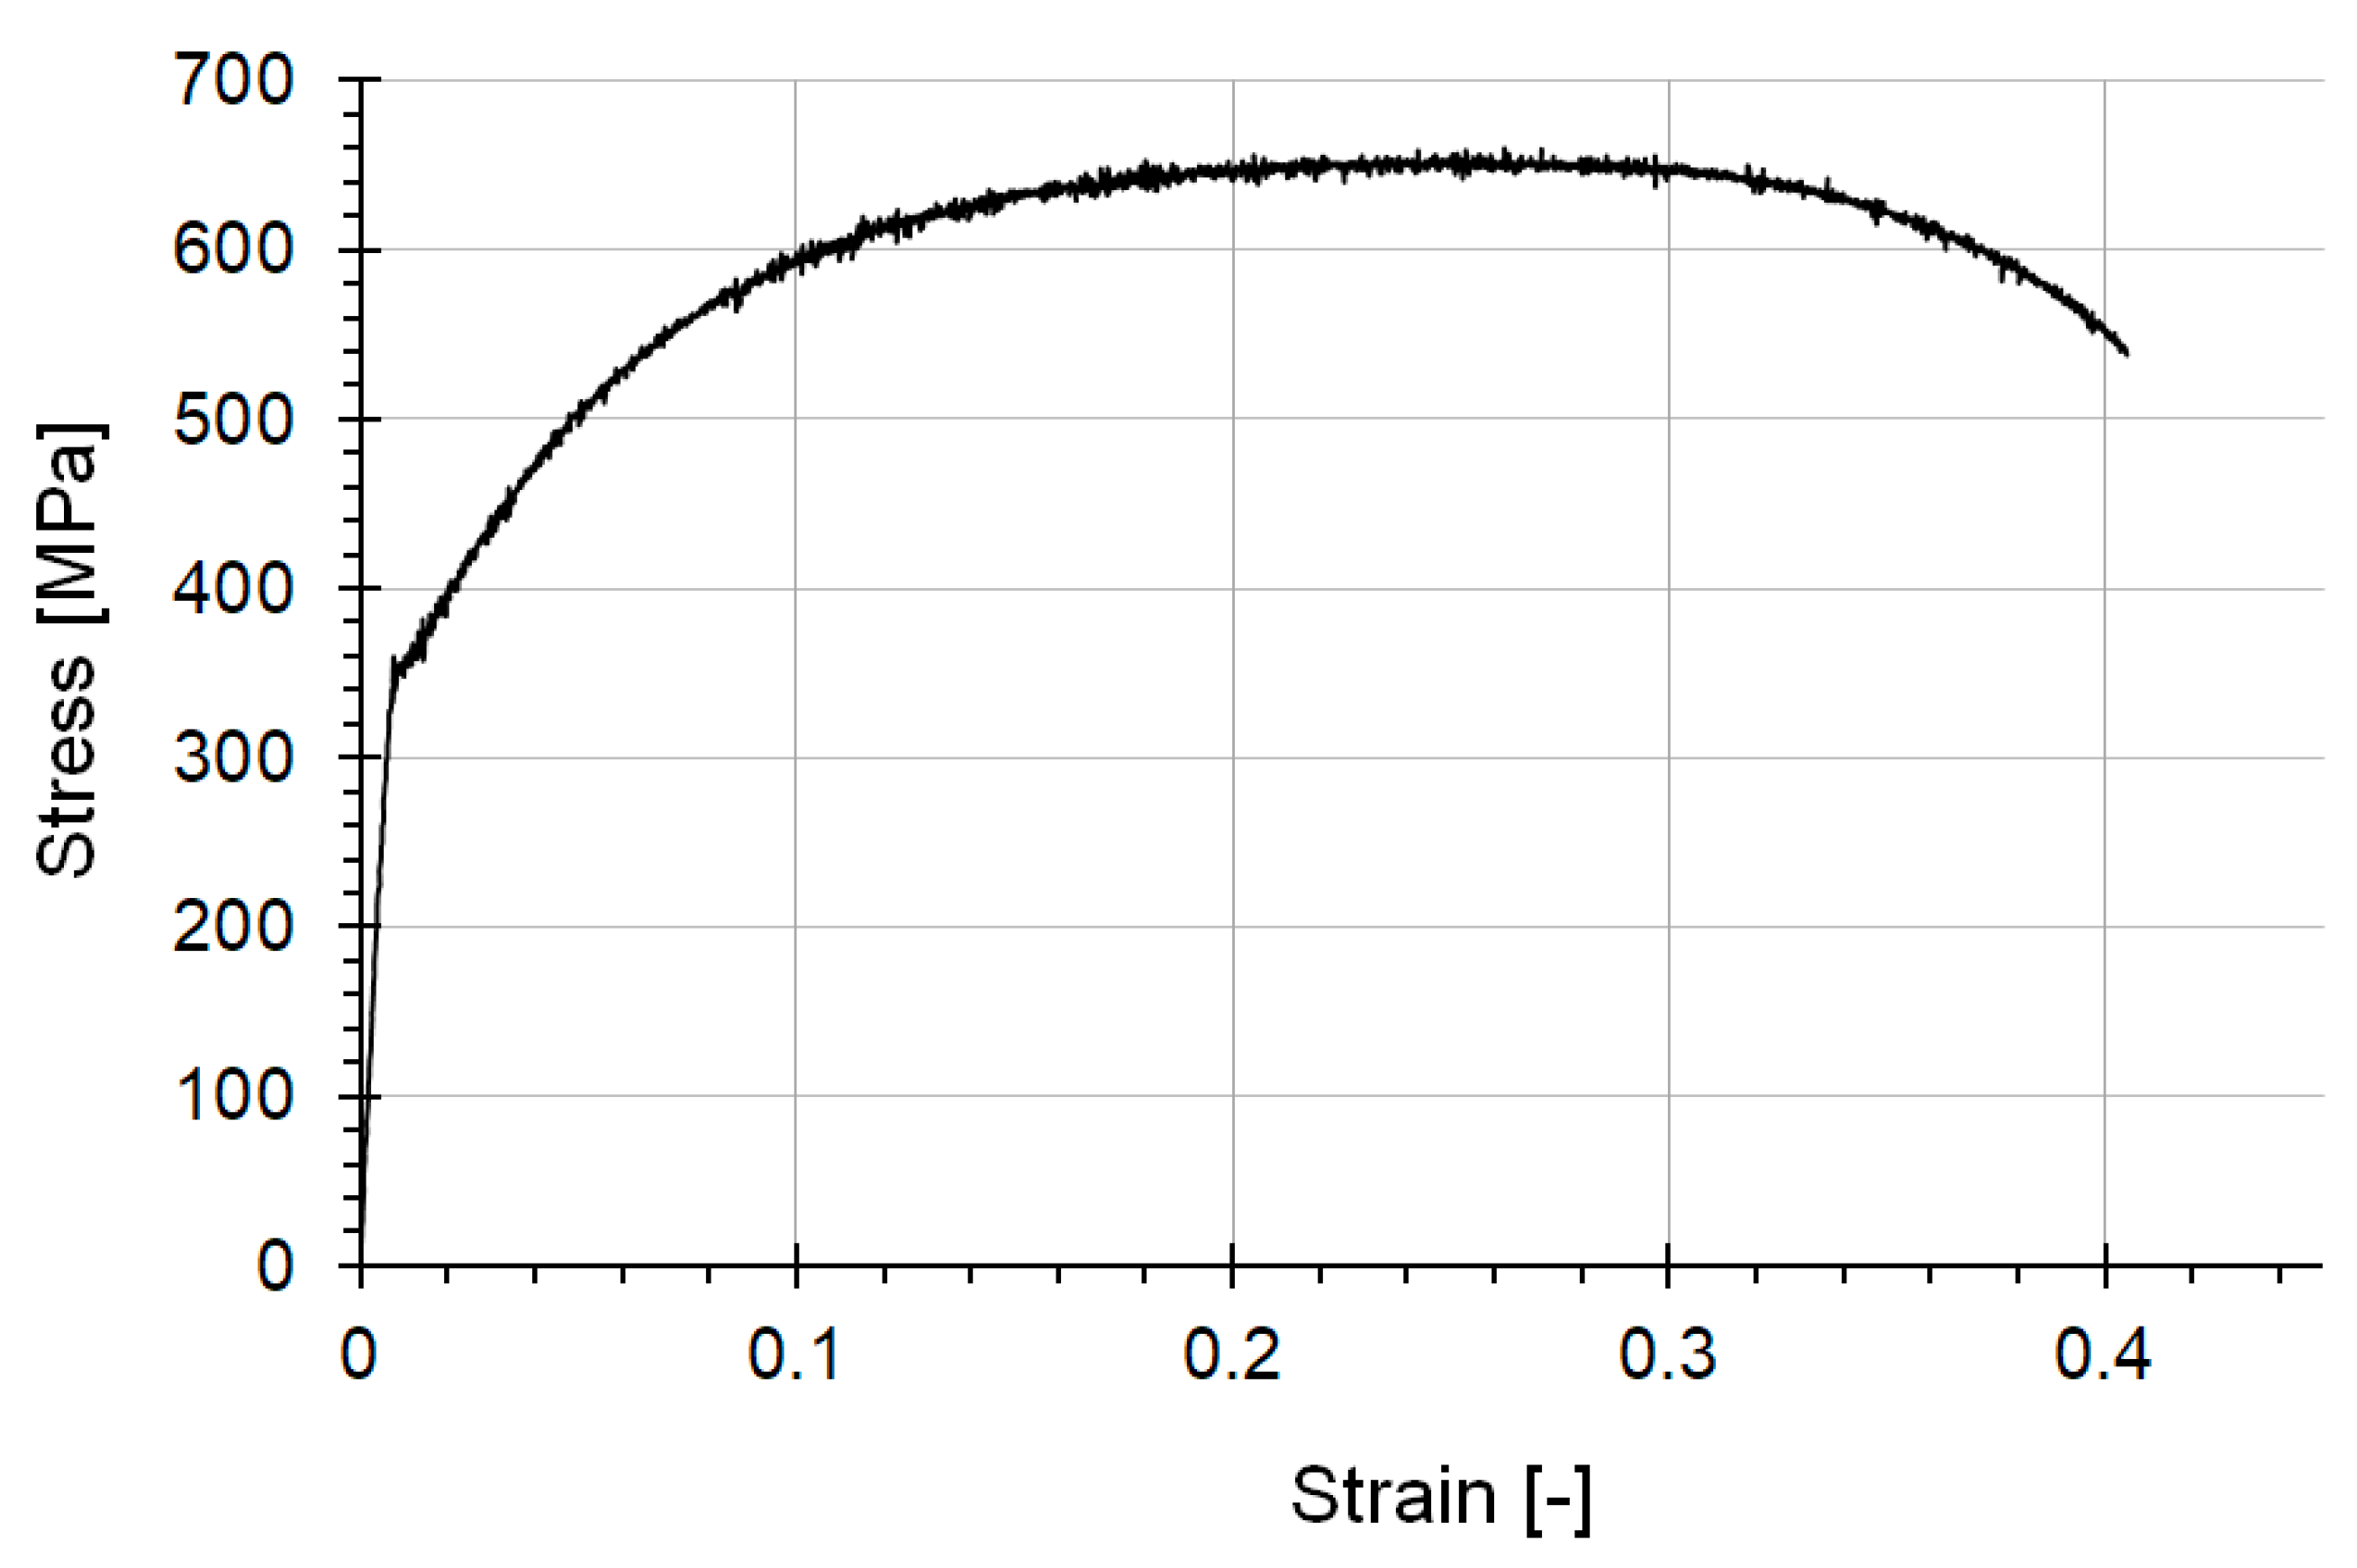
In order to determine the mechanical properties of the material from which the test pieces were made, quasi-static tests were carried out using an Instron 8802 universal testing machine. The machine automatically recorded and stored the loading force, piston position and changes in the length of the gauge bases of the extensometers coupled to it as a function of time. The sampling rate was 50 Hz. A constant strain rate of 10−3 1/s was maintained throughout the tests. Five samples were tested (Figure 5), and the obtained results were averaged. The tests made it possible to determine Poisson’s ratio, Young’s modulus, strength, and yield strength, and the stress–strain curve (Figure 6). The results are presented in Table 1.

3. Numerical Modelling

In order to reproduce the experimental test conditions, a numerical model of the entire test stand was prepared. The prepared model allowed for easy change of the tested energy-dissipating structures, so it was possible to test the effectiveness of various geometries. The results of the experimental tests were used to carry out the validation process of the created numerical model.
Many methods allow a numerical analysis of the process of detonation of explosive charges. One of the most popular and most straightforward to implement is the ConWep method, based on empirical equations obtained from conducting a series of experimental tests [36,37]. This method makes it possible to perform approximate analyses when it is essential to ensure a short analysis time for spherical charges placed in the air or semi-spherical charges placed on the ground. However, its use is associated with some disadvantages (in addition to the only two explosive charge shapes mentioned earlier), one of the most important of which is the inability to simulate the propagation of the wave reflected from the target [36]. It is a significant drawback of using such an approach that when the wave interaction target has a more complicated shape, there is an introduction of significant errors in the results. For this reason, the authors of the presented study decided to use the ALE (Arbitrary Lagrangian Eulerian) approach.
The ALE method combines both commonly used approaches of the finite element method, i.e., the Lagrangian and Eulerian approaches. In the Lagrange formulation, the material is closely related to the finite element mesh describing it, i.e., as the object deforms, the mesh deforms. This approach is used mainly in simulating solids. For liquids, it is more advantageous to use the Euler formulation, wherein the finite element mesh is fixed and does not change its position with respect to the object. This approach avoids many problems arising during large deformations of the mesh. The disadvantage of this solution is the need to discretize the additional space surrounding the object under study. The idea of the ALE approach is to exploit the advantages of both formulations [38]. With the use of FSI (fluid–structure interaction) when modelling the detonation phenomenon, the individual elements of the solid are described using the Lagrange formulation. In contrast, the detonation products and the air surrounding the system are described using the Euler formulation.

3.1. Ballistic Pendulum Modelling

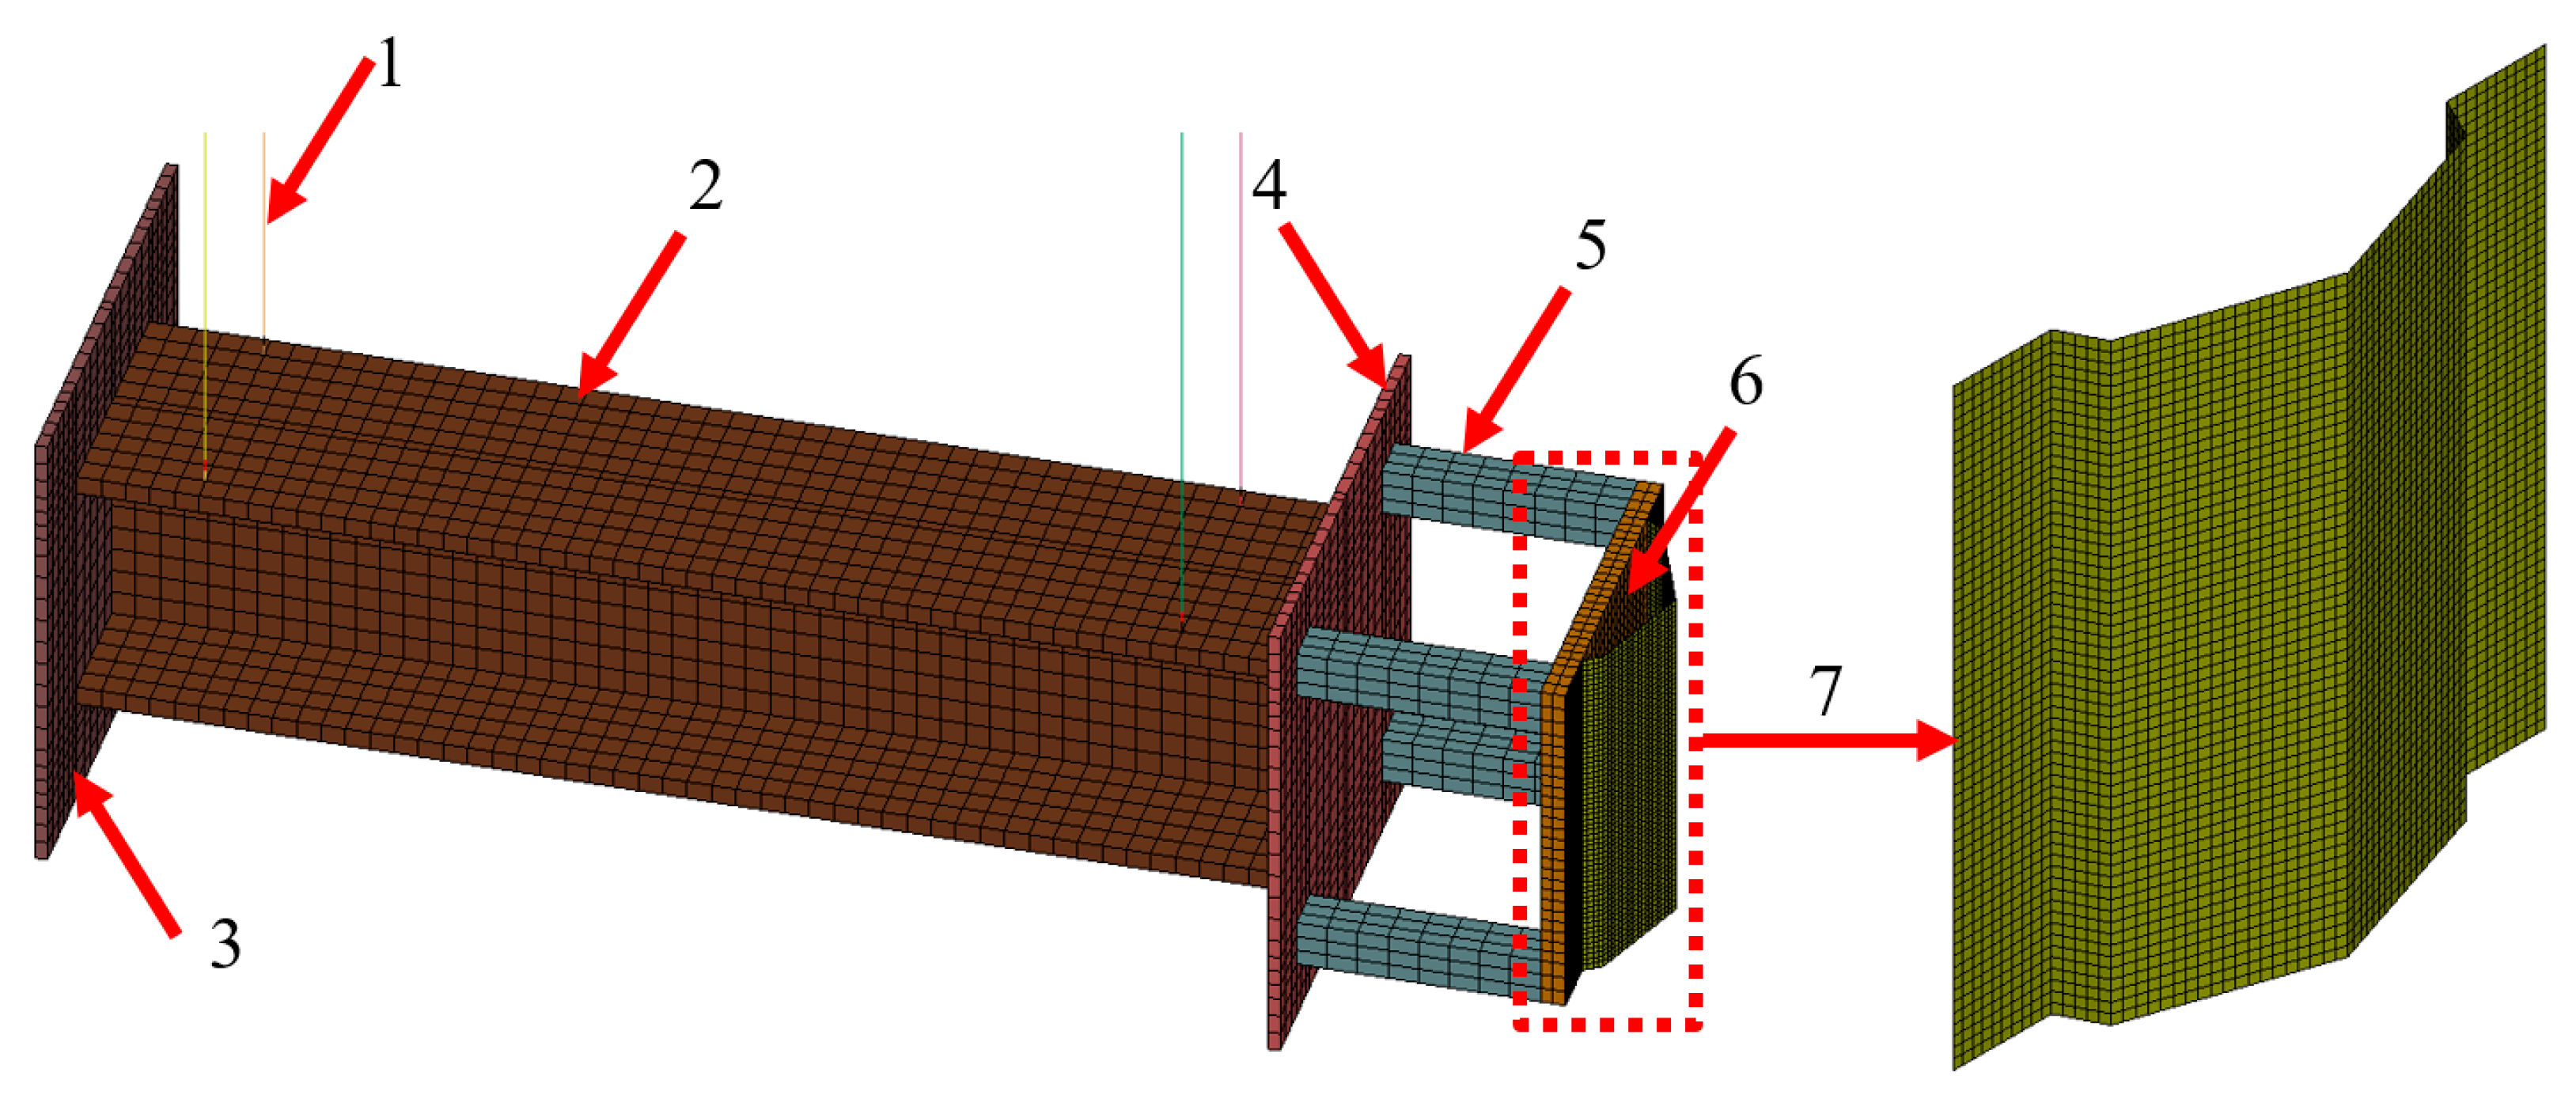
The ballistic pendulum model, including mounting plates and spacers, consists of 4464 solid finite elements with one point of integration. Because the dimensions of all these elements were chosen to ensure that they work only in the elastic range, it was possible to use a finite element mesh with a larger size of about 20 × 20 × 15 mm. Elements such as the mounting plate or the front and back plates do not deform, so it was possible to use a severely limited number of element layers for the thickness of the part [39].
In the case of ropes, 408 1D truss elements were chosen. Elements of this type only carry tension, and it is also possible to determine the type of their cross section and its area.
For the deflectors, with a thickness of 4 mm, this dimension is more than 12 times less than their width or height. Therefore, in order to discretize the energy deflectors, the shell elements were selected for the discretization process. The element size was assumed to be 5 × 5 mm, whereas their total number varied slightly depending on the deflector type and comprised about 4000 elements. A numerical model of the ballistic pendulum, including the mounted deflector, is shown in Figure 7.
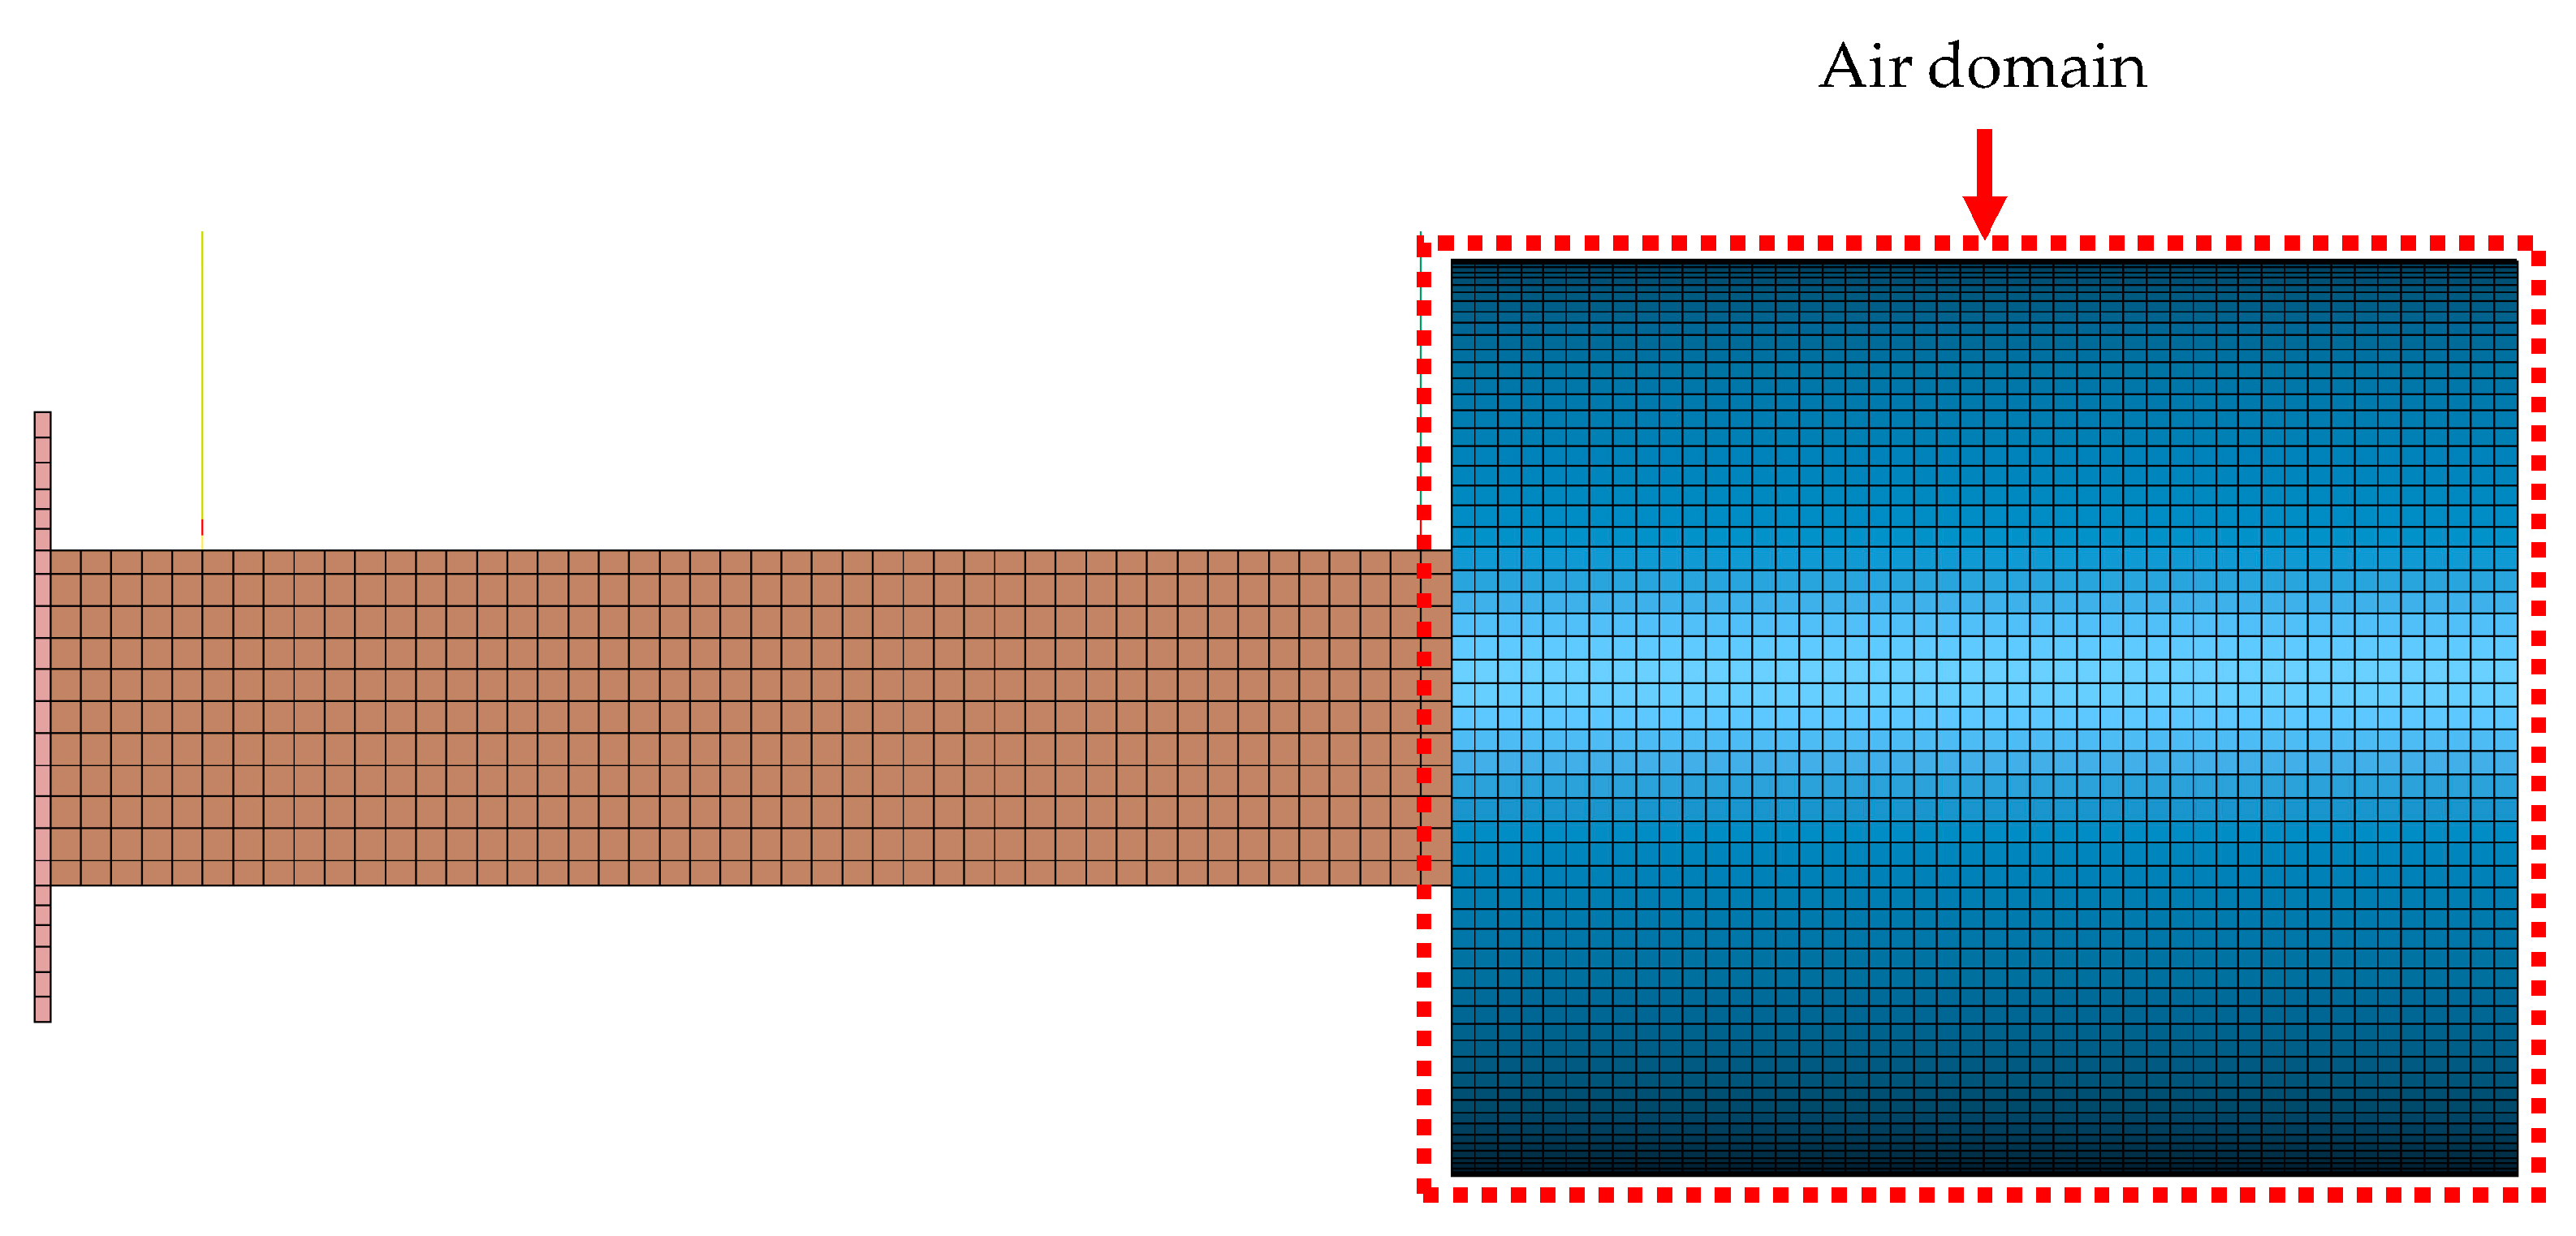
As mentioned earlier, when using the ALE approach with FSI, it is necessary to model a medium surrounding the entire system in which the products of detonation of the explosive charge will be able to propagate freely. The grid of the surrounding medium must be relatively small in size to ensure the correct implementation of the algorithm that allows the fluid to interact with the solid. For this reason, it was decided to use solid elements with dimensions of 10 × 10 × 15 mm, which meant that their number exceeded 110,000. To reduce the time required for analysis, it was necessary to reduce the size of the entire numerical model. Thus, only a fragment of air around the system was modelled—the cylinder shape had a mean base of 600 mm and length of 700 mm. The dimensions were chosen to ensure free propagation of detonation products and full propulsion of the pendulum (Figure 8).

3.2. Material Parameters

A simplified Johnson–Cook model was used to simulate the behavior of a deflector subjected to detonation wave loading. The Johnson–Cook constitutive model is the first model that considers strain hardening, strain rate effect, and metal thermal softening [40]. Although developed in 1983, it remains the most commonly used constitutive model in numerical analyses of dynamic processes and phenomena. A flow equation describing stress–strain behavior beyond the elastic limit has the following form:
σ f l o w = A + B ε p n 1 + C l n ε ˙ p * 1 T * m
where σ f l o w —equivalent flow stress, A—yield stress, B—plastic strain hardening coefficient, ε p —effective plastic strain, n—strain hardening exponent, C—plastic strain rate coefficient, m—thermal coefficient, ε ˙ p * —normalized plastic strain rate, T*—homologous temperature.
The homologous temperature is expressed by following equation:
T * = T T r T m T r
where T—sample temperature, Tr—reference temperature, Tm—melting temperature of the materials sample.
Such effects as strain hardening, strain rate effect, and thermal softening are included in the Johnson–Cook equation in the form of parts presented in the brackets and multiplied by itself. The first part—in the first bracket—shows the influence of the strain hardening on the equivalent flow stress in the form presented originally by Ludvik [41]. The strain rate effect’s influence in logarithmic form is presented in the second part of the equation, and the thermal softening is in the last part. The only difference between the simplified and the full Johnson–Cook model is that the simplified model does not consider the influence of thermal effects on the material properties. Thus, such a model can be expressed as:
σ f l o w = A + B ε p n 1 + C l n ε ˙ p *
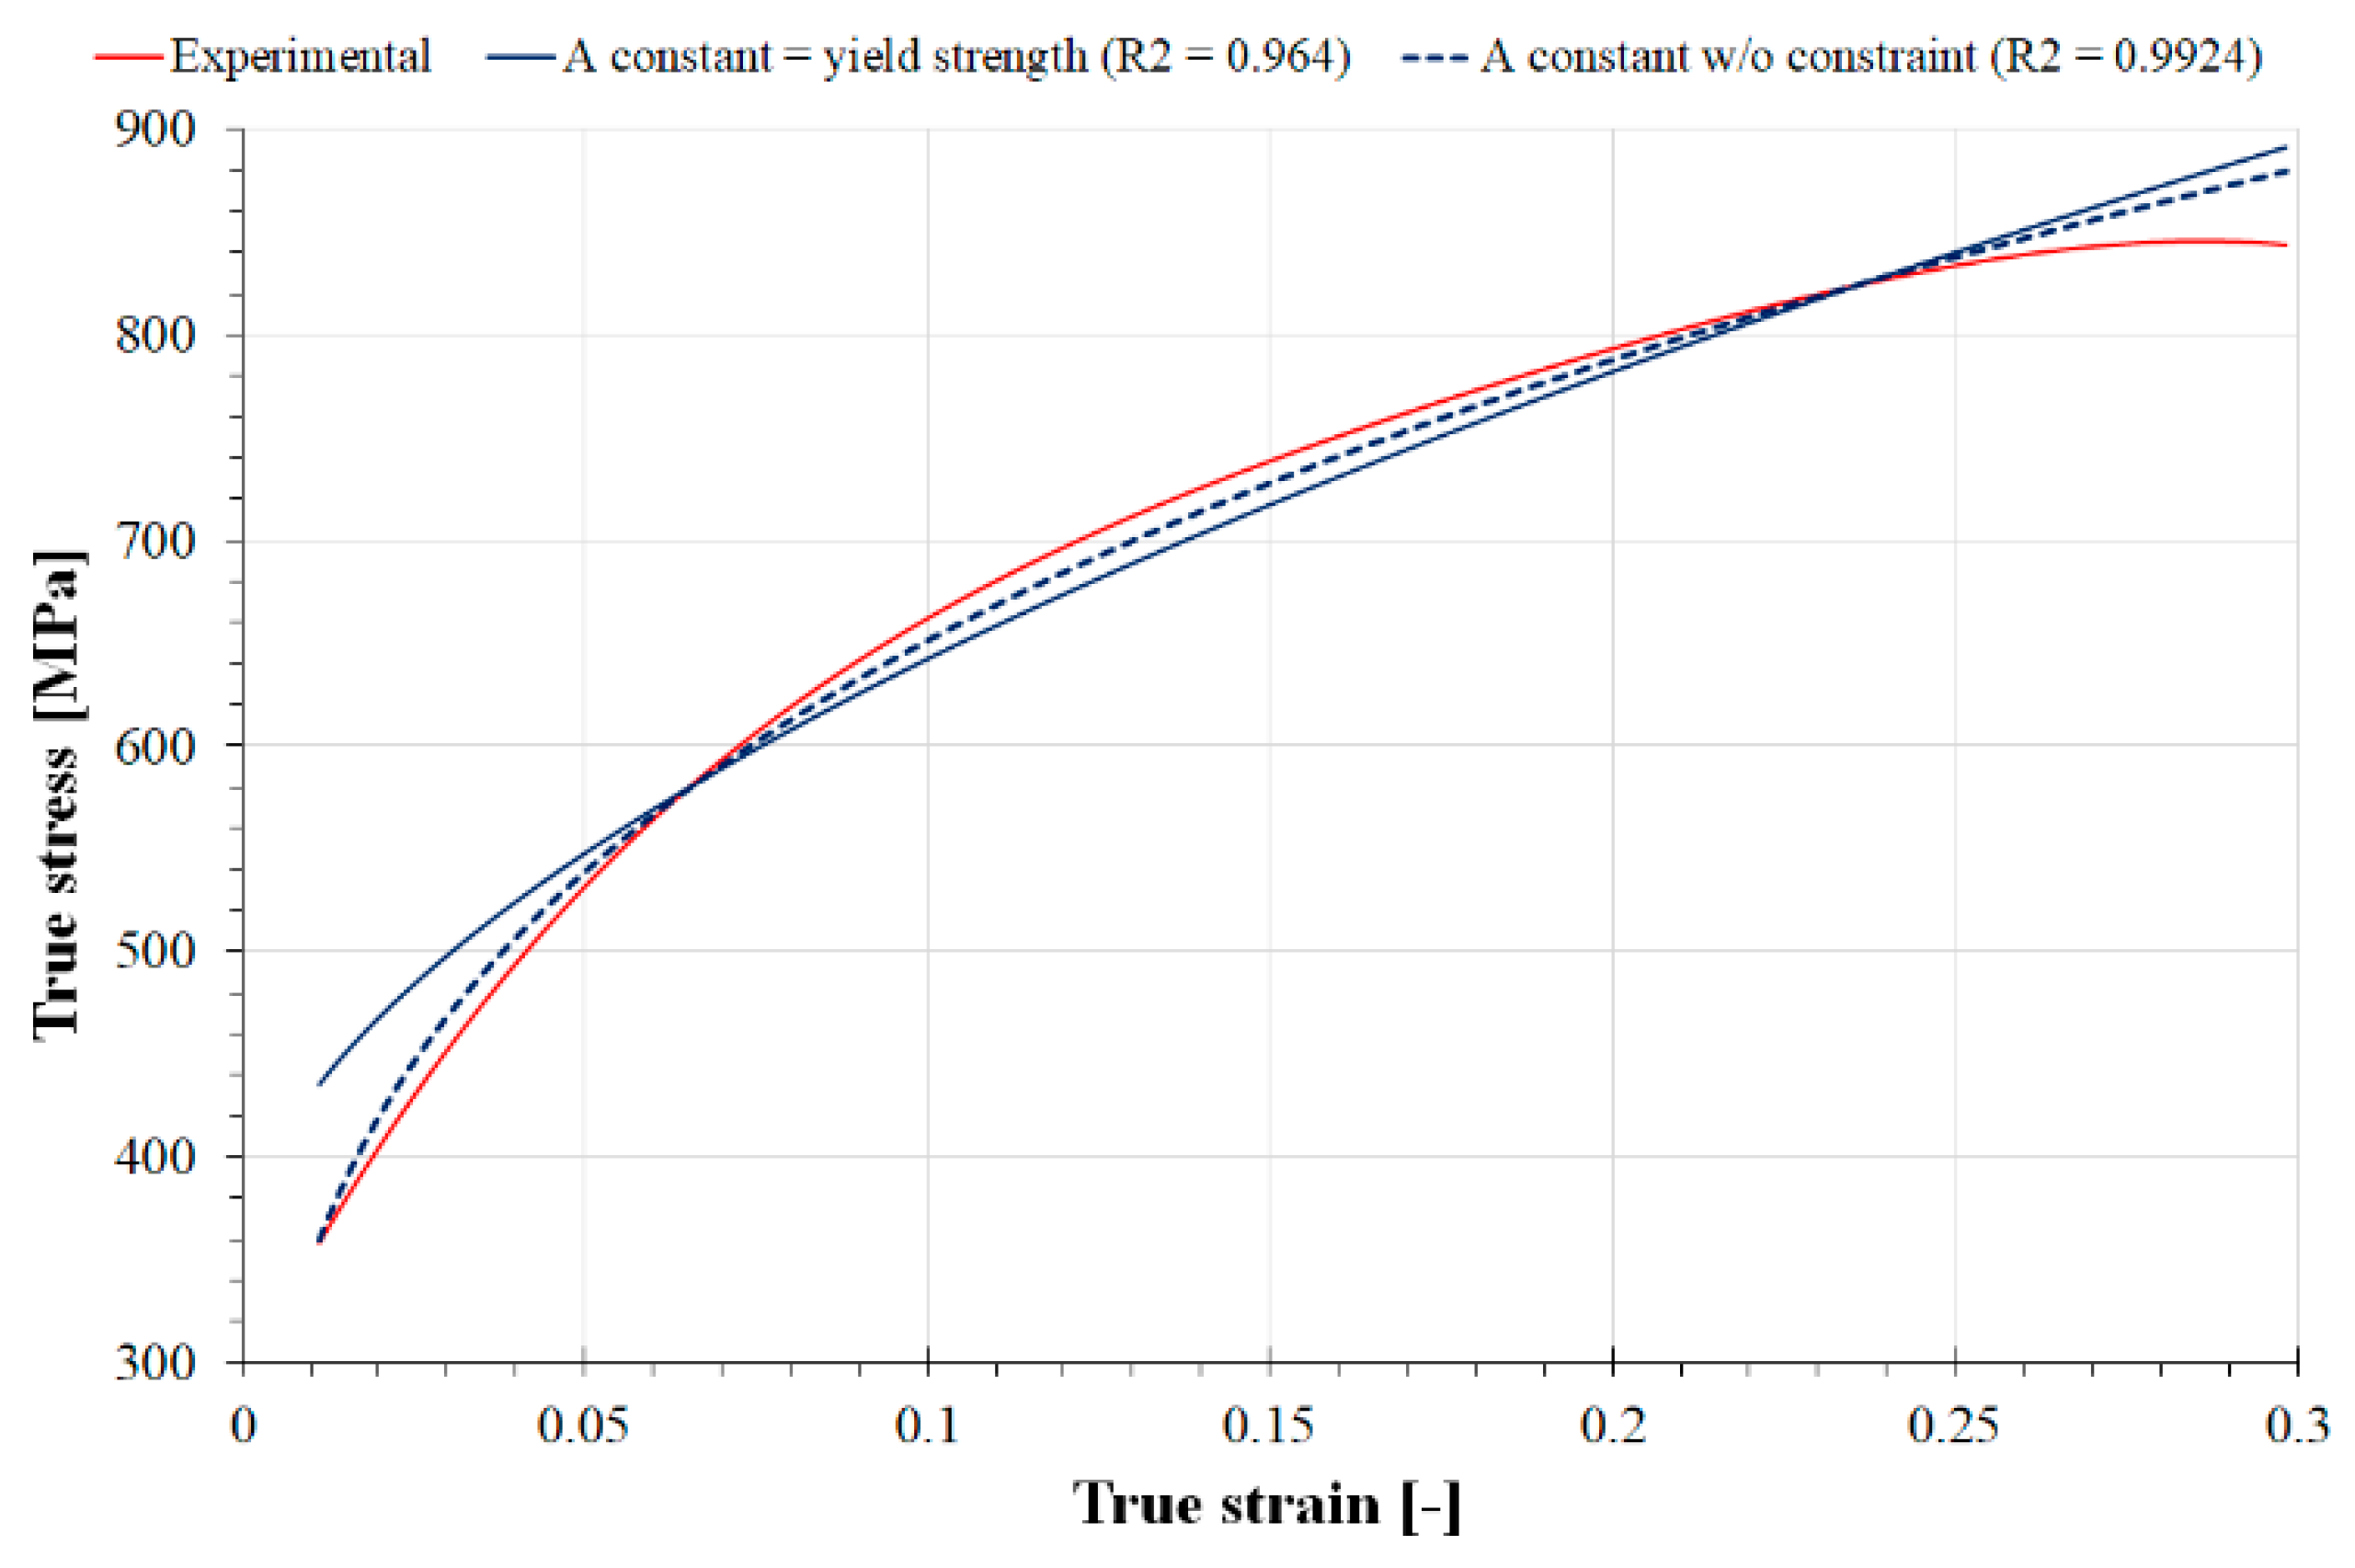
In order to determine the necessary JC material constants, a curve-fitting process was carried out on experimental data [42,43,44]. Initially, a yield strength equal to 353.3 MPa was taken as the value of material constant A, identical to that of the experimental study. The variability of parameter B was studied in the interval <0, 1400> with a step of 1, n in the interval <0, 1> with a step of 0.1, and C in the interval <0, 0.1> with a step of 0.0003. For such input parameters, a fit expressed as R2 of 0.964 was obtained. Due to the fact that this value was relatively low, it was decided to remove the constraint on parameter A. As a result, values of constants deviating from those commonly found in the literature were obtained, but characterized by an R2 of 0.9924 (Figure 9).
The constitutive model values used are presented in Table 2.
The steel rope’s material was described with the use of CABLE DISCRETE BEAM. In this material model, force is generated by rope only during stretching [45]:
F = max F + + K Δ L , 0 .
Δ L is change in length:
Stiffness K is defined as:
Δ L = L C L P O
where L C is current length, L P is initial length, and O is offset.
Stiffness K is defined as:
K = E × A L P O
where E is Young’s modulus and A is the cross section’s area.
The JWL equation (Jones, Wilkins, Lee) was used to describe the behavior of detonation products:
p = A 1 ω R 1 V R 1 V + B 1 ω R 2 V R 2 V + ω ρ E
where E—internal energy, V = ρ 0 / ρ , ρ 0 —initial density, ρ —density of detonation products, A, B, R1, R2, and ω—constant values.
Analogously to the experimental study, the propellant used in the numerical analyses was Semtex A1. The corresponding parameter values were taken from the literature and are shown in Table 3 [46].
The air domain was simulated using the linear polynomial equation of state. This equation can be expressed in the following way [47]:
P = C 0 + C 1 μ + C 2 μ 2 + C 3 μ 3 + C 4 + C 5 μ + C 6 μ 2 E
where P is pressure, Ci are polynomial coefficients, E is internal energy, and μ can be expressed as:
μ = 1 V 1
or
μ = ρ ρ 0 1
where V is the relative volume, ρ is the current density, and ρ 0 is the initial density.
Gases can be modelled using the gamma law equation of state, a modified version of the above-mentioned linear polynomial equation of state [45]. In this case, we have:
C 0 = C 1 = C 2 = C 3 = C 6 = 0
C 4 = C 5 = γ 1
where γ is the ratio of specific heats.
The values of the coefficients for common gases are widely available in the literature [48] and are presented in Table 4.

3.3. Boundary Conditions

As mentioned earlier, only a portion of the volume of the medium in which the detonation products will propagate was modelled. In order to allow their free flow beyond these boundaries, non-reflecting boundaries were used on all outer walls (Figure 10). Not applying this type of boundary would have resulted in multiple reflections of the detonation products from the air–domain boundaries; thus, the obtained result would be characterized by a high level of error.
When the products of detonation interacted with the pendulum, it was necessary to ensure its correct movement. In order to do so, the elements at the upper end of the cables were fully constrained, simulating their attachment to the outer frame.
The contact between the detonation products and the air, described using the Euler formulation, and the energy deflector and the other elements of the pendulum, described according to the Lagrange formulation, were realized using Eulerian/Lagrangian coupling.
A tied surface-to-surface contact definition was used to connect the energy deflectors to the pendulum mounting plate. Because the other components of the pendulum are considered rigid solids, the nodes located at the boundary of the individual components were permanently stitched together.

3.4. Variants of the Deflector Geometry

Numerical analyses, especially in the case of a relatively low level of model complexity, made it possible to easily and quickly check many variants of the proposed solution. In the case of the following study, a whole range of double-bend deflector and semi-spherical deflector variants were selected for numerical analyses. Two approaches were adopted for the double-bend deflector. In the first, the A-dimension (the distance in the horizontal plane from the edge of the deflector to the second bend) was varied from 60 to 130 mm (in 10 mm increments). This variation allowed deflectors with both a more “straight” shape (Figure 11a) and a more “pointed” shape (Figure 11b) to be subjected to testing while maintaining identical external dimensions. In addition, the effect of changing the second critical dimension, the B-dimension (the distance in the vertical plane from the edge of the deflector to the second bend) while keeping A-dimension constant was also tested. For this purpose, a deflector was chosen with an A-dimension equal to 80 mm and B-dimensions varying from 15 to 45 mm with 5 mm increments. The designations of these deflectors consist of two numbers (e.g., “60-15”), the first being the A-dimension and the second being the B-dimension. It is worth noting that with the presented double-bend sizing, the 80-15 deflector is the same as the V-shaped deflector (Figure 12a).
Semi-spherical deflectors have only one leading dimension: the radius of the semi-spherical part. For the study, we selected deflectors whose radius values varied from 10 to 50 mm in 5 mm increments (Figure 13). In this case, the most convex semi-spherical deflector (indicated as “semi-spherical 50” because of radius equal to 50 mm) had the same height as the double-bend deflector (see Figure 4).

4. Results and Discussion

4.1. Validation of the Numerical Model

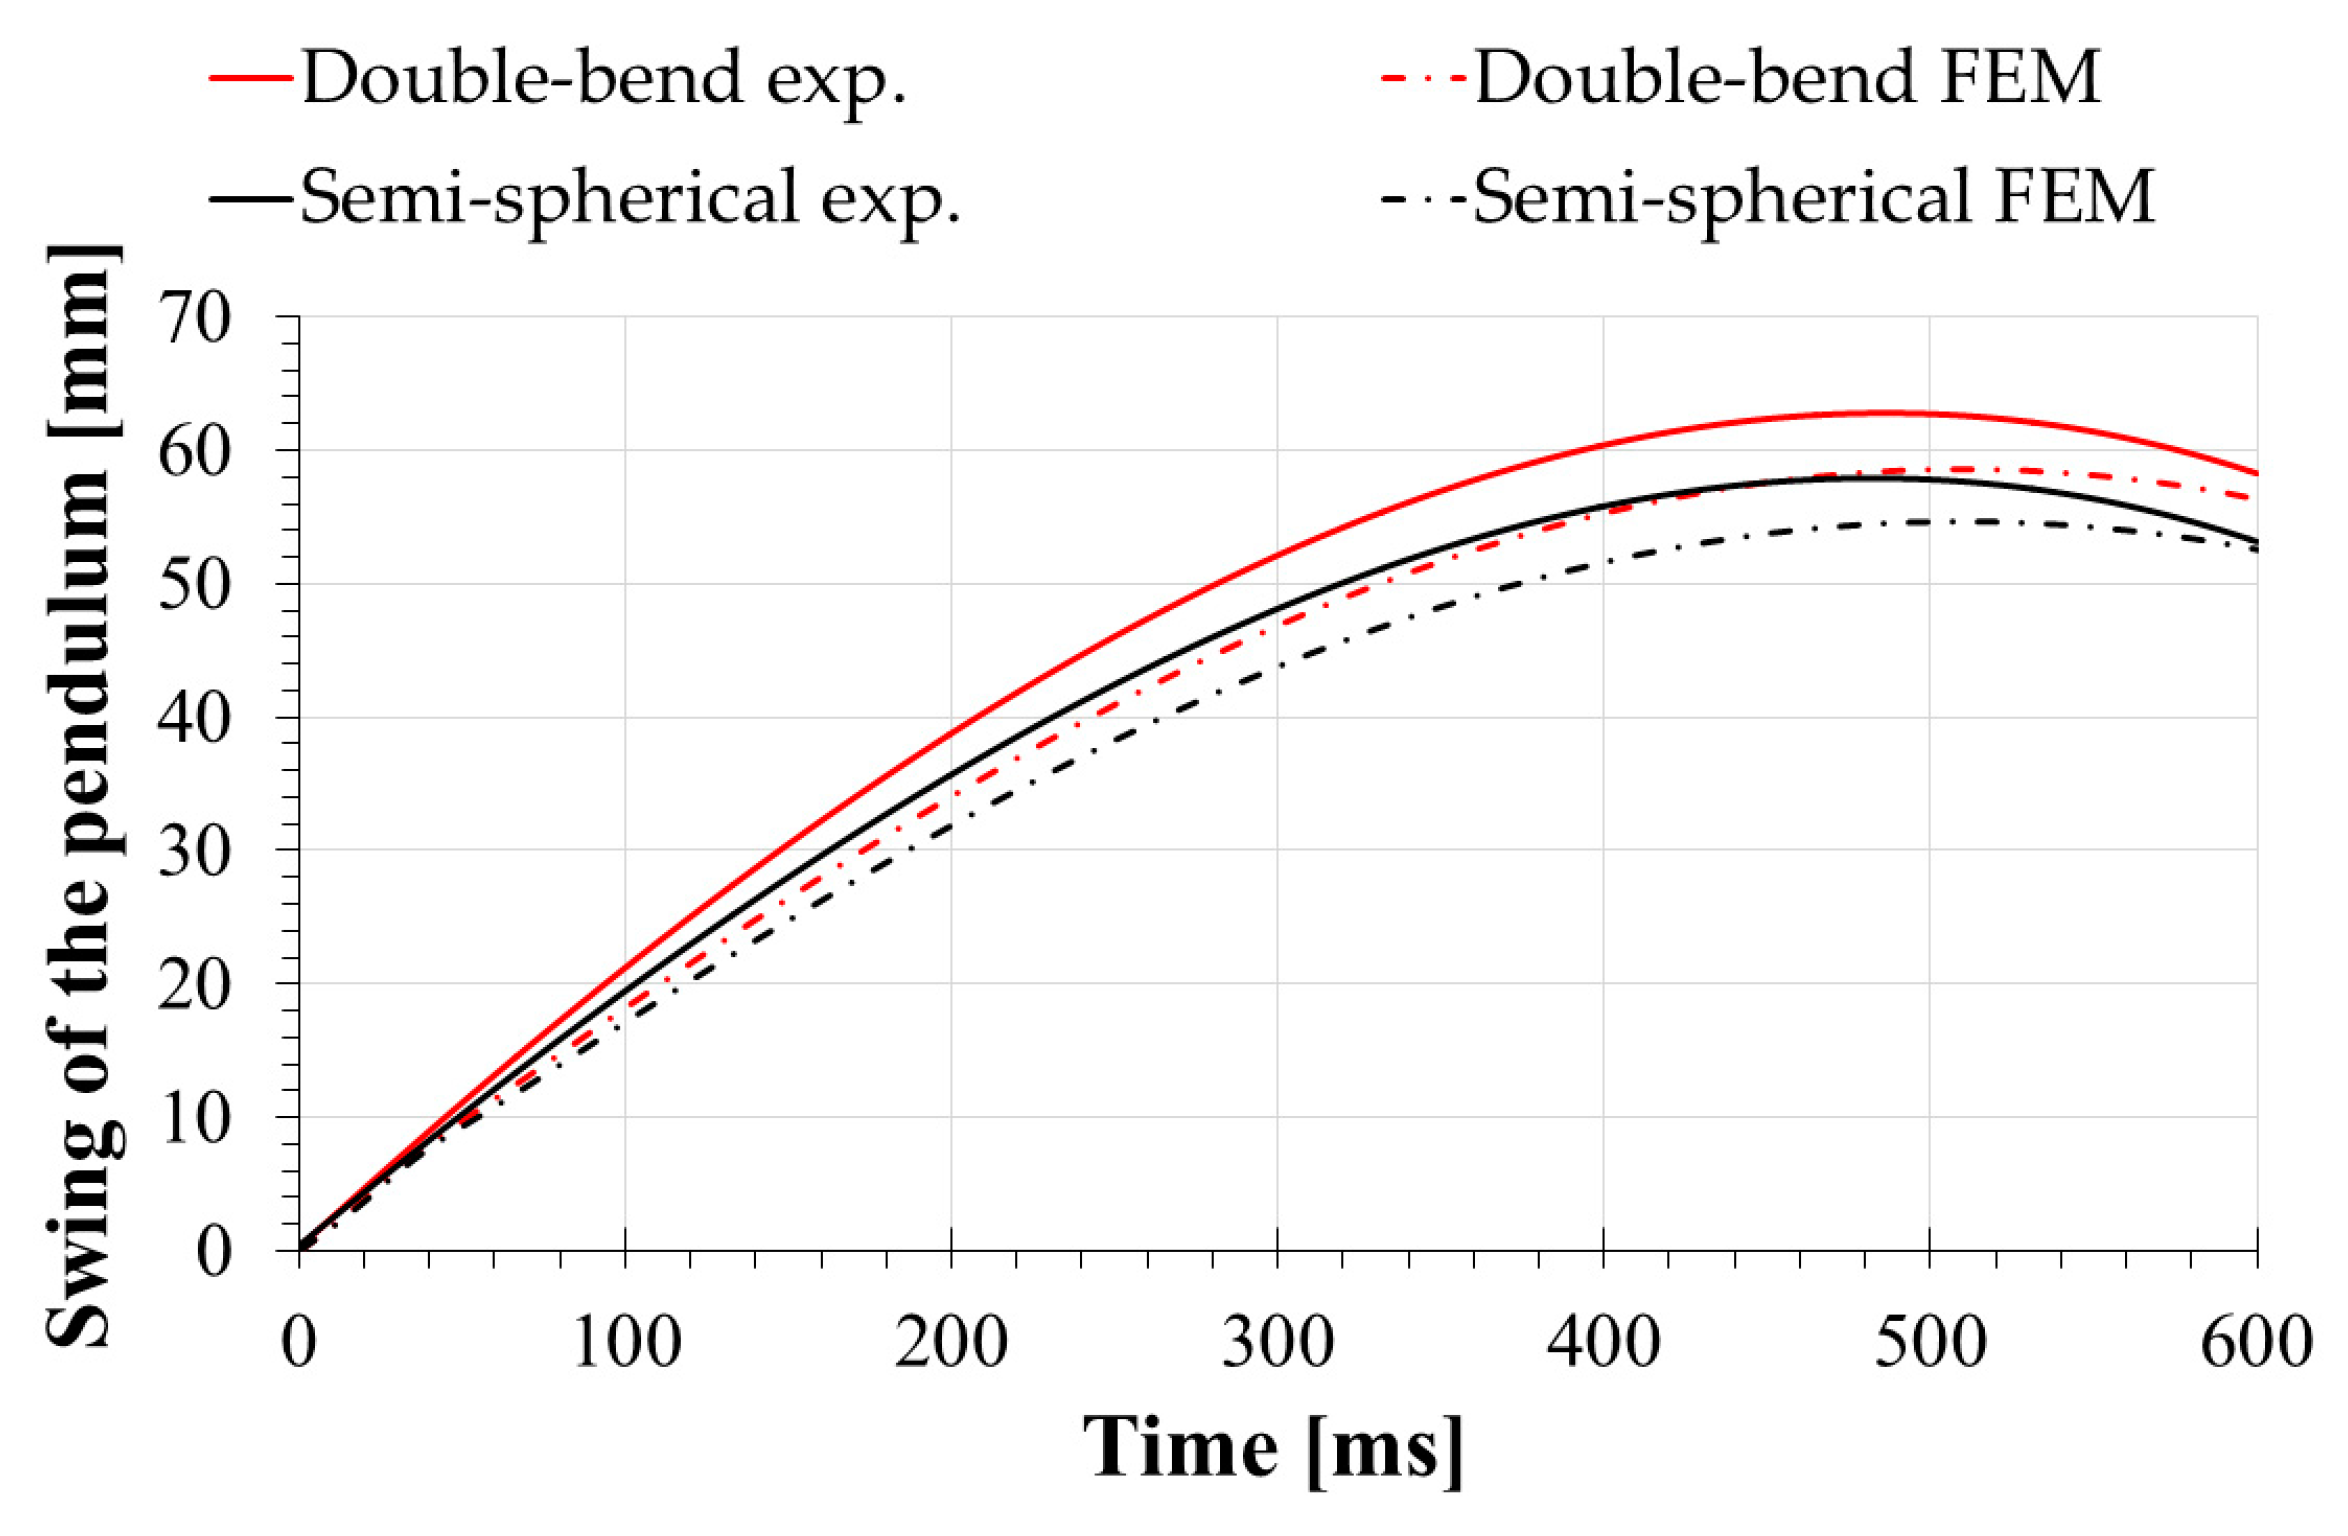
In the first step, the validation and verification of the created numerical model were carried out. For this purpose, an experimental study was carried out on the testbed, and then the results obtained from it were compared with an analogous variant analyzed numerically. The maximum swing of the pendulum was compared (Figure 14). It should be noted that the thickness of the deflectors has been selected so that they do not deform during the study, so only the maximum swing of the pendulum was measured.
We can observe a high correspondence in a comparison of the obtained results. The maximum difference in the cases considered was less than 7% in the case of a double-bend deflector with a 100 mm A-size. In the case of a semi-spherical deflector with a 50 mm radius, the difference was slightly smaller and amounted to less than 6%. In both variants presented, the pendulum deflection curve from the experimental tests lies above the curve derived from numerical results. Such a position of the curves indicates a slight underestimation of the values from the FEM model. However, the difference is small enough not to affect the reliability of the results. The exact values are shown in Table 5.

4.2. Numerical Analyses of the Double-Bend Deflector

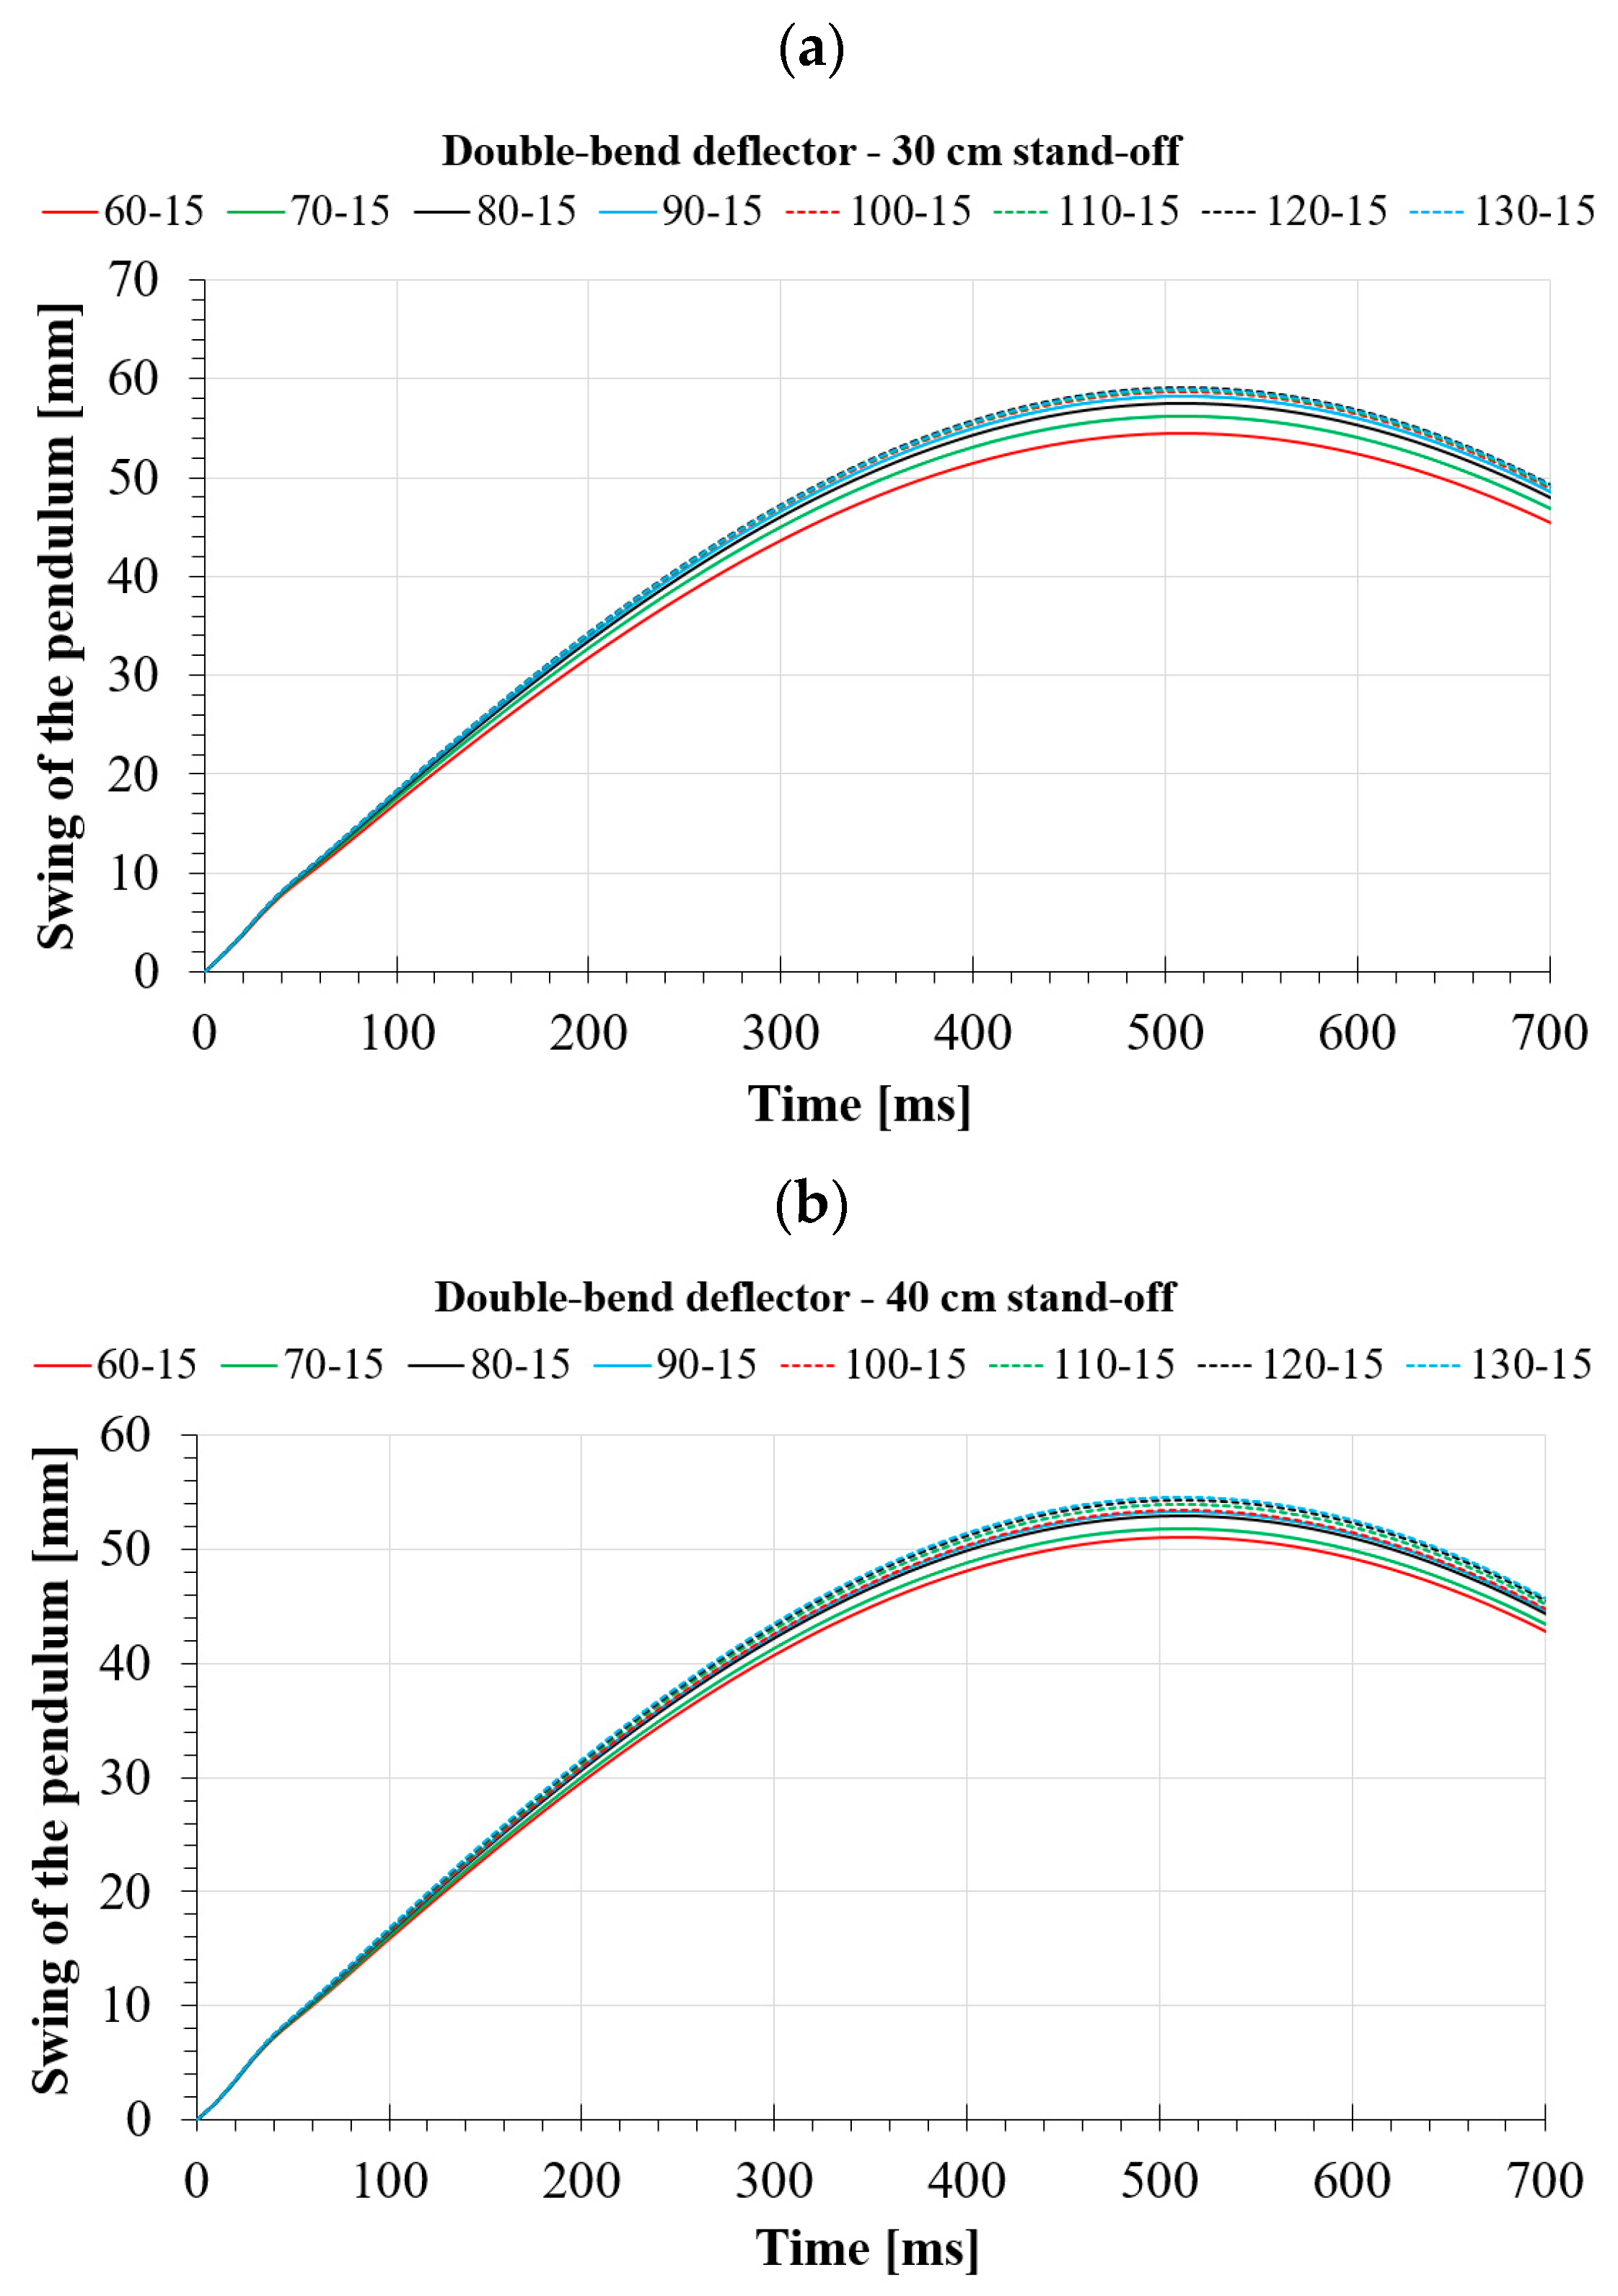
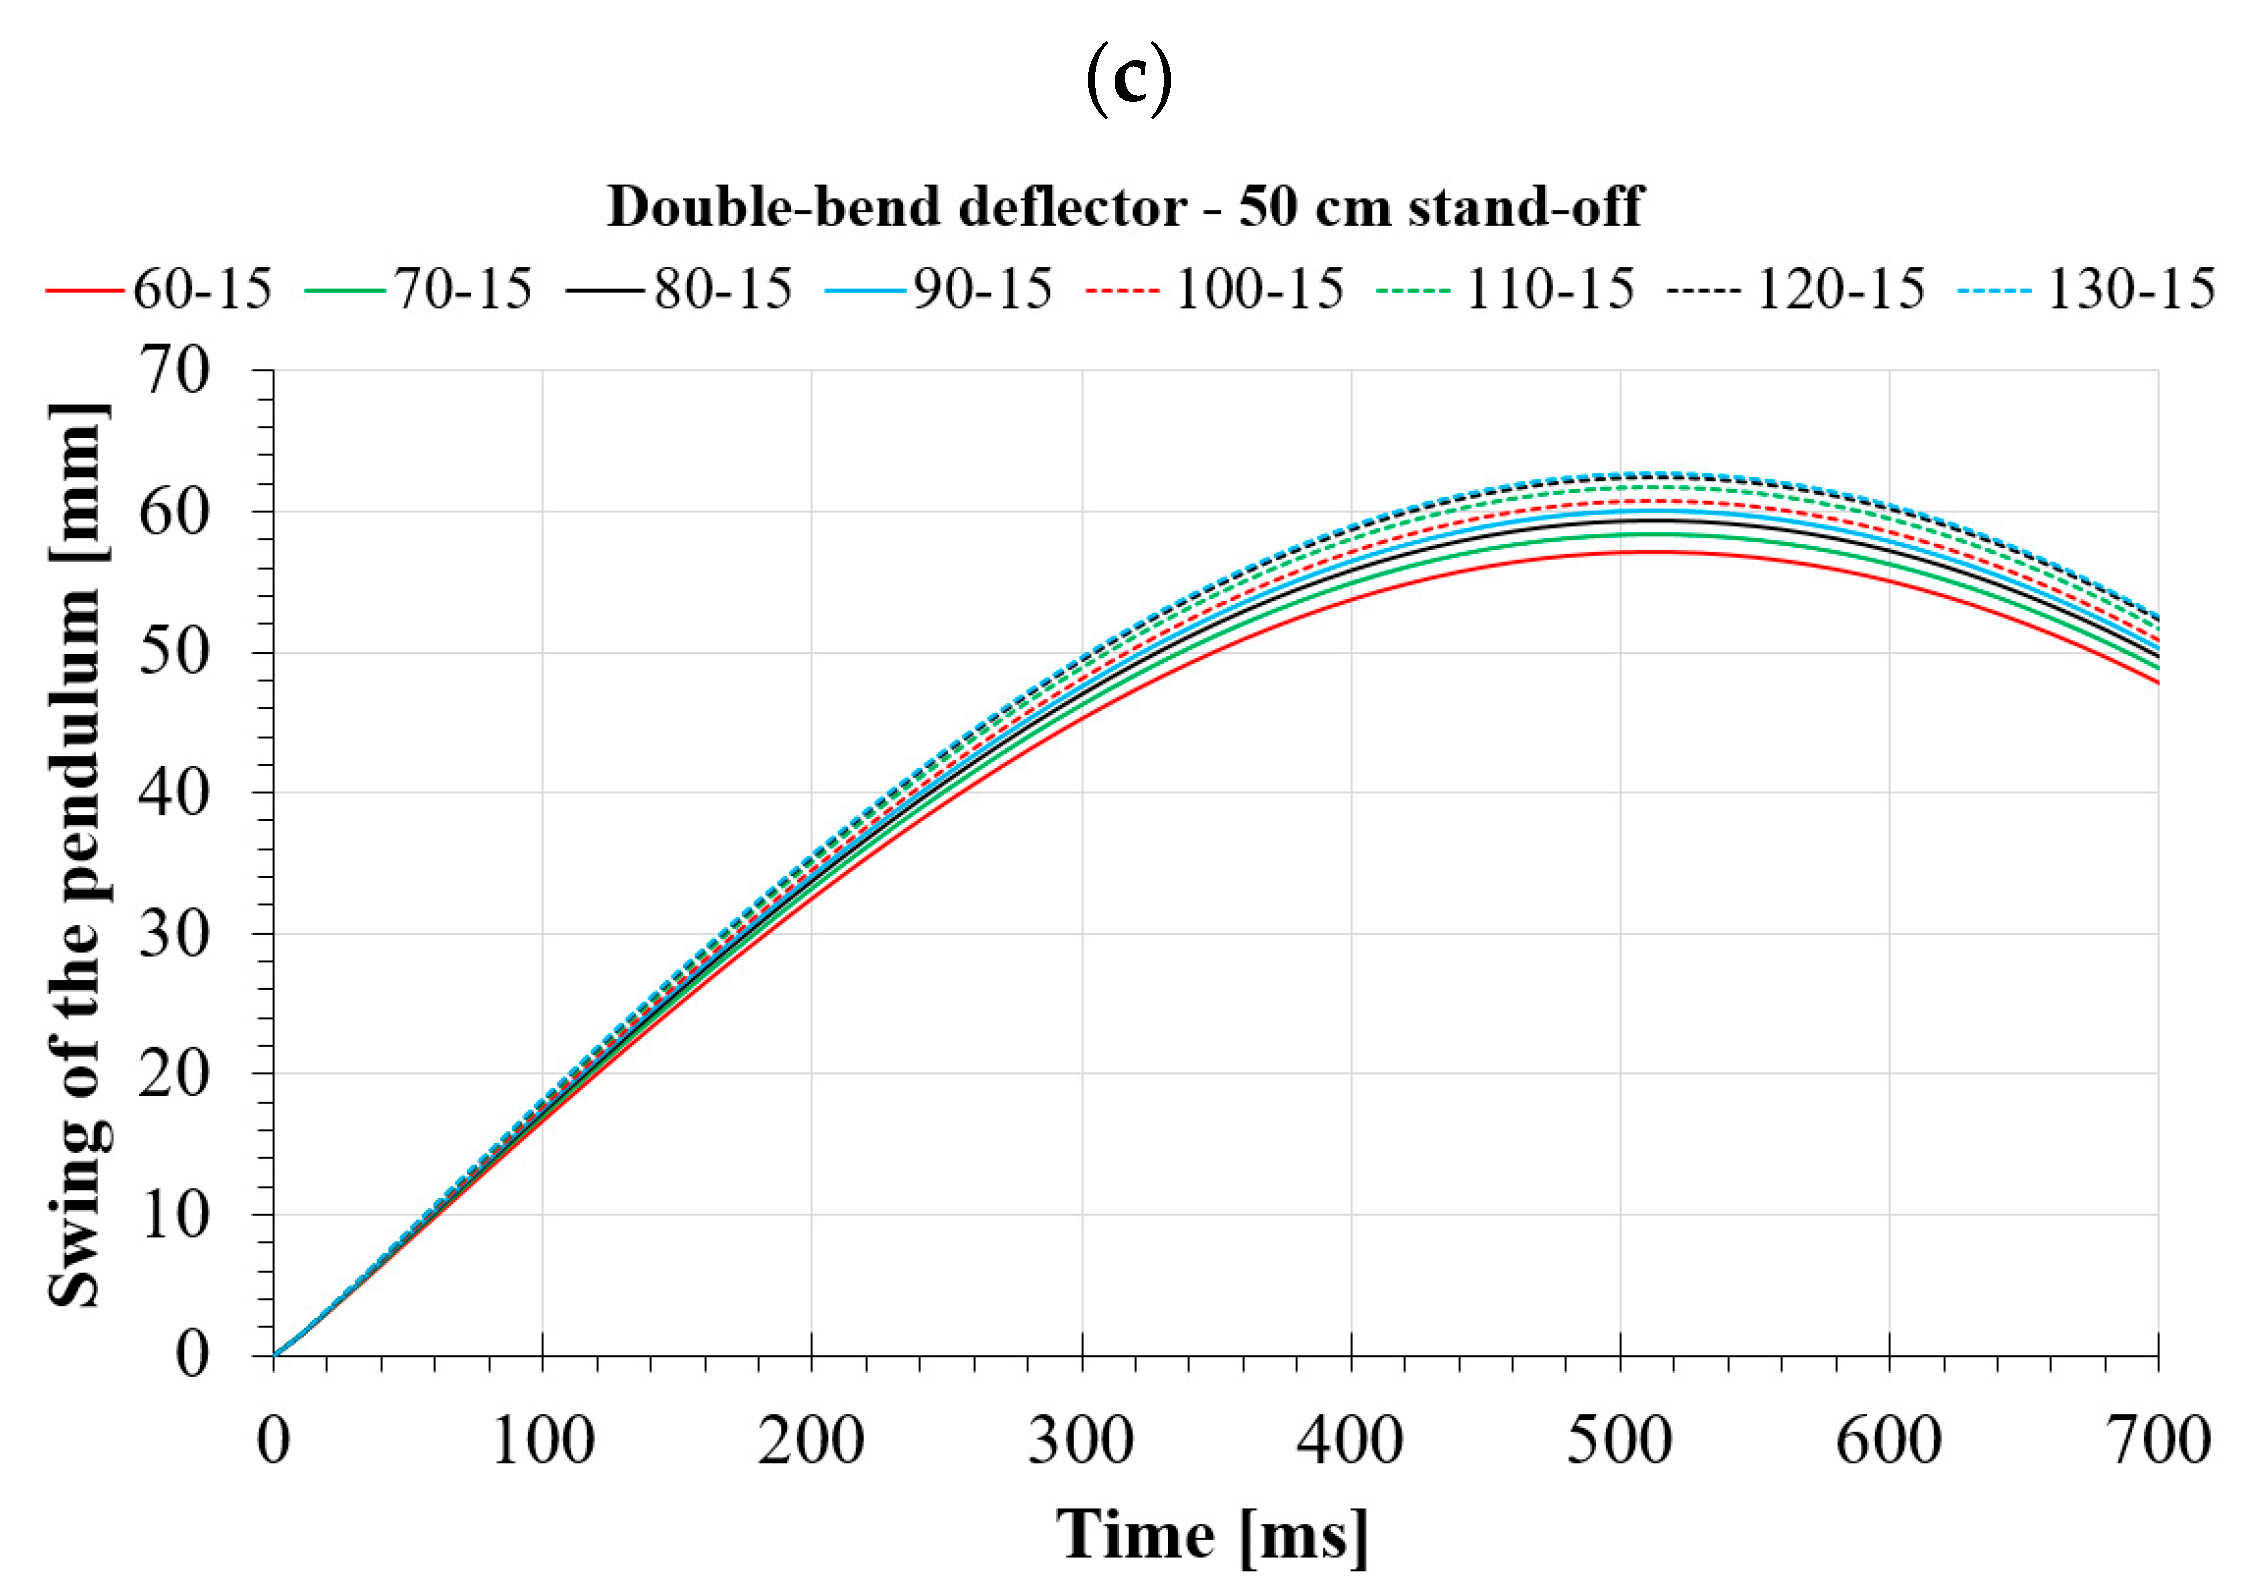
As mentioned earlier, in the case of double-bend deflectors, the effect of changing two characteristic dimensions on their ability to dissipate energy from the detonation of an explosive charge was considered. This ability was determined by recording the deflection of the ballistic pendulum and determining its maximum value. Analyses were carried out for three distances of the explosive charge from the pendulum mounting plate: 30, 40, and 50 cm. The recorded deflections for all considered cases are presented in Figure 15. Analyzing the graphs below, we can see that the curves for the cases wherein the B-dimension (the distance in the vertical plane from the edge of the deflector to the second bend) was constant, while the A-dimension (the distance in the horizontal plane from the edge of the deflector to the second bend) was differentiated, are relatively close. For all three distances analyzed, the difference between the extreme deflections (the best and worst cases) did not exceed 10% and was 7.4%, 6.4%, and 8.9% for stand-offs of 30, 40, and 50 cm, respectively.
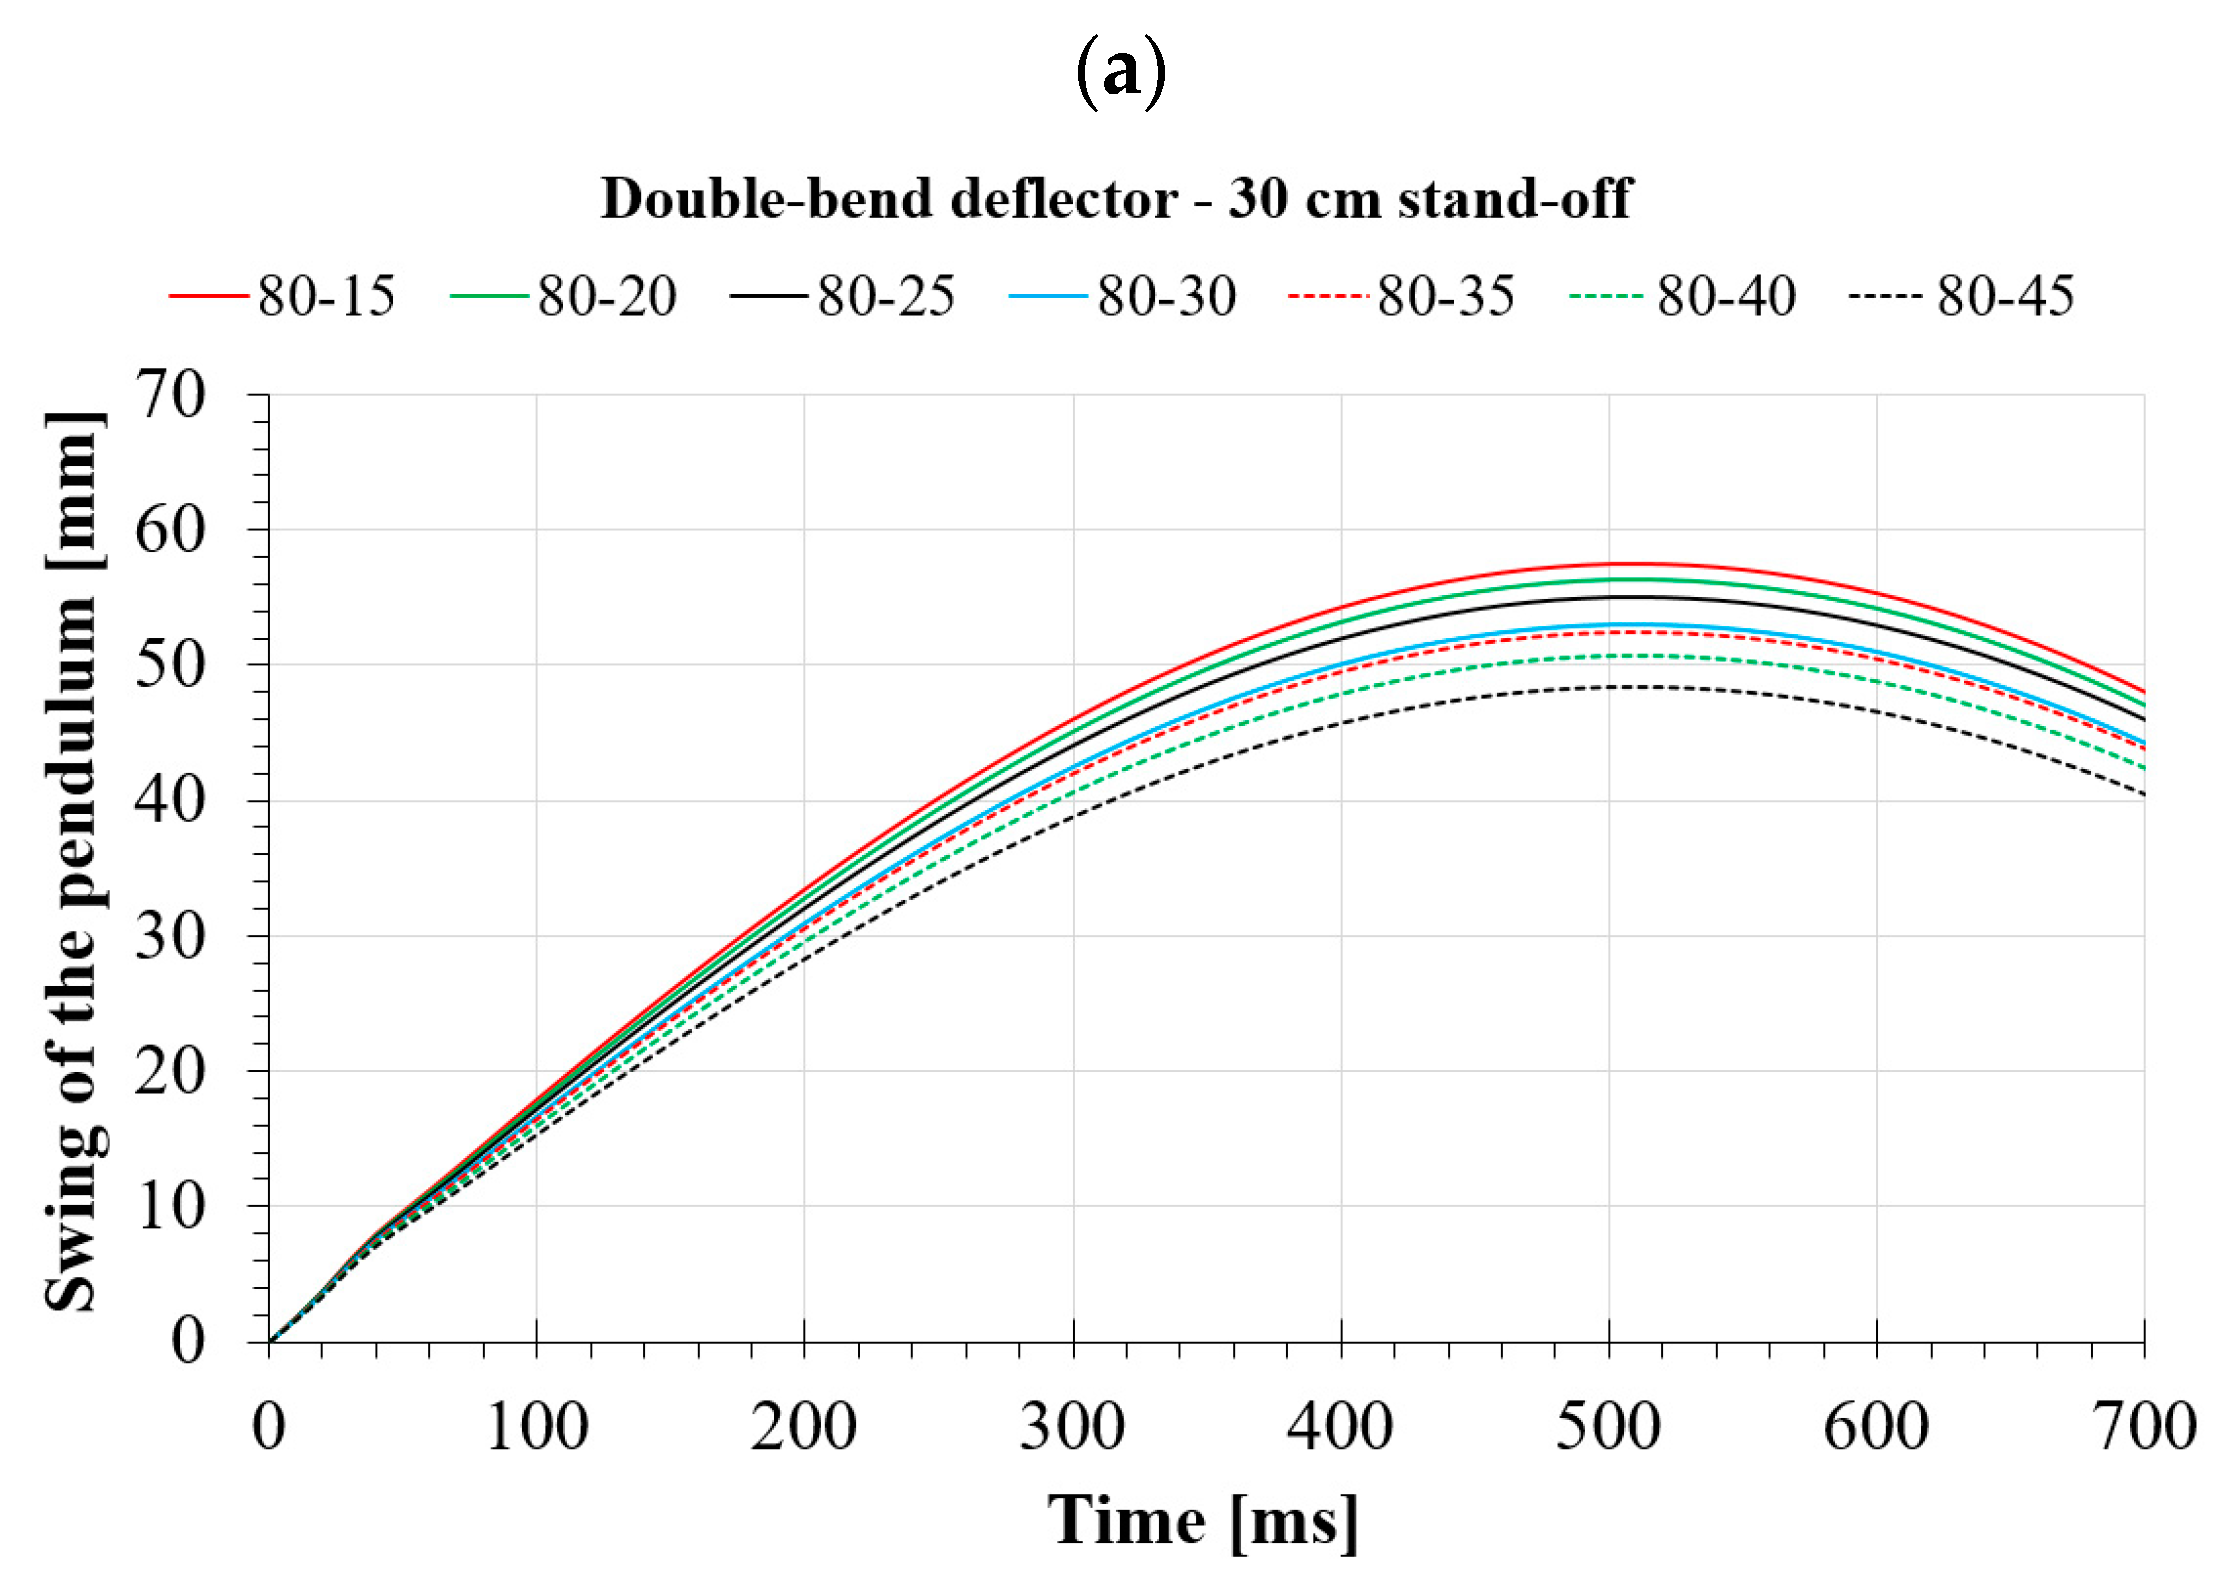
In the case of deflectors in which the A-dimension was constant and the B-dimension was differentiated, we observe a much wider distribution of curves (Figure 16). In this case, the difference between the smallest and largest pendulum deflection values obtained is 15.6%, 10.6%, and 10.5%, respectively, for the considered stand-offs. For a distance of 30 cm, the scatter of these values expressed as a percentage is more than double that of the constant B-size variant. For larger distances, the difference is reduced, but it is still significant. This distribution of curves suggests that for double-bend deflectors, the change in the B-dimension is more critical for the energy dissipation capacity than the A-dimension.
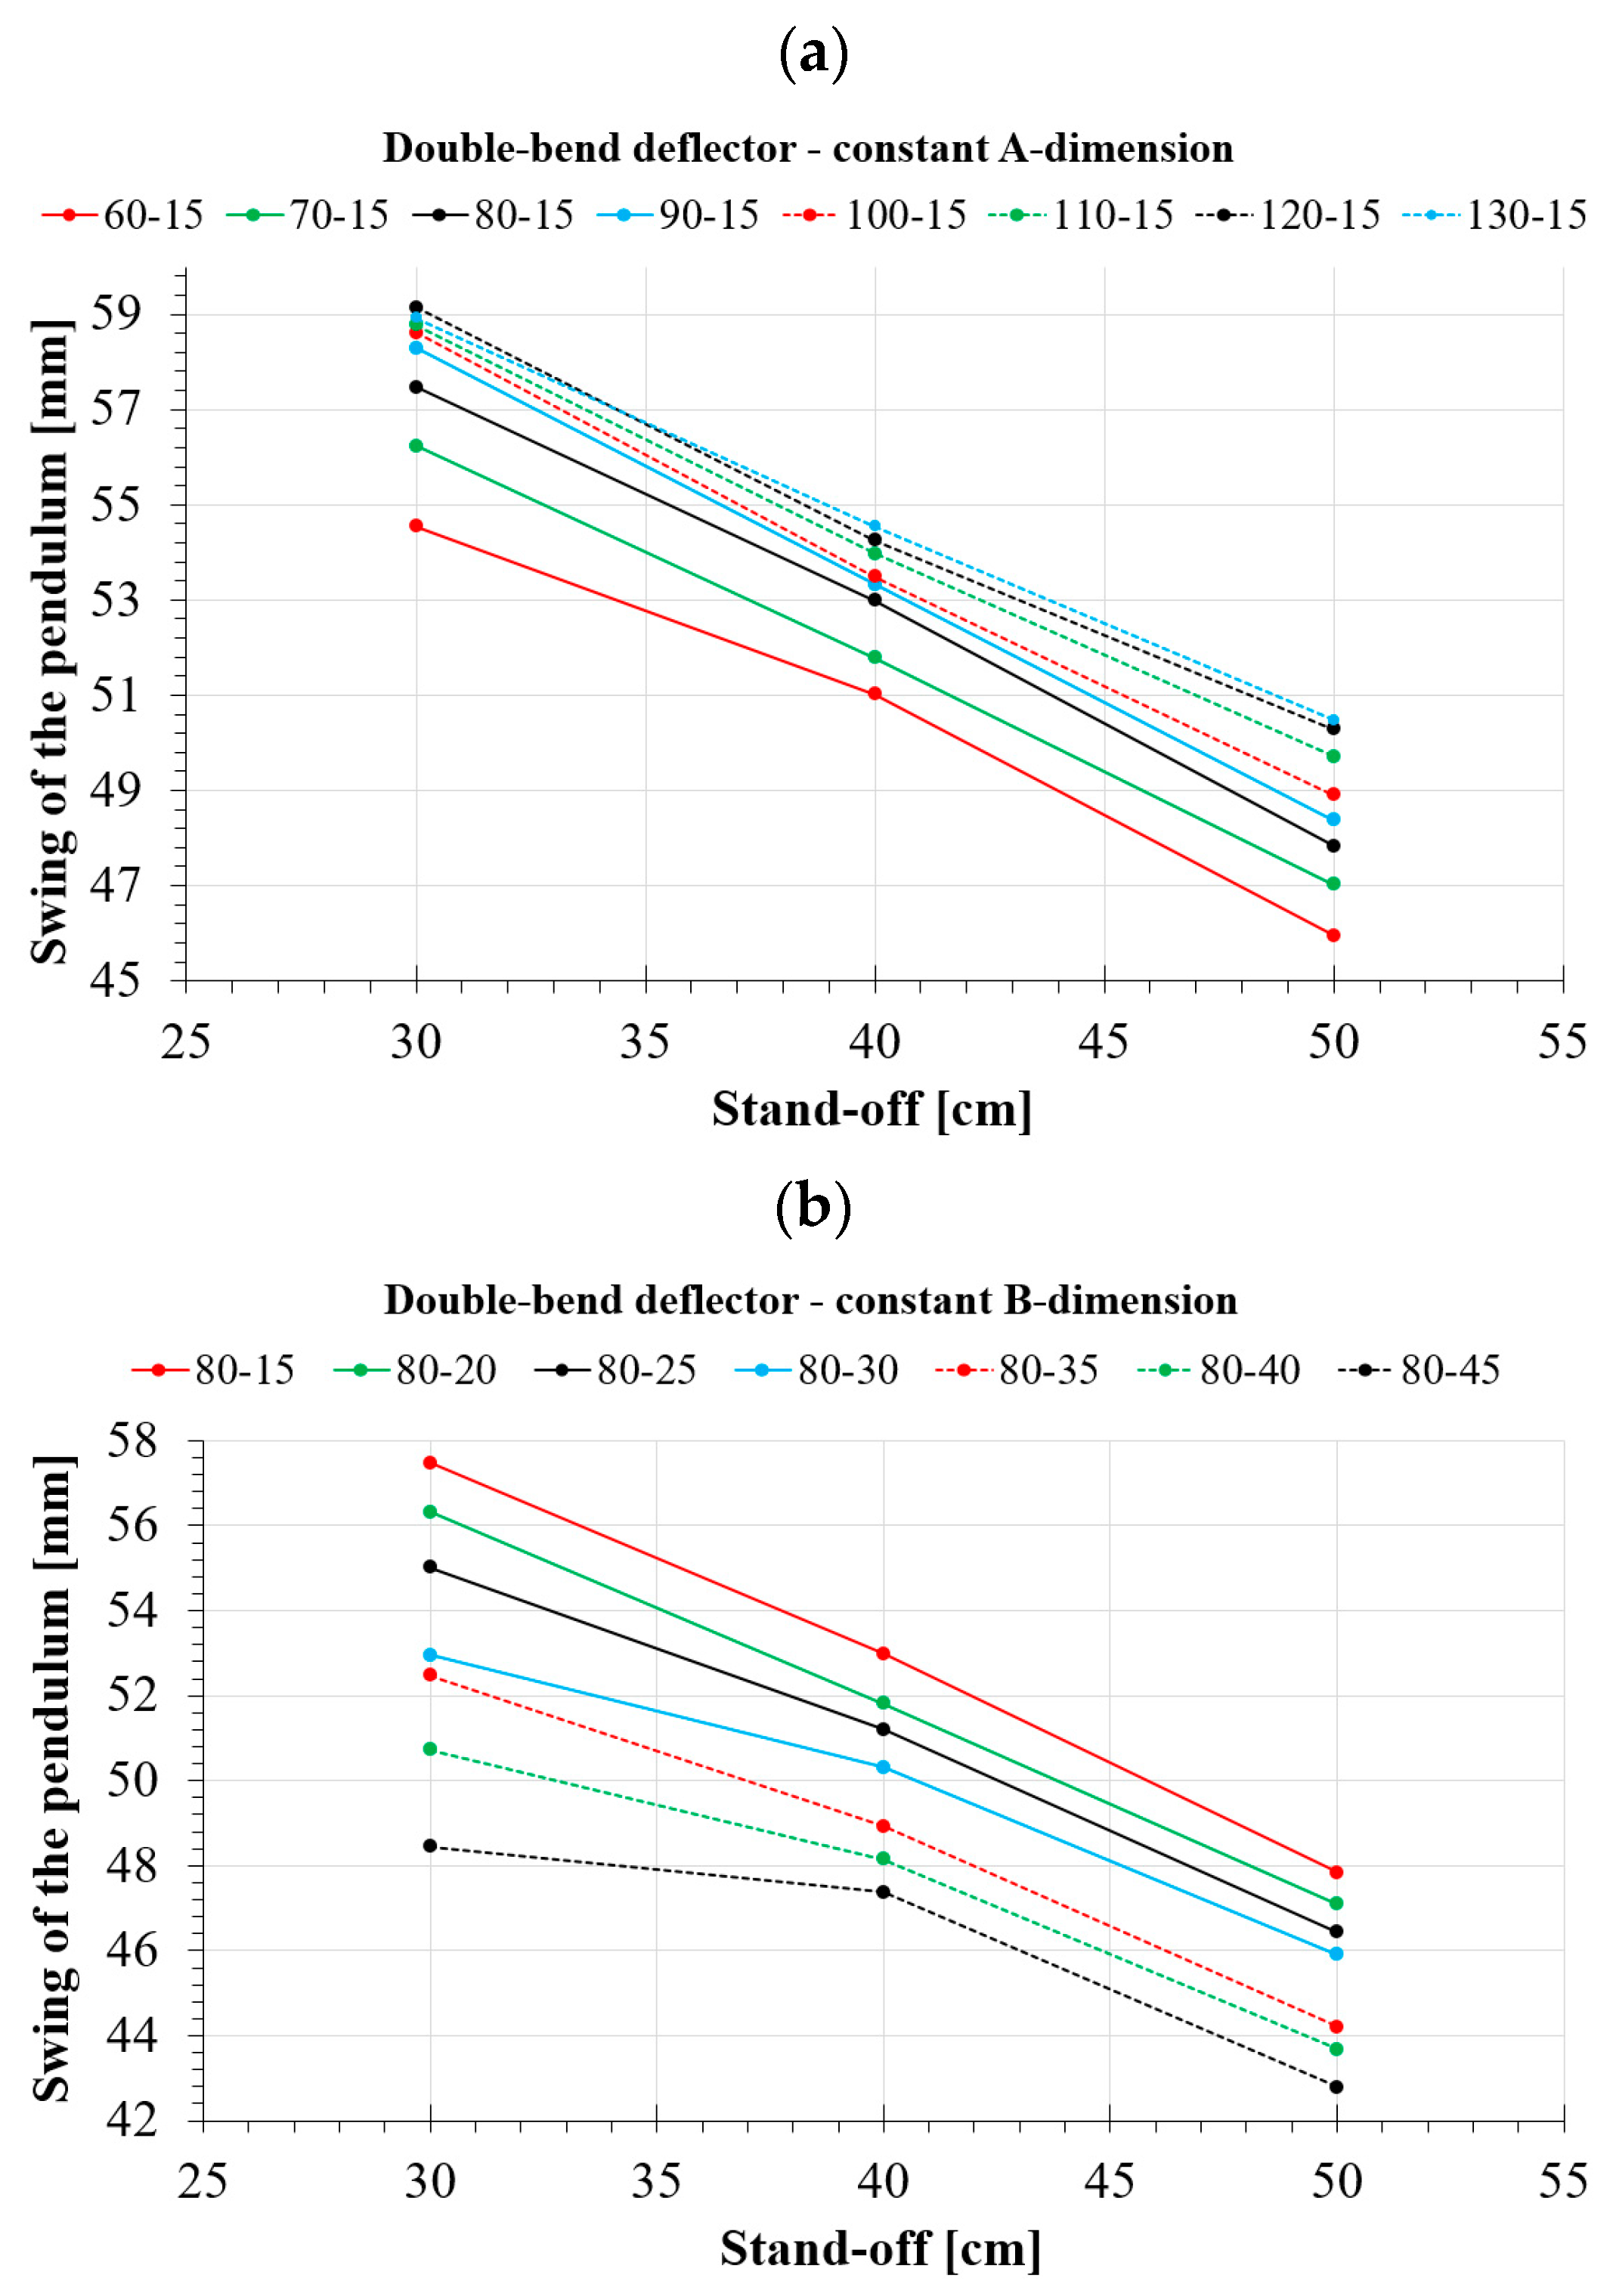
The change in the value of the maximum tilt is well illustrated by the curves presented in Figure 17. The first one shows the variant when the A-dimension is constant (Figure 17a). The change in deflection with increasing distance of the explosive charge has a linear character in most cases. The only clearer bend in the curve can be observed only for deflectors 60-15 (solid red line) and 80-15 (solid black line). Here, too, it is clear that the smallest deflection value was obtained for the variant when the A-dimension equaled 60. Subsequent increases in this dimension only resulted in a deterioration of the deflector’s ability to dissipate energy.
For a fixed B-dimension (Figure 17b), the distribution of the curves is similar. Again, the vast majority show a linear character. Against this background, the 80-45 (black dashed line), 80-40 (green dashed line), and 80-30 (solid blue line) deflectors stand out, where we can observe an evident bend for a distance of 40 cm. Such a change means a sharp increase in energy dissipation efficiency for distances greater than 40 cm in their cases. In the case of deflectors with a constant B-dimension, the smallest values of pendulum deflection for all explosive charge distances were obtained for the 80-45 variant, which means that increasing an B-dimension results in an improvement of energy deflector properties.
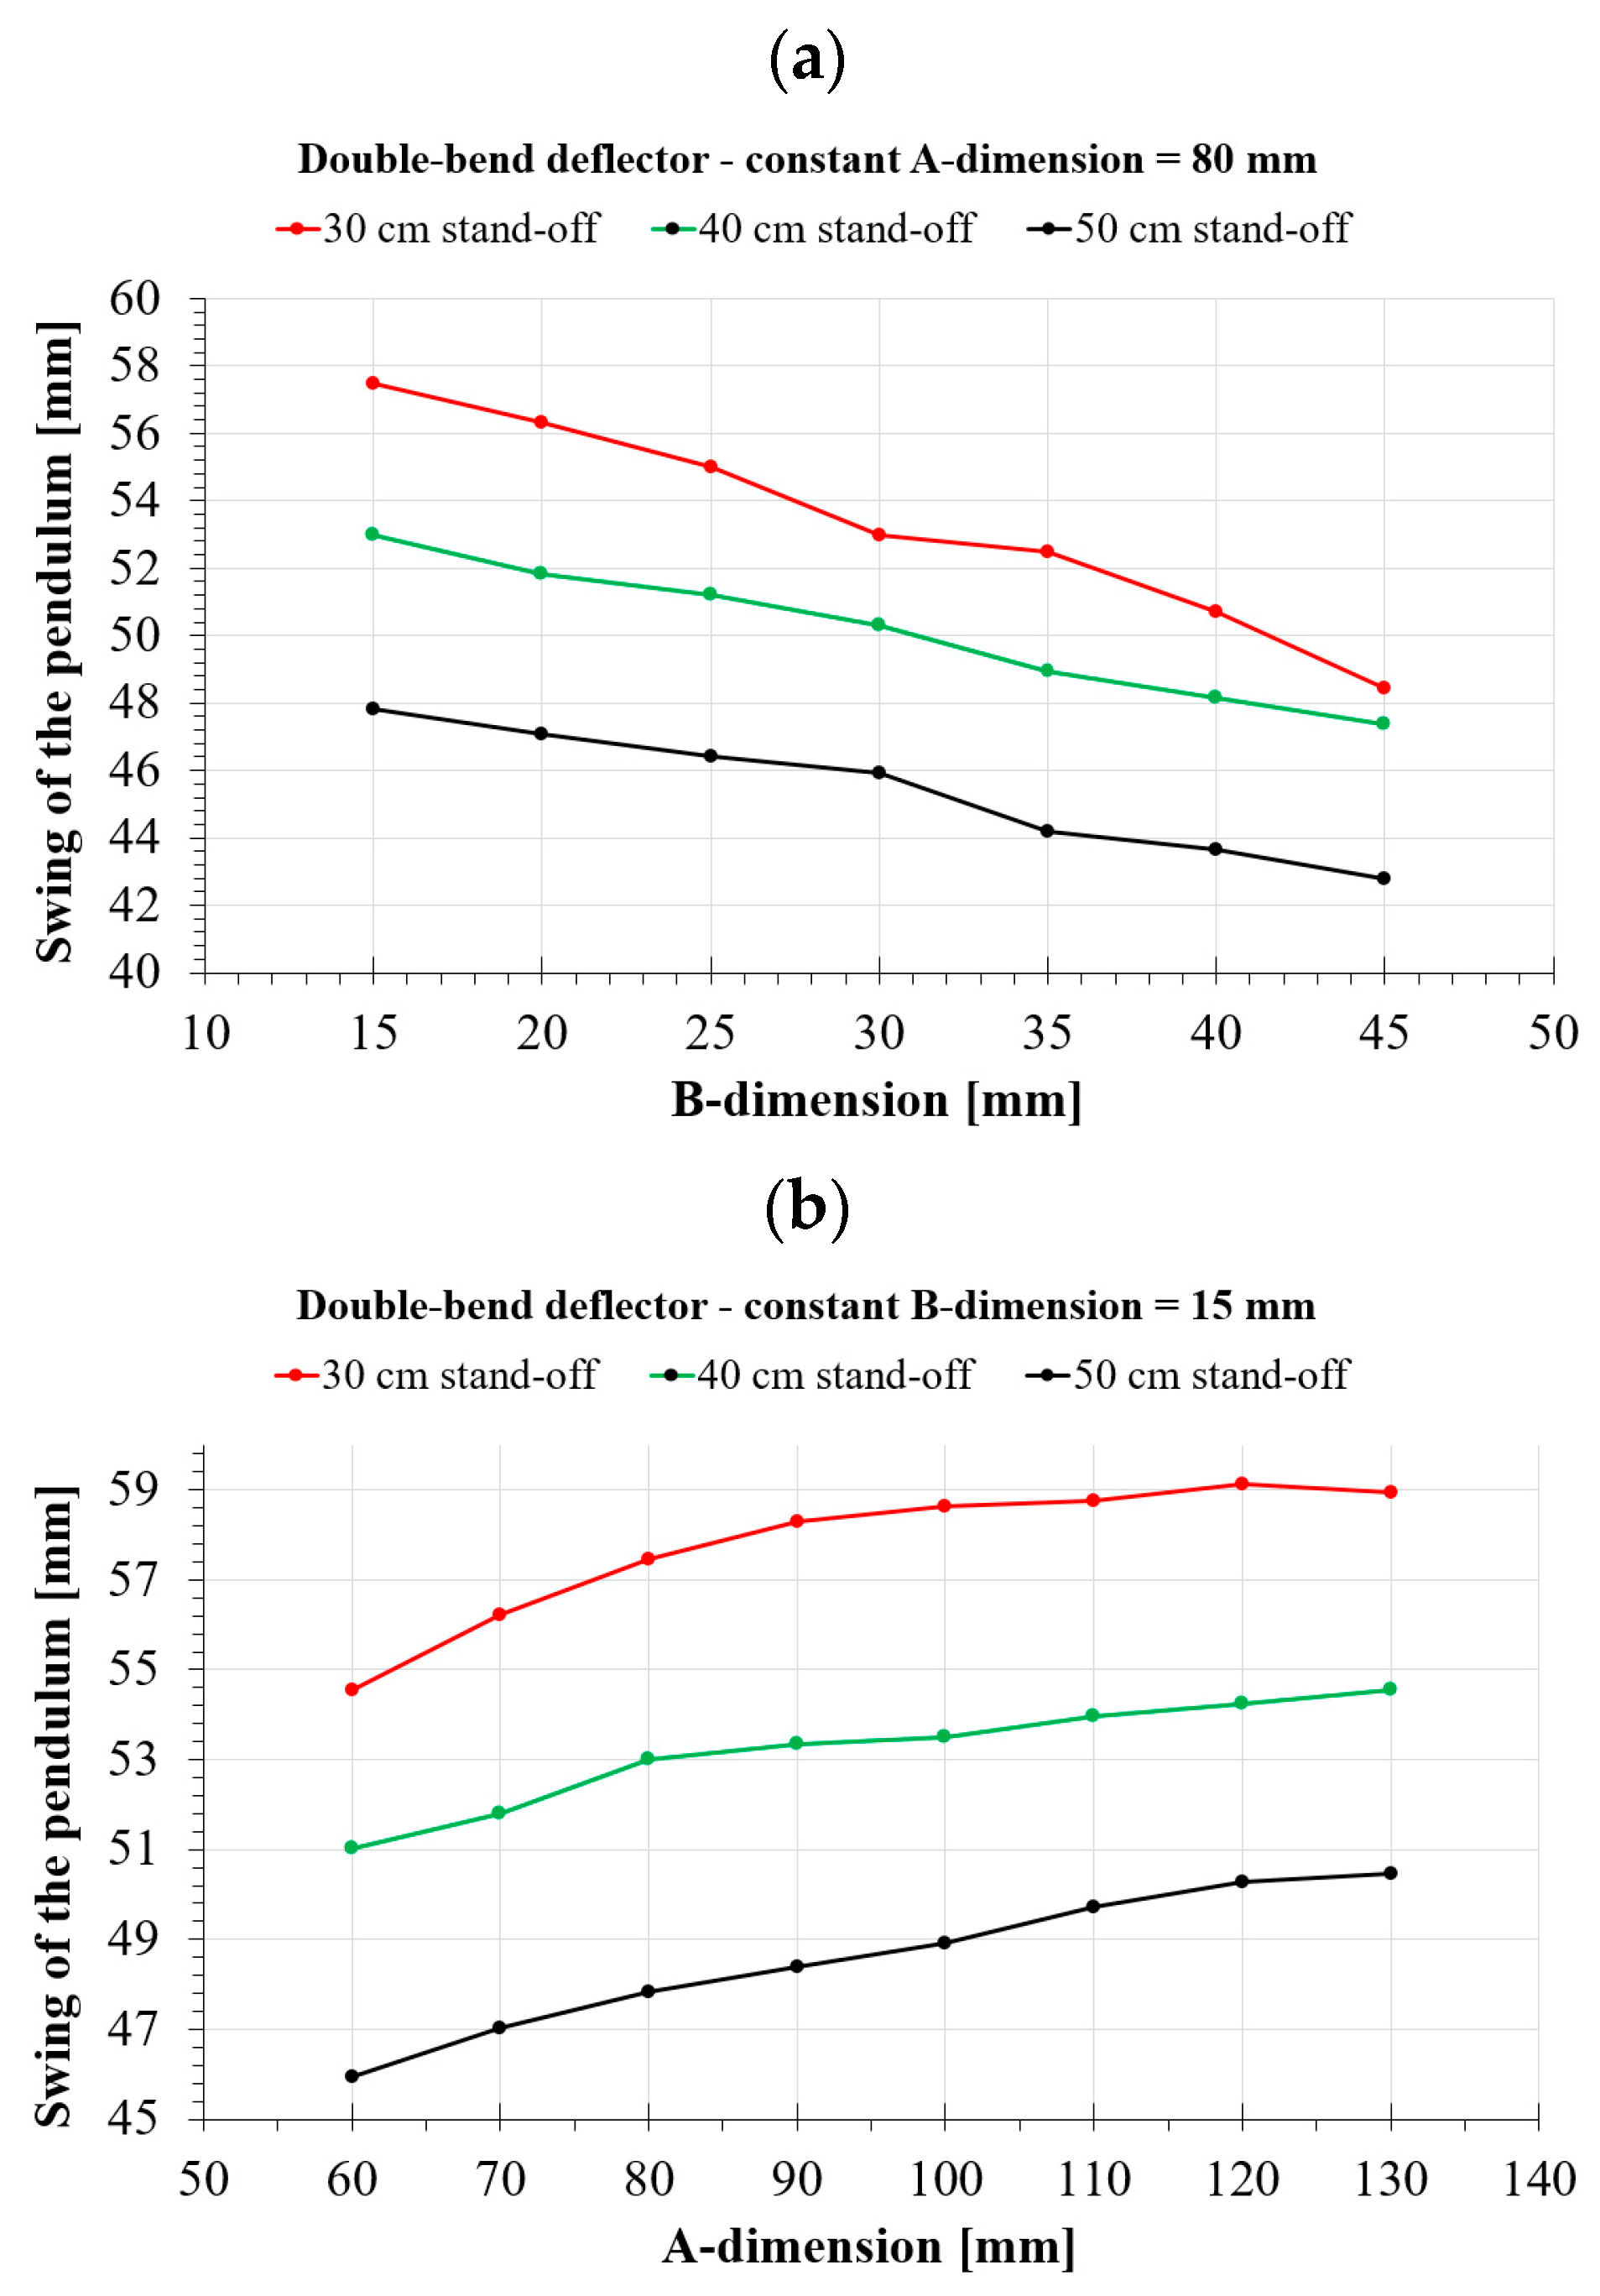
Figure 18 shows the effects of the A-dimension and B-dimension values on the deflections of the ballistic pendulum for the various distances considered. They confirm that an increasing A-dimension results in a deterioration of the deflector’s ability to dissipate energy. The critical factor in this regard is the B-dimension, which is of most significant importance, especially for short charge distances from the deflector (the curve in Figure 18 for the 30 cm stand-off is characterized by the steepest slope relative to the other two).
The exact results of the obtained deflections of the ballistic pendulum are shown in Table 6.
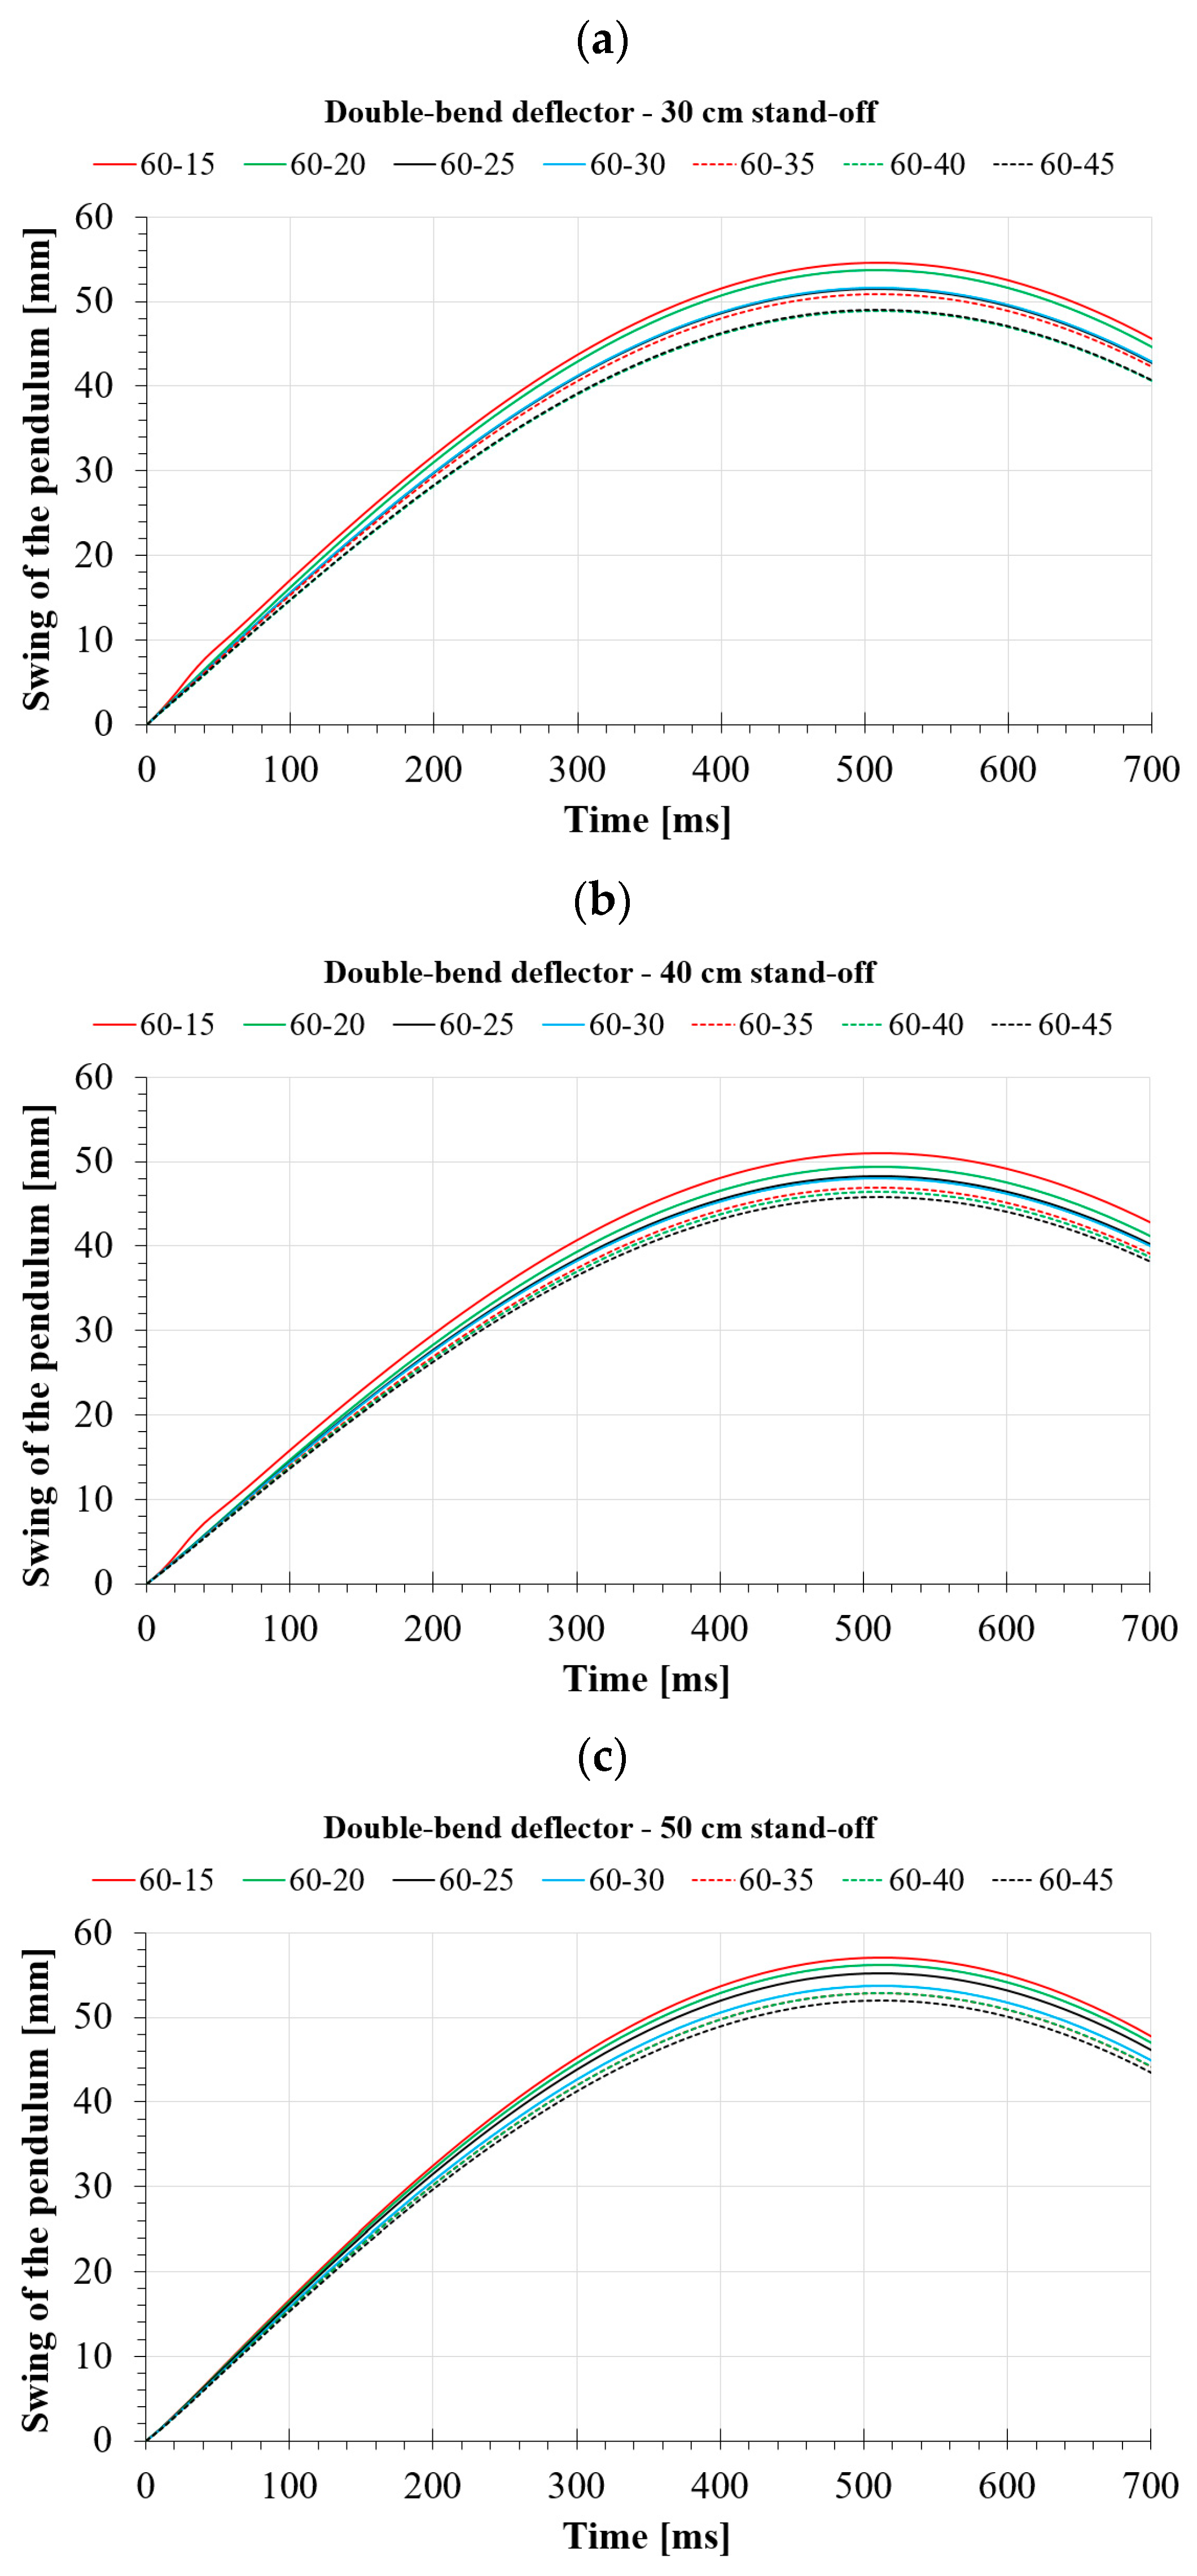
Analyzing the deflectors studied so far, it turned out that the A-dimension has the most favorable value of 60 mm, whereas the B-dimension’s is 45 mm. For this reason, it was decided to analyze another group of deflectors with an A-dimension equal to 60 mm and a varying value of the B-dimension. This group is referred to as 60-series, as opposed to the double-bend deflectors’ group with an A-dimension equal to 80 mm, designated in the following as 80-series. The curves representing the course of the ballistic pendulum swing for this group of deflectors are shown in Figure 19. In this variant, the difference between the maximum and minimum values of the pendulum swing for each distance was 10.1% for both 30 and 40 cm and 8.9% for the distance of 50 cm.
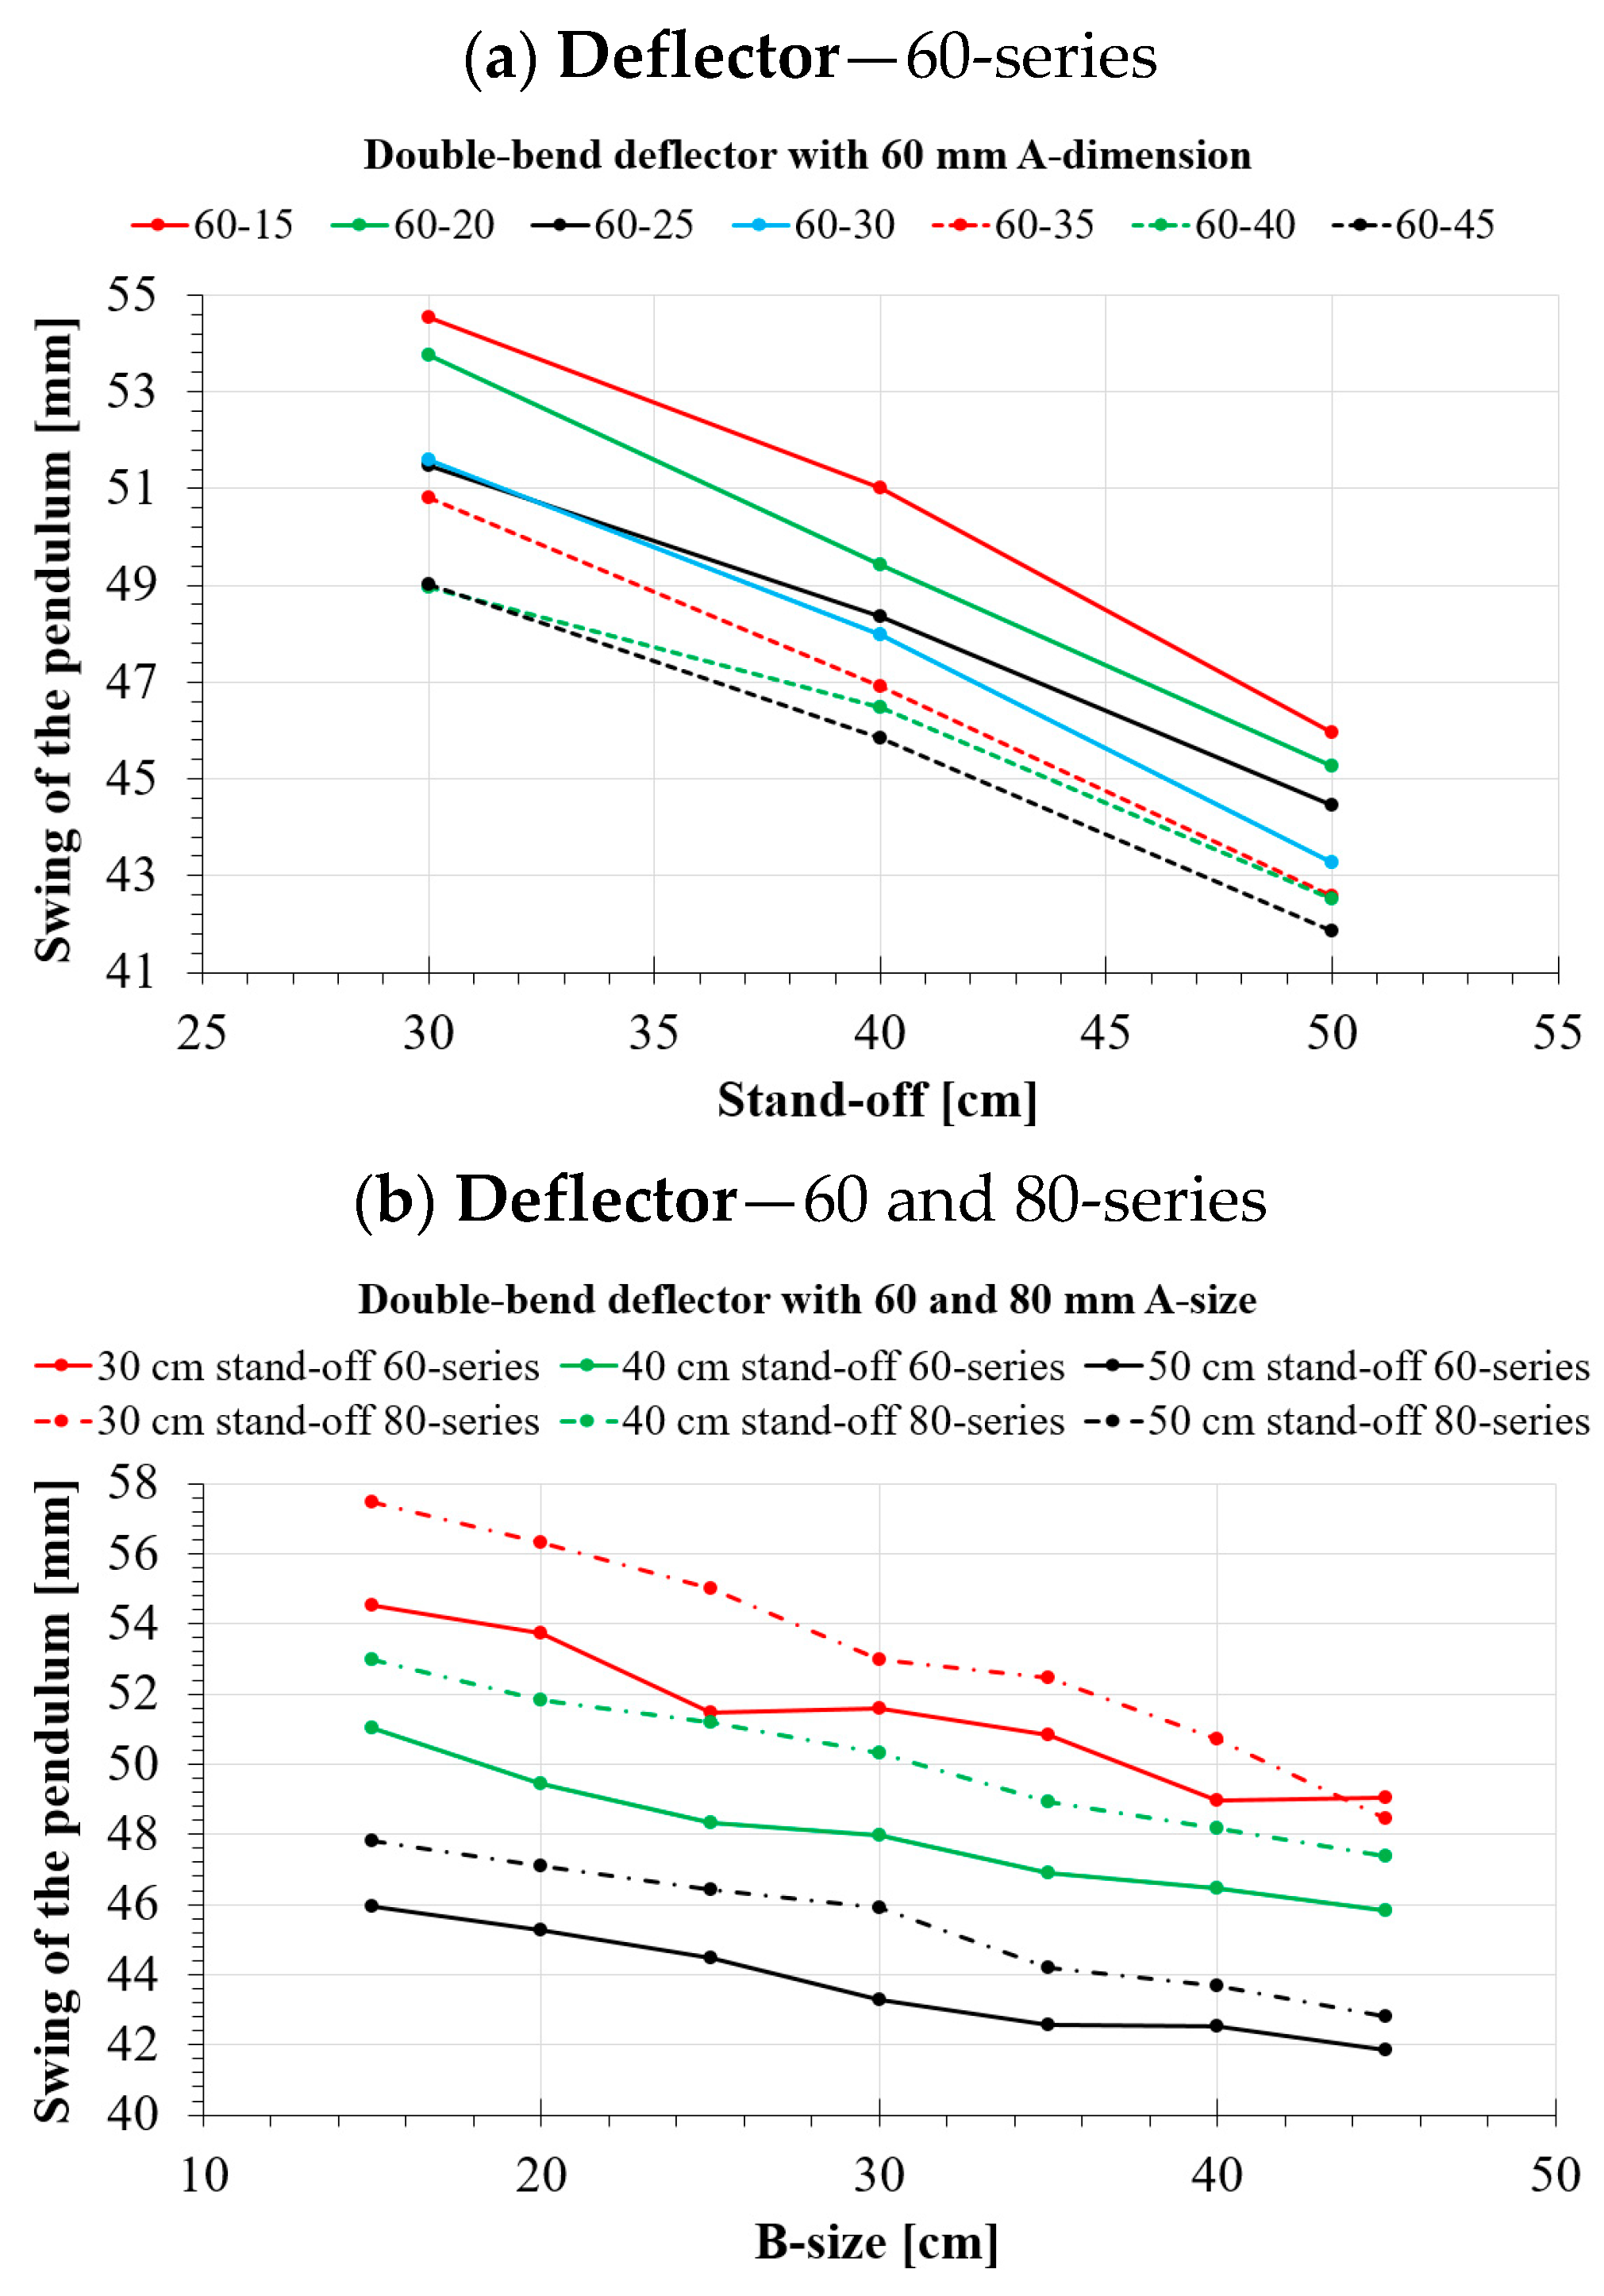
Figure 20a shows a graph of the change in maximum pendulum swing depending on the value of the B-dimension. It shows that although the best results were obtained up to a B-dimension value of 45 mm, the difference between it and the 35 mm value was only 3.5%, 2.3%, and 1.7% for charge distances of 30, 40, and 50 cm, respectively.
Figure 20b compares 60-series (solid line), and 80-series (dashed line) deflectors as a function of B-size values for all three considered explosive charge stand-offs in every case considered. Using 60-series deflectors resulted in lower pendulum deflection values than 80-series deflectors. The former is characterized by more ability to dissipate energy. We can see the only deviation from this rule for the stand-off of 30 cm and B-size of 45 cm, wherein a slightly lower deflection was obtained for the 80-45 variant. However, this difference was only 1.2%. It is worth noting that using a 60-25 deflector for a distance of 30 cm results in a very similar result as using an 80-25 deflector, but for a distance of 40 cm.
The exact results of the ballistic pendulum deflections for 60-series double-bend deflectors are shown in Table 7.

4.3. Numerical Analyses of the Semi-Spherical Deflector

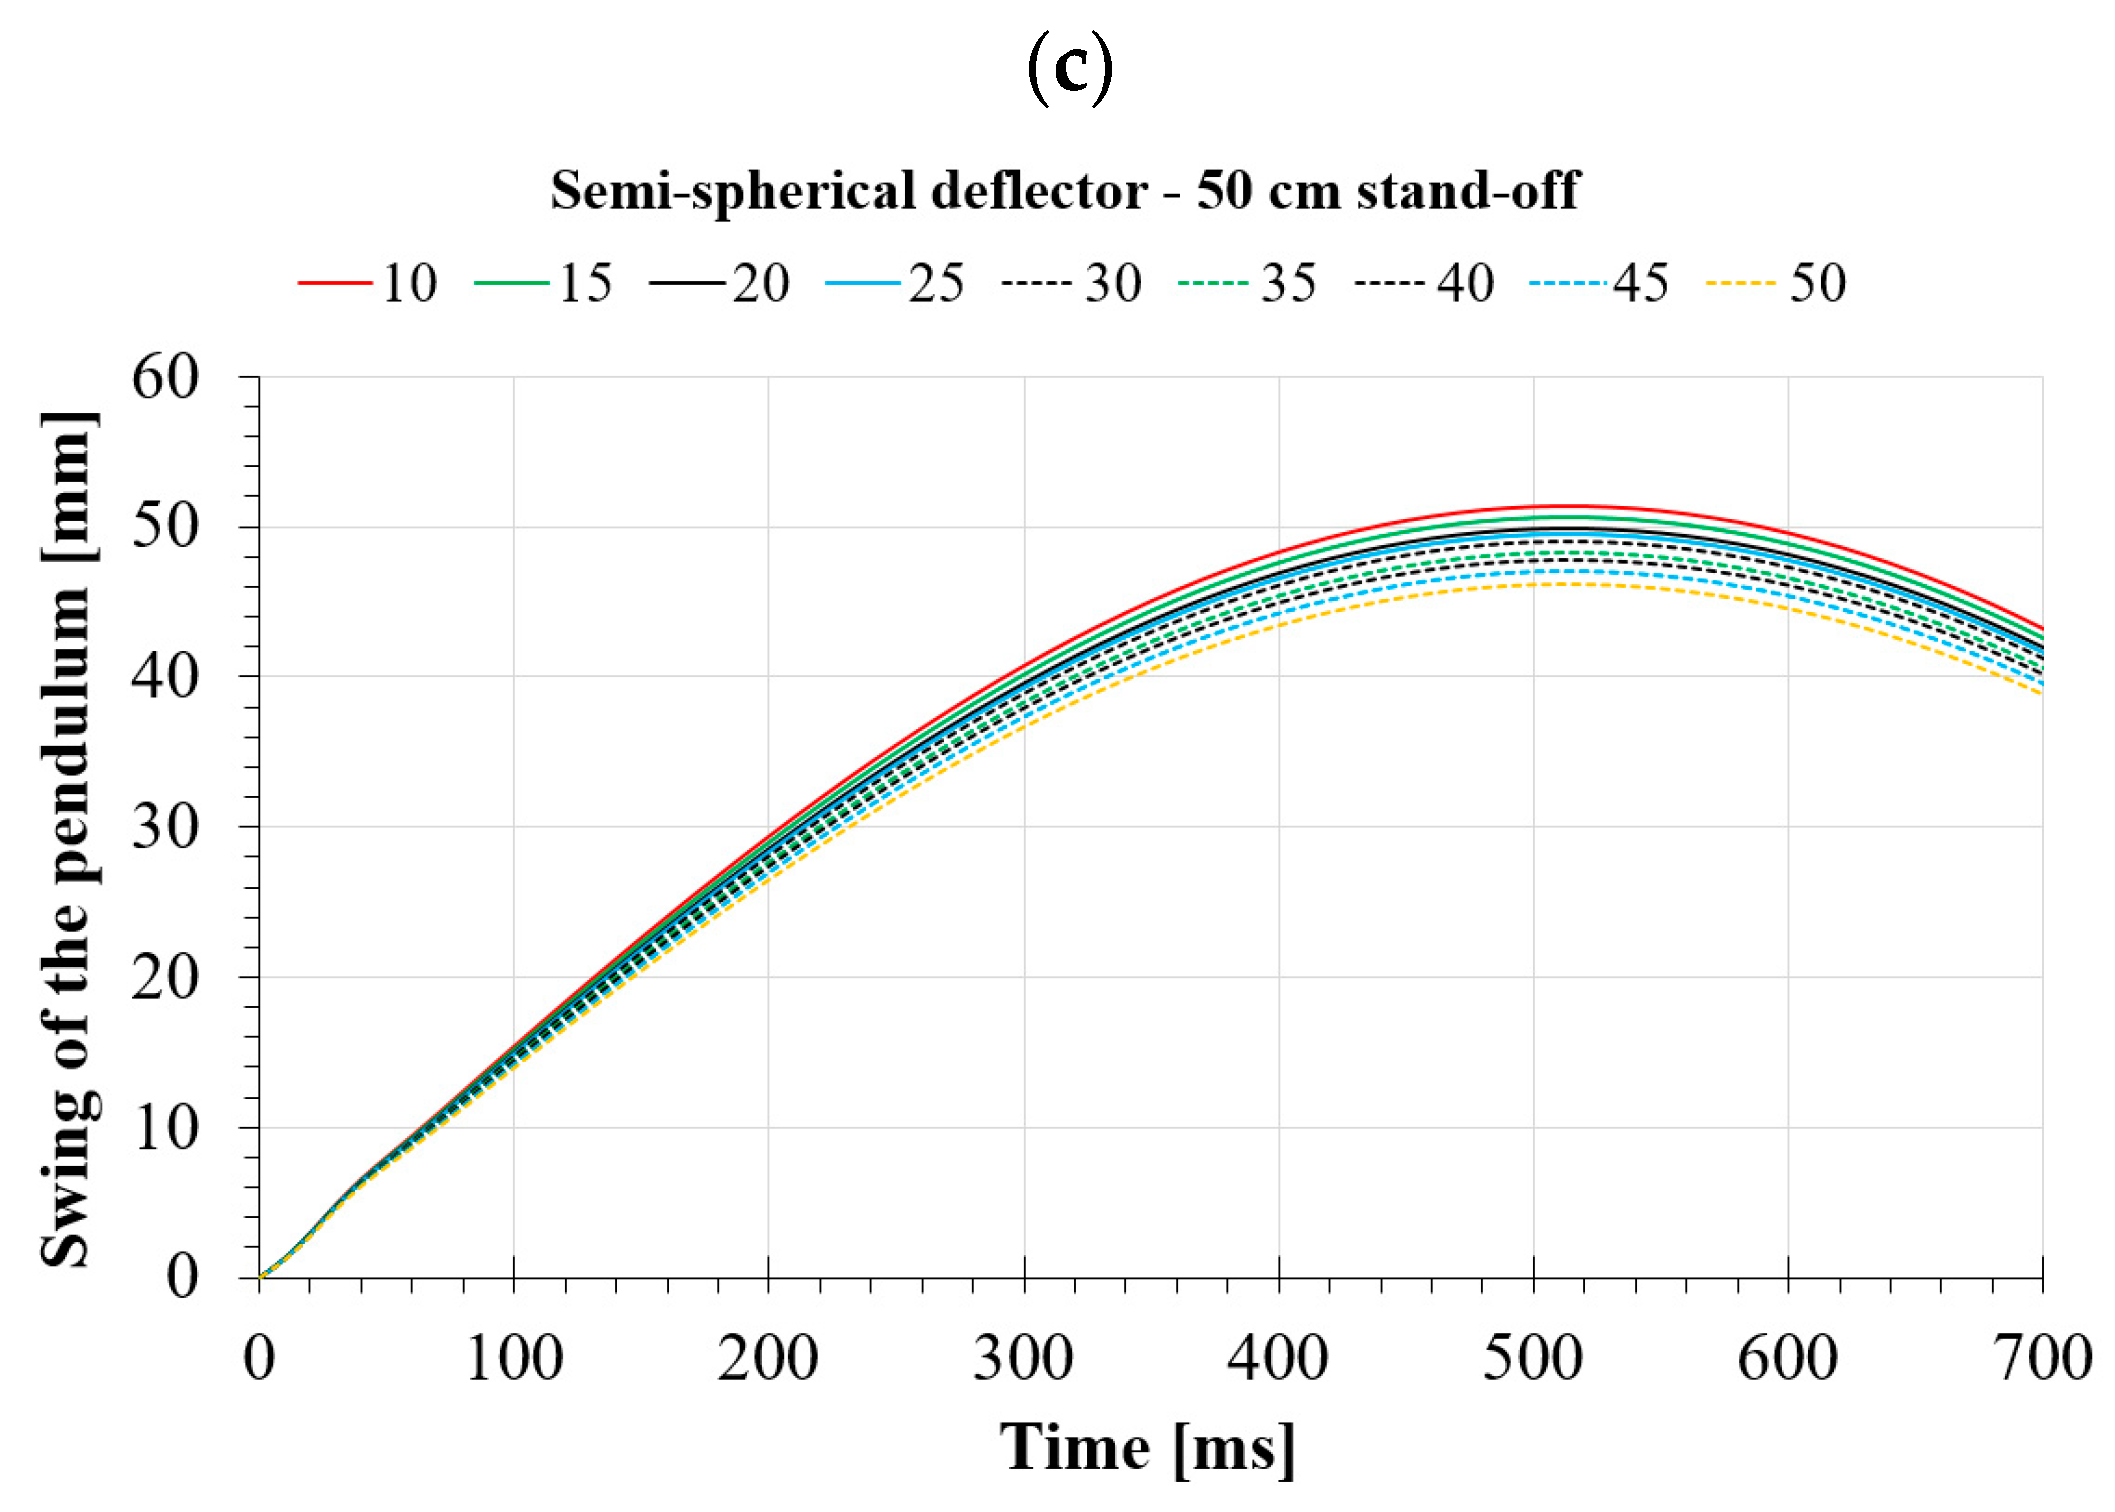
In the case of a semi-spherical deflector, the effect of the arc radius forming the working part of the deflector was considered. Radii from 10 to 50 mm were adopted, with gradations of 5 mm. Figure 21 shows the deflections of the ballistic pendulum for the geometries mentioned above and all three distances of the explosive charge. Analyzing the graphs below, we can see that the difference between the maximum and minimum deflection values is 7.4%, 6.9%, and 10% for distances of 30, 40, and 50 cm, respectively.
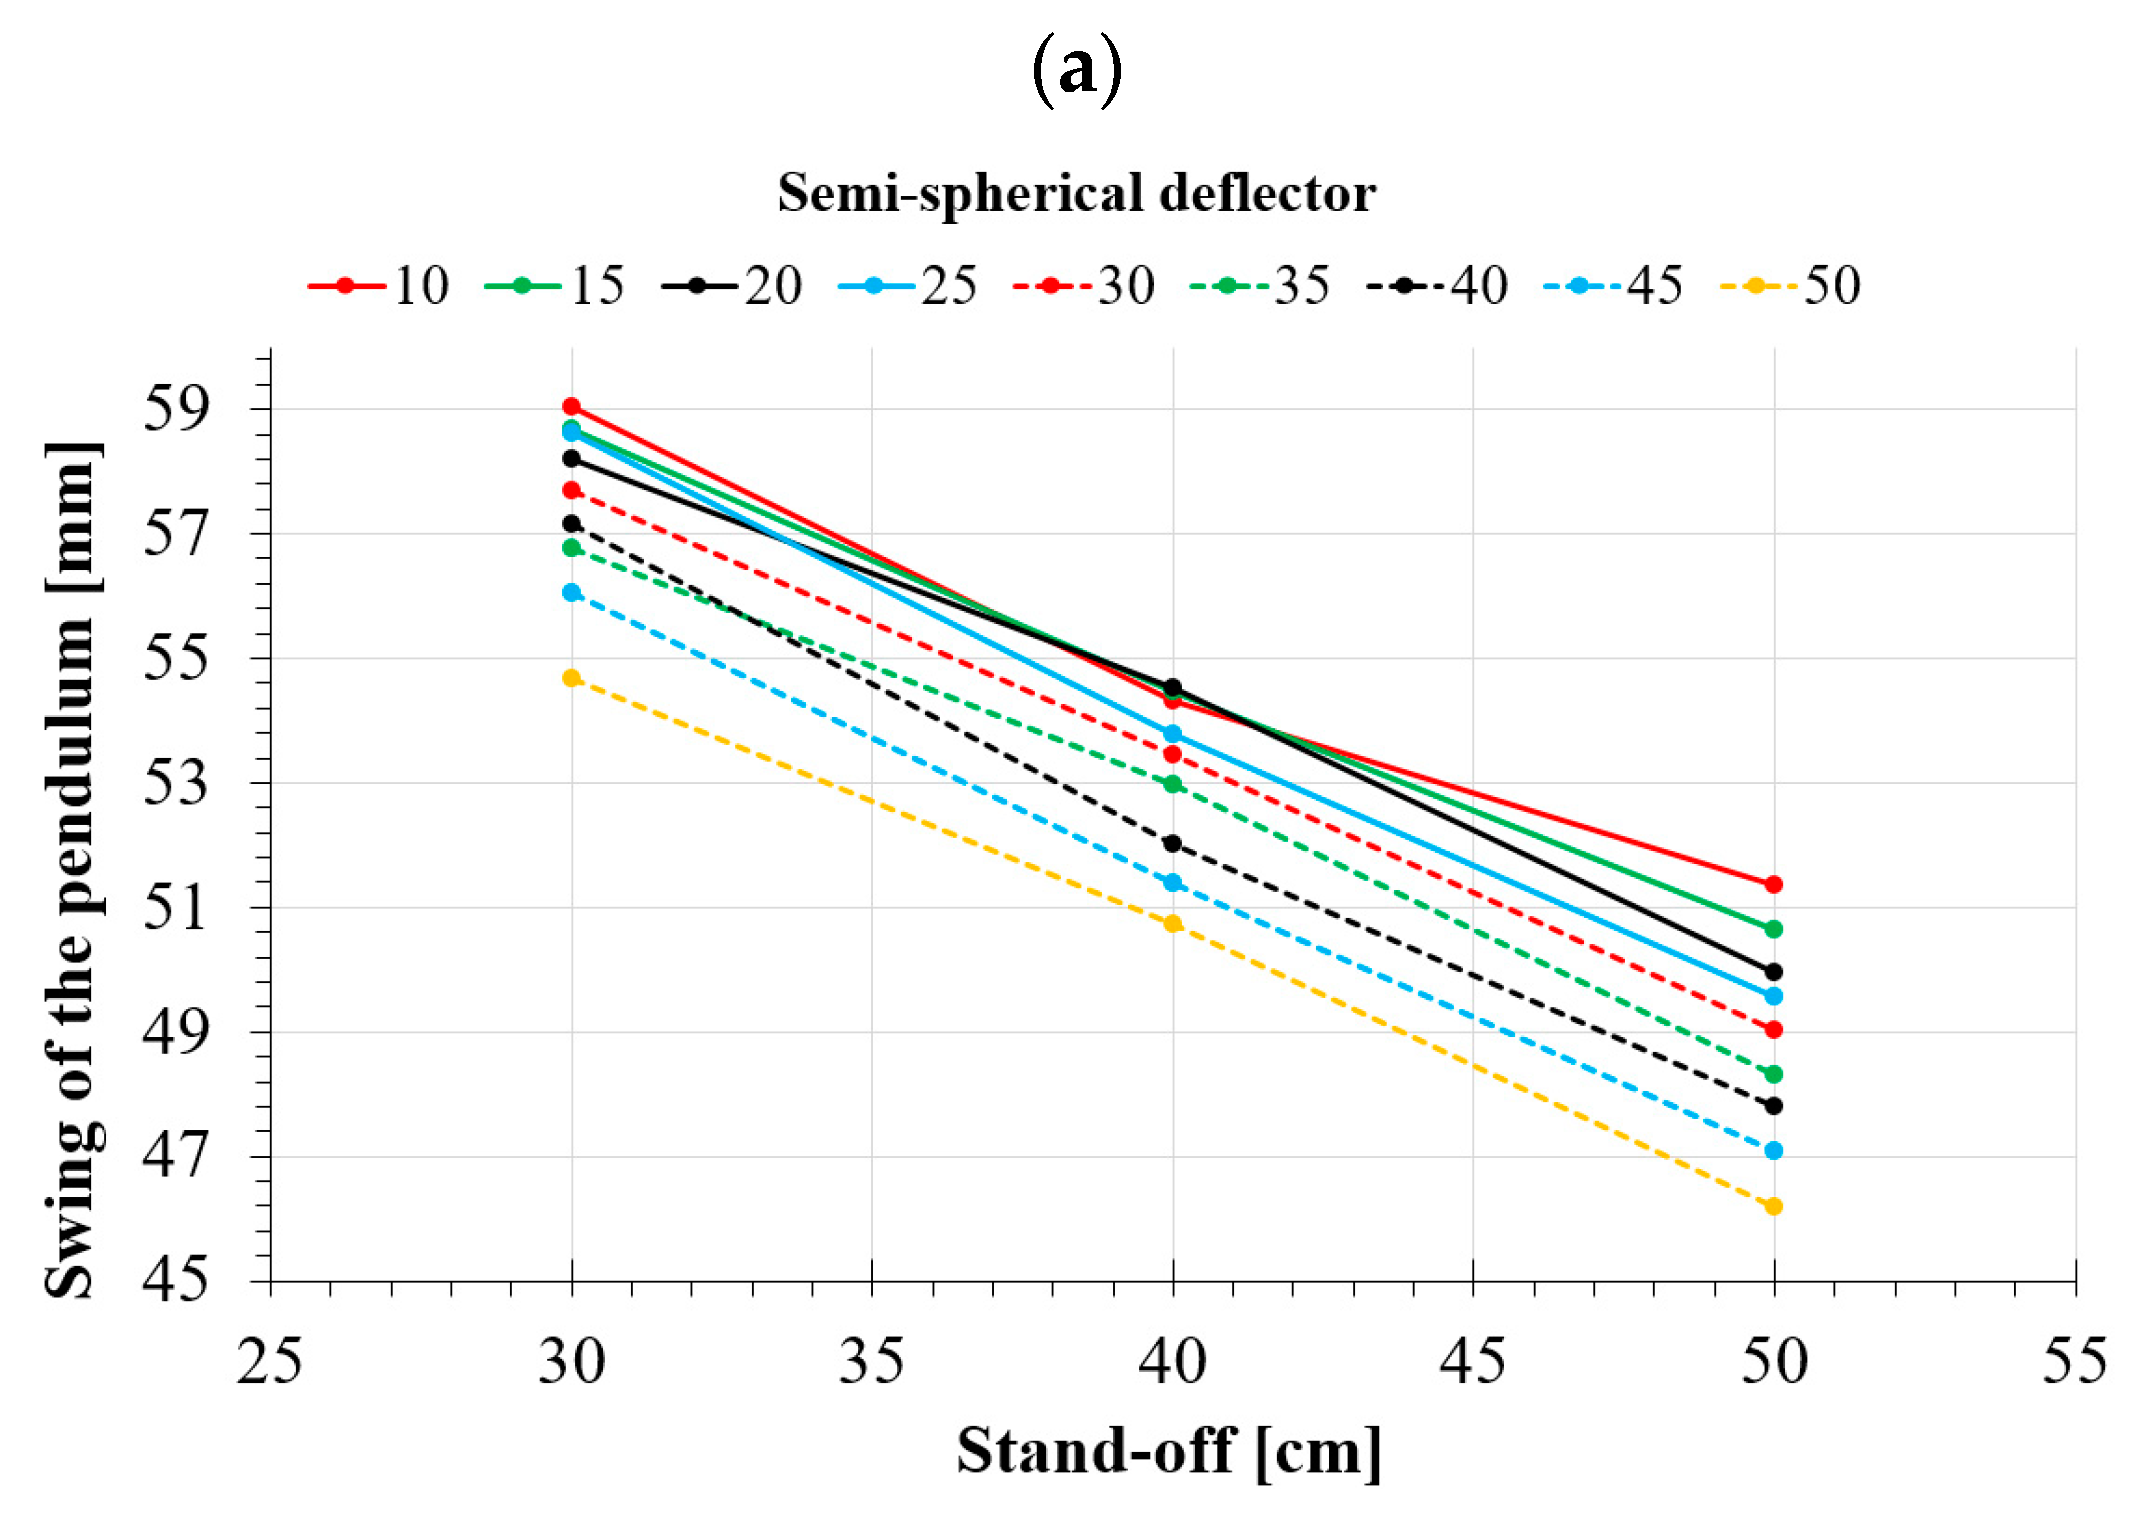
The maximum pendulum swing value depending on the applied geometry of the semi-spherical deflector and the distance from the explosive charge is presented in Figure 22a. We can see that it has a linear character, while the only slight deviations are observed for deflectors with radii of 35 and 40 mm. It is worth noting that at a distance of 30 cm, the maximum deflection for 15, 20, and 25 mm deflectors are very close to each other (the difference is less than 1%), and it is only for greater distances that the results begin to diverge more in favor of the deflector with a larger radius.
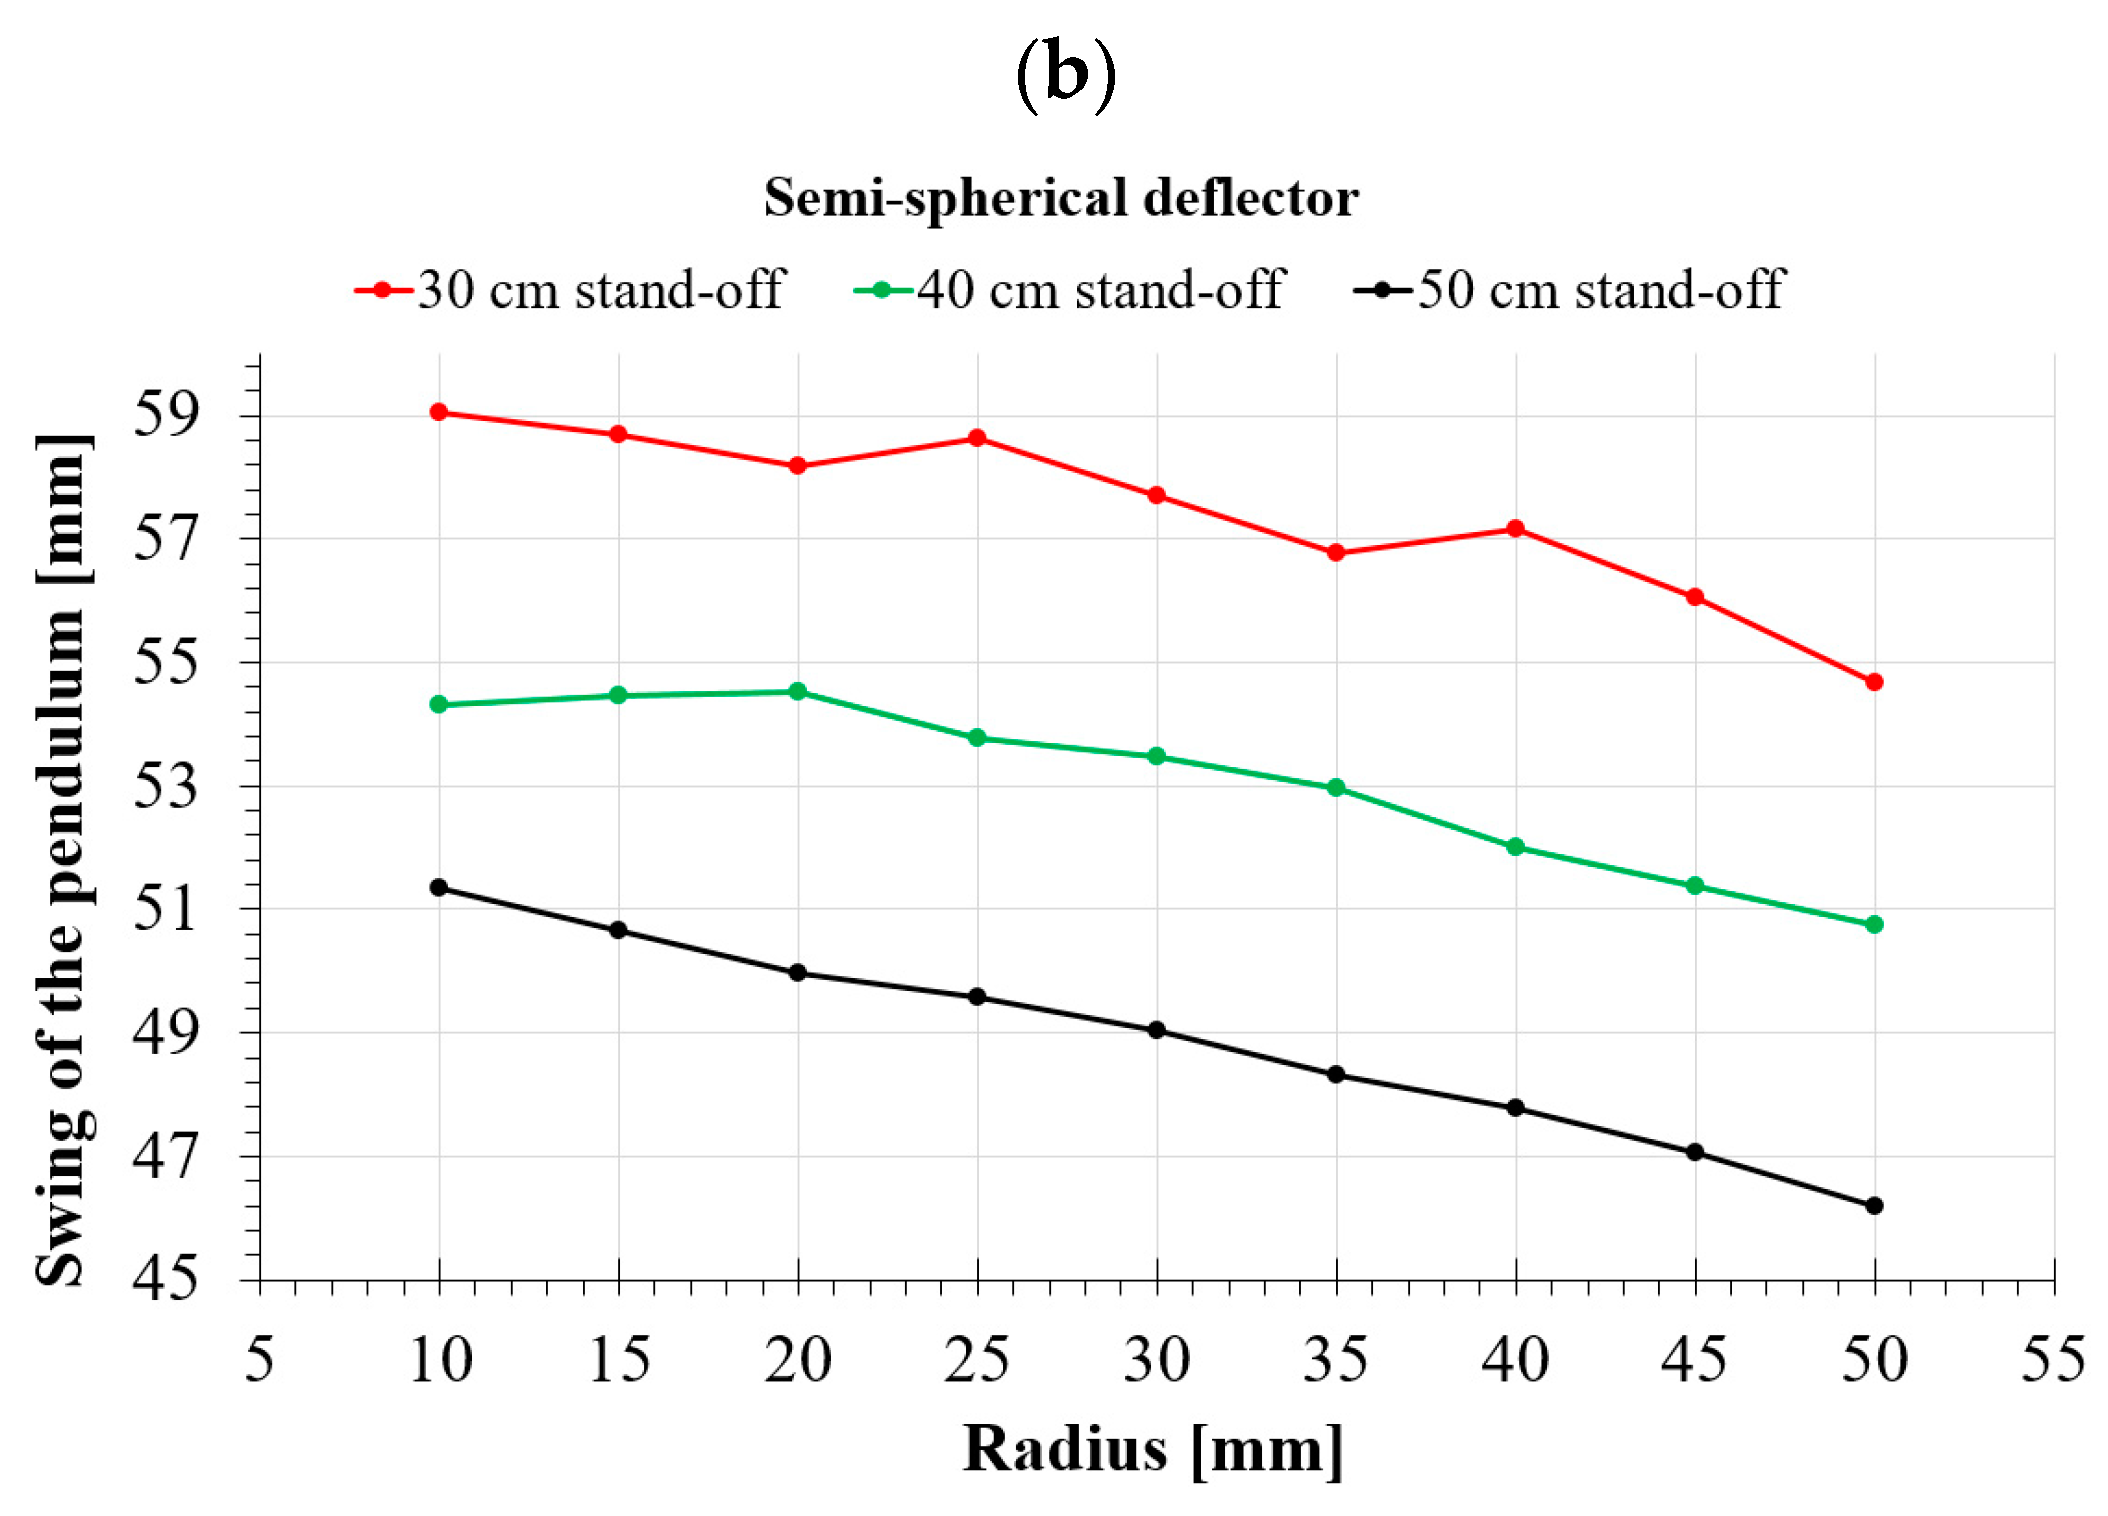
Figure 22b presents the change in pendulum swing as a function of deflector radius for all distances considered. It shows that for a stand-off of 30 cm and radii from 10 to 25 mm, the changes in the values are small, and only from 30 mm does a significant decrease in the deflection begin, which indicates the ability of the deflector to dissipate energy.
The exact results of the ballistic pendulum deflections for semi-spherical deflectors are shown in Table 8.
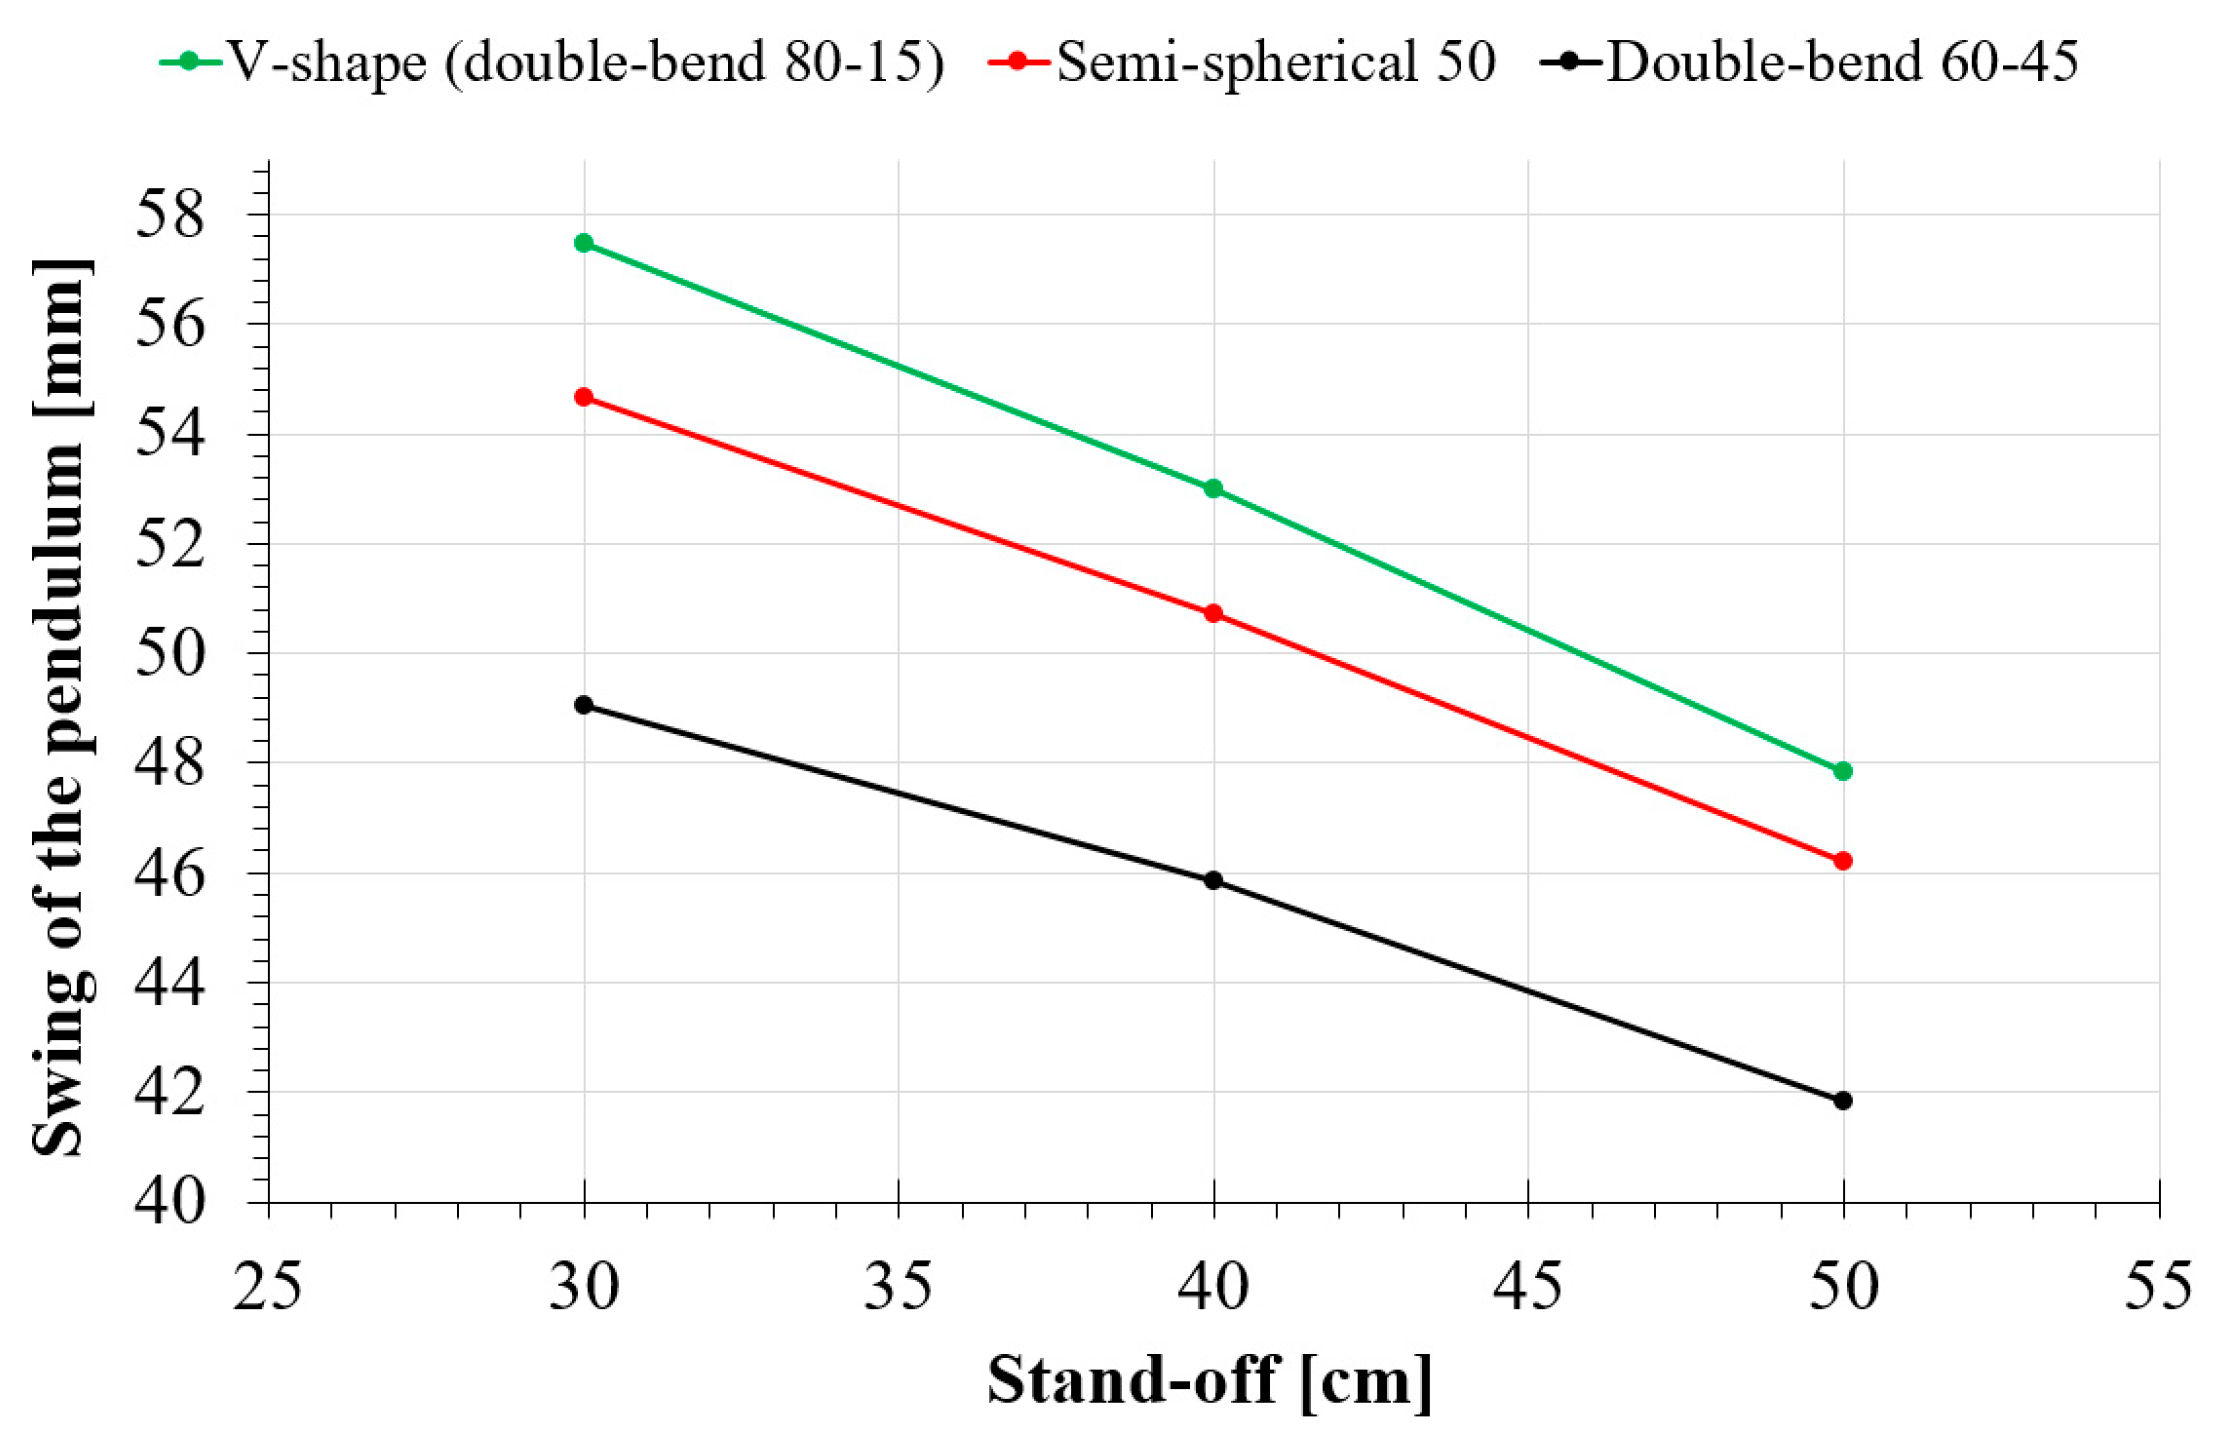
Figure 23 compares energy dissipation capacities for the best variants of double-bend and semi-spherical deflectors. For comparison, values for a double-bend 80-15 deflector, which is the same as a typical V-shaped deflector, are also included. All the deflectors shown have the same height at their highest point. The use of double-bend deflectors is advantageous. The difference between semi-spherical and V-shaped deflectors ranges from 12.5% to 14.5% (for distances of 50 cm and 30 cm, respectively). This deflector provides much better energy dissipation capability, especially when the distance between the explosive charge and the protected object is short. The semi-spherical deflector also proved superior to the V-shaped variant. However, the differences are much smaller and range from 3.4% (distance of 50 cm) to 4.9% (distance of 30 cm). As with the double-bend deflector, we observe a decrease in the difference as the distance from the explosive increases.

5. Summary

The article presents the results of experimental and numerical studies of innovative shapes of energy deflectors. In order to determine the deflector’s ability to dissipate energy, a test stand was prepared in the form of a ballistic pendulum, to which energy deflectors were mounted and loaded with a wave of energy from the detonation of an explosive charge (Semtex A1).
The results of these analyses allowed validation of the created numerical model of the test stand. A series of double-bend and semi-spherical deflectors differing in key dimensions were prepared in the next step. In the case of double-bend deflectors, these were the so-called A-size and B-size, whereas in the case of semi-spherical deflectors, it was the radius of the rounded working part. The dimensions were chosen so that all the deflectors considered had the same height. Tests were conducted for three explosive charge stand-offs: 30, 40, and 50 cm.
The results of the numerical tests established that:
  • For a double-bend deflector, an increasing A-size results in a deterioration of its energy dissipation capability. An increasing B-size, on the other hand, results in the opposite situation, i.e., the performance is improved;
  • Increasing the A-size from 60 mm to 130 mm results in a 7.4% deterioration in effectiveness for a 30 cm stand-off. When the distance is increased, the deterioration in effectiveness increases slightly to 8.9%;
  • The deflector effectiveness increases by as much as 15.6% for a 30 cm stand-off, increasing the B-size from 15 mm to 45 mm. For greater distances, the effectiveness increase decreases to 10.5%;
  • Using semi-spherical deflectors is more effective, by up to 5%, than a typical V-shaped deflector, whereas for double-bend deflectors, the difference increases to 14.5%

Author Contributions

Conceptualization, M.K. and R.P.; methodology, R.P.; validation, M.K. and A.J.; formal analysis, M.K. and R.P.; investigation, M.K. and A.J.; resources, R.P.; data curation, M.K.; writing—original draft preparation, M.K.; writing—review and editing, R.P. and A.J.; visualization, M.K. and A.J.; supervision, R.P.; project administration, R.P. All authors have read and agreed to the published version of the manuscript.

Funding

The article was written as part of the implementation of the university research grant No. 22-769 of the Military University of Technology.

Institutional Review Board Statement

Not applicable.

Informed Consent Statement

Not applicable.

Data Availability Statement

Data is unavailable due to privacy restrictions.

Acknowledgments

The authors would like to thank Pawel Bogusz from the Institute of Mechanics and Computational Engineering of the Military University of Technology for his help in conducting material tests on 41Cr4 steel.

Conflicts of Interest

The authors declare no conflict of interest.

References

  1. Miller, E.; Distler, M. Mass Casualty Explosives Attacks in Iraq and Afghanistan; START: College Park, MD, USA, 2017. [Google Scholar]
  2. Taylor, G. The Pressure and Impulse of Submarine Explosion Waves on Plates. Sci. Pap. G Taylor 1941, III, 287–303. [Google Scholar]
  3. Cole, R. Underwater Explosions; Princeton University Press: Princeton, NJ, USA, 1948. [Google Scholar]
  4. Kambouchev, N.; Noels, L.; Radovitzky, R. Nonlinear Compressibility Effects in Fluid-Structure Interaction and Their Implications on the Air-Blast Loading of Structures. J. Appl. Phys. 2006, 100, 063519. [Google Scholar] [CrossRef]
  5. Hutchinson, J.W. Energy and Momentum Transfer in Air Shocks. J. Appl. Mech. 2009, 76, 051307. [Google Scholar] [CrossRef]
  6. Wang, E.; Wright, J.; Shukla, A. Analytical and Experimental Study on the Fluid Structure Interaction during Air Blast Loading. J. Appl. Phys. 2011, 110, 114901. [Google Scholar] [CrossRef]
  7. Dharmasena, K.P.; Wadley, H.N.G.; Xue, Z.; Hutchinson, J.W. Mechanical Response of Metallic Honeycomb Sandwich Panel Structures to High-Intensity Dynamic Loading. Int. J. Impact Eng. 2008, 35, 1063–1074. [Google Scholar] [CrossRef]
  8. Xue, Z.; Hutchinson, J.W. A Comparative Study of Impulse-Resistant Metal Sandwich Plates. Int. J. Impact Eng. 2004, 30, 1283–1305. [Google Scholar] [CrossRef]
  9. Shen, J.; Lu, G.; Wang, Z.; Zhao, L. Experiments on Curved Sandwich Panels under Blast Loading. Int. J. Impact Eng. 2010, 37, 960–970. [Google Scholar] [CrossRef]
  10. Studziński, R.; Gajewski, T.; Malendowski, M.; Sumelka, W.; Al-Rifaie, H.; Peksa, P.; Sielicki, P.W. Blast Test and Failure Mechanisms of Soft-Core Sandwich Panels for Storage Halls Applications. Materials 2021, 14, 70. [Google Scholar] [CrossRef]
  11. Li, W.; Huang, G.; Bai, Y.; Dong, Y.; Feng, S. Dynamic Response of Spherical Sandwich Shells with Metallic Foam Core under External Air Blast Loading—Numerical Simulation. Compos. Struct. 2014, 116, 612–625. [Google Scholar] [CrossRef]
  12. Li, X.; Zhang, P.; Wang, Z.; Wu, G.; Zhao, L. Dynamic Behavior of Aluminum Honeycomb Sandwich Panels under Air Blast: Experiment and Numerical Analysis. Compos. Struct. 2014, 108, 1001–1008. [Google Scholar] [CrossRef]
  13. Cui, X.; Zhao, L.; Wang, Z.; Zhao, H.; Fang, D. Dynamic Response of Metallic Lattice Sandwich Structures to Impulsive Loading. Int. J. Impact Eng. 2012, 43, 1–5. [Google Scholar] [CrossRef]
  14. Barnat, W.; Dziewulski, P.; Niezgoda, T.; Panowicz, R. Application of Composites to Impact Energy Absorption. Comput. Mater. Sci. 2011, 50, 1233–1237. [Google Scholar] [CrossRef]
  15. Zhang, C.; Cheng, Y.; Zhang, P.; Duan, X.; Liu, J.; Li, Y. Numerical Investigation of the Response of I-Core Sandwich Panels Subjected to Combined Blast and Fragment Loading. Eng. Struct. 2017, 151, 459–471. [Google Scholar] [CrossRef]
  16. Dmitruk, A.; Naplocha, K.; Pach, J.; Pyka, D.; Ziółkowski, G.; Bocian, M.; Jamroziak, K. Experimental and Numerical Study of Ballistic Resistance of Composites Based on Sandwich Metallic Foams. Appl. Compos. Mater. 2021, 28, 2021–2044. [Google Scholar] [CrossRef]
  17. Ziętala, M.; Durejko, T.; Panowicz, R.; Konarzewski, M. Microstructure Evolution of 316L Steel Prepared with the Use of Additive and Conventional Methods and Subjected to Dynamic Loads: A Comparative Study. Materials 2020, 13, 4893. [Google Scholar] [CrossRef] [PubMed]
  18. Płatek, P.; Rajkowski, K.; Cieplak, K.; Sarzyński, M.; Małachowski, J.; Woźniak, R.; Janiszewski, J. Deformation Process of 3D Printed Structures Made from Flexible Material with Different Values of Relative Density. Polymers 2020, 12, 2120. [Google Scholar] [CrossRef]
  19. Dutkiewicz, J.; Rogal, Ł.; Kalita, D.; Węglowski, M.; Błacha, S.; Berent, K.; Czeppe, T.; Antolak-Dudka, A.; Durejko, T.; Czujko, T. Superelastic Effect in NiTi Alloys Manufactured Using Electron Beam and Focused Laser Rapid Manufacturing Methods. J. Mater. Eng. Perform. 2020, 29, 4463–4473. [Google Scholar] [CrossRef]
  20. Dutkiewicz, J.; Rogal, Ł.; Kalita, D.; Berent, K.; Antoszewski, B.; Danielewski, H.; Węglowski, M.S.; Łazińska, M.; Durejko, T.; Czujko, T. Microstructure and Properties of Inconel 625 Fabricated Using Two Types of Laser Metal Deposition Methods. Materials 2020, 13, 5050. [Google Scholar] [CrossRef] [PubMed]
  21. Antolak-Dudka, A.; Płatek, P.; Durejko, T.; Baranowski, P.; Małachowski, J.; Sarzyński, M.; Czujko, T. Static and Dynamic Loading Behavior of Ti6Al4V Honeycomb Structures Manufactured by Laser Engineered Net Shaping (LENSTM) Technology. Materials 2019, 12, 1225. [Google Scholar] [CrossRef]
  22. Novak, N.; Vesenjak, M.; Ren, Z. Crush Behaviour of Auxetic Cellular Structures. Spec. Issue Cell. Mater. 2018, 30, 4–7. [Google Scholar] [CrossRef]
  23. Qi, C.; Remennikov, A.; Pei, L.-Z.; Yang, S.; Yu, Z.-H.; Ngo, T.D. Impact and Close-in Blast Response of Auxetic Honeycomb-Cored Sandwich Panels: Experimental Tests and Numerical Simulations. Compos. Struct. 2017, 180, 161–178. [Google Scholar] [CrossRef]
  24. Deshpande, V.S.; McMeeking, R.M.; Wadley, H.N.G.; Evans, A.G. Constitutive Model for Predicting Dynamic Interactions between Soil Ejecta and Structural Panels. J. Mech. Phys. Solids 2009, 57, 1139–1164. [Google Scholar] [CrossRef]
  25. Dharmasena, K.P.; Wadley, H.N.G.; Liu, T.; Deshpande, V.S. The Dynamic Response of Edge Clamped Plates Loaded by Spherically Expanding Sand Shells. Int. J. Impact Eng. 2013, 62, 182–195. [Google Scholar] [CrossRef]
  26. Kyner, A.; Dharmasena, K.; Williams, K.; Deshpande, V.; Wadley, H. Response of Square Honeycomb Core Sandwich Panels to Granular Matter Impact. Int. J. Impact Eng. 2018, 117, 13–31. [Google Scholar] [CrossRef]
  27. Nurick, G.N.; Lockley, J.P. Experimental Investigation to Evaluate the Effect of the Included Angle of a Folded “V” Shape Plate for Blast Resistance. In Proceedings of the 1st International Conference on Integrity, Reliabaliry and Failure, Porto, Portugal, 19–22 July 1999. [Google Scholar]
  28. Chung Kim Yuen, S.; Langdon, G.S.; Nurick, G.N.; Pickering, E.G.; Balden, V.H. Response of V-Shape Plates to Localised Blast Load: Experiments and Numerical Simulation. Int. J. Impact Eng. 2012, 46, 97–109. [Google Scholar] [CrossRef]
  29. Zhao, X.; Shultis, G.; Hurley, R.; Sutton, M.; Fourney, W.; Leiste, U.; Deng, X. Small Scale Models Subjected to Buried Blast Loading Part I: Floorboard Accelerations and Related Passenger Injury Metrics with Protective Hulls. Exp. Mech. 2014, 54, 539–555. [Google Scholar] [CrossRef]
  30. Zhao, X.; Hurley, R.; Sutton, M.; Fourney, W.; Leiste, U.; Deng, X. Small Scale Models Subjected to Buried Blast Loading Part II: Frame Accelerations with Hulls and Additional Mitigation Methods. Exp. Mech. 2014, 54, 857–869. [Google Scholar] [CrossRef]
  31. Anderson, C.E.; Behner, T.; Weiss, C.E. Mine Blast Loading Experiments. Int. J. Impact Eng. 2011, 38, 697–706. [Google Scholar] [CrossRef]
  32. Markose, A.; Rao, C.L. Mechanical Response of V Shaped Plates under Blast Loading. Thin-Walled Struct. 2017, 115, 12–20. [Google Scholar] [CrossRef]
  33. Trajkovski, J.; Kunc, R.; Prebil, I. Blast Response of Centrally and Eccentrically Loaded Flat-, U-, and V-Shaped Armored Plates: Comparative Study. Shock. Waves 2017, 27, 583–591. [Google Scholar] [CrossRef]
  34. Li, Y.; Lv, Z.; Wang, Y. Blast Response of Aluminum Foam Sandwich Panel with Double V-Shaped Face Plate. Int. J. Impact Eng. 2020, 144, 103666. [Google Scholar] [CrossRef]
  35. Stanisławek, S.; Morka, A. On the Blast Mitigation Ability of Multiple V-Shape Deflectors. Shock. Vib. 2020, 2020, 8708974. [Google Scholar] [CrossRef]
  36. Erdik, A.; Uçar, V. On Evaluation and Comparison of Blast Loading Methods Used in Numerical Simulations. Sak. Üniversitesi Fen Bilim. Enstitüsü Derg. 2018, 22, 1385–1391. [Google Scholar] [CrossRef]
  37. Vannucci, P.; Masi, F.; Stefanou, I. A Study on the Simulation of Blast Actions on a Monument Structure. 2017. Available online: https://hal.science/hal-01447783v3/document (accessed on 10 February 2023).
  38. Souli, M.; Ouahsine, A.; Lewin, L. ALE Formulation for Fluid–Structure Interaction Problems. Comput. Methods Appl. Mech. Eng. 2000, 190, 659–675. [Google Scholar] [CrossRef]
  39. Jin, S.Y.; Majumder, A.; Altenhof, W.; Green, D. Axial Cutting of AA6061-T6 Circular Extrusions under Impact Using Single-and Dual-Cutter Configurations. Int. J. Impact Eng. 2010, 37, 735–753. [Google Scholar] [CrossRef]
  40. Johnson, G.R. A Constitutive Model and Data for Materials Subjected to Large Strains, High Strain Rates, and High Temperatures. In Proceedings of the 7th International Symposium on Ballistics, The Hague, the Netherlands, 19–21 April 1983; pp. 541–547. [Google Scholar]
  41. Ludwik, P. Elemente Der Technologischen Mechanik; Springer: Berlin/Heidelberg, Germany, 1909. [Google Scholar]
  42. Wuertemberger, L.; Palazotto, A.N. Evaluation of Flow and Failure Properties of Treated 4130 Steel. J. Dyn. Behav. Mater. 2016, 2, 207–222. [Google Scholar] [CrossRef]
  43. Zhang, D.-N.; Shangguan, Q.-Q.; Xie, C.-J.; Liu, F. A Modified Johnson–Cook Model of Dynamic Tensile Behaviors for 7075-T6 Aluminum Alloy. J. Alloys Compd. 2015, 619, 186–194. [Google Scholar] [CrossRef]
  44. Tao, Z.; Fan, X.; He, Y.; Jun, M.; Heng, L. A Modified Johnson–Cook Model for NC Warm Bending of Large Diameter Thin-Walled Ti–6Al–4V Tube in Wide Ranges of Strain Rates and Temperatures. Trans. Nonferrous Met. Soc. China 2018, 28, 298–308. [Google Scholar] [CrossRef]
  45. Hallquist, J. LS-DYNA Theory Manual 680; Livermore Software Technology Corporation: Livermore, CA, USA, 2005. [Google Scholar]
  46. Włodarczyk, E. Wstęp Do Mechaniki Wybuchu; Polish Wydawnictwo Naukowe PWN: Warsaw, Poland, 1994. [Google Scholar]
  47. Zhang, G. Experimental Study on Shock Wave Propagation of the Explosion in a Pipe with Holes by High-Speed Schlieren Method. Shock. Vib. 2020, 2020, 8850443. [Google Scholar] [CrossRef]
  48. Bae, D.-M.; Zakki, A.F. Comparisons of Multi Material ALE and Single Material ALE in LS-DYNA for Estimation of Acceleration Response of Free-Fall Lifeboat. J. Soc. Nav. Archit. Korea 2011, 48, 552–559. [Google Scholar] [CrossRef]
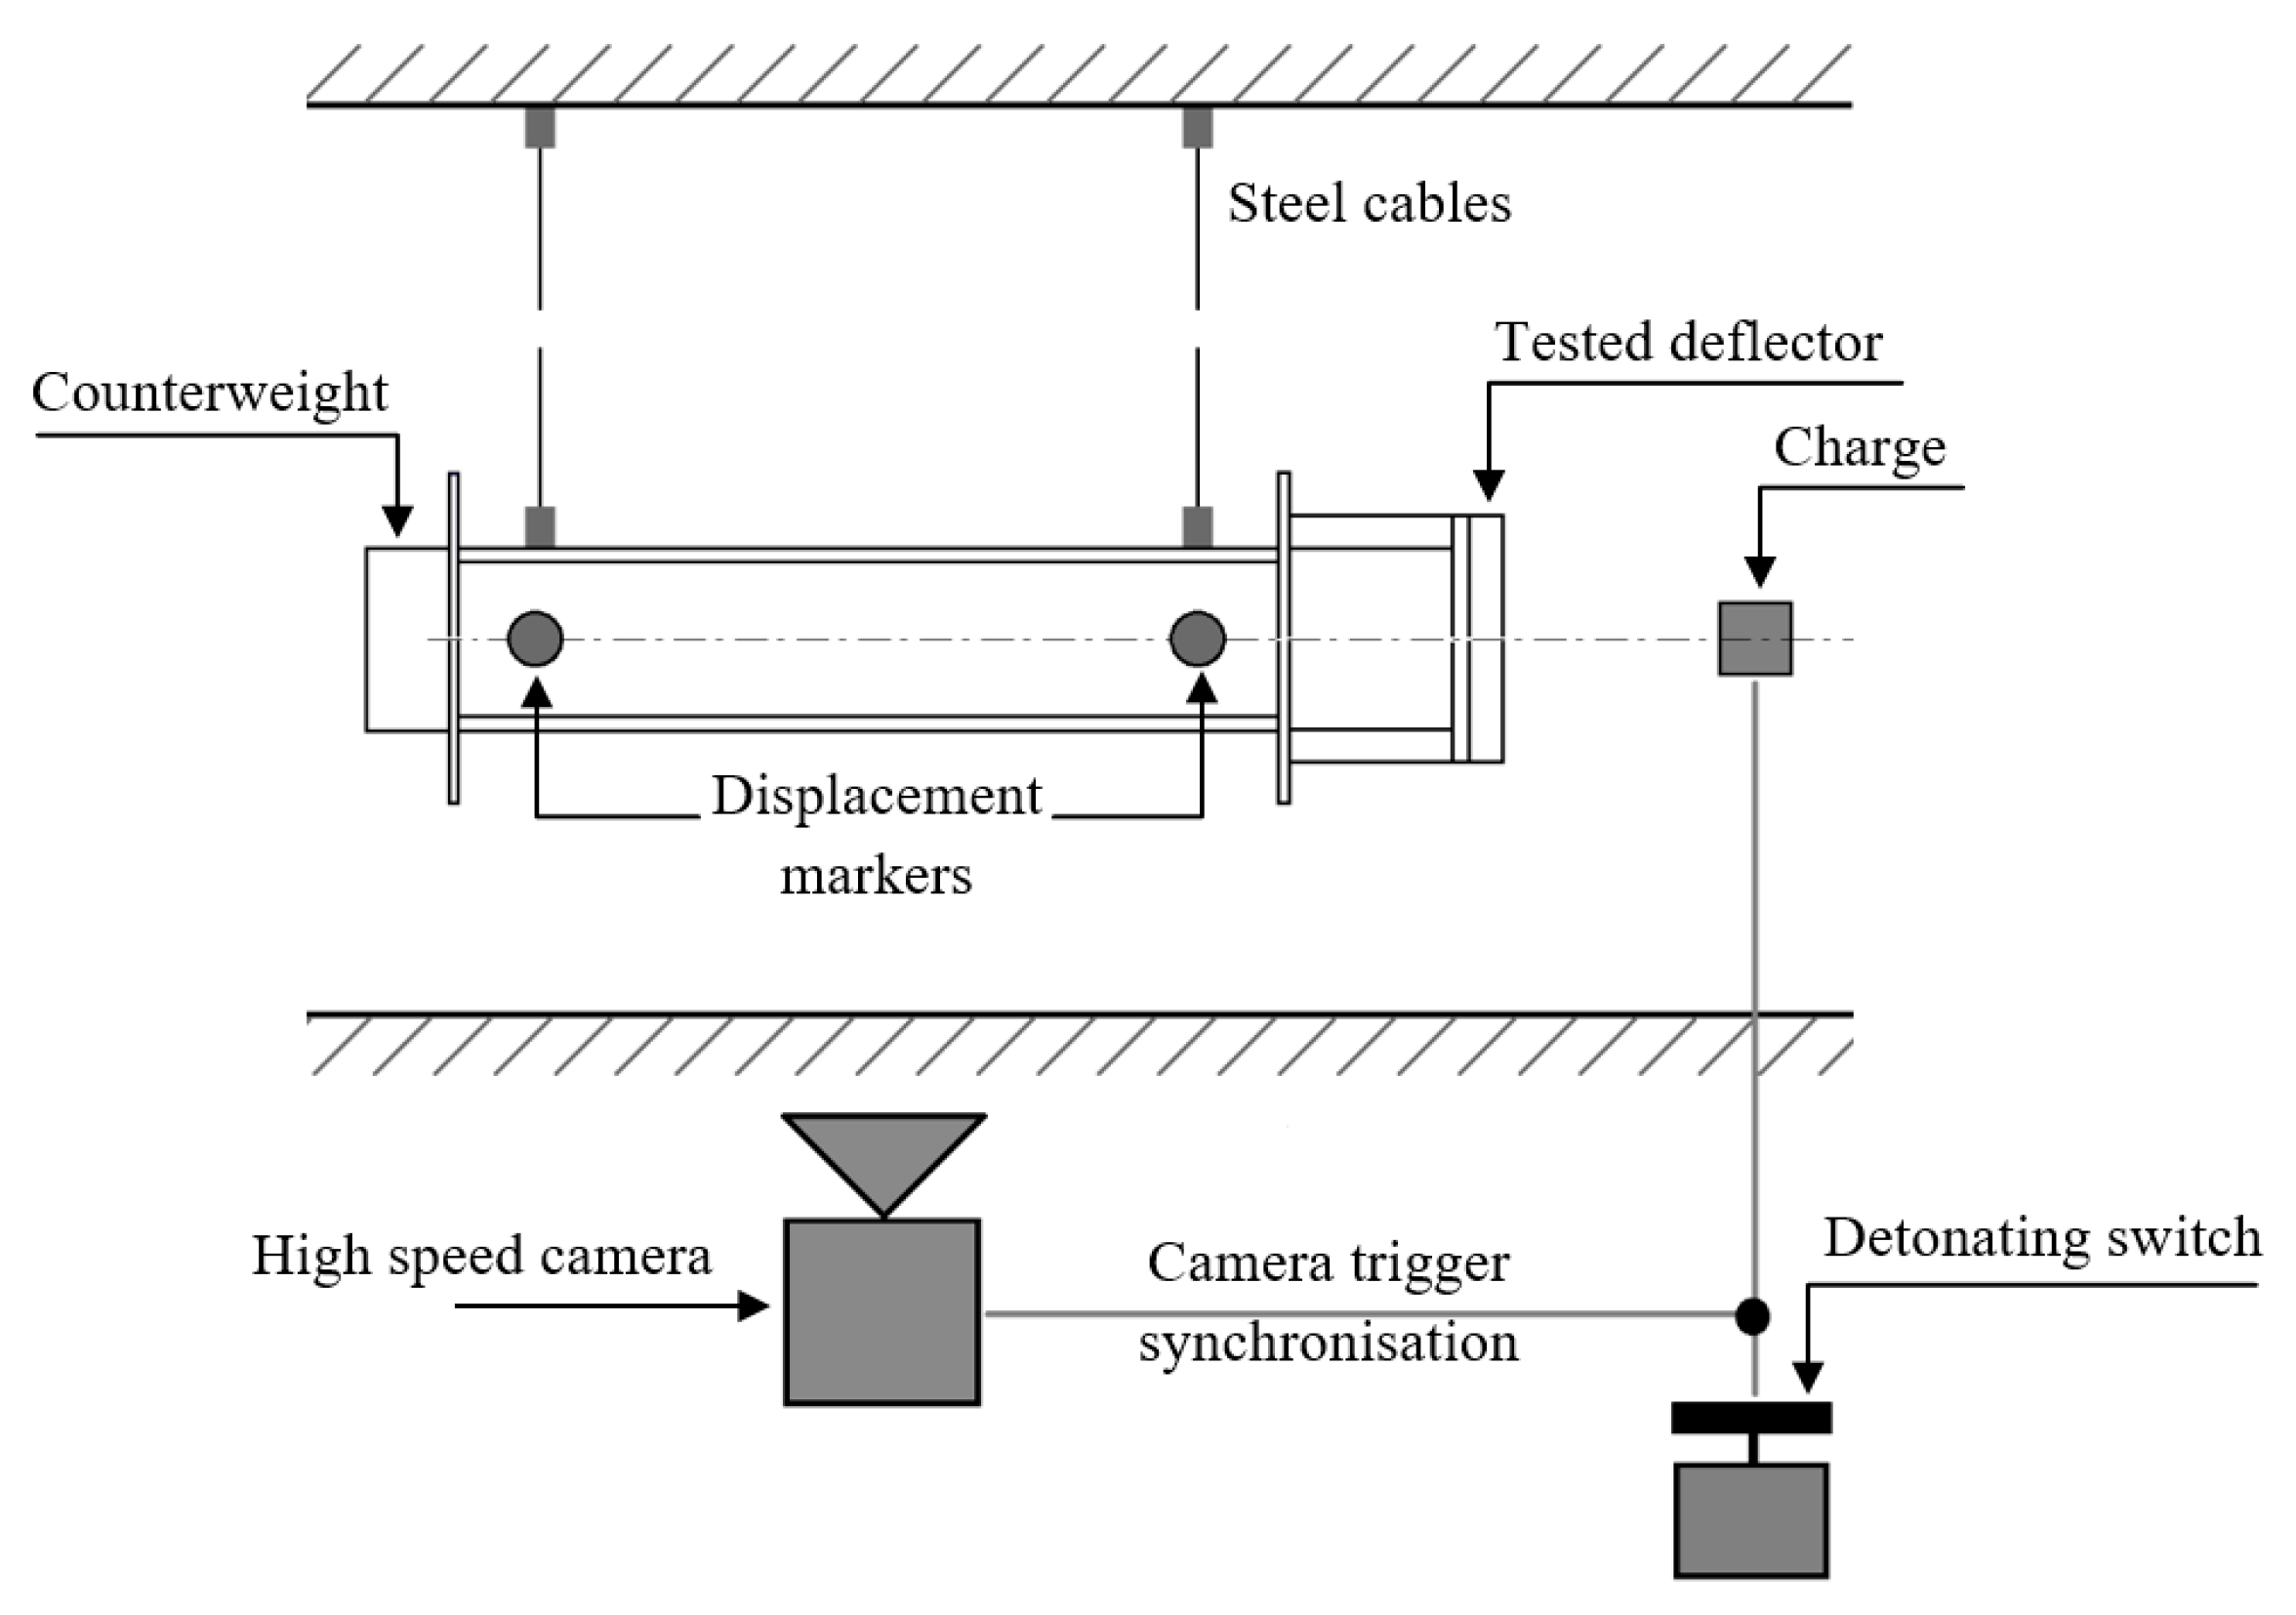
Figure 1. Schematic of the experimental setup.
Applsci 13 06752 g001
Figure 2. Test stand design (a); fabricated test stand (b).
Applsci 13 06752 g002
Figure 3. Explosive charges prepared for testing.
Applsci 13 06752 g003
Figure 4. Systems selected for testing; (a) double-bend; (b) semi-spherical.
Applsci 13 06752 g004
Figure 5. Specimens used for material testing.
Applsci 13 06752 g005
Figure 6. Engineering stress–strain curve of 41Cr4 steel obtained from quasi-static tensile testing.
Applsci 13 06752 g006
Figure 7. Numerical model of the ballistic pendulum with mounted energy deflector. 1—Steel ropes; 2—pendulum; 3—counterweight; 4—front plate; 5—spacers; 6—mounting plate; 7—deflector.
Applsci 13 06752 g007
Figure 8. Pendulum with modelled air domain.
Applsci 13 06752 g008
Figure 9. Results of the Johnson–Cook material curve fitting.
Applsci 13 06752 g009
Figure 10. Non-reflecting boundaries of the air domain.
Applsci 13 06752 g010
Figure 11. Comparison of the double-bend deflectors’ geometries with constant B-dimension. (a) Double-bend 80-15; (b) Double-bend 80-45.
Applsci 13 06752 g011
Figure 12. Comparison of the double-bend deflectors’ geometries with constant A-dimension. (a) Double-bend 60-15; (b) Double-bend 130-15.
Applsci 13 06752 g012
Figure 13. Comparison of the semi-spherical deflectors’ geometries. (a) Semi-spherical 10; (b) Semi-spherical 50.
Applsci 13 06752 g013
Figure 14. Swing of the ballistic pendulum for 50 g explosive charge and 30 cm stand-off (solid line—experiment, dashed line—FEM results).
Applsci 13 06752 g014
Figure 15. Swing of the pendulum—double-bend deflector with constant B-dimension. (a) Stand-of of 30 cm; (b) Stand-off of 40 cm; (c) Stand-off of 50 cm.
Applsci 13 06752 g015aApplsci 13 06752 g015b
Figure 16. Swing of the pendulum—double-bend deflector with constant A-dimension. (a) Stand-off of 30 cm; (b) Stand-off of 40 cm; (c) Stand-off of 50 cm.
Applsci 13 06752 g016aApplsci 13 06752 g016b
Figure 17. Change of the maximum pendulum swing in the function of the stand-off distance; (a) constant A-dimension; (b) constant B-dimension.
Applsci 13 06752 g017
Figure 18. Change of the maximum pendulum swing for the double-bend deflector in the function of the: (a) A-dimension; (b) B-dimension.
Applsci 13 06752 g018
Figure 19. Swing of the pendulum—60-series double-bend deflector with constant B-dimension. (a) Stand-off of 30 cm; (b) Stand-off of 40 cm; (c) Stand-off of 50 cm.
Applsci 13 06752 g019
Figure 20. Change of the maximum pendulum swing in the: (a) function of the stand-off distance; (b) function of the B-size for the 60-series (solid line) and 80-series (dashed line) double-bend deflectors.
Applsci 13 06752 g020
Figure 21. Swing of the pendulum—semi-spherical deflector. (a) Stand-off of 30 cm; (b) Stand-off of 40 cm; (c) Stand-off of 50 cm.
Applsci 13 06752 g021aApplsci 13 06752 g021b
Figure 22. Change of the maximum pendulum swing in the function of the: (a) stand-off distance; (b) deflector radius.
Applsci 13 06752 g022aApplsci 13 06752 g022b
Figure 23. Comparison of the best variants for both double-bend and semi-spherical deflectors. V-shaped deflector added as reference.
Applsci 13 06752 g023
Table 1. Summary of quasi-static test results for 41Cr4 material.
Rupture
[MPa]
Yield Strength [MPa]Ultimate Strength [MPa]Strain at
Failure
[-]
Young’s
Modulus [GPa]
Poisson’s
Ratio
[-]
536.7353.3623.20.308209.60.307
Table 2. Johnson–Cook material constants.
ParameterDescriptionUnitValue
ρ Densityg/cm37.89
EYoung’s modulusMPa209,600
υPoisson’s coefficient-0.307
A Material constantMPa14
B Material constantMPa1214
n Material constant-0.28
C Material constant-0.0936
ε f Plastic strain at the failure-0.308
Table 3. Material properties of the Semtex A1 explosive charge [44].
ParameterDescriptionUnitValue
ρ Densitykg/mm31.42 × 10−6
DDetonation velocitymm/ms7200
PCJC-J pressureGPa28
AExplosive charge constantGPa609
BExplosive charge constantGPa12.95
R1Explosive charge constant-4.5
R2Explosive charge constant-1.4
ωExplosive charge constant-0.25
Table 4. Equation of state parameters for air [46].
ParameterDescriptionUnitValue
ρ Densitykg/mm31.2 × 10−9
C4Constant-0.4
C5Constant-0.4
Table 5. Comparison of experimental and numerical results.
Deflector TypePendulum Swing—Experiment [mm]Pendulum Swing—Numerical [mm]Difference [%]
Double-bend 100-1562.7958.626.64
Semi-spherical 5057.9154.665.61
Table 6. Values of the pendulum’s maximum swing for all double-bend deflector sizes.
Max. Swing of the Pendulum [mm]
Deflector Size30 cm Stand-Off40 cm Stand-Off50 cm Stand-Off
60-1554.5451.0245.95
70-1556.2351.7847.03
80-1557.4752.9947.83
90-1558.2953.3348.38
100-1558.6253.4948.91
110-1558.7753.9749.71
120-1559.1454.2550.28
130-1558.9354.5550.47
80-1557.4752.9947.83
80-2056.3251.8247.10
80-2555.0251.2046.43
80-3052.9650.3145.91
80-3552.4748.9344.21
80-4050.7248.1543.67
80-4548.4547.3842.79
Table 7. Values of the pendulum maximum swing for all double-bend deflector sizes.
Max. Swing of the Pendulum [mm]
Deflector Size30 cm Stand-Off40 cm Stand-Off50 cm Stand-Off
60-1554.5451.0245.95
60-2053.7549.4345.26
60-2551.4648.3444.46
60-3051.5847.9843.28
60-3550.8246.9142.58
60-4048.9646.4842.51
60-4549.0345.8441.84
Table 8. Values of the pendulum maximum swing for all semi-spherical deflector sizes.
Max. Swing of the Pendulum [mm]
Deflector Size30 cm Stand-Off40 cm Stand-Off50 cm Stand-Off
1059.0454.3151.34
1558.6954.4650.65
2058.1954.5249.95
2558.6253.7649.57
3057.6953.4649.03
3556.7752.9748.31
4057.1552.0147.79
4556.0551.3747.07
5054.6650.7346.19
Disclaimer/Publisher’s Note: The statements, opinions and data contained in all publications are solely those of the individual author(s) and contributor(s) and not of MDPI and/or the editor(s). MDPI and/or the editor(s) disclaim responsibility for any injury to people or property resulting from any ideas, methods, instructions or products referred to in the content.