1. Introduction
The six-sigma improvement method was initiated by Motorola in 1986 [
1,
2,
3,
4]. The six-sigma DMAIC process means that the industry follows (1) define, (2) measure, (3) analyze, (4) improve, and (5) control to make improvements on the workflow of process quality [
5,
6,
7]. The six-sigma method has been actively promoted by numerous companies, including General Electric Company in America, American Ford Motor Company in America, and Asustek Computer Incorporation in Taiwan. Its purpose is to help advance process quality to a six-sigma quality level via the DMAIC process.
In addition, the process capability index is a tool which the industry most commonly employs to measure process quality. It is not only a criterion for process engineers to judge the process quality and decide whether to make improvements, but it is also a good communication tool [
8,
9,
10] for the sales department and customers. In a large number of studies, the process capability index has been drawn into the process capability analysis chart. Not only can this process capability analysis chart measure the process quality, but it also can analyze whether the process defect is caused by excessive process variation or process deviation, providing engineers with suggestions and directions for process improvement [
11,
12]. Therefore, many studies have applied the process capability index to the process capability analysis chart as one of the tools which promote the improvement process of the six-sigma DMAIC method [
13,
14,
15].
Numerous studies have indicated that Taiwan’s electronics industry has a complete ecological chain of the electronics industry in the global supply chain system of information and communication technology and that it has also taken up an important position in the world [
16,
17]. The Taiwanese electronics industry includes wafer foundries, IC packaging and testing, and the output value of various system terminal products—such as smart phones, various computers, and home appliances—and ranks among the best in the world. These various types of computers, home appliances, and even large-scale processing machines must have transistors so they can function smoothly. Therefore, the quality of transistors is directly related to the quality of these products. In order to make the assembly of transistors smooth, ensure smooth operation after assembly, and maintain long service life, transistor gaskets play an important role. Although their unit price is not high, they have become indispensable and important spare parts. When the quality of transistor gaskets is poor, it is easy to cause poor quality when they are assembled with transistors.
The above-mentioned types of computers, home appliances, and large-scale processing machinery are prone to short-circuit damage under long-term operation. Not only the operation of the above-mentioned products will be interrupted, causing various cost losses. Therefore, the research purpose of this paper is to improve the process quality level of transistor spacers by adopting the above-mentioned Six Sigma DMAIC method improvement process. To achieve the goal of reducing the above cost losses, including (1) economic losses caused by maintenance [
18], (2) failure of large-scale processing machinery to reduce production capacity, which may lead to economic losses caused by failure to deliver on schedule [
19], (3) environmental pollution caused by maintenance during transportation and social losses, increasing carbon emissions [
20,
21].
As mentioned above, the process capability index is the tool most frequently applied to the measurement of process quality in the industry. Kane [
22] proposed the process capability index
, which is the most widely applied tool for process quality evaluation in the manufacturing industry at present. Boyles [
23] suggested that the unequal relationship between the process index
and the process yield is
, where
is the standard normal cumulative distribution function (CDF). When the value of process index
is larger, the process yield is also higher; on the contrary, when the value of process index
is smaller, the process yield is also lower. Based on what was stated above, this paper adopts the process capability index
as the definition tool in the first step of the six-sigma improvement process. Next, the process index
is employed to draw the multi-characteristic process capability analysis chart (MPCAC) as the tool of process capability measurement in the second step and the tool of process analysis in the third step. Additionally, testing the orthogonal table in the Taguchi method can help process engineers determine the optimal combination of machining parameters to improve or enhance the process quality level of quality characteristics with fewer times of experiments and lower cost of experiments. Consequently, this paper adopts the testing of the orthogonal table in the Taguchi method as the tool of process improvement in the fourth step of
Section 3. Finally, according to the improved optimal combination of machining parameters in the fourth step, a standard operating procedure for transistor gaskets is established as the tool of process control. This paper and some studies adopts the six sigma DMAIC method improvement process [
24,
25], but the difference is that in the measurement and analysis steps, the process capability index commonly used in the industry is combined to develop the MPCAC and establishes an evaluation rule using the confidence interval, which not only facilitates the process engineers in the measurement and analysis steps but also can grasp the status of each quality characteristic at the same time and grasp the direction of improvement at the same time. In addition, the risk of misjudgment due to sampling error can be reduced.
A transistor gasket has five important quality characteristics: diameter, aperture, height, spacing, and eccentricity. Hence, this paper directly takes the transistor gaskets that contain these five important quality characteristics as a case to explain how to construct the above-mentioned improvement process of six-sigma DMAIC method as well as how to employ this process to raise the process quality level of transistor gaskets. After the Introduction,
Section 2 introduces the steps of the DMAIC improvement process: define, measure, analyze, improve, and control. In
Section 3, a practical example is taken to explain the improvement process of the six-sigma DMAIC method proposed in this paper so it can be provided to related industries for reference. Conclusions are made in
Section 4. Lastly, research limitations are in
Section 5.
2. Research Methods
Many studies have pointed out that several important quality characteristics usually exist in a product after the machining process [
26,
27,
28]. As mentioned above, a transistor gasket includes five important quality characteristics: diameter, aperture, height, spacing, and eccentricity. Only when the process quality of these five important quality characteristics meets the required quality level can the process quality of transistor gaskets be ensured to satisfy customer demand. Transistor gaskets can fulfill their own function only after being assembled with transistors and heat sinks. Their function is to block electric current contacts between transistors and heat sinks so as to avoid losses caused by short circuits when the machine is running. In order to solve this problem, this paper used the above improvement process of six-sigma DMAIC method to enhance the process quality level of transistor gaskets. As mentioned earlier, the process capability index
is currently the process quality evaluation tool most widely used by the manufacturing industry. It has an unequal relationship with process yield. The larger the value of index
, the higher the process yield. Therefore, this paper used index
as the definition tool in the first step of the improvement process and employed index
to draw the process capability analysis chart, which is regarded as the measurement tool in the second step and the analysis tool in the third step. The next fourth step is to use the Taguchi test to improve the product process capability and find the best combination of production parameters as the control basis.
2.1. Define
Firstly, this paper summarizes the target values, tolerance specifications, inspection equipment, and units of the five important quality characteristics of the above-mentioned transistor gasket in
Table 1 below.
Let the random variable
present the process distribution of the
hth quality characteristic. Then, the process mean is
and the process standard is
—that is,
,
h = 1, 2, 3, 4, 5. Let random variable
=
. Then, random variable
, accuracy index
, precision index
, and capability index
are shown in
Table 2.
Based on
Table 2 and some study, the entire process capability index of transistor gaskets (
) can be expressed as follows:
If the value of the process capability index for each quality characteristic is required to be at least
C , then
. In other words, if we require that the value of the entire process capability index
should be at least
, then it is equivalent to requiring that the value of the process capability index
for each quality characteristic should be at least C, where
Obviously, when we develop a six-sigma DMAIC process quality improvement model for the processing process of the product containing multiple quality characteristics, we hope that the process quality of transistor gaskets can meet the quality level at 6 sigma (
), i.e.,
. Therefore, define in Step 1 is leveling the
value of the five important quality characteristics up to at least
C, where
2.2. Measure
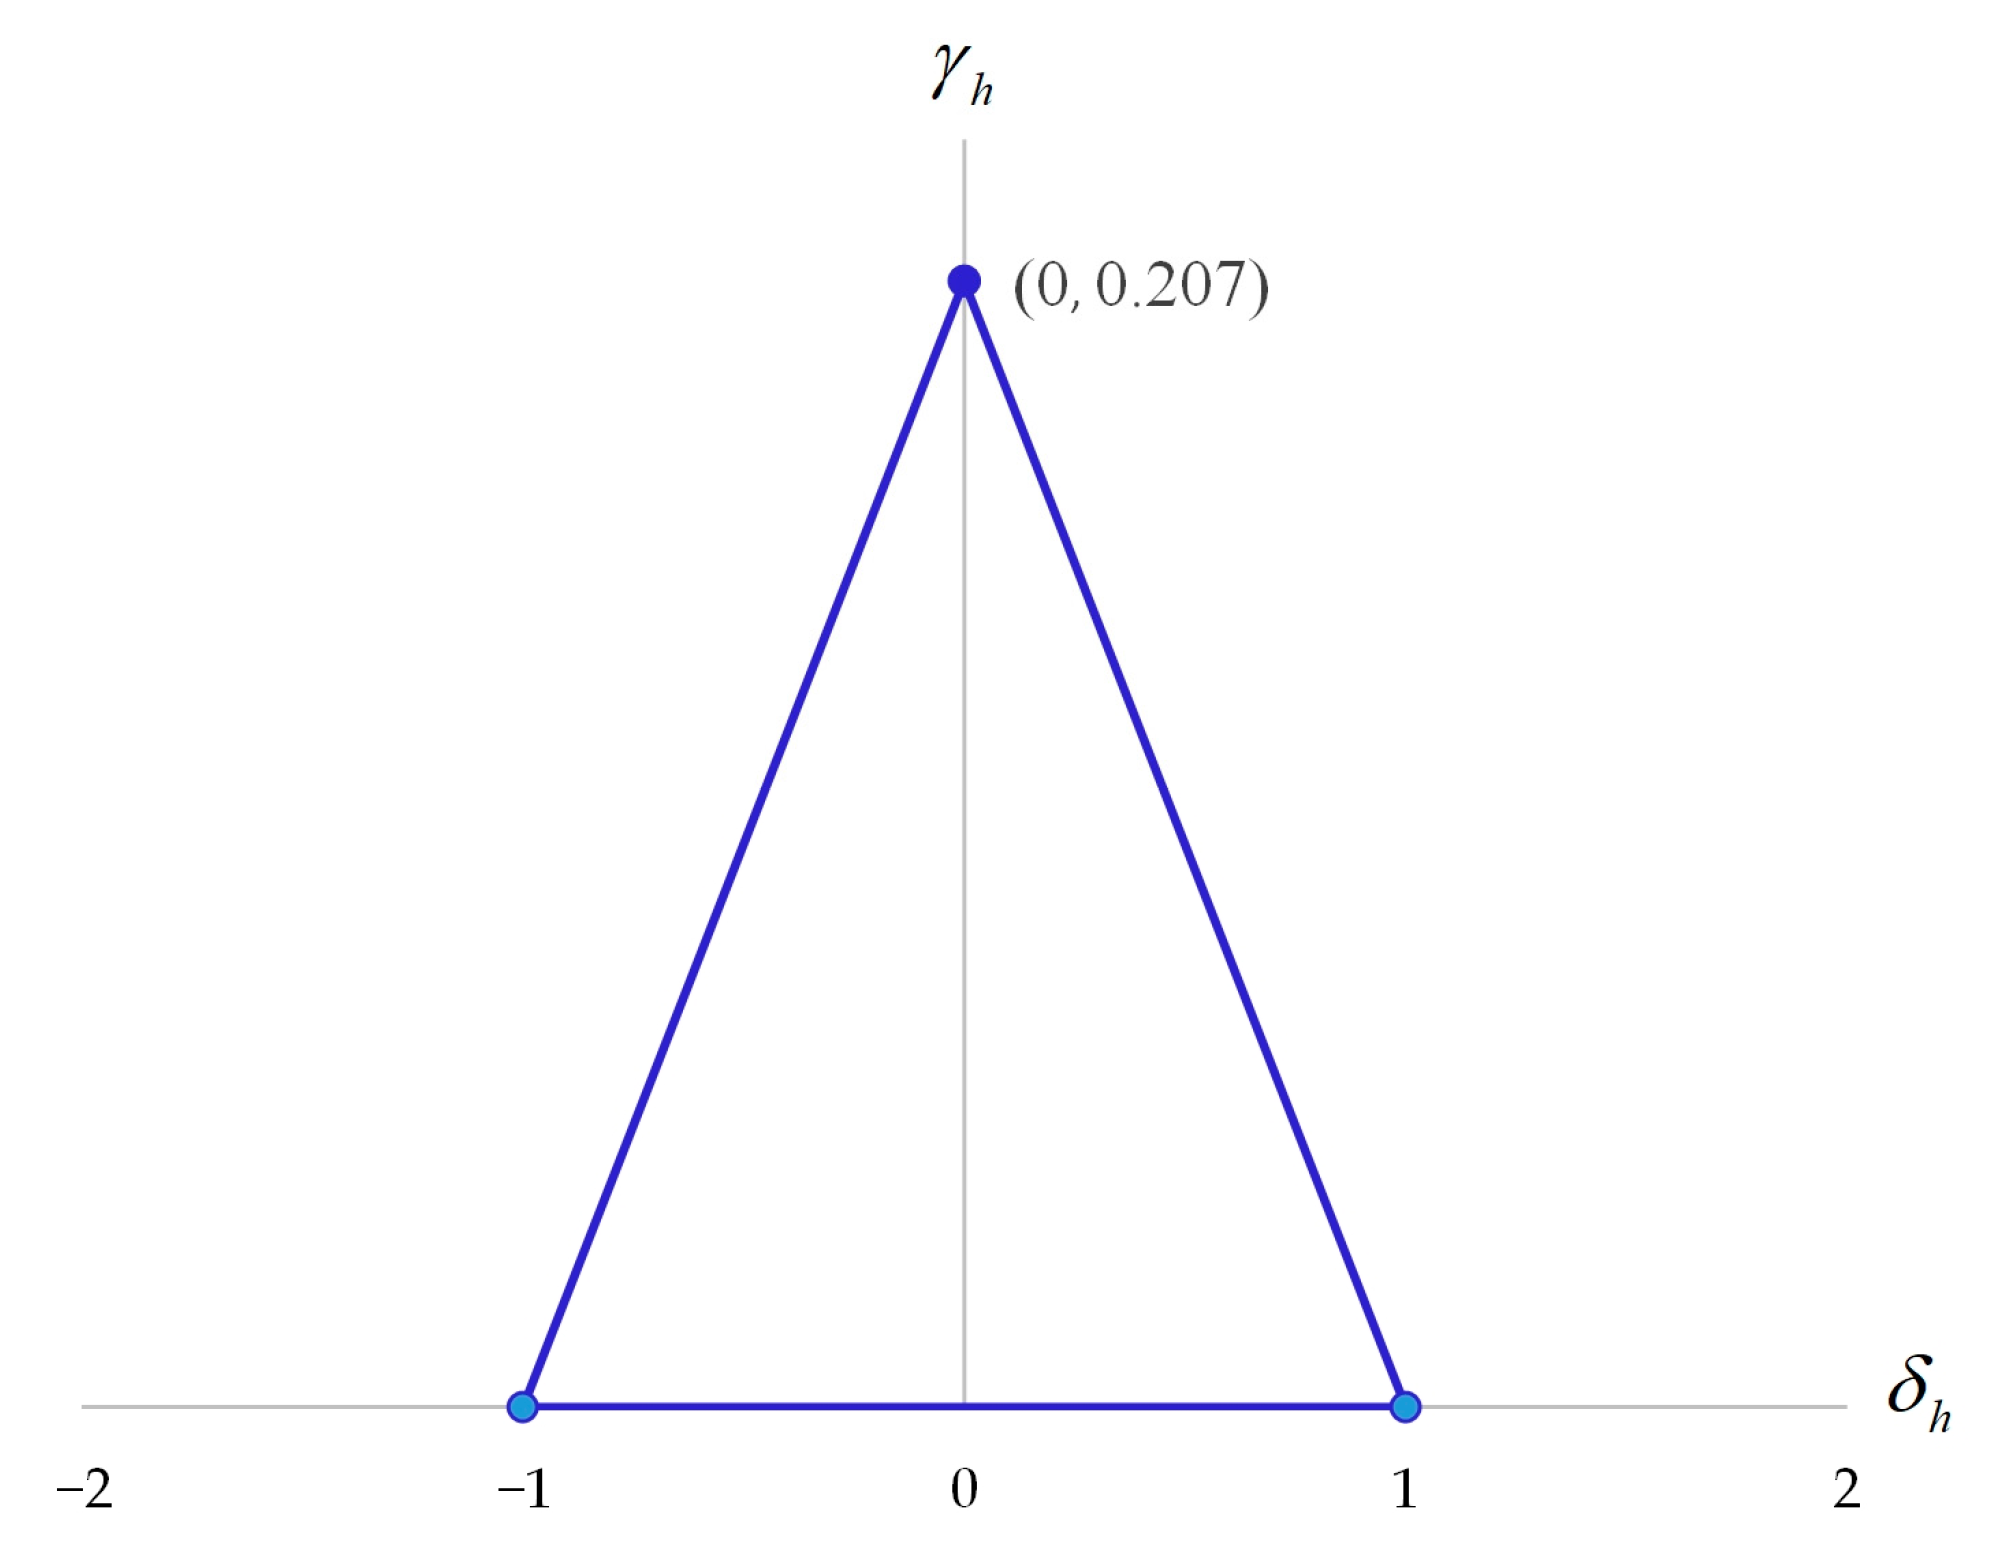
Next, in this paper, we built a MPCAC for transistor gaskets using
as the x-axis and
as the y-axis to simultaneously measure the process capabilities of the five important quality characteristics of transistor gaskets. First, let
1.61,
, and
,
. Then, the process capability acceptance zone
A is expressed in the following equation:
Furthermore, the MPCAC of transistor gaskets is displayed in
Figure 1 below:
This paper derived the 100(
)% joint confidence region of index
and index
based on sample data. Let
be a random sample from quality characteristic
h. Then the estimators of
and
can be expressed as follows:
Considering normality, let
and
; then,
T is distributed as
t-distribution with
n − 1 degree of freedom, denoted by
, and
K is distributed as chi-square distribution with
n − 1 degree of freedom, denoted by
. Therefore,
where
and
is the upper
quintile of
. Similarly,
where
is the lower
quintile of
and
is the lower
quintile of
. To derive the 100(
)% joint confidence region of index
and index
, this paper defines
and
, where
In fact,
and
. On the basis of Boole’s inequality and DeMorgan’s rules, we have
. Therefore, the 100(
)% joint confidence region of index
and index
is exhibited as:
In fact, the 100(
)% joint confidence region CR is a rectangle, and the coordinate points of the four corners of the rectangle are expressed as follows:
Based on the concept of Yu et al. [
13], the coordinate point corresponding to the upper confidence limit of process capability index
is the measurement coordinate point
,
as follows:
Then, based on the location of the coordinate point, the process quality of quality characteristic h is measured, and the measurement rules are listed as follows:
When A, then the value of process capability index is larger than 1.61, and the quality level of quality characteristic h reaches six-sigma.
When A, the value of process capability index is smaller than 1.61, and the quality level of quality characteristic h does not attain six-sigma. Thus, the process quality of quality characteristic h must be boosted. This paper calls this quality characteristic critical to quality, CTQ.
2.3. Analyze
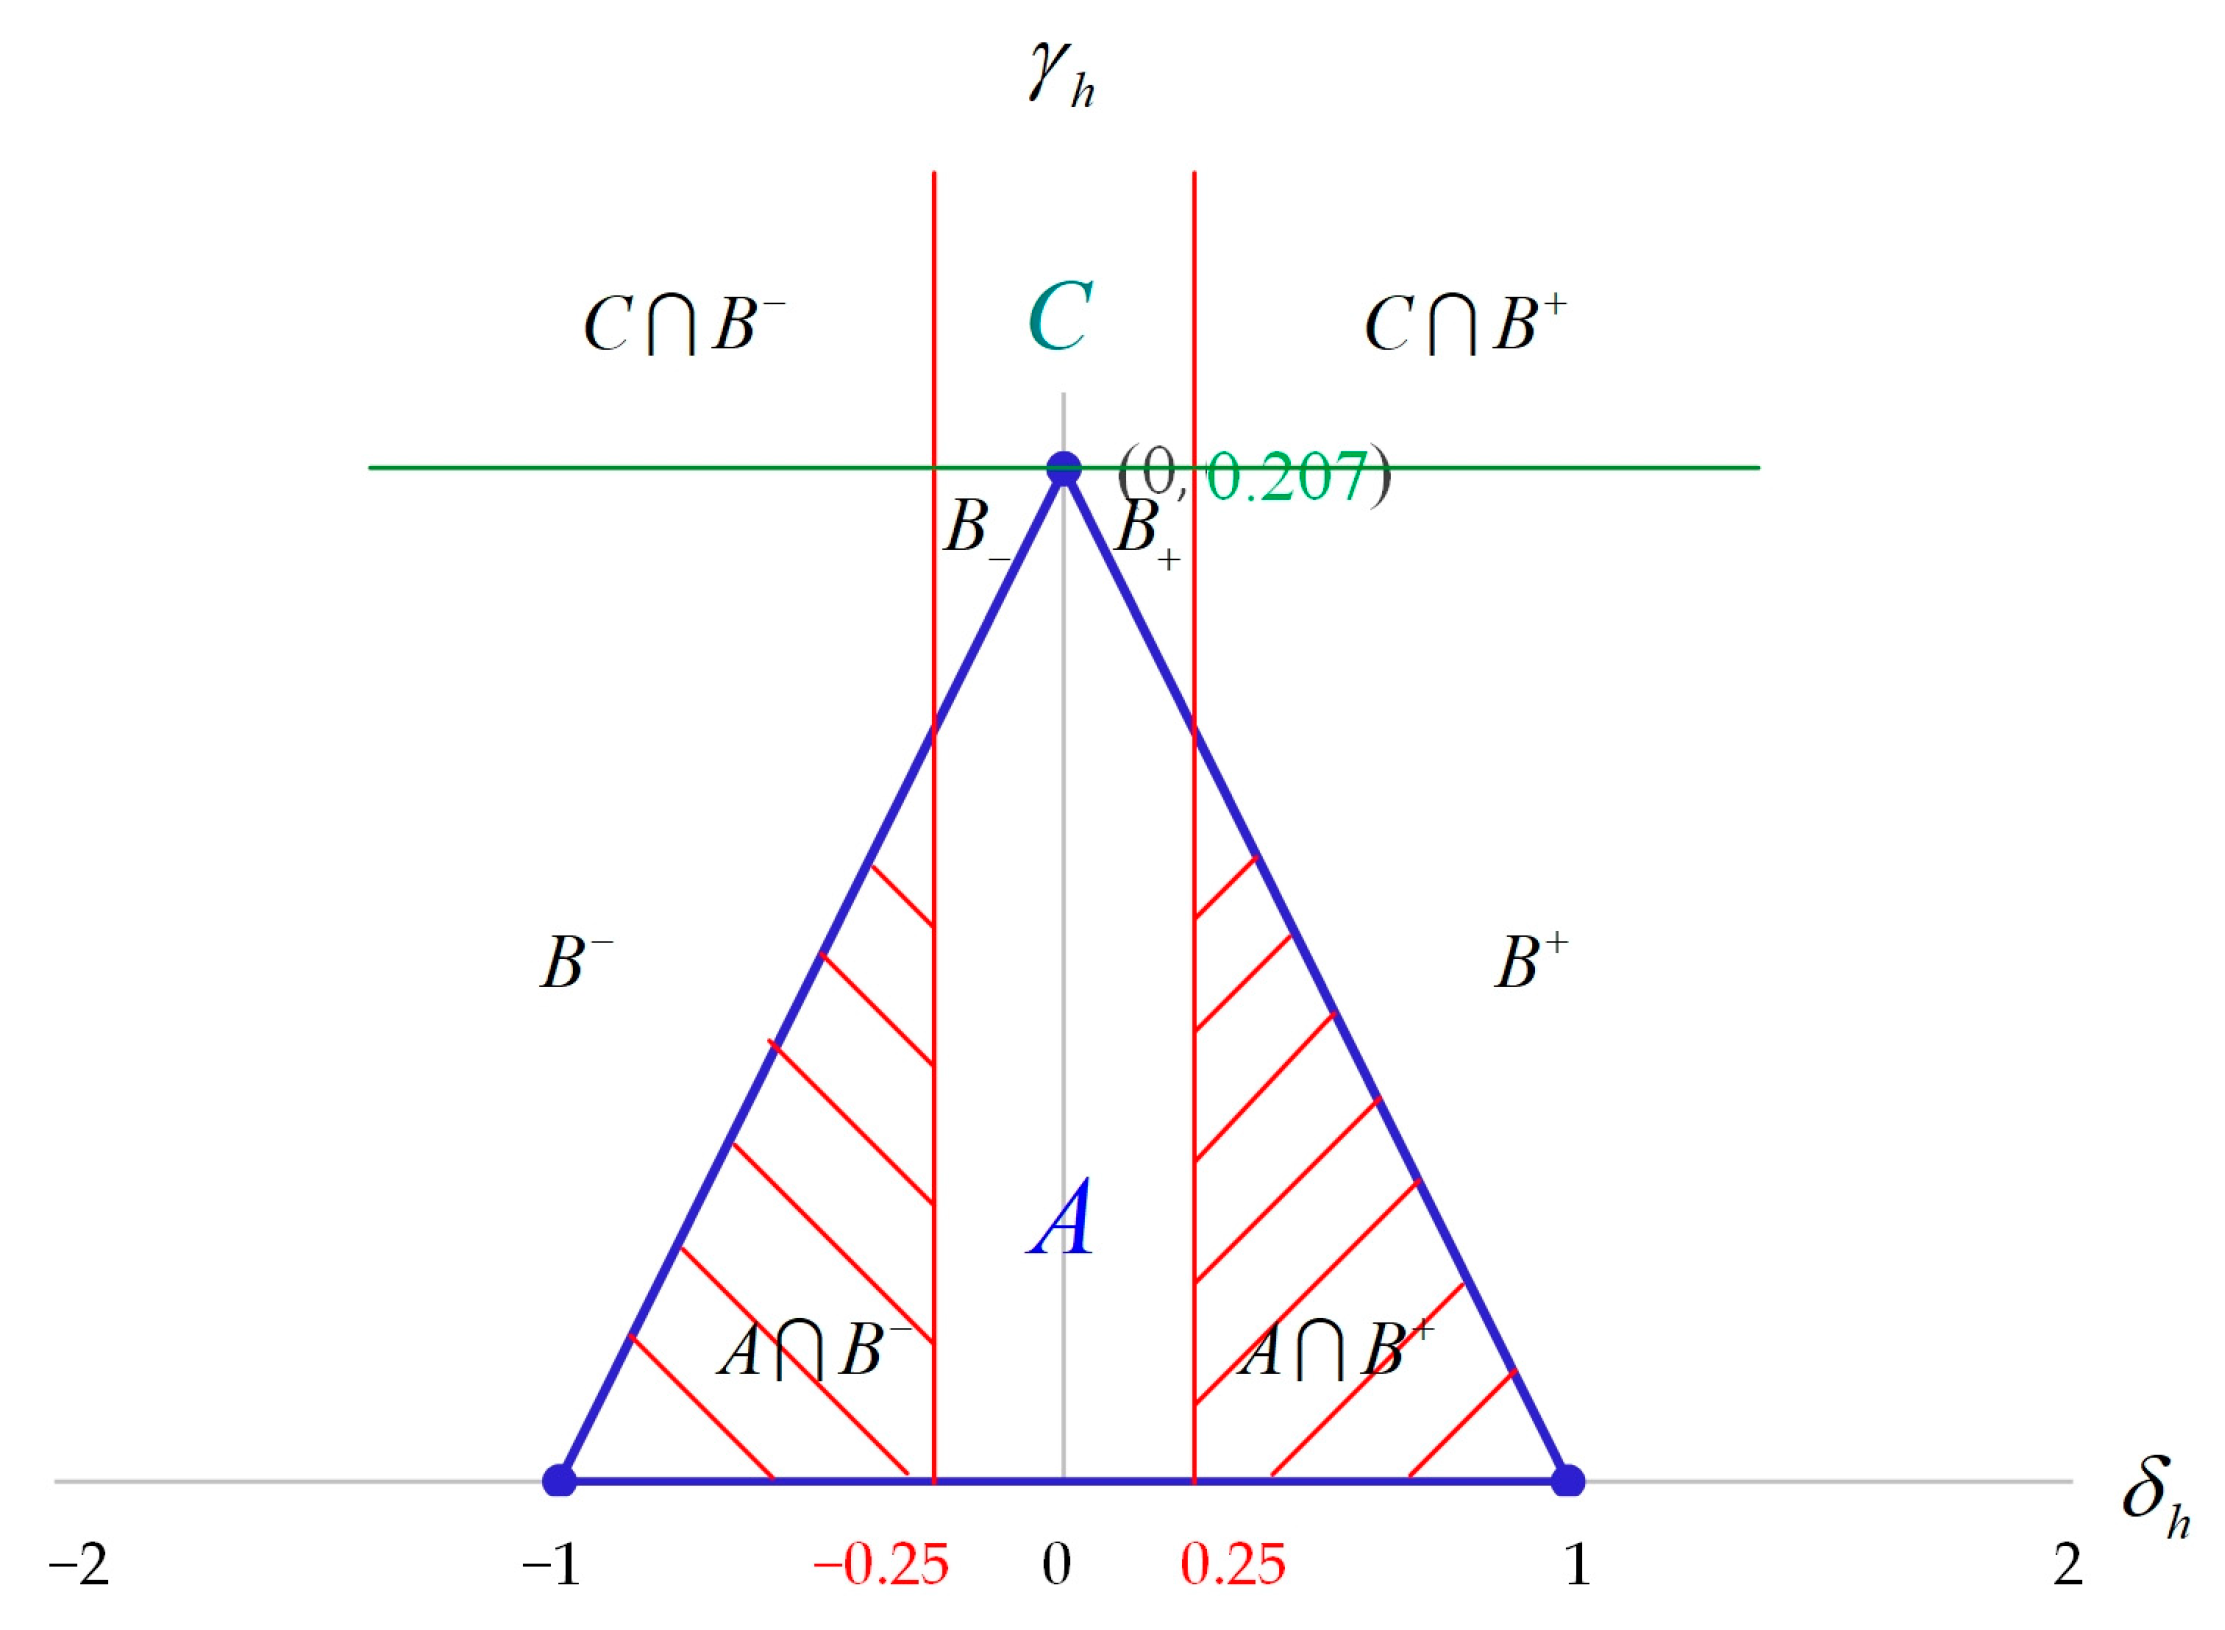
Obviously, based on the MPCAC of transistor gaskets, this paper could easily discover the CTQ characteristics which need to be ameliorated. Next, this paper defined seven blocks of process capability improvement (
,
,
,
,
,
,
) and two blocks of process capability enhancement (
and
) in the MPCAC of transistor gaskets as follows:
The horizontal axis of MPCAC is the accuracy index , and the vertical axis is the precision index . Obviously, the upper part of the analysis chart is area C, the process variation is large, and the process variation must be reduced to improve the process accuracy. The left side of the analysis chart is the B− area. The process is right-biased, and the average number of the system must be moderately reduced to improve the accuracy of the process. The right side of the analysis chart is the B+ area. The process is left-shifted, and the average number of the system must be moderately increased to improve the accuracy of the process.
Based on these concepts, the above seven blocks of process capability improvement (
,
,
,
,
,
,
) and two blocks of process capability enhancement (
and
) are illustrated in the
Figure 2. The blocks of process capability are shown as follows:
Based on the measurement coordinate point of the key quality characteristic h, which falls into different blocks of process capability improvement or blocks of process capability enhancement, preliminary analyses and improvement suggestions on process improvement or enhancement are put forward below:
- (1)
When , the process capability has attained the required quality level but the process is still in a state of right deviation. As long as the machine parameters are adjusted, the process accuracy can be raised and the process quality level can be greatly lifted.
- (2)
When , the process capability has met the requirements of the quality level but the process is still in a state of left deviation. As long as the machine parameters are modified, the process accuracy can be enhanced and the process quality level can be significantly boosted.
- (3)
When , the process capability does not get to the required quality level. Thus, we need to adjust the machine parameters to improve the right deviation of the process or conduct Taguchi experiments to moderately reduce the process variation, thereby raising the process quality level.
- (4)
When , the process capability does not attain the required quality level. Therefore, it is necessary to adjust the machine parameters to better the left deviation of the process or carry out Taguchi experiments to moderately decrease the process variation, thereby advancing the process quality level.
- (5)
When , the process capability does not attain the required quality level and the process variation is too large. Therefore, we need to lower the process variation and increase the process accuracy, thereby raising the process quality level.
- (6)
When , the process capability does not attain the required quality level, the process variation is too large, and the process is in a state of right deviation. Consequently, we need to reduce the process variation and ameliorate the correct deviation of the process so as to level up the precision and accuracy of the process and increase the process quality level.
- (7)
When , the process capability does not attain the required quality level, the process variation is too large, and the process is in a state of left deviation. Accordingly, we need to reduce the process variation and ameliorate the left deviation of the process in order to raise the precision and accuracy of the process and further enhance the process quality level.
2.4. Improve and Control
Transistor spacers are machined to share five important quality characteristics: diameter, aperture, height, pitch, and eccentricity. Through the above measurement and analysis steps, the process engineer can simultaneously grasp the status of each quality characteristic and the direction of improvement according to the position of the evaluation coordinate point. However, in the step of improvement, it must be based on different industries or different production processes coupled with the professional experience of the process engineer to determine whether the improvement method is to adjust the machine parameters or to find the best combination of processing parameters through Taguchi experiments.
3. A Practical Example
We took transistor gaskets produced by a company in central Taiwan as an example to illustrate the process quality improvement model with the six-sigma DMAIC in this paper. Next, according to the model proposed in
Section 3 and
Section 4, we carried out the quality improvement process of six-sigma DMAIC of transistor gaskets.
3.1. Define
As mentioned earlier, there are five important quality characteristics in the manufacturing process of transistor gaskets. In order to raise the process quality of transistor gaskets to attain the quality level at six-sigma (), the required value of should be at least 1.5 (). Based on Equation (3), Step 1 of the DMAIC process is:
Define: The required value of should be at least 1.61 for the five important quality characteristics.
3.2. Measure
As mentioned earlier, this paper drew the MPCAC with
1.61 to simultaneously measure the process capabilities for the five important quality characteristics of transistor gaskets. First, we calculated the estimators of
and
based on sample data. Next, we computed the value of
and the measurement coordinate point
for quality characteristic h as follows:
Subsequently, the above calculation results are summarized in
Table 3 below.
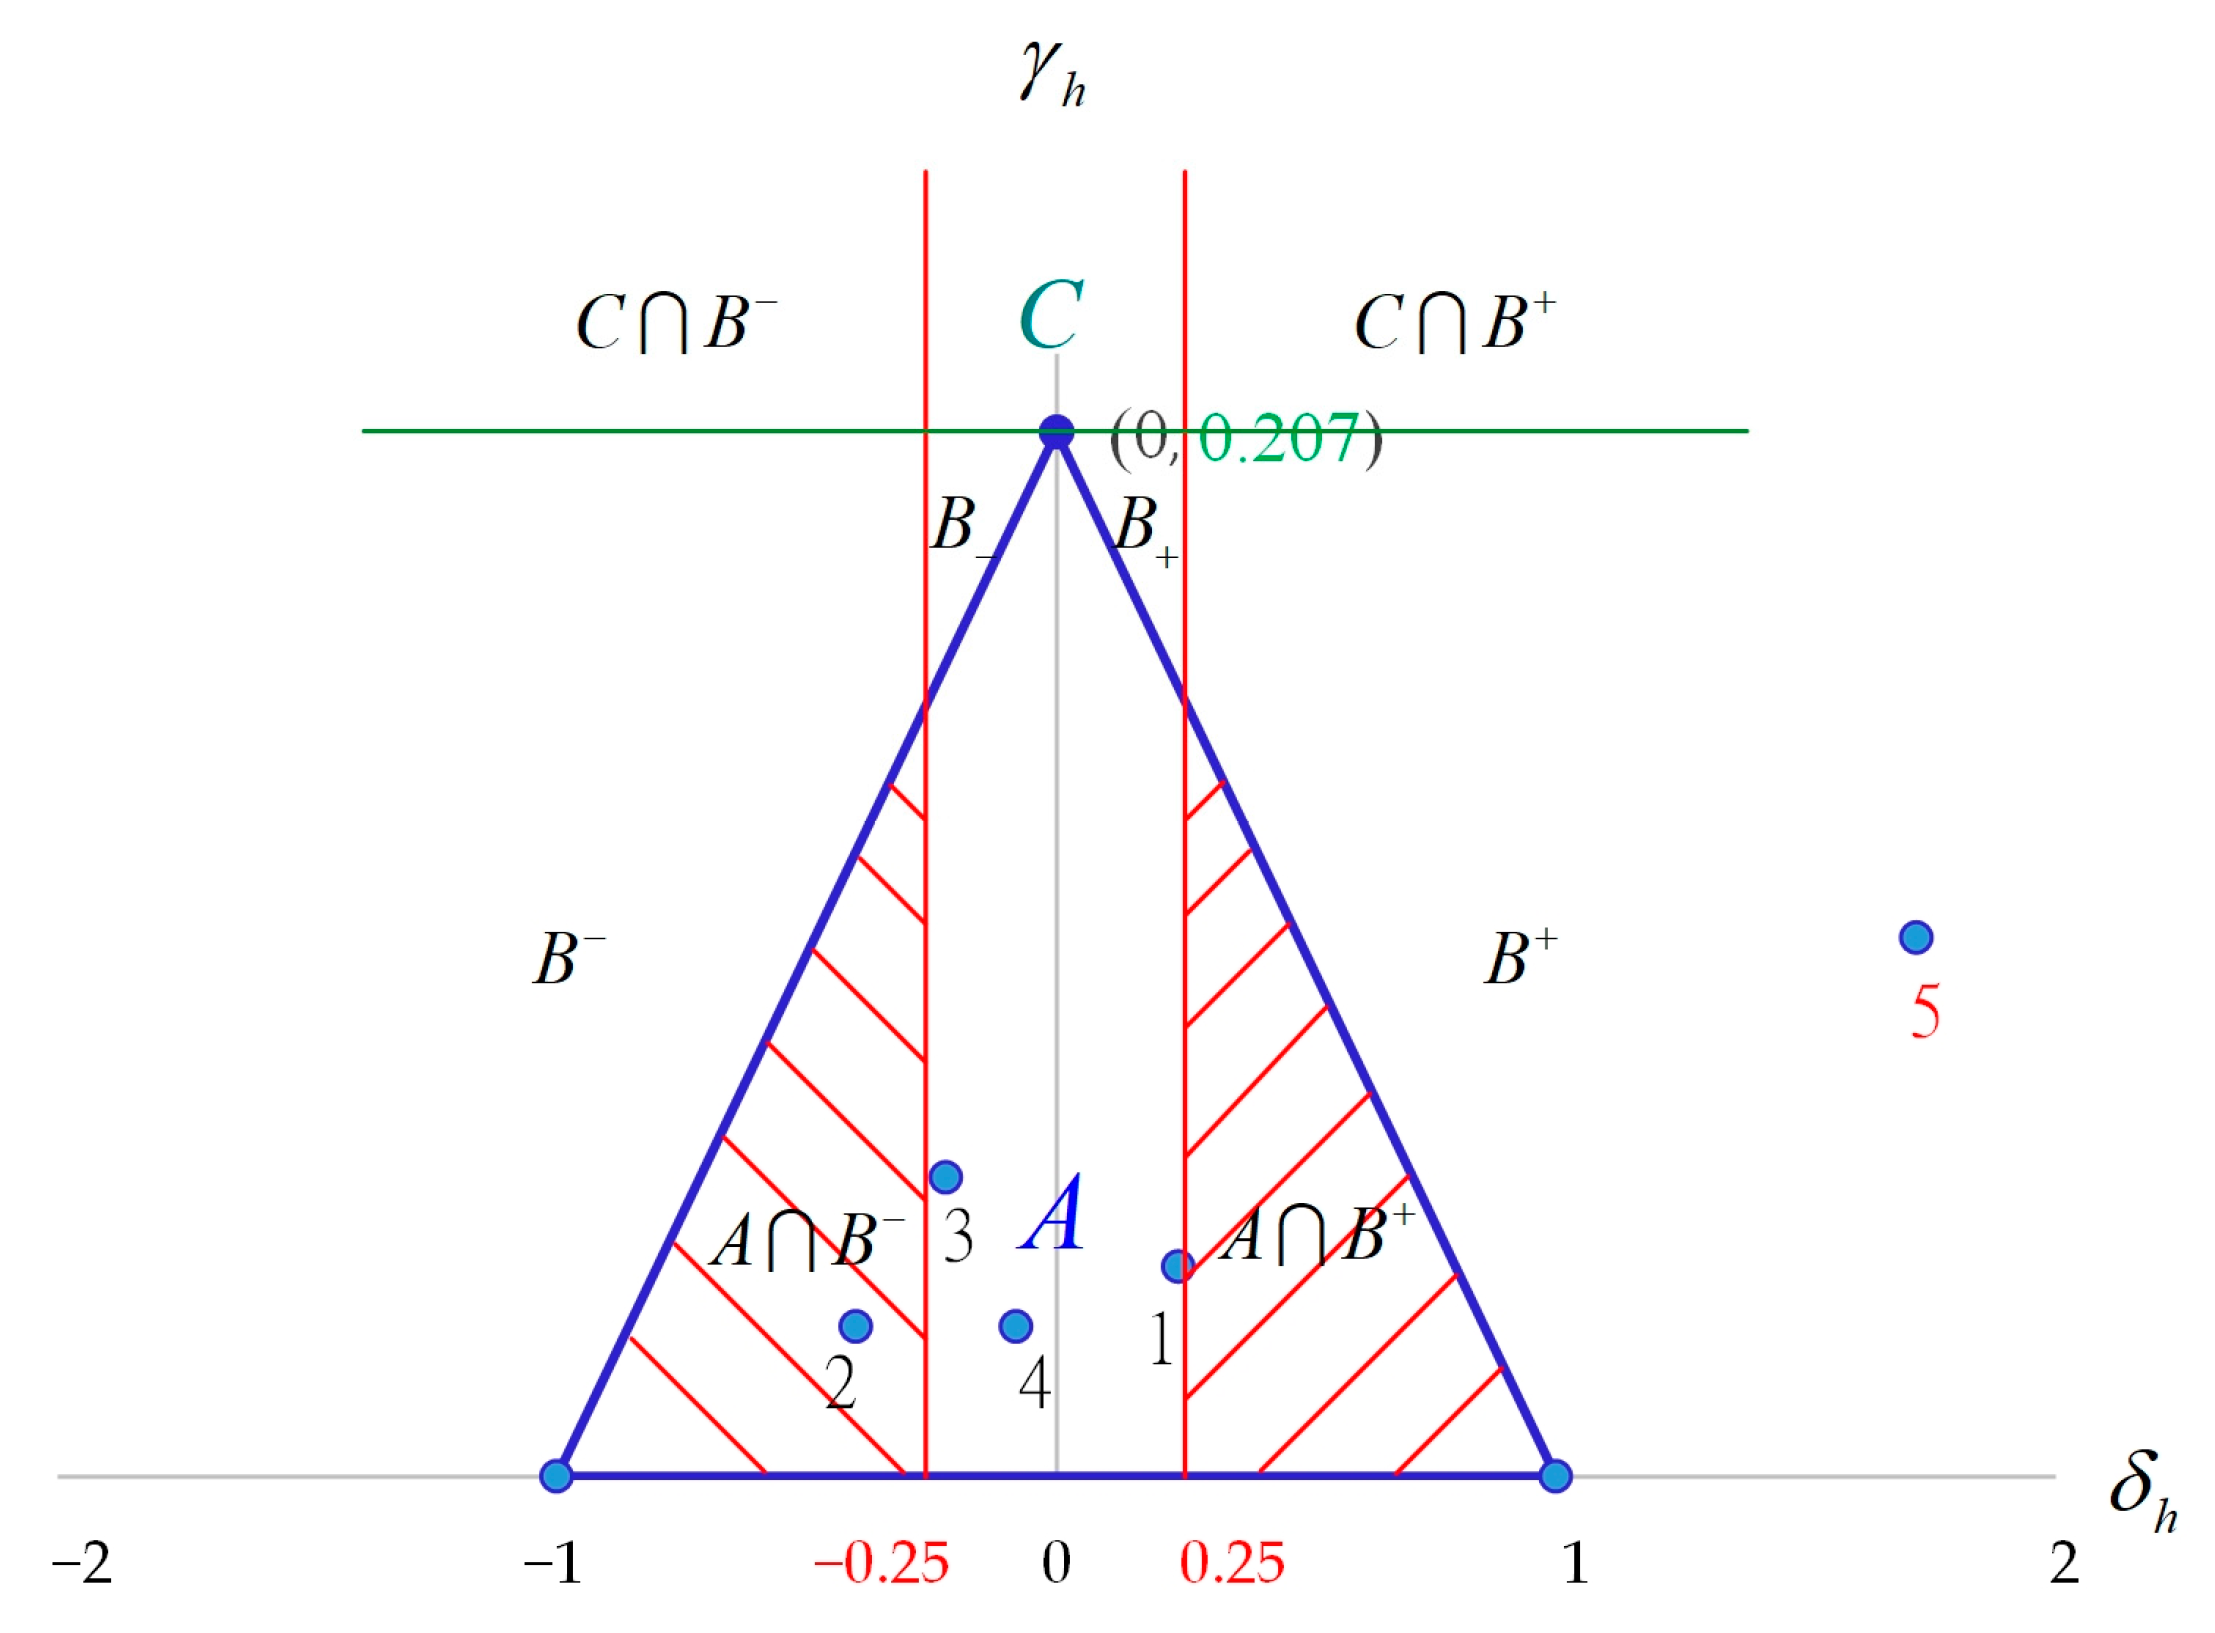
Then, the five measurement coordinate points of
in
Table 3 are drawn into the MPCAC of
1.61,
, as shown in
Figure 3:
3.3. Analyze
According to
Table 3, when
= (1.722, 0.144)
, the process capability has not attained the required quality level. Therefore, we need to adjust the machine parameters to improve the right deviation of the process or conduct Taguchi experiments to moderately reduce the process variation, thereby raising the process quality level.
3.4. Improve and Control
Based on
Figure 2, the five quality characteristics must be improved. According to their own professional experience, the process engineer decided to use Taguchi experiments to find the best combination of processing parameters to achieve the improvement effect. The adopted orthogonal table test can help process engineers to find the best combination of process parameters by reducing the number of experiments and costs. Therefore, this paper uses the orthogonal table test in the Taguchi method as a tool for the fourth step of process improvement. This paper also summarized four important factors that may affect key process parameters, namely injection speed, barrel temperature, hold pressure, and mold temperature. The required experimental factors in the Taguchi method are summarized in
Table 4 below.
For the processing process of transistor gaskets, the on-site engineer selected four test factors—injection speed (A), barrel temperature (B), hold pressure (C), and mold temperature (D)—based on years of processing experience. Each factor selects three levels, as shown in
Table 5 below.
According to the on-site engineer’s years of processing experience, the interaction between the four factors is relatively small. In order to improve efficiency, interaction is not considered for the time being. Because three levels are selected by each factor, the orthogonal table is selected as displayed in
Table 6 below on the premise that interaction is not considered.
Next, the
orthogonal table presented in
Table 5 was used as the improvement tool for the processing process of transistor gaskets. Finally, according to the improved optimum combination of machining parameters, the standard operation process of transistor gaskets was established as the tool of process control. According to the above content, this paper adopts the
orthogonal table to carry on the experiment. Since the experiment was repeated four times, the number of experiments was
times. If the orthogonal table is not used for the experiment, the number of experiments is
times. The reduced number of experiments is
, so the time and money savings are considerable.
Next, we conducted Taguchi experiments based on the
orthogonal table created in
Section 3 for transistor gaskets. Because the fifth quality characteristic belongs to the smaller-the-better (STB), its SN ratio is expressed as follows:
According to nine combinations of experimental designs for the orthogonal table, repeated experiments were performed four times to measure the size of the smaller-the-better quality characteristic (eccentricity control) for transistor gaskets.
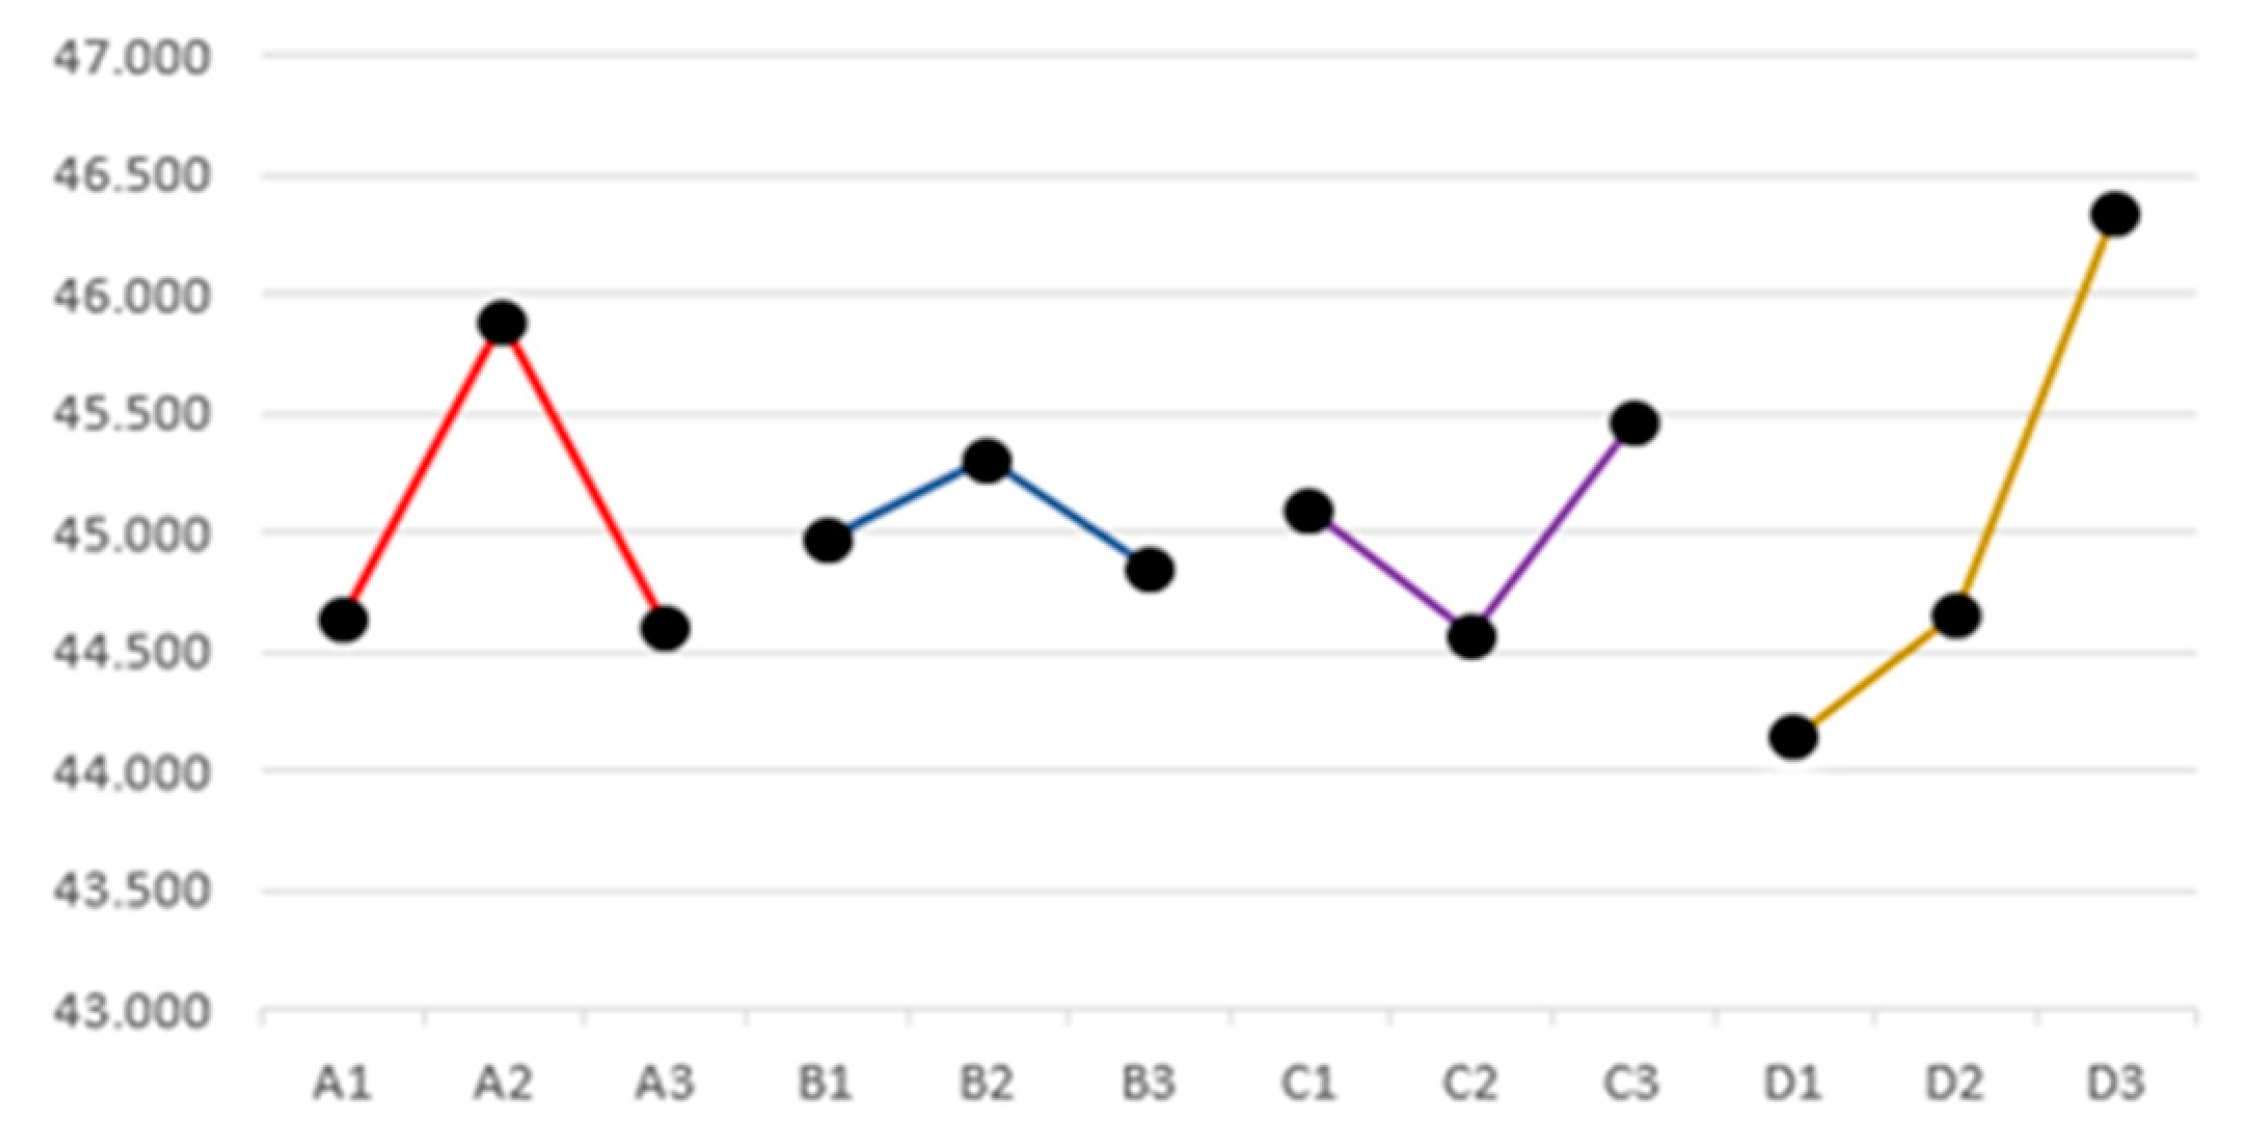
Next, according to
Table 7, the cause-and-effect diagram for four experimental factors containing three levels is drawn in
Figure 4 as follows:
According to the general principle that the larger the SN ratio, the smaller the quality loss, the factor levels with larger SN values are selected in
Table 8, and the factor combination with larger SN ratios is A2-B2-C3-D3, as shown below:
According to the obtained experimental data in
Table 8, since the optimum combination of factor levels is A2-B2-C3-D3, it is obvious that the optimal process parameters for the injection of transistor gaskets are: (1) injection speed = 40 (mm/s), (2) barrel temperature = 260 (°C), (3) hold pressure = 35 (kg/cm
2), and (4) mold temperature = 95 (°C).
Then, according to the optimal parameter combination received from the above-mentioned Taguchi method, parameters were reset on the machine, sample data of sample size n = 60 were extracted, and the improved relevant statistics were computed as follows:
Obviously, when = (0.494, 0.056) A, the value of process capability index is greater than 1.61, and the quality level of the fifth quality characteristic reaches six-sigma.
4. Conclusions
Many studies also urge six-sigma efficiency when discussing six-sigma methods. However, most studies have not proposed specific theoretical models for the five improvement steps of the DMAIC method, so they cannot be provided for industry reference and the promotion effect is difficult to control. Therefore, the research purpose of this paper is to improve the process quality level of transistor spacers by adopting the above-mentioned six sigma DMAIC method improvement process. This method reduces the economic loss caused by maintenance, the economic loss caused by failure to deliver on time, and the environmental pollution caused by maintenance and transportation.
In summary, although this paper and many studies have adopted the six-sigma DMAIC method improvement process, the difference is that this paper adopted the process capability index
proposed by Kane [
18] as a tool which promotes define, measure, and analyze in the improvement process of the six-sigma DMAIC method. However, the difference is that in the measurement and analysis steps, the process capability index
commonly used in the industry is combined to develop the MPCAC. The evaluation coordinate points and evaluation rules of each quality characteristic are established based on the joint confidence interval of the accuracy index and the accuracy index. This method is not only easy for the process engineers in the measurement and analysis steps but also can grasp the direction of improvement by the zone of each quality characteristic at the same time. In addition, the risk of misjudgment due to sampling error can be reduced.
Evaluations based on real cases have shown that an important quality characteristic to be improved is eccentricity. Additionally, this paper figured out the optimal parameter combination of the transistor gasket manufacturing process by means of the testing of the orthogonal table in the Taguchi method as well as successfully raised the process quality level of eccentricity to meet the six-sigma quality level. The output value of Taiwan’s electronics industry ranks among the top in the world. The quality of transistors is directly related to that of various computers and home appliances and even that of the large-scale processing machinery, in which transistor gaskets play an important role. Therefore, this paper took transistor gaskets as an example to propose the improvement process of the six-sigma DMAIC method, which can be viewed as reference for the industry to promote six-sigma. Many studies have pointed out that most parts and components contain several quality characteristics, and the quality level of all quality characteristics must reach the required level to ensure that the quality of parts and components also meets the required level [
13,
27]. Thus, the model proposed by this paper can also be applied to all applications of products with multiple quality characteristics.


