Article

The Structure-Forming Potential of Selected Polysaccharides and Protein Hydrocolloids in Shaping the Properties of Composite Films Using Pumpkin Purée

Department of Food Engineering and Process Management, Institute of Food Sciences, Warsaw University of Life Sciences—SGGW, Nowoursynowska 159c, 02-776 Warsaw, Poland
*
Authors to whom correspondence should be addressed.
Appl. Sci. 2023, 13(12), 6959; https://doi.org/10.3390/app13126959
Submission received: 19 May 2023 / Revised: 3 June 2023 / Accepted: 7 June 2023 / Published: 8 June 2023
(This article belongs to the Special Issue Food Storage, Spoilage and Shelf Life: Latest Advances and Prospects)

Abstract

:
The work aimed to investigate the rheological properties and the gelling process of selected film-forming solutions obtained based on hydrocolloids, such as sodium alginate, highly methylated pectin, and soy protein isolate with the addition of pumpkin purée. It was found that both concentration of hydrocolloid and the addition of pumpkin purée affected the rheological parameters. The non-linear nature of the flow curves was demonstrated, which allowed the curves to be described using the Ostwald de Waele model. The addition of pumpkin purée and the concentration of the structure-forming substance affected the apparent viscosity of the composite film-forming solutions. Considering the applied parameters, only the gelation temperature of composite gelatin film-forming solutions with the addition of pumpkin purée was possible to determine. Additionally, degassing of the solutions with the addition of pumpkin purée resulted in the reduction of the aeration degree and smoothening of the edible films’ surface.

1. Introduction

The magnitude of fruit and vegetable losses and waste is important not only because of social and economic inequalities leading to poverty and hunger in the world but also because of their contribution to climate change by increased greenhouse gases emission while redundant production and the fact that huge amounts of the natural resources are used in vain. What is more, due to their high biodegradability, fruit and vegetable losses and waste pose critical disposal and environmental problems contributing to larger amounts of rubbish on dumping sites [1]. Therefore, in the last years, the development of policies and methods for their management has become a frequently debated subject across administrative levels, functional sectors, and scientific disciplines [2,3]. Nowadays, there are six strategies of waste management known as a waste hierarchy: prevention, minimization, reuse, recycling, energy recovery, and disposal [4]. Among various ways of managing overproduction, seasonality, and perishability of fruit and vegetables, such as their distribution to hungry people [5], extraction of specific compounds [6] or biogas production [7], application of fruits and vegetables as a matrix-forming, nutritional and appealing compound of edible films, sheets, and coatings of various intended use seems to be a very interesting and promising trend of the sustainable development [8]. Such films, sheets, and coatings can be applied to various food products in order to improve their quality and attractiveness, as well as to prolong their shelf life. They can also serve as a separate product used as a sandwich wrap or an alternative to pancakes. Moreover, some forms of fruits and vegetables, e.g., purée or juice in which they, may be incorporated into the matrix-forming solution enabling a reduction of costs and time expended on the production process.
Research on obtaining edible films with the desired physical properties, in particular mechanical and barrier properties, focuses on recipe modifications, including the introduction of nanoparticles or essential oils into the polymer matrix and technological modifications involving such physical modifications as, for example, exposing the film to γ radiation or UV radiation, but also changing the parameters of the film drying process, such as temperature or relative humidity. Among the promising trends in the production of edible films, it is worth paying special attention to the attempt to create a polymer matrix based on fruit and vegetable purées, which are a rich source of ingredients with film-forming properties, such as pectins, starch, and cellulose and its derivatives, and also contain substances with plasticizing properties, antioxidants or antimicrobials. The first publication of this type of film based on apple, pear, peach, and apricot purées by Tara H. McHugh and her research team at the US Department of Agriculture appeared in 1996. In 2012, NewGems Foods™ introduced the first edible films to the market on the basis of purée, to date, proposing their use, e.g., in the production of sushi, as a confectionery decoration and an addition to molecular cuisine dishes [9,10,11,12,13,14].
One of the undoubted advantages of edible films based on purée is the lack of need to isolate the film-forming ingredients from raw materials of plant origin, which reduces the cost of their production. In addition, the possibility of direct use of plant materials will reduce losses resulting from excessive production of certain fruits and vegetables. It will also be possible to increase the market offer of products based on traditionally grown raw materials. In addition, it is worth noting that the process of isolation of film-forming components from raw materials of plant origin not only increases the cost of production of edible films but, at the same time, maybe cause the thermodynamic incompatibility of the components forming the matrix of composite edible films, which may explain the unsatisfactory mechanical or barrier properties of biopolymer materials. On the other hand, the complex mechanism of polymer matrix formation as a result of interactions between the individual components of composite film-forming solutions at the stage of solution composition in terms of rheology has not been fully understood so far, which may significantly limit the possibilities of interpreting the observed properties of edible films, and, thus, thereby improving their properties and further development [8].
The compounds responsible for the formation of the polymer matrix are primarily cellulose, hemicelluloses, pectins and starch [8]. It is also worth paying attention to lignins, which, in addition to the ability to form a polymer mesh, are considered more stable than cellulose and its derivatives, are also hydrophobic and have been shown to have antimicrobial activity. Proteins also contribute to the formation of the polymer matrix. Mono- and disaccharides, in particular glucose, fructose and sucrose, but also water, are responsible for the plasticizing effect of the purée. In addition, mechanical properties largely depend on the size of purée particles and the content of dietary fiber, which also significantly affects the thermal stability of the films obtained [15,16,17].
Pumpkin fruit has not previously been the subject of research as a raw material in the recipe for edible films. The lack of relevant literature data on the method of obtaining purée then added to film-forming solutions resulted in the need to select an appropriate technique for obtaining pumpkin purée characterized by physicochemical properties that guarantee to obtain edible films with the desired characteristics. Pumpkin is a nutritious and healthy vegetable that is easy and inexpensive to cultivate. Additionally, pumpkin purée contains a mixture of biopolymers, such as pectin, cellulose, hemicellulose, lignin or protein, then the final effect might be natural composite films combining the features of hydrocolloid polysaccharide and protein films with such properties of pumpkin purée as attractive organoleptic features or nutritional [12,18,19,20,21,22,23,24,25,26]. Furthermore, the hydrocolloids used, including pork gelatin, soy protein isolate, sodium alginate, and low- and high-methylated apple pectin, are widely recognized components of edible films and were chosen based on literature data [15,16,17].
The aim of the work was to investigate the rheological properties and the gelling process of selected film-forming solutions obtained on the basis of hydrocolloids, such as gelatin, sodium alginate, highly methylated pectin, and soy protein isolate with the addition of pumpkin purée. As part of the conducted experiments, it was planned to determine the effect of the addition of pumpkin purée on rheological properties and the course of gelation, and an attempt was made to assess the effect of degassing of film-forming solutions on the matrix of produced edible films.

2. Materials and Methods

2.1. Material

The research material consisted of solutions and films prepared with the use of protein and polysaccharide hydrocolloids (Table 1): BLOOM 180 pork gelatin (PGEL_) (were supplied as food grade material from Agnex, Białystok, Poland), SUPRO 670 soy protein isolate (SPI_) ((~95 g protein; DuPont Poland Sp.z o.o., Warsaw, Poland), alginate sodium (SA_) (chemical reagent—analytical grade; Sigma-Aldrich, Warsaw, Poland), highly methylated apple pectin (HMAP_) (the degree of esterification more than 50%; Naturex, Warsaw, Poland) and pumpkin purée. Glycerol (chemical reagent) was used as a plasticizer in all types of film-forming solutions (POCH S.A., Poland). The additions of protein hydrocolloid in the form of gelatin at the level of 4, 8 and 12% (w/v) and polysaccharide hydrocolloid at the level of 1, 1.5 and 2% (w/v) were selected on the basis of literature data [16,26].
Pumpkin fruits of the Ambar variety from the Department of Plant Genetics, Breeding and Biotechnology (Warsaw University of Life Sciences) were used to produce purée. Immediately after harvesting, the pumpkin fruit was stored in a polytunnel for two weeks to dry any mechanical damage. After this time, the fruits were stored at a constant temperature of 16 °C until they were used as a raw material for the production of purée.

2.2. Preparation of Solutions and Film

In the case of investigating the effect of the addition of pumpkin purée on the gelation temperature of film-forming solutions, pumpkin purée was added in the amount of 40% (w/v) in relation to the volume of the solution and mixed using a blender (BOSCH Mixxo Quattro, Warsaw, Poland). A 2 molar sodium hydroxide solution was added to the film-forming solutions with the soy protein isolate in such an amount as to obtain a pH = 10 (Elmetron CPO 505 pHmeter). The volume of the solutions was made up to 500 cm3. The concentration of the solutions was checked with a refractometer (PAL-1 Atago, Tokyo, Japan). The exact composition of the solutions is given in Table 1.
Solutions with pumpkin purée before and after degassing were used to prepare the films. The solutions were poured into glass Petri dishes in an amount of 0.3 g of d.b. per 1 cm3 of the surface. The solutions were dried in a climate chamber (Binder, Tuttlingen, Germany) for 72 h in the air with a relative environmental humidity of 50% and a temperature of 25 °C. The coatings were stored under constant conditions (50% RH, 25 °C) for 7 days.
The film-forming solutions were placed in a vacuum chamber (SPT-200 Horyzont, Conbest Sp. z o.o., Kraków, Poland) for degassing. Degassing was carried out at a pressure in the range of 13–23 kPa and a temperature of 50 °C until complete degassing of the solutions.

2.3. Analytical Methods

2.3.1. Determination of Flow Curves and Gelation Temperature of Tested Composite Protein and Polysaccharide Film-Forming Solutions

The research was carried out using the Haake MARS 40 rheometer (Thermo Scientific Inc., Dreieich, Germany). The solutions were tested at 50 °C in a system of coaxial cylinders with a linearly increasing shear rate up to 100 s−1. The apparent viscosity of the solution was determined at a shear rate of 50 s−1. The plate-plate (60 mm) measurement system was used to determine the course of the gelation process. The initial and final cooling temperatures of the solutions are given in Table 1. The final temperature was held for 5 min. The Rheowin Job Manager (Haake) program (version 4.91.0011) was used to register and process the obtained results. The gelation temperature was read from the graph based on the elastic modulus G′ and the viscous modulus G″ as the intersection of the G′ and G″ modulus curves. Measurements were made in triplicate [27].

2.3.2. Study of the Structure of Films

The dried coatings were cut into approx. 1 × 1 cm squares. The prepared material was placed on a microscope stand with the aid of glue. The pictures of the coatings were taken using a scanning electron microscope (TM-3000 HITACHI, Tokyo, Japan). The analysis of the surface and the cross-section of the shells was carried out visually, based on the photos.

2.4. Computational and Statistical Methods

2.4.1. Calculation Methods

The Ostwald de Waele model (1) was used for the mathematical description of the flow curves of the film-forming solutions [28]:
τ = k ( γ ˙ ) n
where: τ —shear stress (Pa), η —dynamic viscosity coefficient (Pa·s), γ ˙ —shear rate (s−1), k—consistency coefficient (Pa·sn), n—the flow index.

2.4.2. Statistical Methods

Statistical analysis was performed with the use of the Statistica 13.1 program. Spearman’s R correlation with the significance level α = 0.05 was used to determine the correlation between the hydrocolloid concentration. Additionally, based on the gelation temperature of the solutions, homogeneous groups were determined using Tukey’s test (α = 0.05).

3. Results and Discussion

3.1. Flow Curves of Tested Film-Forming Solutions

3.1.1. Gelatine Solutions with Pumpkin Purée

Figure 1A shows the flow curves of composite solutions with gelatine concentrations of 4 (PGEL_4), 8 (PGEL_8), and 12% (PGEL_12) and with the addition of pumpkin purée. It was found that the flow curves of the tested composite solutions were non-linear, regardless of the concentration of gelatine in the sample. However, compared to gelatine solutions without the addition of pumpkin purée [27], it was found that the addition of pumpkin purée changed the flow tendencies of the tested gelatine solutions, which allowed the curves to be described using the Ostwald de Waele model (1) taking into account the value of parameter R2 for the described experimental data (Table 2).
The viscosity of composite gelatine solutions with the addition of pumpkin purée ranges from 0.0285–0.8600 [Pa·s] and is directly proportional to changes in gelatine concentration in the tested solutions, which confirms the tendency observed for solutions without the addition of pumpkin purée, obtained in the studies of Janowicz et al. [27]. At the same time, it was found that compared to gelatine solutions without the addition of purée (0.0024–0.0100 Pa·s) [27], the range of viscosity values obtained for composite film-forming solutions with vegetable addition was ten times higher (Table 2).
The multivariate analysis of variance carried out at the significance level α = 0.05 showed a statistically significant effect of pumpkin purée addition to composite gelatine-based solutions and gelatine concentration on the viscosity of the tested film-forming solutions. There was also an interaction between the addition of pumpkin purée and the concentration of gelatine (Table 2). This means that the addition of pumpkin purée increases the effect of the concentration on the viscosity of the solution, which results from the observations carried out by Janowicz et al. [27] in tests performed for pure film-forming gelatine solutions.
Martinez et al. [29] studied a mixture of casein glycomacropeptide and gelatine solutions mixed in the ratio of 75:25, 50:50, and 25:75, and the final concentration of proteins in the solution was 1%. The flow curves of all tested solutions were described using the Newton model. The viscosity of the solutions decreased with an increasing share of the casein glycomacropeptide solution in the mixture. Wang et al. [17] studied the viscosity of 5% bovine gelatine solutions without and with the addition of 0.25, 0.5, and 0.75% (w/w) cellulose nanofibers at 60 °C and shear rates from 0 to 160 s−1. In the case of a solution without the addition of cellulose nanofibers, they showed that the gelatine solution is a Newtonian solution, while the solution with the addition of cellulose nanofibers is a non-Newtonian solution. In addition, the viscosity of gelatine solutions with the addition of cellulose nanofibers increases with the increase in the addition of cellulose nanofibers, which is explained by the phenomenon of percolation. The non-Newtonian fluid behaviour was attributed to additional interactions between gelatine-derived peptides and cellulose nanofiber peptides. A similar reason may explain the behaviour characteristic of non-Newtonian fluids for composite gelatine solutions with the addition of pumpkin purée tested in this study, regardless of the protein biopolymer concentration.

3.1.2. Soy Protein Isolate Solutions with Pumpkin Purée

Figure 1B shows the flow curves of composite solutions of soy protein isolate at concentrations of 4 (SPI_4), 8 (SPI_8), and 12% (SPI_12) and pumpkin purée. The flow curves for the tested solution samples pass through the center of the coordinate system and are not straight lines, as in the case of the experimental results described above, obtained for composite solutions obtained based on gelatine with the addition of pumpkin purée. Based on the parameter R2 (Table 2), the flow curves of solutions of soy protein isolate with the addition of pumpkin purée—as well as solutions without the addition of pumpkin purée and composite gelatine solutions were described using the Ostwald de Waele model (1). The course of the flow curves of the composite soy protein isolate solutions with the addition of pumpkin purée, as well as the matching parameter R2, indicate that these are shear-thinning liquids with no yield point. The value of the flow index n increases with the increase in the concentration of soy protein isolate with the addition of pumpkin purée in the tested composite film-forming solutions. The obtained results show that the deviation from the Newtonian character of the flow decreases with the increase in the concentration of soy protein isolate in the mixtures with the addition of pumpkin purée, similarly as it was the case for pure soy protein isolate with concentrations in the range (4–12%) studied in previous research [27].
The apparent viscosity of composite solutions of soy protein isolate with the addition of pumpkin purée increases with the increase in the concentration of soy protein isolate in solutions and ranges from 0.0170 Pa·s for a solution with a concentration of 4% to 0.0927 Pa·s for a solution with a concentration of 12% (Table 2). In addition, composite solutions of soy protein isolate with the addition of pumpkin purée is characterized by almost ten times higher apparent viscosity than solutions of soy protein isolate without the addition of pumpkin purée at the same concentration (0.0018–0.0056 Pa·s), tested by Janowicz et al. [27]. The greatest increase in viscosity compared to the solution of soy protein isolate without the addition of purée [27] was characterized by a composite solution with a concentration of 12% soy protein isolate.
Echeverria et al. [30] studied the rheological properties of solutions of soy protein isolate with the addition of montmorillonite. Solutions containing 0, 2.5, 5, 7.5, and 10 g of montmorillonite per 100 g of soy protein isolate were prepared. The flow curves of the soy protein isolate solutions were described using a power model, similar to the flow curves of the composite film-forming solutions based on soy protein isolate with the addition of pumpkin purée described in this study. The k parameter for the soy protein isolates solution with the addition of montmorillonite increases as the amount of montmorillonite in the solution increases. On the other hand, the n parameter decreased with the increase of montmorillonite concentration in the soy protein isolate solution, which is the opposite tendency than in the case of the composite solution of soy protein isolates with the addition of pumpkin purée tested in this study.

3.1.3. Sodium Alginate Solutions with Pumpkin Purée

Figure 1C shows the flow curves of composite solutions with sodium alginate concentrations of 1 (SA_1), 1.5 (SA_1.5), and 2% (SA_2) and pumpkin purée added. Based on the course of the flow curves of the composite solutions of sodium alginate with the addition of purée, it was also found in this case, similarly to those described above, that the tested solutions belong to the group of shear-thinning liquids with no yield point. Based on the R2 parameter (Table 2), the Ostwald de Waele model (1) was again used to describe the flow curves of composite solutions of sodium alginate with the addition of pumpkin purée. In this case, the tendency obtained for the sodium alginate solutions without the addition of pumpkin purée, tested by Janowicz et al. [27], was not confirmed in this case for which the Newtonian model was used (Equation (1)) in the study by Janowicz et al. [27].
The flow index n for composite sodium alginate solutions with the addition of pumpkin purée was not characterized by any trend (Table 2). For a solution with a concentration of 1.5% sodium alginate (SA_1.5) with the addition of pumpkin purée, the parameter n was lower (0.6951) than for a solution with a concentration of 1% with the addition of pumpkin purée (0.7718). On the other hand, for a solution with a concentration of 2% sodium alginate SA_2) with the addition of pumpkin purée, the parameter n increases, but the obtained value of the parameter was not higher than the value obtained for a solution with a concentration of 1% sodium alginate (SA_1) with the addition of pumpkin purée.
The apparent viscosity of composite solutions of sodium alginate with the addition of pumpkin purée increases with increasing concentration and ranges from 0.1866 Pa·s to 0.4522 Pa·s (Table 2). Compared to sodium alginate solutions without the addition of pumpkin purée [27], the viscosity is one order of magnitude higher, which also confirms the trends described for composite solutions of gelatine and soy protein isolate of various concentrations and with the addition of pumpkin purée. The smallest difference was between the solutions with a concentration of 2% sodium alginate—the viscosity of the sodium alginate solution with the addition of pumpkin purée (0.4522 Pa·s) was more than five times higher compared to the solution of sodium alginate without the addition of pumpkin purée (0.0884 Pa·s) obtained in previous research [27].
Xiao et al. [31] studied the rheological properties of sodium alginate solutions with the addition of pullulan. Sodium alginate solution (0.2% w/w) was prepared, and then pullulan was added to give 60:40 and 40:60 sodium alginate to pullulan weight ratios. The viscosity test was carried out at 20 °C. The Oswald de Waele model (Equation (1)) was used to describe the flow curves, as in this study. In the case of the solution with a higher content of sodium alginate, the rheological parameters k and n had the values of 0.977 Pa∙s and 0.916, respectively, while in the case of the solution with the ratio of sodium alginate to pullulan was 40:60, the rheological parameters k and n had the values of 0.199 Pa∙s and 0.974, respectively. The results obtained by Xiao et al. [31] indicate that the viscosity decreases with the increase in the addition of pullulan. It can also be seen that the values of parameter n are closer to 1 than in this study. This means that a Newtonian model would probably be a better model to describe the flow curves obtained by Xiao et al. [31].

3.1.4. High-Methylated Apple Pectin Solutions with Pumpkin Purée

Figure 1D shows the flow curves of solutions of highly methylated apple pectin with the addition of pumpkin purée. Additionally, in the case of these composite solutions, it was found that they are shear-thinning liquids without yield points, and the course of changes was described by the Ostwald de Waele model (1). At the same time, it was also observed that the apparent viscosity of solutions of highly methylated apple pectin with the addition of pumpkin purée increases with increasing concentration of the solutions, and the values range from 0.0460 to 0.1468 Pa·s. As in the case of soy protein isolate solutions with the addition of pumpkin purée, the parameter n in the case of highly methylated apple pectin solutions increases with the increase in the solution concentration.
Sharma et al. [25] studied the rheological properties of carrot purée with the addition of 0.8% highly esterified pectin at a shear rate of ~50 s−1. They obtained a viscosity of 3.6 Pa·s, which indicates that the viscosity of the solution is significantly influenced by the hydrocolloid concentration and the level of purée addition, which was much lower in this study (40%). Falguera et al. [32] studied the rheological properties of peach purée jams with the addition of low-methyl pectin (0.4%) and sugar at 20 °C. The addition of sugar in jams ranged from 10 to 30%. The pH was adjusted to 3.4 with citric acid. The Herschel–Bulkley model was used to describe all flow curves. The apparent viscosity of peach jams ranged from 1.51 Pa·s for a jam with a 10% sugar concentration to 3.4 Pa·s for a jam with a 30% sugar concentration. The difference in the viscosity and nature of the tested jams, compared to the solutions of high methylated pectin with the addition of pumpkin purée tested in this study, results from the fact that peach jams, despite the lower content of pectin in the solution, gelled thanks to the addition of sugar. The difference in viscosity may also be because no water was added in the production of the jam, only pure peach purée.

3.2. Effect of Purée Addition on Gelation Temperature

The study of the effect of the addition of purée on the gelation temperature for film-forming solutions was carried out at a cooling rate of 3 K/min.

3.2.1. Gelatine Solutions with Pumpkin Purée

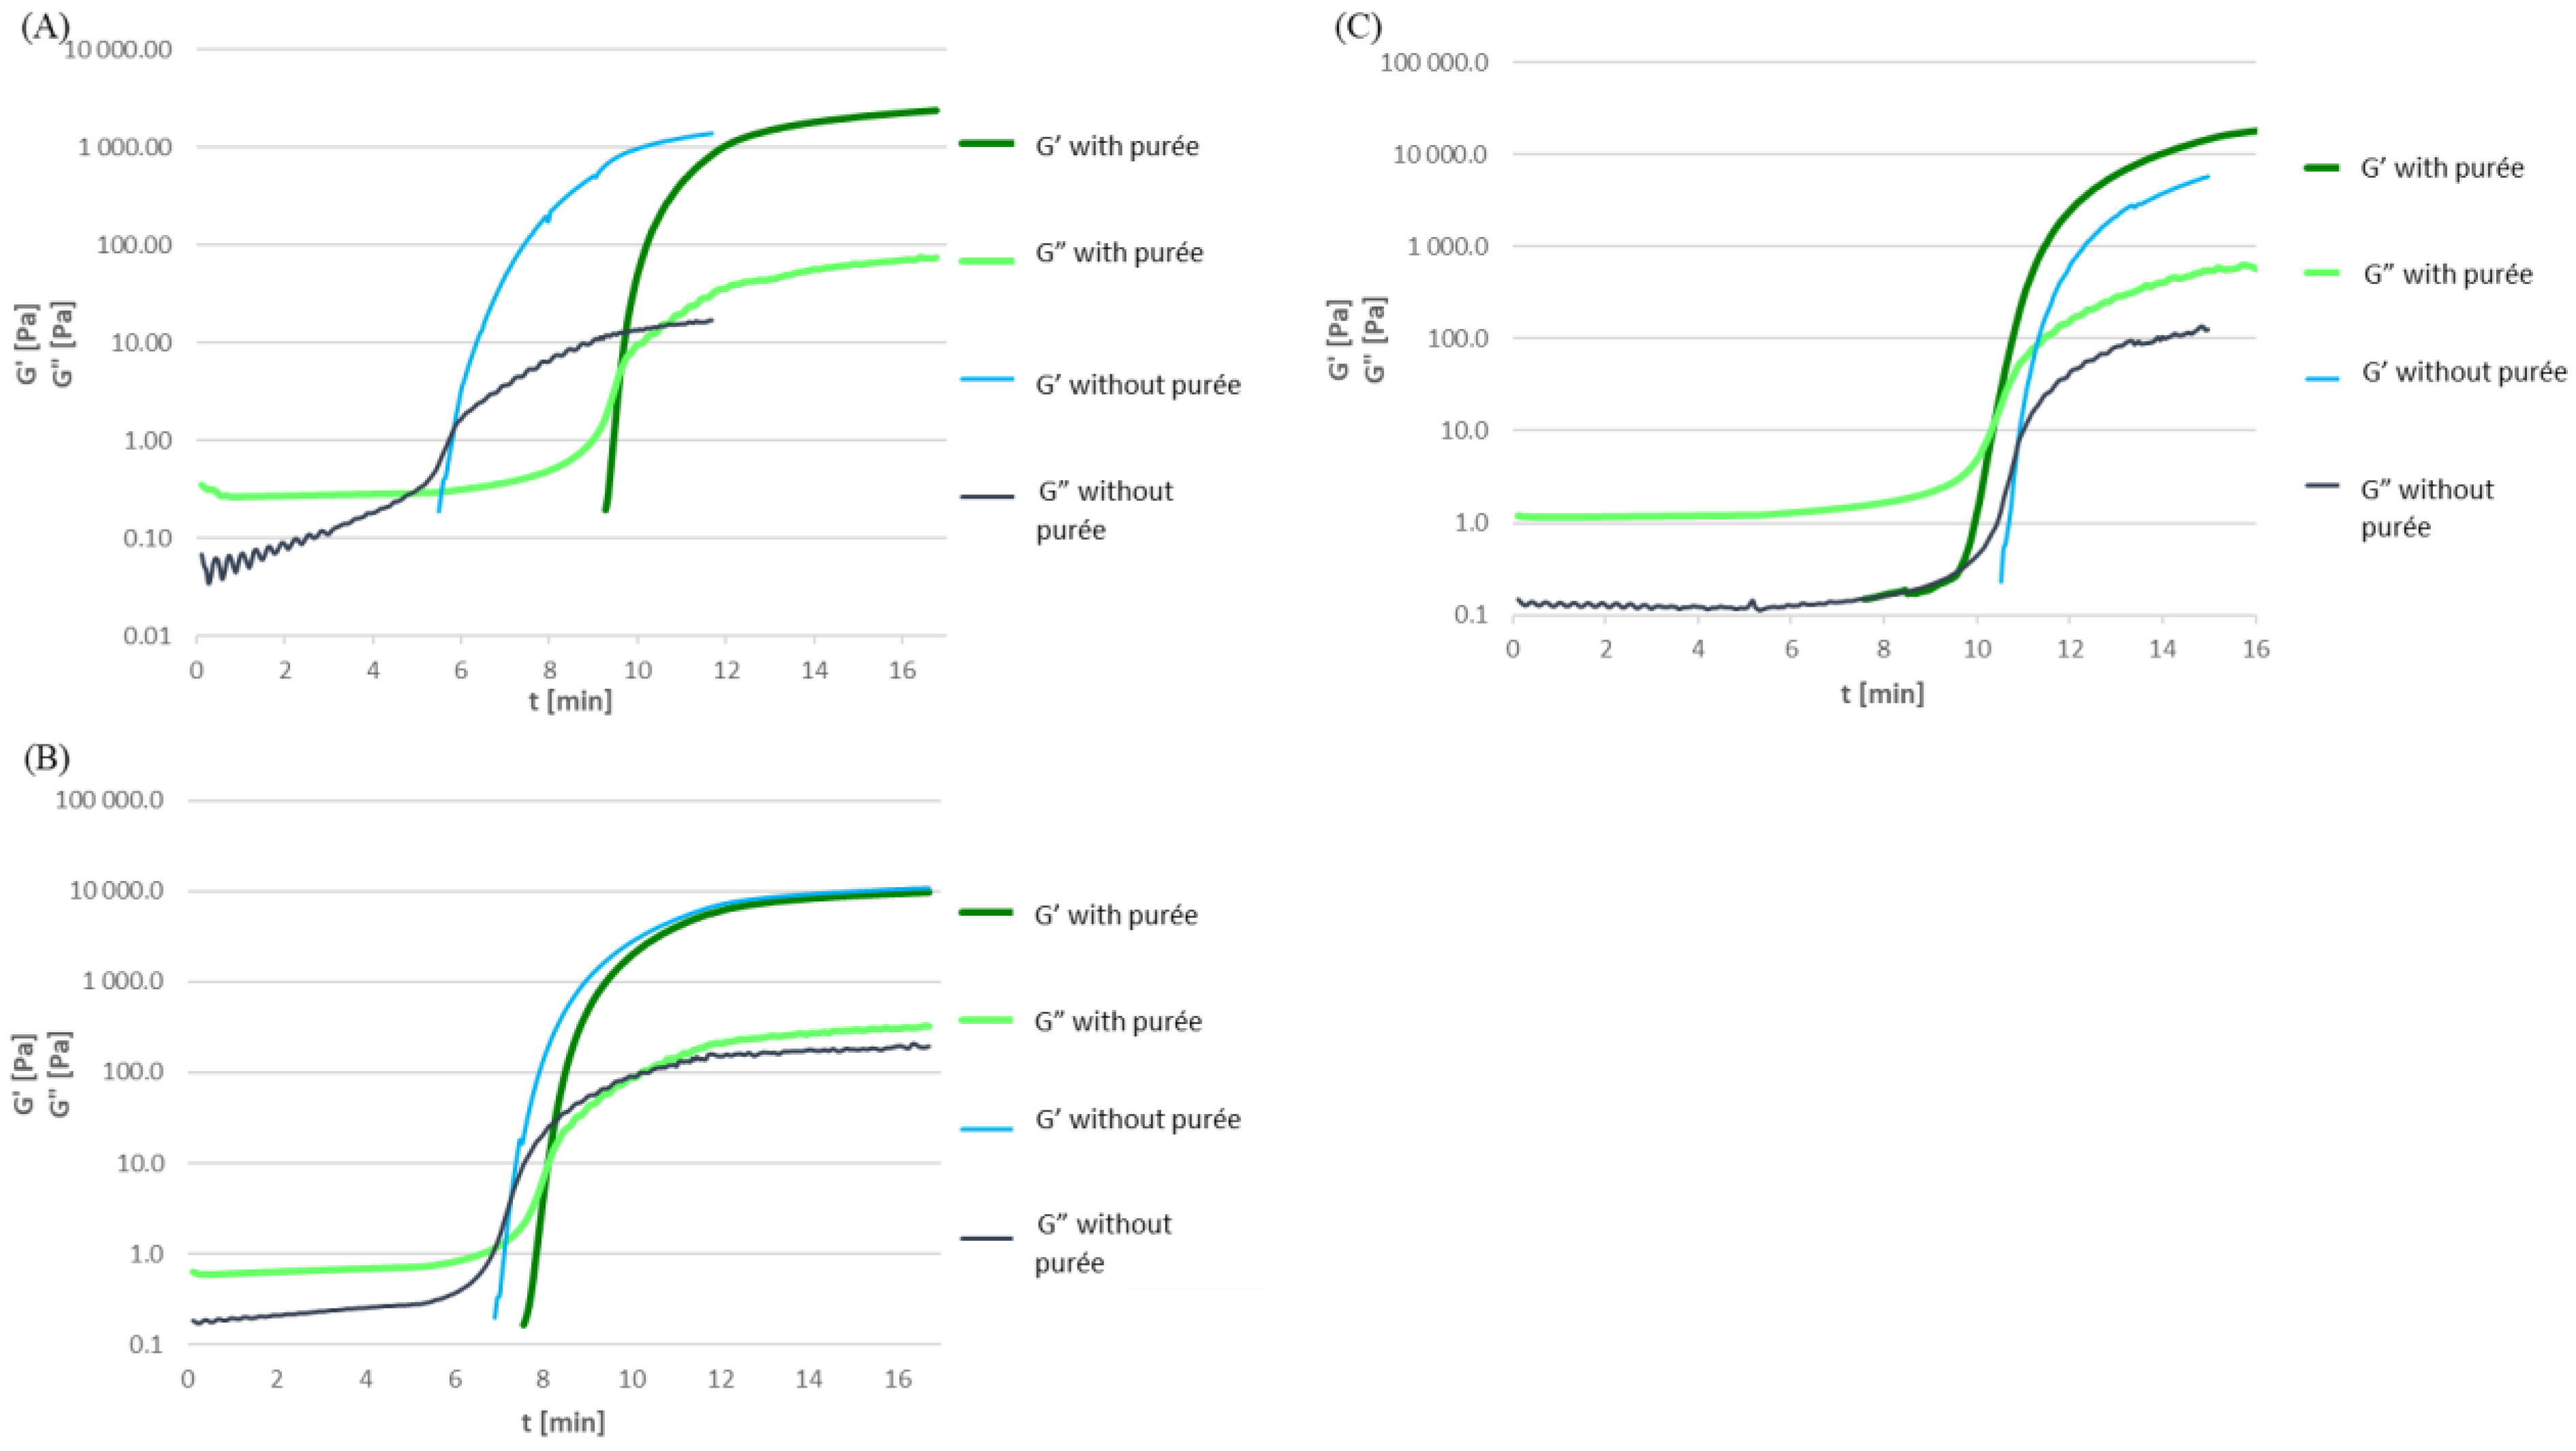
Figure 2A shows a comparison of the gelation curves of a 4% gelatine solution (PGEL_4) with and without the addition of pumpkin purée. The course of changes in the graph shows that the composite gelatine solution with the addition of pumpkin purée is more stable during the test than the solution without the addition of pumpkin purée. The viscosity modulus G″ assumes about eight times higher values for the solution with the addition of pumpkin purée, compared to the solution without the addition of purée, which is most likely related to the higher apparent viscosity of the solutions with the addition of pumpkin purée. In the case of 4% gelatine solutions (PGEL_4), the apparent viscosity of composite solutions (with the addition of purée) is about 12 times higher and amounts to 0.0285 Pa·s for a 4% gelatine solution with the addition of pumpkin purée (Table 2) and according to Janowicz et al. [27] also for such gelatine concentration of 0.0024 Pa·s for the solution without the addition of pumpkin purée. On the other hand, the values of the modulus of elasticity G′ throughout the test are at a similar level. They start at a value of about 0.2 Pa, and stabilization takes place at about 7000–7500 Pa, but the increase in the elastic modulus G′ of the 4% gelatine solution with the addition of pumpkin purée is faster. Due to the greater stability of the 4% gelatine solution (PGEL_4) with the addition of pumpkin purée during the test, the relationship showing the gelation mechanism is more reproducible.
Figure 2B shows the course of the gelling process of solutions with a concentration of 8% (PGEL_8) without and with the addition of pumpkin purée. The analysis of the obtained results allowed us to conclude that the modulus of elasticity G′ of both the solution without the addition and with the addition of pumpkin purée, after being kept at a constant temperature for the last 5 min of the experiment, stabilizes at the same level of about 10,000 Pa. This means that the addition of pumpkin purée does not affect the final value of the modulus of elasticity G′ of gelatine solutions with a concentration of 8% (PGEL_8). A similar tendency can be observed in the gelation curves of solutions with a concentration of 4% without and with the addition of pumpkin purée. In the course of the curves of solutions with a concentration of 12% (PGEL_12) without and with the addition of pumpkin purée (Figure 2C), these differences cannot be determined because the test had to be carried out without holding the temperature for 5 min due to the excessive stiffness of the film formed after exceeding the gelation, which caused the rheometer to stop working. In the case of the viscosity modulus G″, the solutions without the addition of purée have lower values of this parameter than the solutions with the addition of pumpkin purée, which is due to the higher viscosity of these composite solutions compared to those tested by Janowicz et al. [27] of pure gelatine solutions. As in the case of solutions without the addition of pumpkin purée, a relationship was found between the concentration and the size of the elastic modulus G′ and the viscosity modulus G″ and the relationship of the parameters was directly proportional (the higher the concentration, the greater the values of the moduli G′ and G″).
It was found that, regardless of the gelatine concentration, the gelation curves of composite solutions with the addition of pumpkin purée are more stable until the gelling temperature is reached, and after exceeding the gelatinization temperature, the course of these gelatinization curves is comparable to the gelation curves of solutions without the addition of pumpkin purée, and measurement fluctuations occur at the same stages of the experiment. At the same time, it can be noticed that the curves of gelatine solutions without the addition of pumpkin purée have a similar course to the curves of composite solutions with the addition of pumpkin purée, despite the fact that the measurements differed in the initial temperature, and, thus, the testing time of gelatine composites with the addition of purée was longer. This is best seen in Figure 2A for solutions with a gelatine concentration of 4% (PGEL_4) Figure 2A).
The gelling temperature of the solution with the addition of purée is significantly lower than that of the solution without the addition of pumpkin purée and amounts to 16.64 °C for the 4% gelatine solution (PGEL_4) without the addition of purée and 19.74 °C for the solution with the addition of pumpkin purée (Table 3). The same tendency is observed for solutions with a concentration of 8% (PGEL_8) without and with the addition of pumpkin purée. However, in the case of gelatine solutions with a concentration of 12% (PGEL_12) (Figure 2C), a solution with the addition of pumpkin purée reaches a higher gelation temperature. It can also be seen that in the case of testing composite gelatine solutions with the addition of pumpkin purée, the measurements are characterized by greater repeatability than the measurements of gelatine solutions without the addition of pumpkin purée.
Statistical analysis (Table 3) showed a significant effect of the addition of purée on the gelling temperature of the solution and a significant interaction between the concentration of the gelatine solution and the addition of pumpkin purée. Based on the Tuckey test, five homogeneous groups were separated (Table 3).
Cai et al. [33] studied the effect of xylitol and stevia on the rheological properties of fish gelatine solutions. Fish gelatine solutions with a concentration of 6.67% and with the addition of xylitol or stevia in the amount of 1, 3, 5, 10, and 20% were cooled at the rate of 1 K/min from 24 to 4 °C and then kept at 4 °C for three hours. The addition of xylitol increased the value of elastic modulus G′ in comparison to the pure gelatine solution to a greater extent than the addition of stevia. Similarly, the addition of pumpkin purée increases the G′ module value of pork gelatine. In the study by Cai et al. [33] of a 4% gelatine solution, the modulus G′ reached a value of over 103 Pa, similar to a solution of 6.67% fish gelatine with 20% xylitol—also reached a value of 103 Pa, while the modulus G″ in 4% pork gelatine solution with the addition of pumpkin purée is ten times higher than in the fish gelatine solution with 20% xylitol. The different results of the modules in both works may be influenced by the use of gelatines of different origins, different cooling rates of the solutions, and different additives to the solutions—pumpkin purée increases the viscosity of the solution by 8.6 times compared to the pure solution, which may result in higher values modules G′ and G″.
Pang et al. [34] studied the gelation temperature of gelatine solutions with and without the addition of milk proteins—whey protein isolate (WPI), skimmed milk powder (SMP), and milk protein concentrate (MPC). The gelatine solutions had a concentration of 2.5 and 5%, and the milk protein gelatine solutions had a concentration of 2.5 and 5% gelatine and 4.5% WPI, SMP, or MPC. The gelation temperature was determined by cooling the solutions from 40 to 10 °C with a cooling rate of 1 K/min. They showed that the gelation temperature of the solutions increases with the increase in the concentration of the gelatine solution and that the addition of both MPC and SMP has a statistically significant effect on the gelation temperature of the tested solutions. The addition of WPI has no statistically significant effect on the gelation temperature. The gelatinization temperature of a 2.5% gelatine solution without the addition of milk proteins was approx. 16 °C, while the gelatine temperature of a 5% gelatine solution without the addition of milk proteins was approx. 21 °C (the exact date was not given). The gelatine temperature of the gelatine solution with the addition of MPC or SMP, both at the concentration of gelatine equal to 2.5% and 5%, was higher by approx. 1 °C. The different gelation temperatures compared to the literature data were explained by both the different origins of the gelatine and the different thermal histories of the gelatine solutions.

3.2.2. Soy Protein Isolate Solutions with Pumpkin Purée

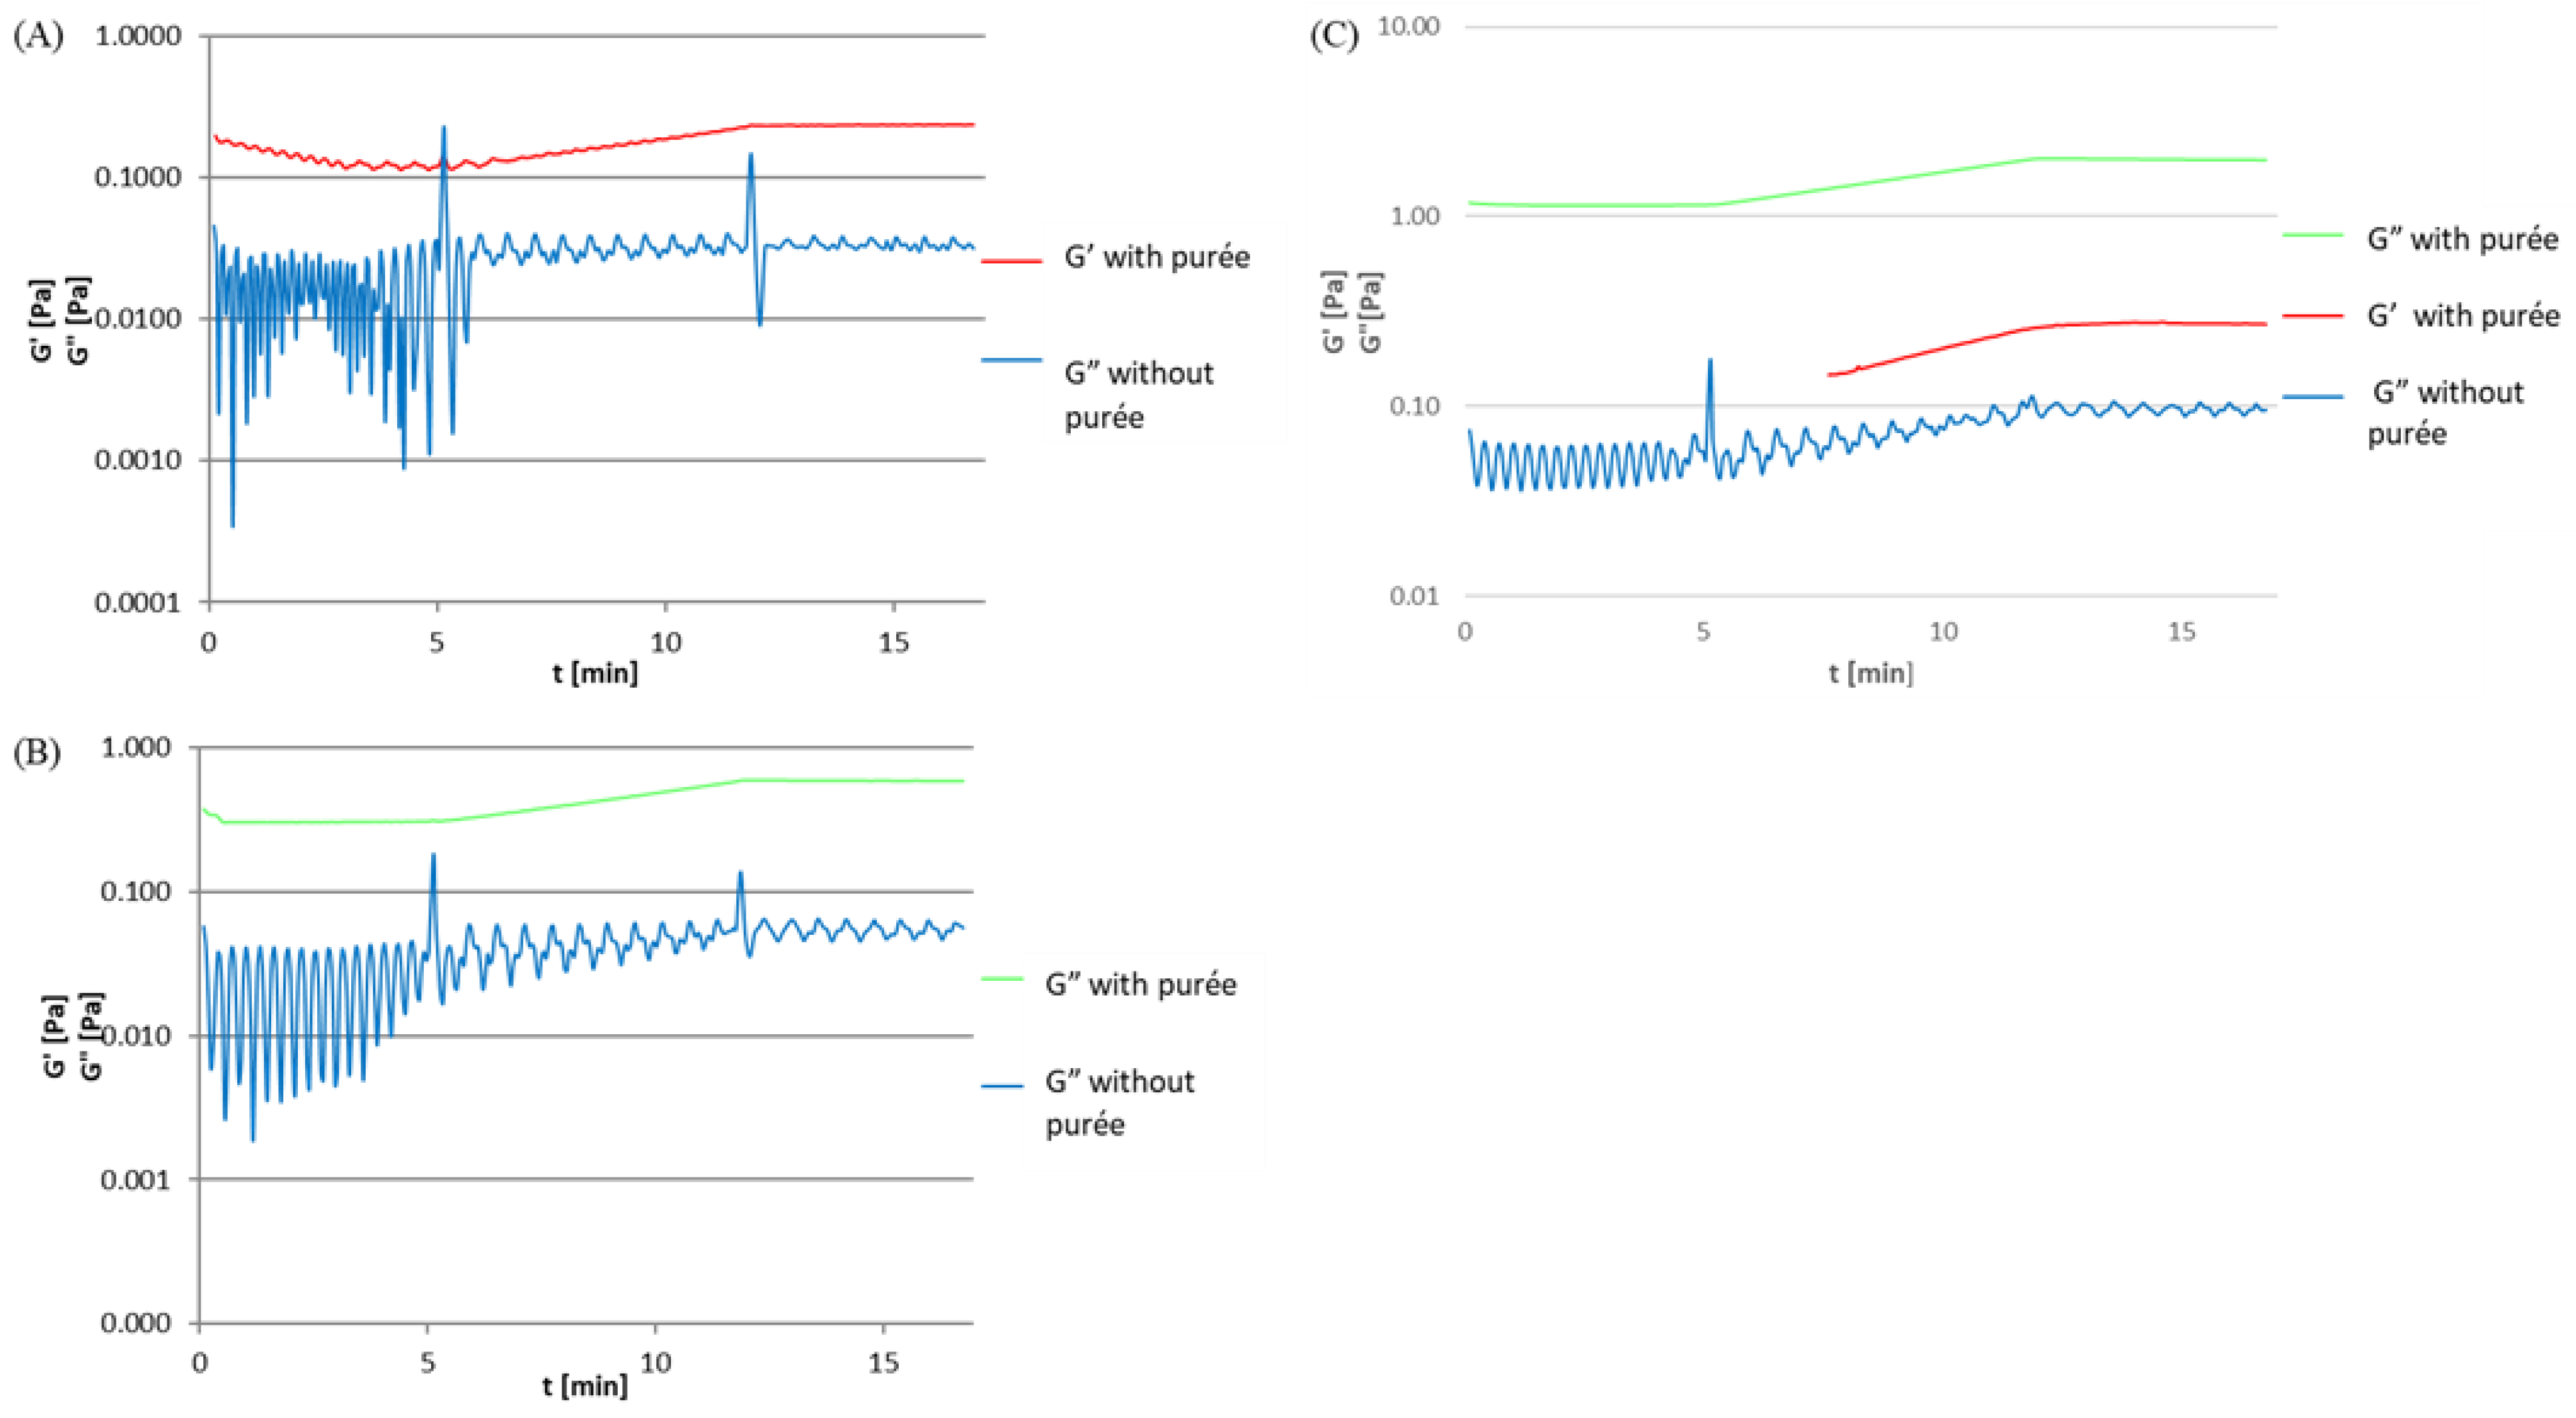
Figure 3A shows the gelation curves of the 4% soy protein isolate solution (SPI_4) with and without pumpkin purée. A composite solution of soy protein isolates at a concentration of 4% (SPI_4) with the addition of pumpkin purée is characterized by an initial decrease in the value of the viscosity modulus G″, which then stabilizes at the third minute of measurement and begins to increase at the 6th minute. It was found that the composite solution of soy protein isolates at a concentration of 4% (SPI_4) with the addition of pumpkin purée was characterized by lower instability of measurements compared to the solution without the addition of pumpkin purée. It can also be seen that the measurements are most stable during the last 5 min of measurement at a constant temperature of 0 °C. When testing soy protein isolate solutions at a concentration of 4% (SPI_4), with and without the addition of pumpkin purée, no elastic modulus G′ was observed, and the solutions did not form a gel.
In the case of the 8% soy protein isolate solution (Figure 3B), it is also seen that the viscosity modulus G″ decreases at the start of the test, but the time over which the decrease in the G″ value is observed is much shorter for the soy protein isolate solution 8% (SPI_8) soy protein isolate than 4% (SPI_4) soy protein solution. Similar to soy protein isolate solutions without purée, solutions with pumpkin purée have less measurement variation and are more stable as the concentration of soy protein isolate increases.
When testing a solution of 12% soy protein isolate (SPI_12) with the addition of pumpkin purée (Figure 3C), the elastic modulus G′ appears. However, the intersection of the modulus of elasticity G′ and viscosity G″ is not possible because the values of both modulus increase linearly and the curves run parallel to each other, and additionally, reducing the temperature below 0 °C would result in freezing the solution.
Tiziani and Vodovotz [35] studied tomato juice prepared by heat treatment of tomatoes with the addition of 1% soy protein isolate. The test was carried out at 25 °C with a variable frequency of 0.1–10 Hz. In the case of a tomato juice solution with the addition of 1% soy protein isolate, they obtained results indicating that the tested solution showed the characteristics of a weak gel. It was suggested that such behaviour of the tested tomato juice solution with the addition of 1% soy protein isolate might result from the interaction of van der Waals forces, electrostatic interactions between solution molecules, or hydrogen bonds in the solution.
Wang et al. [36] studied the rheological properties of soy protein isolate solutions with the addition of CaSO4 of different sizes of protein aggregates—small, medium, and large. Soy protein isolate solutions with three sizes of protein aggregates and concentrations of 60 mg/mL were heated from an initial temperature of 25 °C to 80 °C at a heating rate of 5 °C/min and held for 30 min, then cooled at a rate of 5 °C/min to 25 °C. The gelling of the soy protein isolate solution occurred already when the solution was heated to 80 °C. The gel formation temperatures depended on the size of the soy protein aggregates in the solution and were: 52.0 °C for the soy protein isolate solution with small protein aggregates, 43.1 °C for the solution with medium protein aggregates, and 36.5 °C for the solution with large protein aggregates. Gelation in the study by Wang et al. [17,37] of the solution was possible due to the presence of CaSO4 in the soy protein isolate solution. In addition, due to the centrifugation of the samples to remove insoluble aggregates, the gelation curves had a more stable course.

3.2.3. High-Methylated Apple Pectin Solutions with Pumpkin Purée

Figure 4A shows a comparison of the gelation curves of highly methylated apple pectin solutions (HMAP) with and without the addition of pumpkin purée. The course of changes shows that the addition of pumpkin purée increases the stability of the solution during the experiment; it is most visible when testing the solution of highly methylated apple pectin at a concentration of 1% (HMAP_1). Most likely, the reason is the higher viscosity of the tested solutions of highly methylated apple pectin with the addition of pumpkin purée than without the addition of pumpkin purée. As in the case of other tested biopolymers, the viscosity modulus G″ values increase with increasing concentration also for the solution of highly methylated apple pectin. This tendency is visible both in the case of highly methylated apple pectin solutions without the addition of pumpkin purée as well as with the addition of pumpkin purée.
Elastic modulus G′ appears for composite pumpkin purée solutions with 1.5 (HMAP_1.5) and 2% high methyl apple pectin concentrations (HMAP_2), but the elastic modulus G′ and viscous modulus G″ curves do not intersect. It is true that the values of the modulus of elasticity G′ for 1.5 (HMAP_1.5) and 2% solutions (HMAP_2) increase with the decrease in temperature, but if the temperature was further reduced below 0 °C, the tested solutions would change to a solid form. This is due to the fact that the gelation conditions required for high-methyl pectin [37] were not met, despite the addition of high-starch pumpkin purée. In the case of a composite solution with a 2% concentration of highly methylated apple pectin with the addition of pumpkin purée, the modulus of elasticity G′ appears from the very beginning of the test, already during the initial heating at 20 °C, while in the case of a composite solution of 1.5% highly methylated apple pectin with the addition of pumpkin purée, the modulus of elasticity G′ appears already during the cooling of the solution—at 10 °C in the 8th minute of the test. The different temperatures at which the elastic modulus G′ of solutions with concentrations of 1.5 and 2% of highly methylated apple pectin with the addition of pumpkin purée are most likely due to the difference in biopolymer concentrations because the addition of purée to both solutions was the same.
Ström et al. [38] studied solutions of low-methylated pectin with a concentration of 1, 1.5, 2, and 3% with and without the addition of monovalent sodium, potassium, and lithium ions. Pectin solutions were prepared in distilled water and mixed with salt solutions (NaCl, KCl, LiCl). Hydrochloric acid was added to the solutions to make the solution acidic, followed by sodium hydroxide to raise the pH of the solution. The solutions were prepared at 45 °C to prevent precipitation during the preparation of the solutions. The test was carried out by cooling the solutions at a rate of 2 °C/min from 40 to 5 °C. Solutions of low-methylated pectin without the addition of monovalent ions with pH = 3 gelled. Gelation temperatures increased with increasing concentration of the solution and ranged from 7 °C for a 1% pectin solution to 27 °C for a 3% pectin solution. In addition, the effect of NaCl addition on the gel formation temperature was investigated. It has been shown that the addition of NaCl increases the gelation temperature, and it has been additionally proven that the gelation temperature increases with the decrease in pH.
The ability of a gel to form and its resulting properties depend on the molecular structure of the polymers, the intermolecular forces that hold the network together, and the nature of the junction zones where the polymer molecules are cross-linked. The junction zones in polysaccharide gels are complex and held together by numerous weak interactions, such as electrostatic interactions and hydrogen bonds. HMP and LMP have different mechanisms for gel formation, but the characteristics of the gel depend on the same macromolecular properties, such as polymer composition, size, and conformation [8,39]. The gelation of HMP is strongly influenced by temperature, as demonstrated in previous studies [8,40,41,42]. At 5 °C, gelation was slow and resulted in a weak gel due to the lack of hydrophobic interaction. The pseudo-equilibrium G′ increased up to 30 °C, indicating that an intermediate temperature range is optimal for hydrogen bond and hydrophobic interaction, resulting in a more elastic network. The unique “thermal annealing” behaviour of HMP when the gel was heated and cooled was pH dependent. Despite the pH difference, stability at 30 °C remained constant. There was a slight reduction in G′ and G″ on heating at pH 3.0 and 3.5 [39,40].

3.2.4. Sodium Alginate Solutions with Pumpkin Purée

Figure 4B shows a comparison of the gelation curves of sodium alginate solutions at concentrations of 1(SA_1), 1.5 (SA_1.5), and 2% (SA_2) with and without the addition of pumpkin purée.
The analysis of the obtained results of the experiments and the graphical presentation made it possible to observe that the viscosity modulus G″ of composite sodium alginate solutions with the addition of pumpkin purée, regardless of the biopolymer concentration, takes higher values throughout the test than the G″ modulus of sodium alginate solutions without the addition of pumpkin purée for the same solution concentration. Elastic modulus G′ appears only for composite sodium alginate solutions with pumpkin purée at all solution concentrations, however, regardless of the concentration of composite sodium alginate solutions with pumpkin purée, there is no intersection of elastic modulus G′ and viscosity modulus G″. It can be seen that the modulus of elasticity G′ of the composite solutions of 1 (SA_1) and 2% sodium alginate (SA_2) with the addition of pumpkin purée assumes the same values of about 0.37 Pa during heating at a constant temperature of 25 °C, while during cooling and holding of composite solutions of sodium alginate with the addition of pumpkin purée at 0 °C for 5 min, the values of the modulus of elasticity G′ for the 2% composite solution of sodium alginate (SA_2) with the addition of purée are significantly higher than the modulus of elasticity G′ of the composite 1% sodium alginate solution (SA_1) with the addition of pumpkin purée, which the final values are, respectively, 1.4 Pa and 0.7 Pa. Viscosity moduli G″ for composite solutions of sodium alginate with purée have the highest values at a concentration of 2% (SA_2) and the lowest at a concentration of 1.5% (SA_1.5) throughout the test. It was observed that in the case of sodium alginate solutions without the addition of pumpkin purée, the viscosity modulus G″ increases with increasing concentration. Such a tendency of the viscosity modulus G″ in the case of sodium alginate solution with the addition of purée ©s unusual, the more so that the apparent viscosity of these solutions increases with the concentration increase from 0.1866 to 0.4522 Pa·s (Table 2).
Feng et al. [43] studied solutions of alginate from the leaves of Laminarian hyperborean algae with the addition of a solution of a mixture of chitosan oligomers (MCO) and CaCO3. To the 10 g/L alginate solution, concentrations of 6 g/L MCO (solution A), 0.6 g/L Ca, and 3 g/L MCO (solution B), 1.2 g/L Ca (solution C) were added. The solutions were tested at a constant temperature of 20 °C for 300 min. Gelation was shown to be the fastest in solution A and the slowest in solution C, but the gelation time was not shown. Most likely, the alginate solutions gelled due to the addition of MCO and CaCO3.

3.3. Effect of Degassing of Film-Forming Solutions on the Matrix and Surface of Edible Films

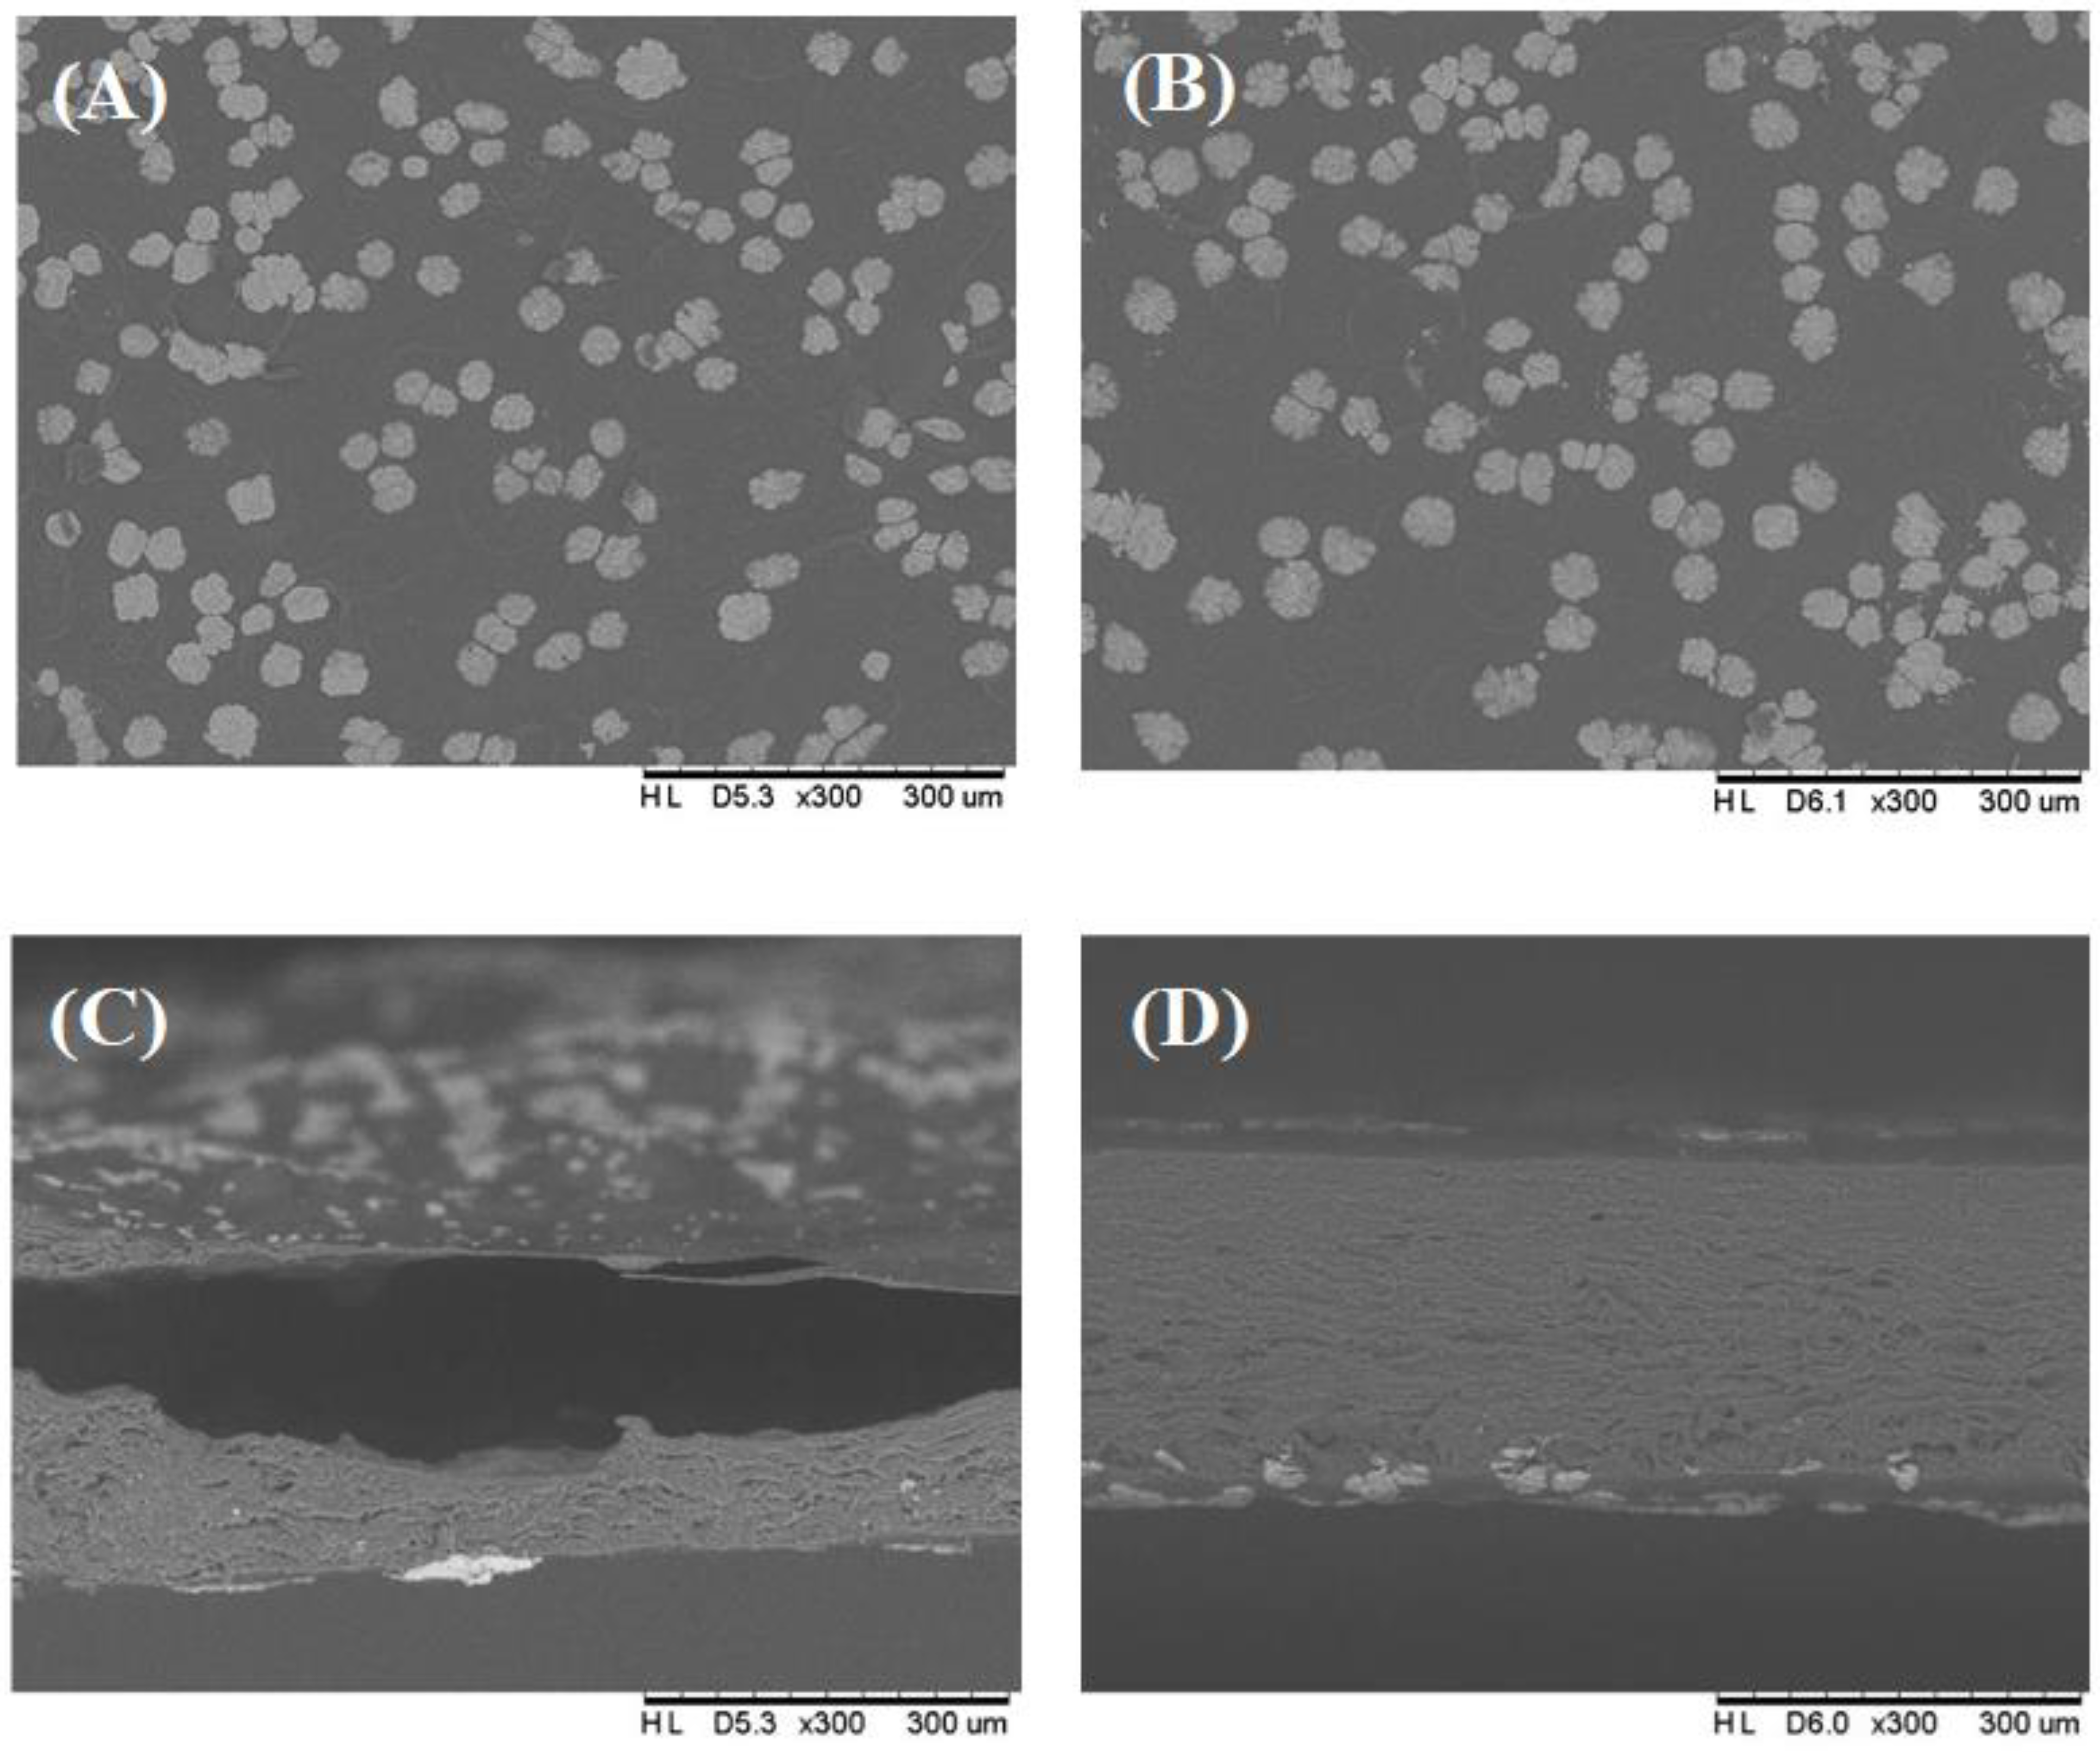
The effect of degassing on the structure of the films was discussed in the example of films obtained from composite gelatine solutions with the addition of pumpkin purée. Figure 5 shows a comparison of the surface structure of edible films from composite 4% gelatine solutions (PGEL_4) with the addition of pumpkin purée at 300× magnification, performed in an electron microscope.
Due to the large accumulation of bubbles on the surface of the films obtained from non-degassed gelatine solutions with the addition of pumpkin purée, it was not possible to capture clear contours of the bubbles on the film surface. Pumpkin purée particles are visible on the surface of the edible films, both degassed and non-degassed. The photos also show that the edible films of the non-degassed solution (Figure 5A,C) have a distinctly uneven surface compared to the edible film of the degassed solution (Figure 5B,D), which has a smooth surface. The presence of air bubbles in the edible film is notable just below the surface of the edible film (Figure 5C). This occurrence can likely be attributed to the conditioning process of the poured film-forming solution during the formation of the edible film. As the film-forming solution is prepared, bubbles accumulate and move toward the free surface. However, once the solution solidifies and forms a layer on the upper part of the film, these bubbles become trapped. They are unable to rupture on the free surface due to their contact with the external environment, along with the influence of physical parameters, such as viscosity, density, pressure, and humidity. In contrast, during the degassing process under reduced pressure, as illustrated in Figure 5B,D, the bubbles are able to escape and crack on the free surface. Pumpkin purée particles are only on the surface and bottom of the film—they do not affect the matrix of either film from degassed or non-degassed solutions. It is worth noting that purée particles are not present in the inner surfaces of the bubbles.
Figure 6 shows a comparison of the surface of films made of composite 8% gelatine solutions (PGEL_8) with the addition of pumpkin purée, non-degassed (Figure 6A,C), and degassed (Figure 6B,D). In order to visualize the presence of pumpkin purée particles on the surface, a binarized image of the microscopic structure of the films was presented.
On the surface of the film from the degassed (Figure 6B,D) 8% gelatine solution (PGEL_8), significantly larger clusters of pumpkin purée particles are visible, which is not observed in such an amount on the surface of the film from the non-degassed solution (Figure 6 A,C). The reason may be that degassing was performed using a vacuum dryer, and the pressure used to deaerate the gelatine solutions may cause the particles to agglomerate into larger agglomerates, whereas, at higher magnifications (Figure 6C,D), the structure of the surface of the pumpkin purée particles can be observed. The structure of the pure particles after degassing the film-forming solution is characterized by a clearly more folded and porous structure (Figure 6D) compared to particles on the surface of the film-forming solution not subjected to degassing under reduced pressure (Figure 6C). Most likely, the free spaces in the structure of the pumpkin purée are filled with gas and water after its mechanical processing during the production of the film-forming solution, which occupies from a few to even several dozen percent of the volume of the mechanically fragmented tissue, depending on the raw material. Due to the above, this results in the presence of a system of channels in the structure of the resulting film, resulting from the places left after the removal of gas and evaporation of water during the formation of the film in the form of the image in Figure 6D and at the same time it is not visible on the macro matrix of the produced films shown in Figure 6E regardless of the concentration of composite gelatine film-forming solutions with the addition of pumpkin purée. At the same time, the analysis of the obtained results allowed us to assume that the degree of aeration of the composite film-forming solutions with the addition of pumpkin purée and its staying under reduced pressure until complete degassing results in a brighter color of the films obtained from composite gelatine solutions (Figure 6E).

4. Conclusions

The concentration of hydrocolloid in a solution and the addition of pumpkin purée have an impact on the analyzed rheological parameters. Results showed that the apparent viscosity of all tested solutions increased as the concentration increased. Soy protein isolate solutions with the addition of pumpkin purée demonstrated that the Ostwald de Weale n-power parameter chosen to describe the flow of the tested hydrocolloid solutions increased with concentration, which was similar to other hydrocolloids used.
Gel formation temperature was only observed in gelatine solutions with the addition of pumpkin purée. The concentration of the solution and the addition of pumpkin purée had a statistically significant effect on the gel formation temperature, which decreased due to the presence of pumpkin purée. Elastic modulus curve G′ was not found in soy protein isolate solutions at 4 and 8% concentration with the addition of pumpkin purée. However, it was found in solutions at a concentration of 12%, which can be explained by the highest viscosity and density of the solution.
Solutions of sodium alginate with the addition of pumpkin purée do not gel at the selected concentrations and conditions but form coatings by a different mechanism. Elastic modulus curve G′ was shown in all concentrations tested for sodium alginate solutions with the addition of pumpkin purée. Viscosity values increased with concentration, while the lowest values of the viscosity modulus G″ were obtained when testing the sodium alginate solution at a concentration of 1.5% and 2%.
Coating formation occurs through different mechanisms for soy protein isolate solutions and sodium alginate, and highly methyl pectin. Degassing of the composite gelatine solution with the addition of concentrated pumpkin purée did not affect the matrix of the edible film, and air bubbles were just below the surface of the film. Edible films made of composite gelatine solutions with the addition of pumpkin purée that was subjected to degassing had smoother and more even surfaces.

Author Contributions

Conceptualization, M.J., J.K. and S.G.; methodology, J.K., A.C., K.S. and S.G.; software, J.K.; validation, M.J., J.K. and S.G.; formal analysis, M.J. and S.G.; investigation, J.K. and K.S.; resources, M.J. and A.C.; data curation, M.J. and J.K.; writing—original draft preparation, M.J., J.K., S.G. and M.K.; writing—review and editing, M.J., J.K., A.C. and M.N.; visualization, M.J., J.K. and M.N.; supervision, M.J. All authors have read and agreed to the published version of the manuscript.

Funding

This research received no external funding.

Institutional Review Board Statement

Not applicable.

Informed Consent Statement

Not applicable.

Data Availability Statement

Data will be available upon reasonable request.

Acknowledgments

The authors would like to thank Julia Jońska and Iwona Sitkiewicz for their help in conducting the research.

Conflicts of Interest

The authors declare no conflict of interest.

References

  1. Plazzotta, S.; Manzocco, L.; Nicoli, M.C. Fruit and Vegetable Waste Management and the Challenge of Fresh-Cut Salad. Trends Food Sci. Technol. 2017, 63, 51–59. [Google Scholar] [CrossRef]
  2. Laufenberg, G.; Kunz, B.; Nystroem, M. Transformation of Vegetable Waste into Value Added Products: (A) the Upgrading Concept; (B) Practical Implementations. Bioresour. Technol. 2003, 87, 167–198. [Google Scholar] [CrossRef] [PubMed]
  3. Directive 2008/98/EC Directive 2008/98/EC of the European Parliament and of the Council of 19 November 2008 on Waste and Repealing Certain Directives. Off. J. Eur. Union L 2008, 312, 22.
  4. Demirbas, A. Waste Management, Waste Resource Facilities and Waste Conversion Processes. Energy Convers. Manag. 2011, 52, 1280–1287. [Google Scholar] [CrossRef]
  5. Schneider, F.; Kearney, A.T. The Shadow Economy in Europe, 2013; Johannes Kepler Universitat: Linz, Austria, 2013. [Google Scholar]
  6. Piccinno, F.; Hischier, R.; Seeger, S.; Som, C. Life Cycle Assessment of a New Technology to Extract, Functionalize and Orient Cellulose Nanofibers from Food Waste. ACS Sustain. Chem. Eng. 2015, 3, 1047–1055. [Google Scholar] [CrossRef]
  7. Han, S.-K.; Shin, H.-S. Performance of an Innovative Two-Stage Process Converting Food Waste to Hydrogen and Methane. J. Air Waste Manag. Assoc. 2004, 54, 242–249. [Google Scholar] [CrossRef] [Green Version]
  8. Roy, S.; Priyadarshi, R.; Łopusiewicz, Ł.; Biswas, D.; Chandel, V.; Rhim, J.-W. Recent Progress in Pectin Extraction, Characterization, and Pectin-Based Films for Active Food Packaging Applications: A Review. Int. J. Biol. Macromol. 2023, 239, 124248. [Google Scholar] [CrossRef]
  9. McHugh, T.H.; Senesi, E. Apple Wraps: A Novel Method to Improve the Quality and Extend the Shelf Life of Fresh-Cut Apples. J. Food Sci. 2000, 65, 480–485. [Google Scholar] [CrossRef]
  10. McHugh, T.H.; Huxoll, C.C.; Krochta, J.M. Permeability Properties of Fruit Puree Edible Films. J. Food Sci. 1996, 61, 88–91. [Google Scholar] [CrossRef]
  11. McHugh, T.H.; de Bord, M.D.; Olsen, C.W. Fruit and Vegetable Films and Uses Thereof. Patent Number 8,048,466, 2011. Available online: https://patents.google.com/patent/US8715763B2/en (accessed on 17 May 2023).
  12. Otoni, C.G.; de Moura, M.R.; Aouada, F.A.; Camilloto, G.P.; Cruz, R.S.; Lorevice, M.V.; Soares, N.d.F.F.; Mattoso, L.H.C. Antimicrobial and Physical-Mechanical Properties of Pectin/Papaya Puree/Cinnamaldehyde Nanoemulsion Edible Composite Films. Food Hydrocoll. 2014, 41, 188–194. [Google Scholar] [CrossRef]
  13. Galus, S.; Kadzińska, J. Food Applications of Emulsion-Based Edible Films and Coatings. Trends Food Sci. Technol. 2015, 45, 273–283. [Google Scholar] [CrossRef]
  14. Kadzińska, J.; Janowicz, M.; Kalisz, S.; Bryś, J.; Lenart, A. An Overview of Fruit and Vegetable Edible Packaging Materials. Packag. Technol. Sci. 2019, 32, 483–495. [Google Scholar] [CrossRef]
  15. Otoni, C.G.; Avena-Bustillos, R.J.; Azeredo, H.M.C.; Lorevice, M.V.; Moura, M.R.; Mattoso, L.H.C.; McHugh, T.H. Recent Advances on Edible Films Based on Fruits and Vegetables-A Review. Compr. Rev. Food Sci. Food Saf. 2017, 16, 1151–1169. [Google Scholar] [CrossRef] [PubMed] [Green Version]
  16. Wang, X.; Sun, X.; Liu, H.; Li, M.; Ma, Z. Barrier and Mechanical Properties of Carrot Puree Films. Food Bioprod. Process. 2011, 89, 149–156. [Google Scholar] [CrossRef]
  17. Wang, W.; Zhang, X.; Teng, A.; Liu, A. Mechanical Reinforcement of Gelatin Hydrogel with Nanofiber Cellulose as a Function of Percolation Concentration. Int. J. Biol. Macromol. 2017, 103, 226–233. [Google Scholar] [CrossRef]
  18. Ninčević Grassino, A.; Rimac Brnčić, S.; Badanjak Sabolović, M.; Šic Žlabur, J.; Marović, R.; Brnčić, M. Carotenoid Content and Profiles of Pumpkin Products and By-Products. Molecules 2023, 28, 858. [Google Scholar] [CrossRef]
  19. Lalnunthari, C.; Devi, L.M.; Badwaik, L.S. Extraction of Protein and Pectin from Pumpkin Industry By-Products and Their Utilization for Developing Edible Film. J. Food Sci. Technol. 2020, 57, 1807–1816. [Google Scholar] [CrossRef]
  20. Arifin, N.; Izyan, S.N.; Huda-Faujan, N. Physical Properties and Consumer Acceptability of Basic Muffin Made from Pumpkin Puree as Butter Replacer. Food Res. 2019, 3, 840–845. [Google Scholar] [CrossRef]
  21. Dhiman, A.K.; Sharma, K.; Attri, S. Functional Constituents and Processing of Pumpkin: A Review. J. Food Sci. Technol. 2009, 45, 411–417. [Google Scholar]
  22. Kaur, S.; Panghal, A.; Garg, M.K.; Mann, S.; Khatkar, S.K.; Sharma, P.; Chhikara, N. Functional and Nutraceutical Properties of Pumpkin—A Review. Nutr. Food Sci. 2019, 50, 384–401. [Google Scholar] [CrossRef]
  23. Provesi, J.G.; Dias, C.O.; Amante, E.R. Changes in Carotenoids during Processing and Storage of Pumpkin Puree. Food Chem. 2011, 128, 195–202. [Google Scholar] [CrossRef] [PubMed] [Green Version]
  24. Azeredo, H.M.C.; Miranda, K.W.E.; Ribeiro, H.L.; Rosa, M.F.; Nascimento, D.M. Nanoreinforced Alginate–Acerola Puree Coatings on Acerola Fruits. J. Food Eng. 2012, 113, 505–510. [Google Scholar] [CrossRef] [Green Version]
  25. Sharma, M.; Kristo, E.; Corredig, M.; Duizer, L. Effect of Hydrocolloid Type on Texture of Pureed Carrots: Rheological and Sensory Measures. Food Hydrocoll. 2017, 63, 478–487. [Google Scholar] [CrossRef]
  26. Wang, H.; Wan, L.; Chen, D.; Guo, X.; Liu, F.; Pan, S. Unexpected Gelation Behavior of Citrus Pectin Induced by Monovalent Cations under Alkaline Conditions. Carbohydr. Polym. 2019, 212, 51–58. [Google Scholar] [CrossRef] [PubMed]
  27. Janowicz, M.; Sitkiewicz, I.; Ciurzyńska, A.; Galus, S. Rheological Properties of Film-Forming Dispersions of Selected Biopolymers Used for Packaging Films or Food Coating. Coatings 2022, 12, 1704. [Google Scholar] [CrossRef]
  28. Sitkiewicz, I.; Pałacha, Z. Rheological Properties of Fruit Fillings to Yoghourts. Technol. Prog. Food Process. 2010, 2, 37–41. [Google Scholar]
  29. Martinez, M.J.; Pizones Ruiz-Henestrosa, V.M.; Carrera Sánchez, C.; Rodríguez Patino, J.M.; Pilosof, A.M.R. Foaming and Surface Properties of Casein Glycomacropeptide–Gelatin Mixtures as Affected by Their Interactions in the Aqueous Phase. Food Hydrocoll. 2013, 33, 48–57. [Google Scholar] [CrossRef]
  30. Echeverría, I.; Eisenberg, P.; Mauri, A.N. Nanocomposites Films Based on Soy Proteins and Montmorillonite Processed by Casting. J. Memb. Sci. 2014, 449, 15–26. [Google Scholar] [CrossRef]
  31. Xiao, Q.; Tong, Q.; Lim, L.T. Pullulan-Sodium Alginate Based Edible Films: Rheological Properties of Film Forming Solutions. Carbohydr. Polym. 2012, 87, 1689–1695. [Google Scholar] [CrossRef]
  32. Falguera, V.; Mengual, A.; Vicente, M.; Ibarz, A. Effect of Calcium Pidolate on the Rheological Characteristics of Jams and Gelatins. Food Res. Int. 2010, 43, 882–885. [Google Scholar] [CrossRef]
  33. Cai, L.; Feng, J.; Regenstein, J.; Lv, Y.; Li, J. Confectionery Gels: Effects of Low Calorie Sweeteners on the Rheological Properties and Microstructure of Fish Gelatin. Food Hydrocoll. 2017, 67, 157–165. [Google Scholar] [CrossRef]
  34. Pang, Z.; Deeth, H.; Sopade, P.; Sharma, R.; Bansal, N. Rheology, Texture and Microstructure of Gelatin Gels with and without Milk Proteins. Food Hydrocoll. 2014, 35, 484–493. [Google Scholar] [CrossRef]
  35. Tiziani, S.; Vodovotz, Y. Rheological Effects of Soy Protein Addition to Tomato Juice. Food Hydrocoll. 2005, 19, 45–52. [Google Scholar] [CrossRef]
  36. Wang, X.; He, Z.; Zeng, M.; Qin, F.; Adhikari, B.; Chen, J. Effects of the Size and Content of Protein Aggregates on the Rheological and Structural Properties of Soy Protein Isolate Emulsion Gels Induced by CaSO4. Food Chem. 2017, 221, 130–138. [Google Scholar] [CrossRef] [PubMed]
  37. Muhoza, B.; Xia, S.; Zhang, X. Gelatin and High Methyl Pectin Coacervates Crosslinked with Tannic Acid: The Characterization, Rheological Properties, and Application for Peppermint Oil Microencapsulation. Food Hydrocoll. 2019, 97, 105174. [Google Scholar] [CrossRef]
  38. Ström, A.; Schuster, E.; Goh, S.M. Rheological Characterization of Acid Pectin Samples in the Absence and Presence of Monovalent Ions. Carbohydr. Polym. 2014, 113, 336–343. [Google Scholar] [CrossRef] [Green Version]
  39. Chan, S.Y.; Choo, W.S.; Young, D.J.; Loh, X.J. Pectin as a Rheology Modifier: Origin, Structure, Commercial Production and Rheology. Carbohydr. Polym. 2017, 161, 118–139. [Google Scholar] [CrossRef]
  40. Axelos, M.A.V.; Thibault, J.F. The Chemistry of Low-Methoxyl Pectin Gelation. Chem. Technol. Pectin. 1991, 6, 108–109. [Google Scholar]
  41. Taylor, S. The Chemistry and Technology of Pectin; Walter, R.H., Ed.; Academic Press: Cambridge, MA, USA, 2012. [Google Scholar]
  42. Loh, X.J. Polymers for Personal Care Products and Cosmetics; Loh, X.J., Ed.; The Royal Society of Chemistry: London, UK, 2016. [Google Scholar]
  43. Feng, Y.; Kopplin, G.; Sato, K.; Draget, K.I.; Vårum, K.M. Alginate Gels with a Combination of Calcium and Chitosan Oligomer Mixtures as Crosslinkers. Carbohydr. Polym. 2017, 156, 490–497. [Google Scholar] [CrossRef] [Green Version]
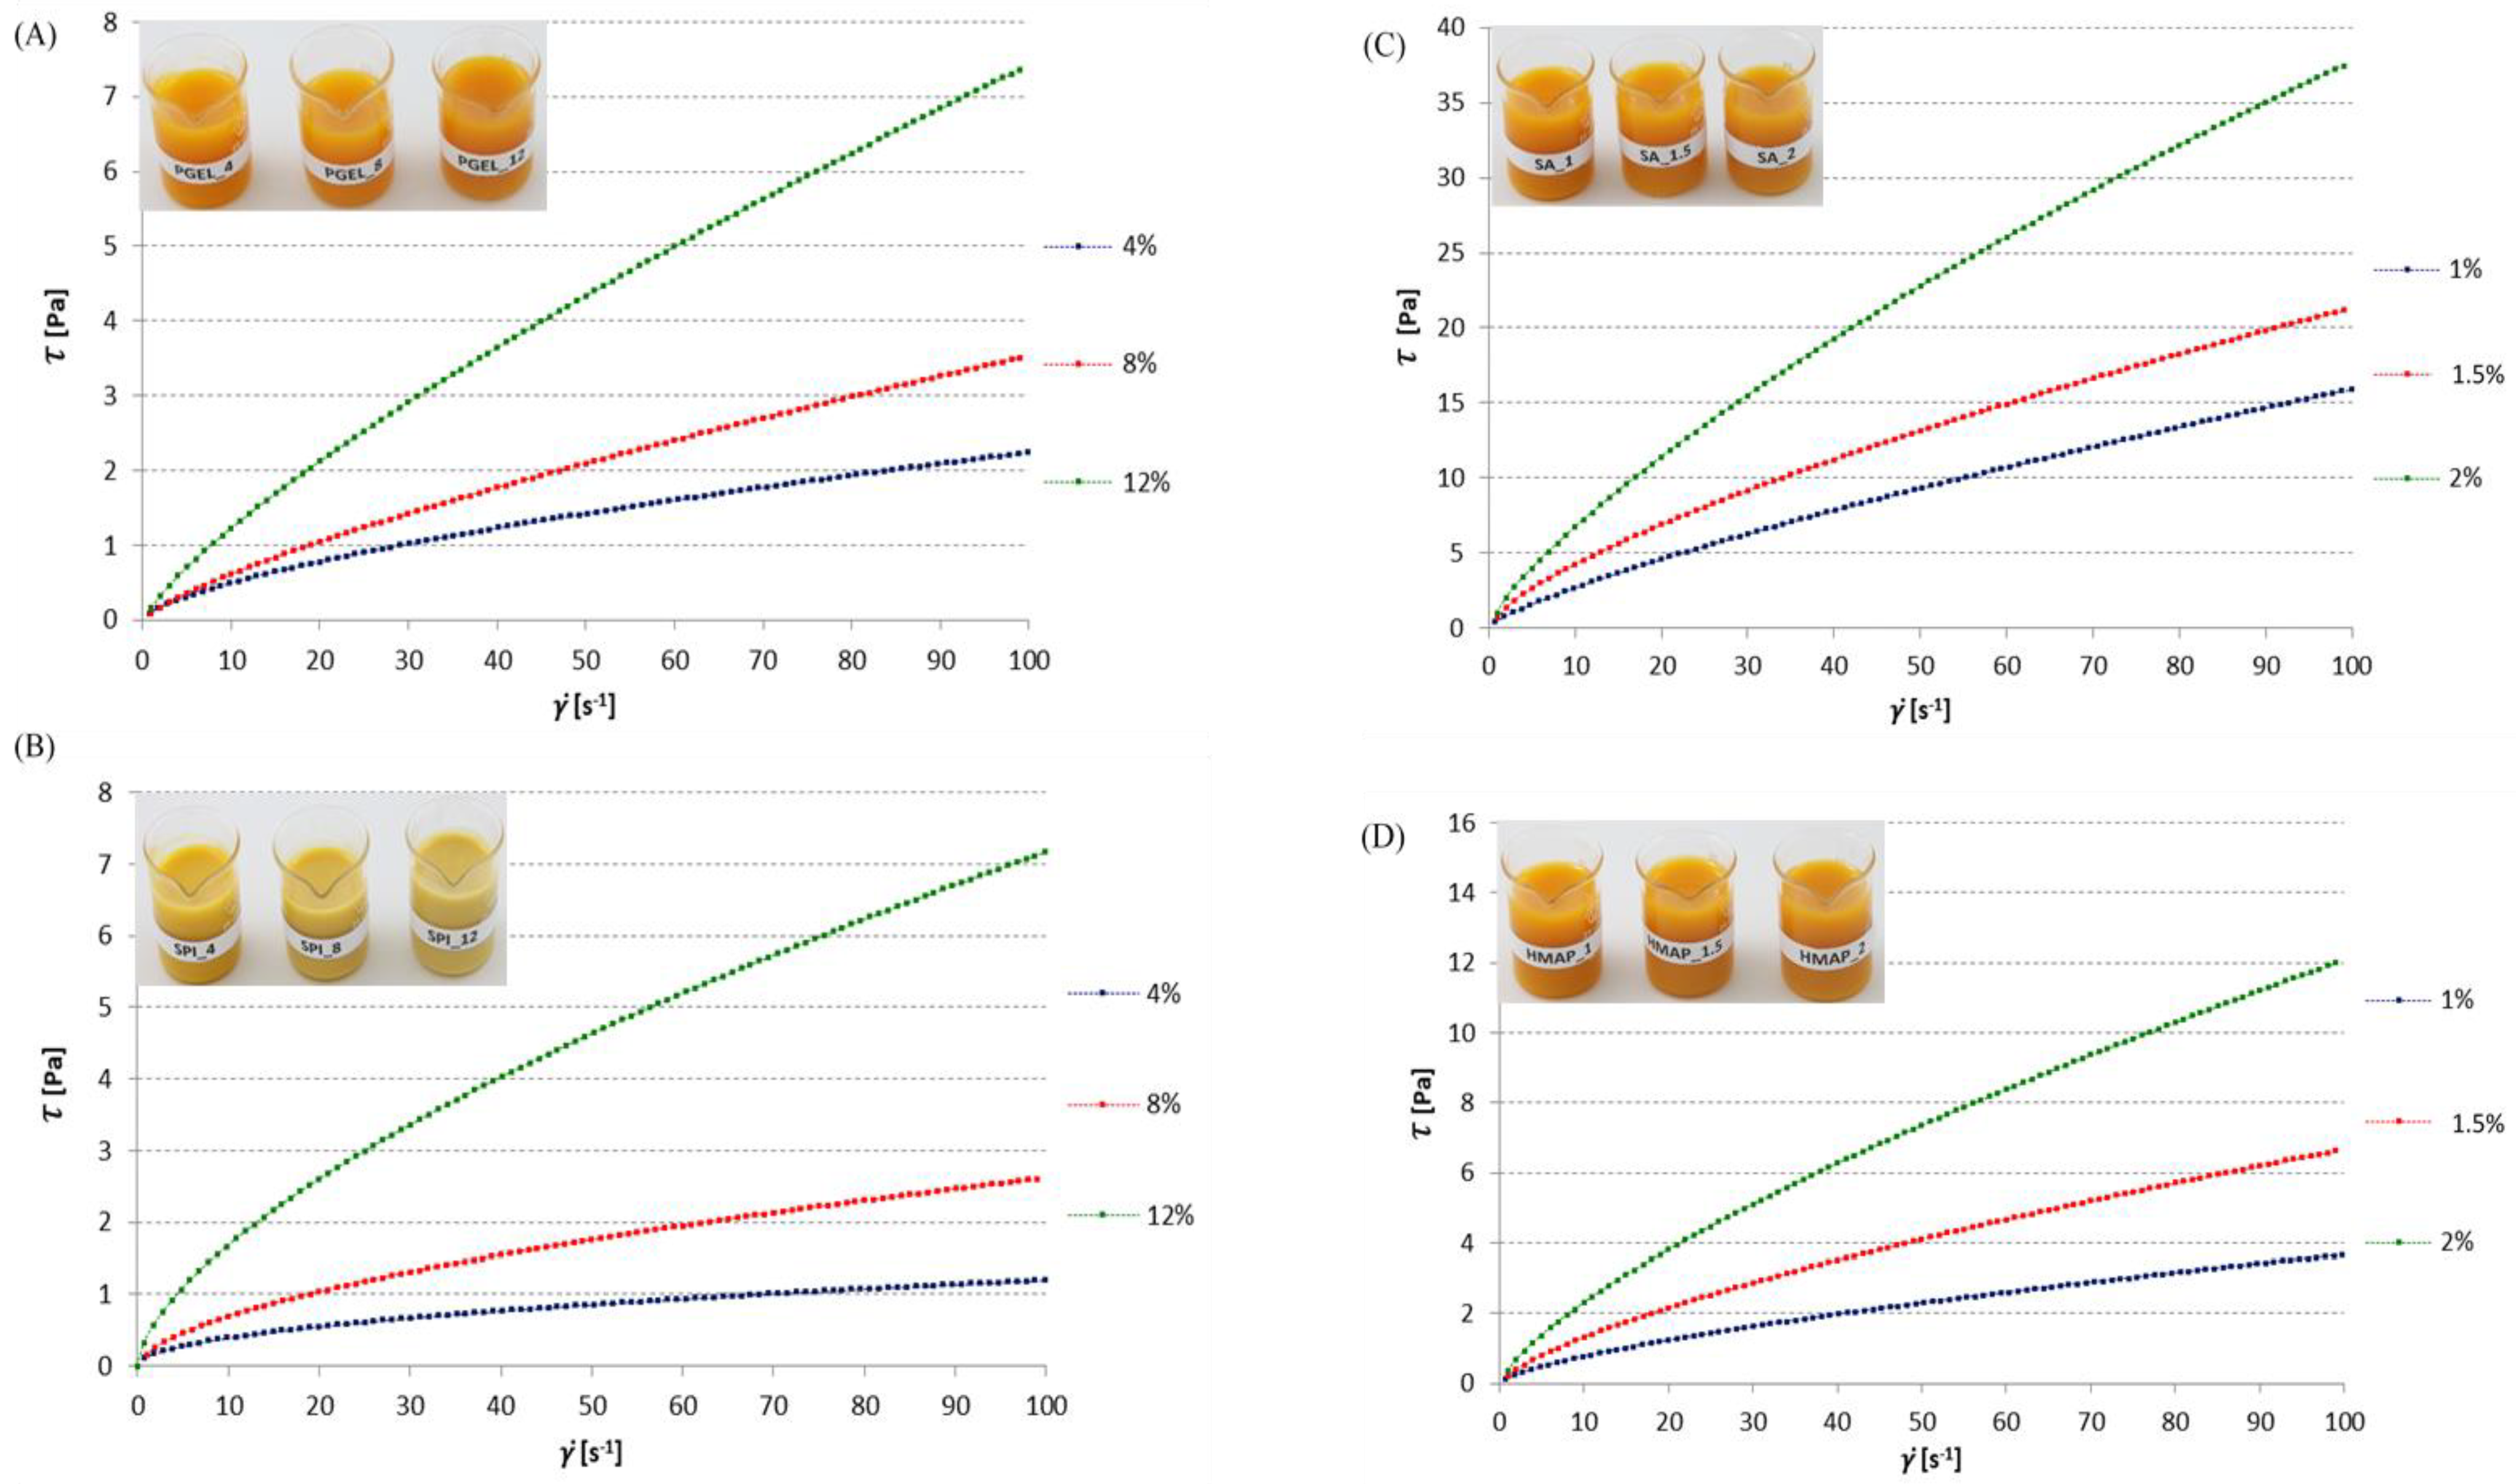
Figure 1. Flow curves of composite solutions with concentrations of protein and polysaccharide film-forming ingredients with the addition of pumpkin puree: (A) gelatine concentrations of 4 (PGEL_4), 8 (PGEL_8) and 12% (PGEL_12); (B) soy protein isolate concentrations of 4 (SPI_4), 8 (SPI_8), and 12% (SPI_12); (C) sodium alginate concentrations of 1 (SA_1), 1.5 (SA_1.5) and 2% (SA_2); (D) highly methylated apple pectin concentrations of 1 (HMAP_1), 1.5 (HMAP_1.5) and 2% (HMAP_2).
Applsci 13 06959 g001
Figure 2. Comparison of gelation curves of gelatine (PGEL_) without and with the addition of pumpkin purée: (A) PGEL concentration 4%; (B) PGEL concentration 8%; (C) PGEL concentration 12%.
Applsci 13 06959 g002
Figure 3. Comparison of gelation curves of composite protein isolate solutions (SPI_) without and with the addition of pumpkin purée: (A) SPI concentration 4%; (B) SPI concentration 8%; (C) SPI concentration 12%.
Applsci 13 06959 g003
Figure 4. Comparison of gelation curves of composite solutions of (A) high-methylated apple pectin (HMAP) and (B) sodium alginate (SA).
Applsci 13 06959 g004
Figure 5. Structure of films obtained on the basis of composite 4% gelatine solutions (PGEL_4) with the addition of pumpkin puree: (A) film surface before degassing, (B) after degassing, (C) film cross-section before degassing, (D) after degassing. Magnification 300 times.
Applsci 13 06959 g005
Figure 6. Structure of films obtained on the basis of composite 8% gelatine solutions (PGEL_8) with the addition of pumpkin puree: (A)—film surface before degassing, (B)—after degassing—magnification 300 times, (C)—film cross-section before degassing, (D)—after degassing.—magnification 1800 times; (E)—macro matrix surface of films made on the basis of composite gelatine solutions with the addition of pumpkin puree.
Applsci 13 06959 g006
Table 1. The raw material composition of the tested solutions and films was obtained on their basis.
Type of HydrocolloidConcentration of Hydrocolloid [%]Glycerol [%]Concentration of Pumpkin Purée [%]Initial Temperature [°C]Final Temperature [°C]
Gelatine
PGEL
4 *50403010
850403010
1250404010
Soy protein isolate
SPI
45040200
85040200
125040200
Sodium alginate
SA
15040200
1.55040200
25040200
High-methylated apple pectin
HMAP
15040250
1.55040250
25040250
* Number index (4, 8, 12 and 1, 1.5, 2)—addition of hydrocolloid [% (w/v)].
Table 2. Rheological parameters and results of correlation analysis of tested solutions of selected hydrocolloids with pumpkin puree.
Gelatin (PGEL)
Concentration [%]knR2Apparent viscosity [Pa·s]
40.11010.654410.0285 ± 0.0000
80.10980.75240.9990.0417 ± 0.0000
120.20960.77330.9990.0860 ± 0.0001
Statistical analysis of the effect of pumpkin puree concentration and addition on the apparent viscosity of gelatine solutions
SSDegrees of freedomMSFp-value
The addition of pumpkin puree0.00954710.00954735305.940.000
Solution concentration0.00343720.0017196354.920.000
The addition of pumpkin puree concentration0.00209220.0010463868.560.000
Soy protein isolate (SPI)
Concentration [%]knR2Apparent viscosity [Pa·s]
40.13100.48160.9990.0170 ± 0.0004
80.18580.57370.9990.0350 ± 0.0003
120.39410.630110.0927 ± 0.0004
Statistical analysis of the effect of pumpkin puree concentration and addition on the apparent viscosity of soy protein isolate solutions
SSDegrees of freedomMSFp-value
The addition of pumpkin puree0.00907310.009073137739.30.000
Solution concentration0.00518520.00259239352.90.000
The addition of pumpkin puree concentration0.00422720.00211332083.40.000
Sodium alginate (SA)
Concentration [%]knR2Apparent viscosity [Pa·s]
10.45550.771810.1866 ± 0.0007
1.50.86420.695110.2621 ± 0.0011
21.2580.738510.4522 ± 0.0014
Statistical analysis of the effect of pumpkin puree concentration and addition on the apparent viscosity of sodium alginate solutions
SSDegrees of freedomMSFp-value
The addition of pumpkin puree0.21191010.211910343554.40.000
Solution concentration0.08432710.084327136713.60.000
The addition of pumpkin puree concentration0.02878710.02878746670.40.000
High-methylated apple pectin (HMAP)
Concentration [%]knR2Apparent viscosity [Pa·s]
10.16440.67460.99910.0460 ± 0.0001
1.50.26940.69600.99950.0820 ± 0.0011
20.45260.71220.99990.1468 ± 0.0010
Statistical analysis of the effect of pumpkin puree concentration and addition on the apparent viscosity of high-methylated apple pectin solutions
SSDegrees of freedomMSFp-value
The addition of pumpkin puree0.02498310.02498399200.00.000
Solution concentration0.00790410.00790431383.50.000
The addition of pumpkin puree concentration0.00733210.00733229114.00.000
Statistical analysis of the correlation between the concentration of the tested hydrocolloid solutions and the apparent viscosity of the tested solutions
Gelatin (PGEL)0.9649
Soy protein isolate (SPI)0.9864
Sodium alginate (SA)0.9608
High-methylated apple pectin (HMAP)0.9487
Table 3. Comparison of the gelling temperature [°C] of gelatine solutions (PGEL) without and with the addition of pumpkin puree in three concentrations at the cooling rate of 3 K/min.
Gelatine (PGEL)
Concentration [%]Gelation temperature of the solution without puree [°C]Gelation temperature of the solution with the addition of puree [°C]
419.74 ± 0.30 b *16.64 ± 0.02 a
823.21 ± 0.31 d21.26 ± 0.09 c
1222.97 ± 0.25 d24.31 ± 0.21 e
Statistical analysis of the effect of pumpkin puree concentration and addition on the apparent viscosity of gelatine solutions
SSDegrees of freedomMSFp-value
The addition of pumpkin puree96.155248.078749.50.0·1020
Solution concentration6.94416.944108.30.0·1020
The addition of pumpkin puree concentration15.61427.807121.70.0·1020
* Different letters indicate significant differences determined at p < 0.05.
Disclaimer/Publisher’s Note: The statements, opinions and data contained in all publications are solely those of the individual author(s) and contributor(s) and not of MDPI and/or the editor(s). MDPI and/or the editor(s) disclaim responsibility for any injury to people or property resulting from any ideas, methods, instructions or products referred to in the content.