Article

Integration of Geoscience Information for Disaster Resilience in Kuala Lumpur, Malaysia

by
Elanni Affandi
1,
Tham Fatt Ng
1,* and
Joy Jacqueline Pereira
2
1
Department of Geology, University of Malaya, Kuala Lumpur 50603, Malaysia
2
Southeast Asia Disaster Prevention Initiative (SEADPRI-UKM), Universiti Kebangsaan Malaysia, Bangi 43600, Malaysia
*
Author to whom correspondence should be addressed.
Appl. Sci. 2023, 13(12), 7004; https://doi.org/10.3390/app13127004
Submission received: 20 February 2023 / Revised: 2 June 2023 / Accepted: 6 June 2023 / Published: 10 June 2023
(This article belongs to the Special Issue Urban Resilience and Environmental Land Planning)

Abstract

:
Geoscience information supports strategic development planning for building disaster resilience in Kuala Lumpur, Malaysia, which is a city challenged by issues such as landslides, floods and unfavourable ground conditions. Aspects such as the subsurface setting and susceptibility to hazards offer insights to resolve risks that are expected to worsen with climate change. Geoscience data were collated from field investigation and other sources for spatial integration using geographic information system software. The information on engineering ground conditions and susceptibility to geohazards was then combined to demarcate zones that are suitable for urban development. This approach can be applied to other cities so that relevant geoscience information is integrated for planning and decision making in a changing climate. The findings reveal that 20% of the city has high suitability for development and is generally not prone to climate hazards. About 80% of the land area in Kuala Lumpur has medium to high ground constraint, and this includes around 25% of the city area that is susceptible to landslides and floods. In the worst-case scenario where no action is taken, communities and urban assets within these susceptible areas would be exposed and vulnerable to more landslides and floods due to climate change. Additional development should be limited in such areas, and where already developed, targeted hazard-specific measures can be taken to build resilience.

1. Introduction

The concept of resilience refers to the ability of a system to “bounce back” or reorganise and return to its original condition after encountering a sudden shock [1,2,3]. A widely accepted definition for disaster resilience is “the ability of a system, community or society exposed to hazards to resist, absorb, accommodate and recover from the effects of a hazard in a timely and efficient manner, including through the preservation and restoration of its essential basic structures and functions” [4]. Resilience is closely linked to disaster risk response and capacity to recover [5,6]. Actions on disaster prevention, mitigation, preparedness, response and recovery collectively contribute to building resilience. This is important for cities where climate change is expected to increase impacts on communities and infrastructure and disrupt essential amenities [7].
Cities are complex and interdependent systems, requiring effective mechanisms to cope with climate hazards as the expected impacts are greater due to high population density, extensive infrastructure and limited resources [5,8,9]. The global agenda to “make cities inclusive, safe, resilient and sustainable” is embedded in the national policies of many countries [10]. Initiatives for strengthening disaster resilience in cities include reducing the vulnerability and exposure of communities, their assets and surrounding areas to hazards [3,11]. Risk reduction to climate hazards including the forecasting of disruptive events in cities is increasingly important to reduce losses [8,12,13,14,15]. Building city resilience requires a holistic approach that can be measured by four main aspects comprising economy, organisation, environment and society [1].
With respect to the physical environment, the potential of geoscience information, which includes data and knowledge about the Earth and its systems, is becoming increasingly recognised [16,17,18,19,20]. Local-level geoscience information can be obtained from multiple agencies and site investigations conducted for ongoing development projects, which are an added source for cities with limited records. Very often, such information has to be digitised and geo-referenced into geospatial data before being used in geographic information system (GIS) software. The incorporation of geoscience perspectives using GIS is common in the development planning process, and it allows stakeholders to take into account engineering geology conditions and susceptibility to geohazards [18,21].
Land evaluation through land-use suitability modelling is a common practice prior to development [22,23,24,25]. The process involves a scientific method for assessing ground conditions using geoscience information, which is critical to achieving an optimum utilisation of available land resources by recognising the potential and limitation of the area for a defined use [26,27,28]. Susceptibility modelling draws on local geoscience information to delineate areas with potential for geohazards to occur based on local geological, geomorphological and other physical conditions, which are mapped through field observation or remote sensing. Rainfall is not often used as a parameter for susceptibility modelling for landslides [29]. However, it is commonly used as a parameter for floods [30]. In this study, rainfall is considered as a trigger factor, and it is not used as a parameter for susceptibility modelling [18,29,31,32]. While the zoning of an area using suitability modelling is not new [22,23,24,25,33], many studies do not use information on hazard susceptibility, and if they do so, the focus is on a single geohazard such as seismicity, flooding and groundwater pollution [34,35,36,37]. The combination of both engineering geology conditions and susceptibility to multiple geohazards facilitates risk reduction and helps in achieving a better understanding of the current challenges in cities for building resilience to disasters influenced by climate change [37,38,39]. Strategic planning framed by sustainable development is fundamental to the emerging science of resilience.
The purpose of the study is to highlight the role of geoscience information in supporting strategic development planning for disaster resilience in Kuala Lumpur. A novel approach is introduced for integrating geoscience information to determine engineering ground conditions and susceptibility to multiple geohazards, which are then combined to demarcate suitable zones for urban development and enhance the resilience in Kuala Lumpur, Malaysia. The capital city of Kuala Lumpur reported a population of 1.98 million in 2020 and an estimated projection of 2.43 million in 2040 [40]. A total of 76% of the area is urbanised to support its role as a global economic and tourism hub, with urban expansion at an average pace of 11% annually. The city is increasingly challenged by landslides, floods and unfavourable ground conditions. Land scarcity due to urbanisation is a major issue with increasing encroachment on land with geological constraints for development [41,42,43]. An expansion in the use of underground space, which is currently limited, is under consideration. This is seen as an alternative to minimise landslide risks in the rugged highlands of the city. The upcoming Kuala Lumpur Structure Plan 2040 (KLSP 2040) has highlighted strategies on climate change and disaster resilience for development planning in the city to ensure urban sustainability [40]. The findings of this study are expected to contribute to strategic development planning by demarcating areas for building disaster resilience in the city.

2. Materials and Methods

2.1. Study Area

The name Kuala Lumpur literally means ‘muddy confluence’ by the converging of two major rivers, i.e., the Klang River and Gombak River, which evolved into world-leading tin-mining areas. The study area spanning from 101°45′45″ E and 101°35′15″E longitude to 2°58′30″ N and 3°14′15″ N is located within the Selangor state, in central–west Peninsular Malaysia, measuring approximately 243 km2 [44,45,46]. The study area has a regular temperature of 29 to 32 °C with average relative humidity ranging from 65% to 70% throughout the year except in June, July and September. The tropical climate of the country becomes the primary factor for the triggering of slope failure and pluvial flood influenced by the strong winds from the Malacca Strait during the southwest monsoon season. Generally, the climate of the study area shows high and constant annual average temperature with occasional rain and high moisture; the recorded daily average precipitation during this period could double up to 20–50 mm daily compared to 10–25 mm on normal days. This condition influences the hydrogeological and geomorphological state of the study area.
Kuala Lumpur’s topography is generally flat to undulating, with some hilly areas. About 90% of the city is between 10 and 100 m above sea level. Most of the flat areas are occupied by the central alluvial plain distributed along the Kelang River and its tributaries, and they are underlain by the Kuala Lumpur Limestone. The hilly areas are represented by granite and schist with an elevation of 50 to 300 m and 50 to 150 m, respectively. The Kenny Hill Formation is seen as rolling to undulating hills on the western and southern margin with low relief (~50 m), which has been subjected to intense development and modification of the landform.
In terms of geological setting, Kuala Lumpur is in the central area of the Western Belt of Peninsular Malaysia. The oldest geological formation (Cambrian—Ordovician) is represented by the meta-volcanics and quartz-mica schist of Dinding schist in the northeastern Kuala Lumpur (Figure 1). The Hawthornden Schist aged as Ordovician to Lower Silurian distributed at the western margin of the former unit is characterised by mainly graphitic quartz-mica schist. The Kuala Lumpur Limestone (Middle to Upper Silurian) represents a metamorphosed calcitic–dolomitic marble that occurs mainly in the northern and east–central area. The formation is fully covered by alluvium, fill material and mine tailings with thickness up to 66 m as a result of alluvial tin mining activities in the past [47]. The Kenny Hill Formation of Permian to Carboniferous age found mainly in the southern and central parts of the city comprises interbedded phyllite and quartzite. The Kuala Lumpur granite is characterised by megacrystic coarse-grained biotite granite distributed in the western and southeastern Kuala Lumpur [48]. The city is mostly covered by superficial deposits developed from natural processes, namely residual soils and alluvium; however, mine tailings, fill and reclamation are developed from anthropogenic activities [45,49]. Soils developed over the schists, Kenny Hill Formation and granite average 13 m, 9 m and 15 m thick, respectively.
Kuala Lumpur is facing a number of challenges in the context of resilience. Rapid urbanization has put a strain on the city’s infrastructure and resources, making it more vulnerable to climate-induced disasters. The city’s geological and geomorphological conditions make it more susceptible to landslides and floods. These disasters cause significant damage to property, infrastructure and affect the livelihood of impacted communities. Climate change is making extreme weather events more common, and proactive steps are required to address these challenges. A robust approach has recently been introduced to delineate areas susceptible to landslides and floods, but more work is required to link this to the planning process [18,50].
Figure 1. Geological map of the Kuala Lumpur area. The city of Kuala Lumpur is located within the Selangor state, in central–west Peninsular Malaysia (modified after Gobbett, 1964 [51] and Yin, 1986 [52] and Affandi et al., 2023 [18]).
Applsci 13 07004 g001

2.2. Acquisition of Geoscience Information

Borehole records from 1979 to 2015 were obtained from site investigation reports within the archives of the Department of Mineral and Geoscience (JMG) and supplemented with data from IKRAM, which is an engineering consultant company affiliated with the Malaysia Public Works Department. The data from 1650 boreholes in previous studies and site investigation reports were mainly in hard copy format. The information was digitised and reorganised into an inventory. The historical landslide inventory includes 700 points obtained from JMG, whereas the landslide inventory of December 2021 was recorded from field observation by the authors. The main dataset comprises 2014 Light Detection and Ranging (LiDAR) topographic data obtained from the Kuala Lumpur City Hall (DBKL) in the form of a Digital Terrain Model (DTM) with a pixel size of 1 m. The DTM was used for landslide and flood susceptibility modelling. The flood model required inputs of local datasets such as DBKL boundary, building footprints and land use vector layers, river gauge data from the Kuala Lumpur Drainage and Irrigation Department as well as the Malaysian Meteorological Department. Aerial photographs and topographic maps of various scales from the Department of Survey and Mapping Malaysia were used to assess temporal and spatial land use changes. This is critical to identify the areas affected by past tin-mining activities and reclamation works. Digital orthorectified aerial photographs were sourced from DBKL, while satellite images were downloaded freely from the United States Geological Survey (USGS) public domain accessed through the website (https://earthexplorer.usgs.gov/, accessed on 18 December 2017) for the same purpose. The input base maps were acquired from relevant government agencies in both hard copy and soft copy format. The geological data of the study area are primarily from field investigation and were used to update and supplement available information for the spatial analysis.

2.3. Assessment of Geoscience Information

The GIS software ArcGIS 10.5 was used to conduct spatial data acquisition, processing and visualisation due to its accessibility and prevalent use across the field. The data analysis was completed in MS Excel and ArcGIS before reinterpretation was carried out and presented as various maps. The urban development suitability analysis was completed using a computer-assisted overlay approach to evaluate the selected factors in raster format [22]. It enables the combination and transformation of spatial input data into a resultant decision. Subsequently, the overlay technique involves applying a common measurement scale of values to the input to indicate the influence of the factors towards the urban development suitability prior to zonation of the prevalent suitability classes [26]. The overview of the general workflow is shown in Figure 2 and described as follows.
  • Assessment of engineering geology condition
The engineering properties acquired from previous research and borehole logs of past site investigation reports were digitised and organised in an inventory for analysis to determine the engineering characteristics of each formation. The engineering ground classification (EGC) map was established based on expert judgement using five criteria. A similar expert judgement overlay method has been used to assess engineering geological for development suitability [28,53]. The five criteria are the ground stability, aggregate potential, engineered fill, foundation and excavatability of the ground materials in the study area. Values of 1, 2, 3 and 4 are given to the engineering performance for groundwork indicating ranks of very poor, poor, moderate and good, respectively. The classification of the EGC map into five classes (namely, Class I—Excellent, Class II—Good, Class III—Fair, Class IV—Poor and Class V—Unpredictable) is based on the scoring matrix, where the suitability increases with score (figure in Section 3.1). Consideration of the external factors on ground constraint contributes to the evaluation of the material and the ranking process. This included the surrounding geomorphology and past mining activities, which had modified the condition of the surficial material and bedrock.
  • Assessment of geohazard susceptibility
Susceptibility assessment of landslides was conducted using ArcGIS to process the landslide-controlling factors derived from the input base maps. The landslide susceptibility modelling in this study adopted a bivariate statistical approach which involves the selection of landslide-controlling factors and the respective classes of a feature to be compared with a reliable past landslide occurrences map [54,55]. Seven landslide-controlling factors were selected using expert judgement which included slope gradient, surface material, distance to lineament, distance to road, elevation, roughness and topographic position index (TPI). The surface geology is determined by referring to the geological map, aerial photographs, topographic map and field mapping. DTM is used to derive most of the landslide conditioning factors using geoprocessing in ArcGIS 10.5. The slope gradient factor map shows the degree of inclination of the slope, while the elevation factor map represents the height above sea level. Surface roughness indicates the degree of variation of surface elevation derived from the average standard deviation calculated from a 10 m by 10 m moving window. The distance to lineament shows the distance to fault and lineament in metres, which was interpreted from DTM and aerial photographs. The distance to road factor map was produced from the DBKL road map, which shows the distance to roads in metres. TPI was calculated as the difference between the elevation at a point, and the mean elevation within a 250 m radius circular window actually indicates the relative slope position [18]. The weighting value for each class factor maps represents the correlation factor with the landslide population determined by calculation of the natural logarithm of landslide density of each class within each factor divided by the overall landslide density as expressed in Equation (1) [56]. The reclassified factor maps using the respective statistical weightage were then overlain in ArcGIS to produce the final landslide susceptibility map using Equation (2). The results were classified into 5 classes represented by very low, low, moderate, high, and very high susceptibility-based percentiles of landslide occurrences [57]. The threshold criteria for each landslide susceptibility class were obtained by extracting the landslide index value at each landslide point. A graph of cumulative percentage of the landslide value was plotted against the susceptibility value. The threshold value was extracted from the 50th, 25th, 12.5th and 6.25th percentile of the susceptibility value. The spatial cross-validation and retrospective methods were used to validate the landslide susceptibility model [18].
W i = ln ( D e n s c l a s s D e n s m a p )
W i = ln N p x S i N p x N i N p x S i N p x N i
where Wi = weight given to a certain parameter class, Densclass = landslide density within the parameter class, Densmap = landslide density within the entire map, N p x S i = number of pixels with landslide occurrence in a certain parameter class, and N p x N i = total number of pixels in a certain parameter class.
LSI = WiSl + WiSm +WiDl + WiDr + WiEl + WiRo +WiTpi
where LSI = landslide susceptibility index, WiSl = weight of slope gradient, WiSm = weight of surface material, WiDl = weight of distance to lineament, WiDr = weight of distance to road, WiEl = weight of elevation, WiRo = weight of roughness and WiTpi = weight of topographic position index.
The flood susceptibility model was developed using JFlow®, which is a hydraulic modelling software developed by JBA Risk Management (JBA), United Kingdom. Benchmarking exercises conducted in 2012 revealed a high-performance model, producing fast and accurate representations of flow routing across flood plains. The 5 m grid model created using JFlow® and GIS was derived by using 1 m DTM to define the appropriate rainfall and river flow input with various flood return periods in the study area of Kuala Lumpur [58].
The model showcased a defended scenario where it considered the Stormwater Management and Road Tunnel (SMART) tunnel system and other flood mitigation projects emplaced within the city showing 20-, 50-, 100, and 200-year return periods. Flood susceptible areas were demarcated using two-dimensional flow paths to capture both river and pluvial floods [32,58]. Two types of validation were conducted. Comparison with historical flood events was used to validate the flood extent, and the discharge rates through culverts were used to validate the defended flood scenario [50].

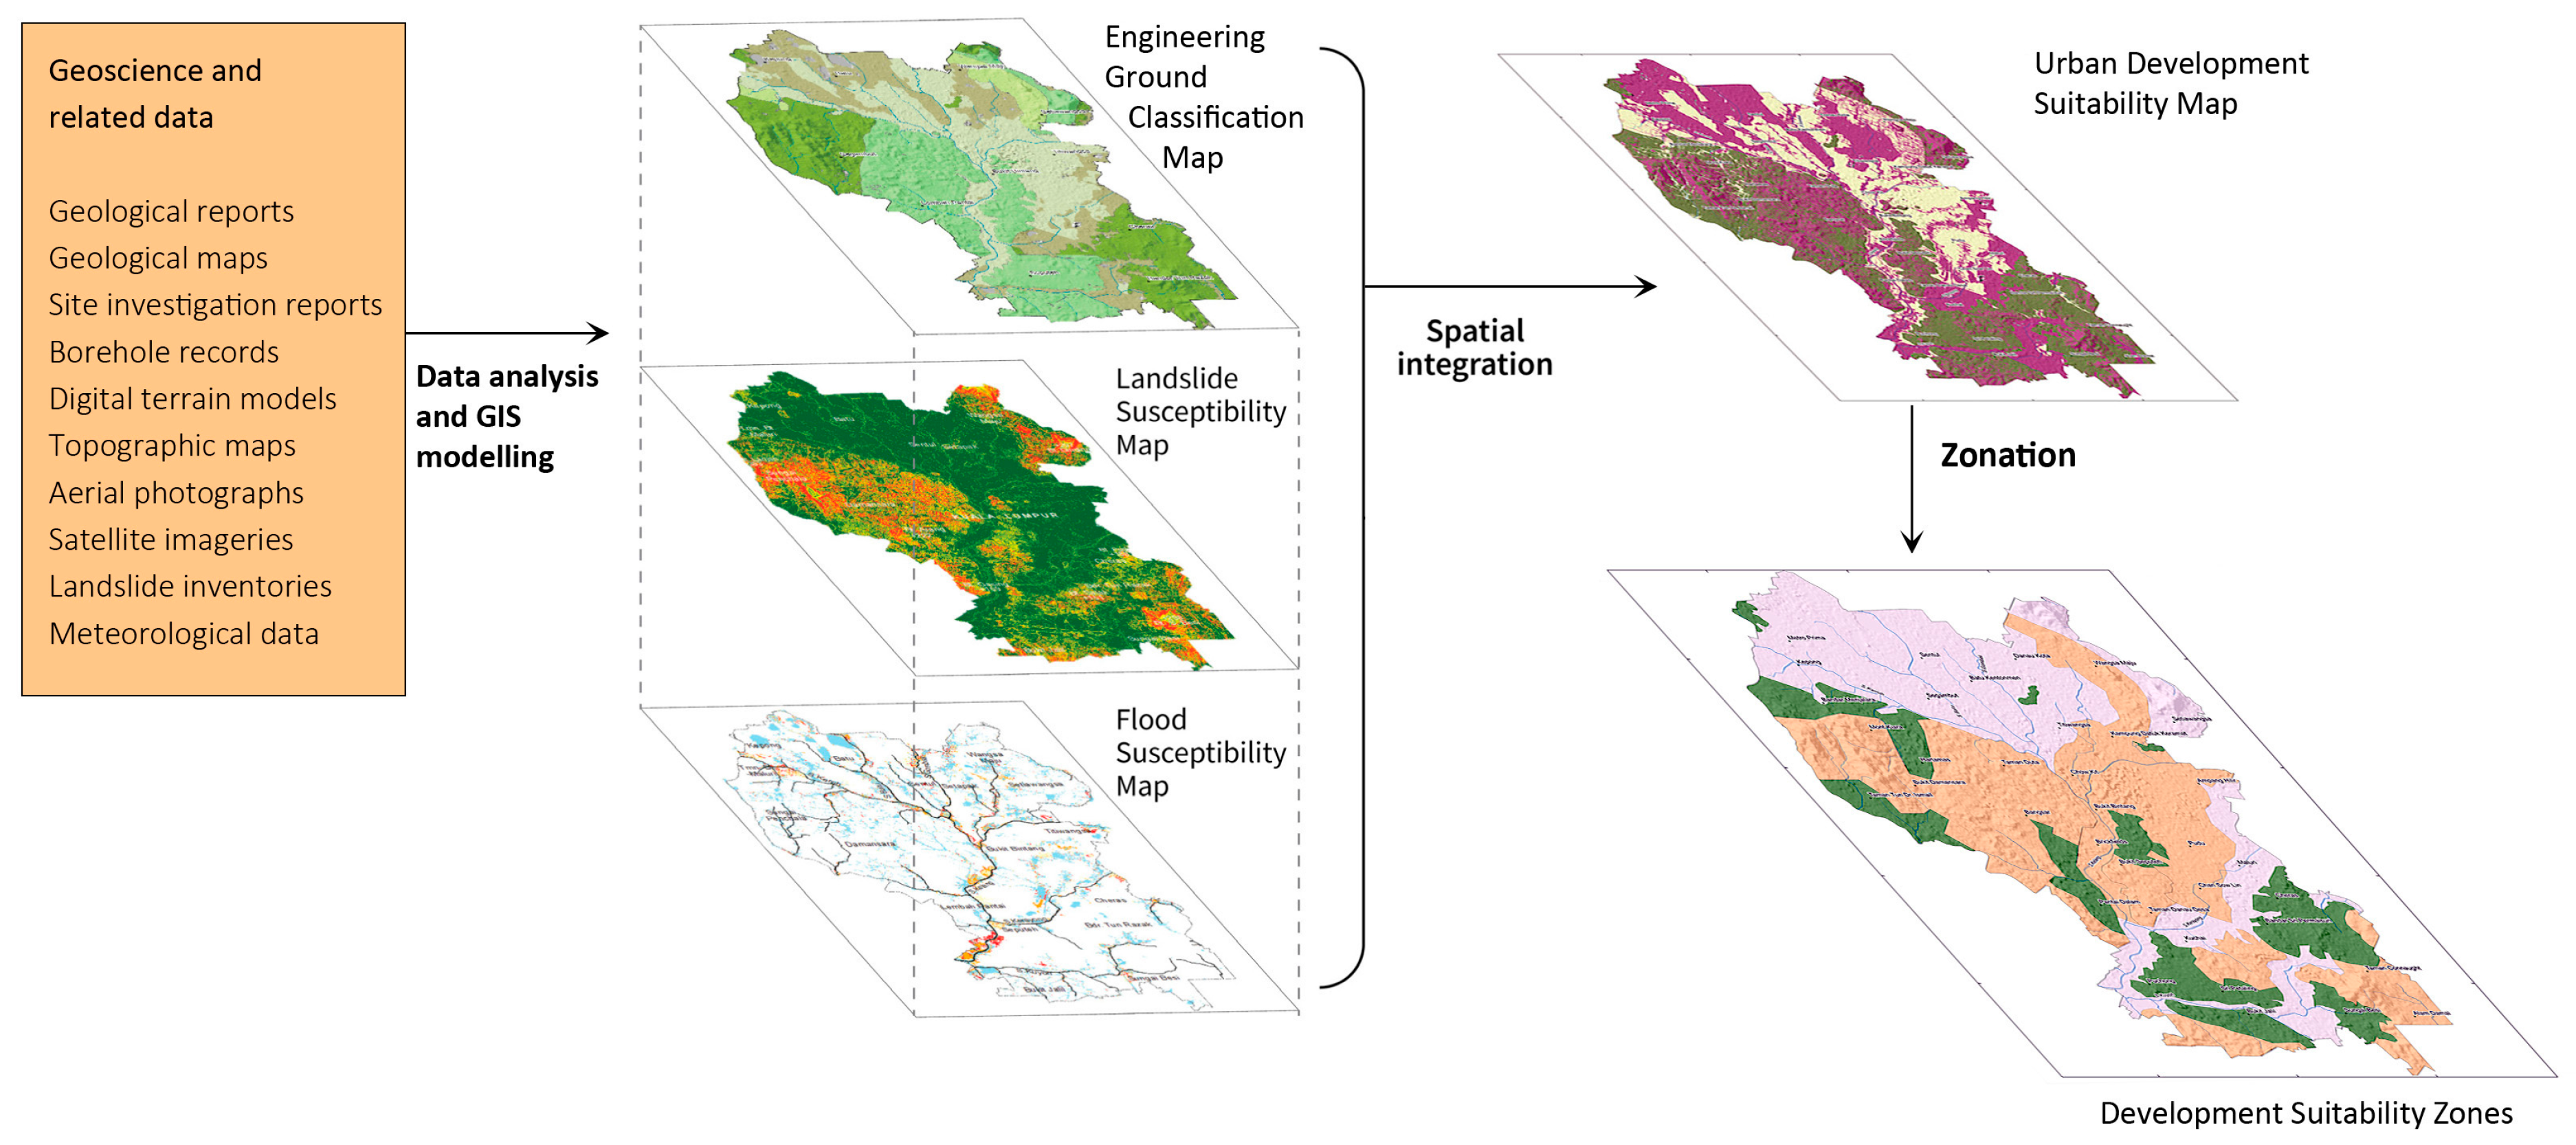
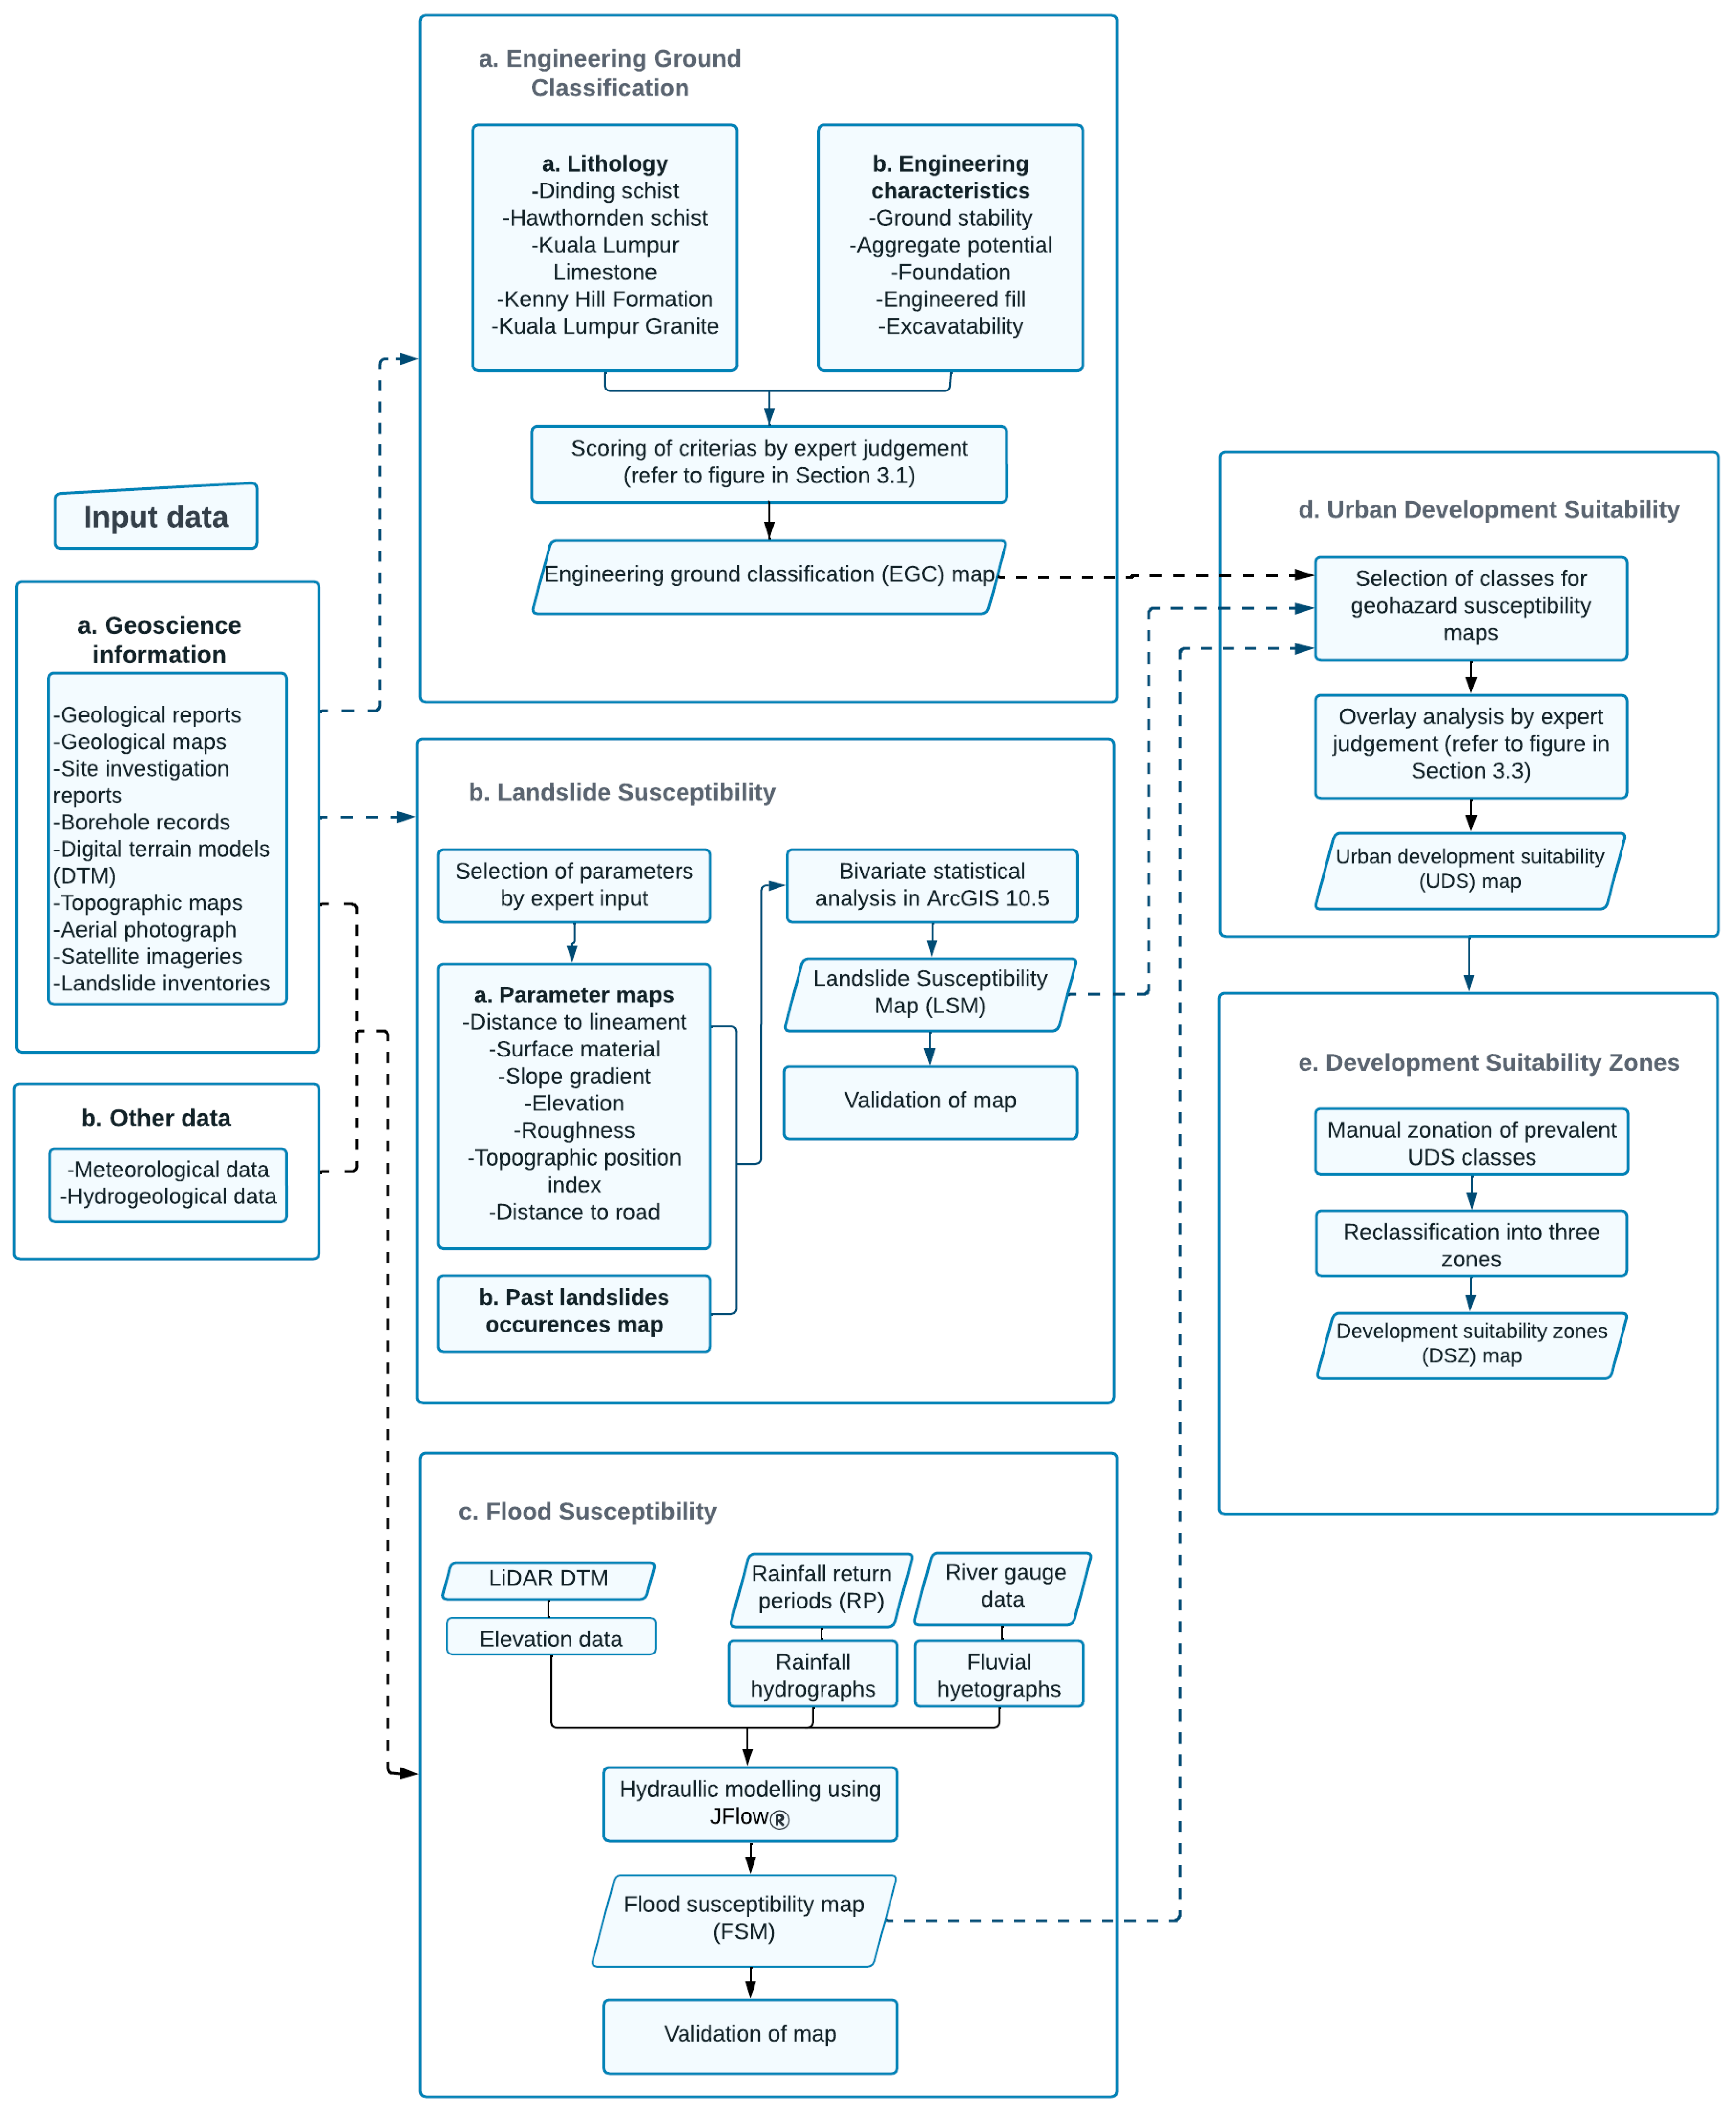
2.4. Integration of Geoscience Models and Zonation

Data acquired from different sources were incorporated using GIS where spatial integration was employed using a simple geostatistical method and qualitative evaluation. The geohazard susceptibility maps and engineering ground classification (EGC) map aim to visually deliver geoscience information effectively to wider target end-users and lessen the knowledge gap between different fields in urban development and disaster risk reduction initiatives. The complexity of the underlying ground interaction with the environment is able to be visually explained using the spatial thematic maps. Urban Development Suitability (UDS) is based on the notion that the occurrence of landslides and floods will reduce the suitability of an area for development. The criteria are based on potential occurrences of landslides and floods as well as engineering ground classification as presented in Table 1. Areas deemed to have potential landslides are those of high and very high susceptibility. The flood extent defined by 200-year return periods represents zones with potential for flooding. From the selected criteria, landslide is given a higher weightage because the intensity of landslide events is higher than that of floods [18,50]. Scores of 1, 3, 5, and 7 are given to negligible geohazard, flood, landslide and both geohazards (figure in Section 3.3). The five EGC classes are used directly for the overlay and given a score from 1 to 5 for Class I to Class IV, respectively. The product of the scores was calculated from geohazard susceptibility and EGC maps by the overlay analysis technique [28,53]. A negative relationship between the product of the scores and suitability was used; the smaller the score, the higher the suitability level for development. Expert judgement is used as a basis to manually classify the final UDS map using the range of values assigned to the three classes (UDS Class I—High, UDS Class II—Moderate, UDS Class III—Low). The UDS map is simplified where the whole city is divided into spatially contiguous zones based on the prevalent UDS classes. The final outcome is the zoning map of Kuala Lumpur, which delineates areas having similar classification on urban suitability for development defined by classes of I—high, II—moderate, and III—low. The process of developing the development suitability zones (DSZ) map is presented in the methodology flowchart shown in Figure 3.

3. Results

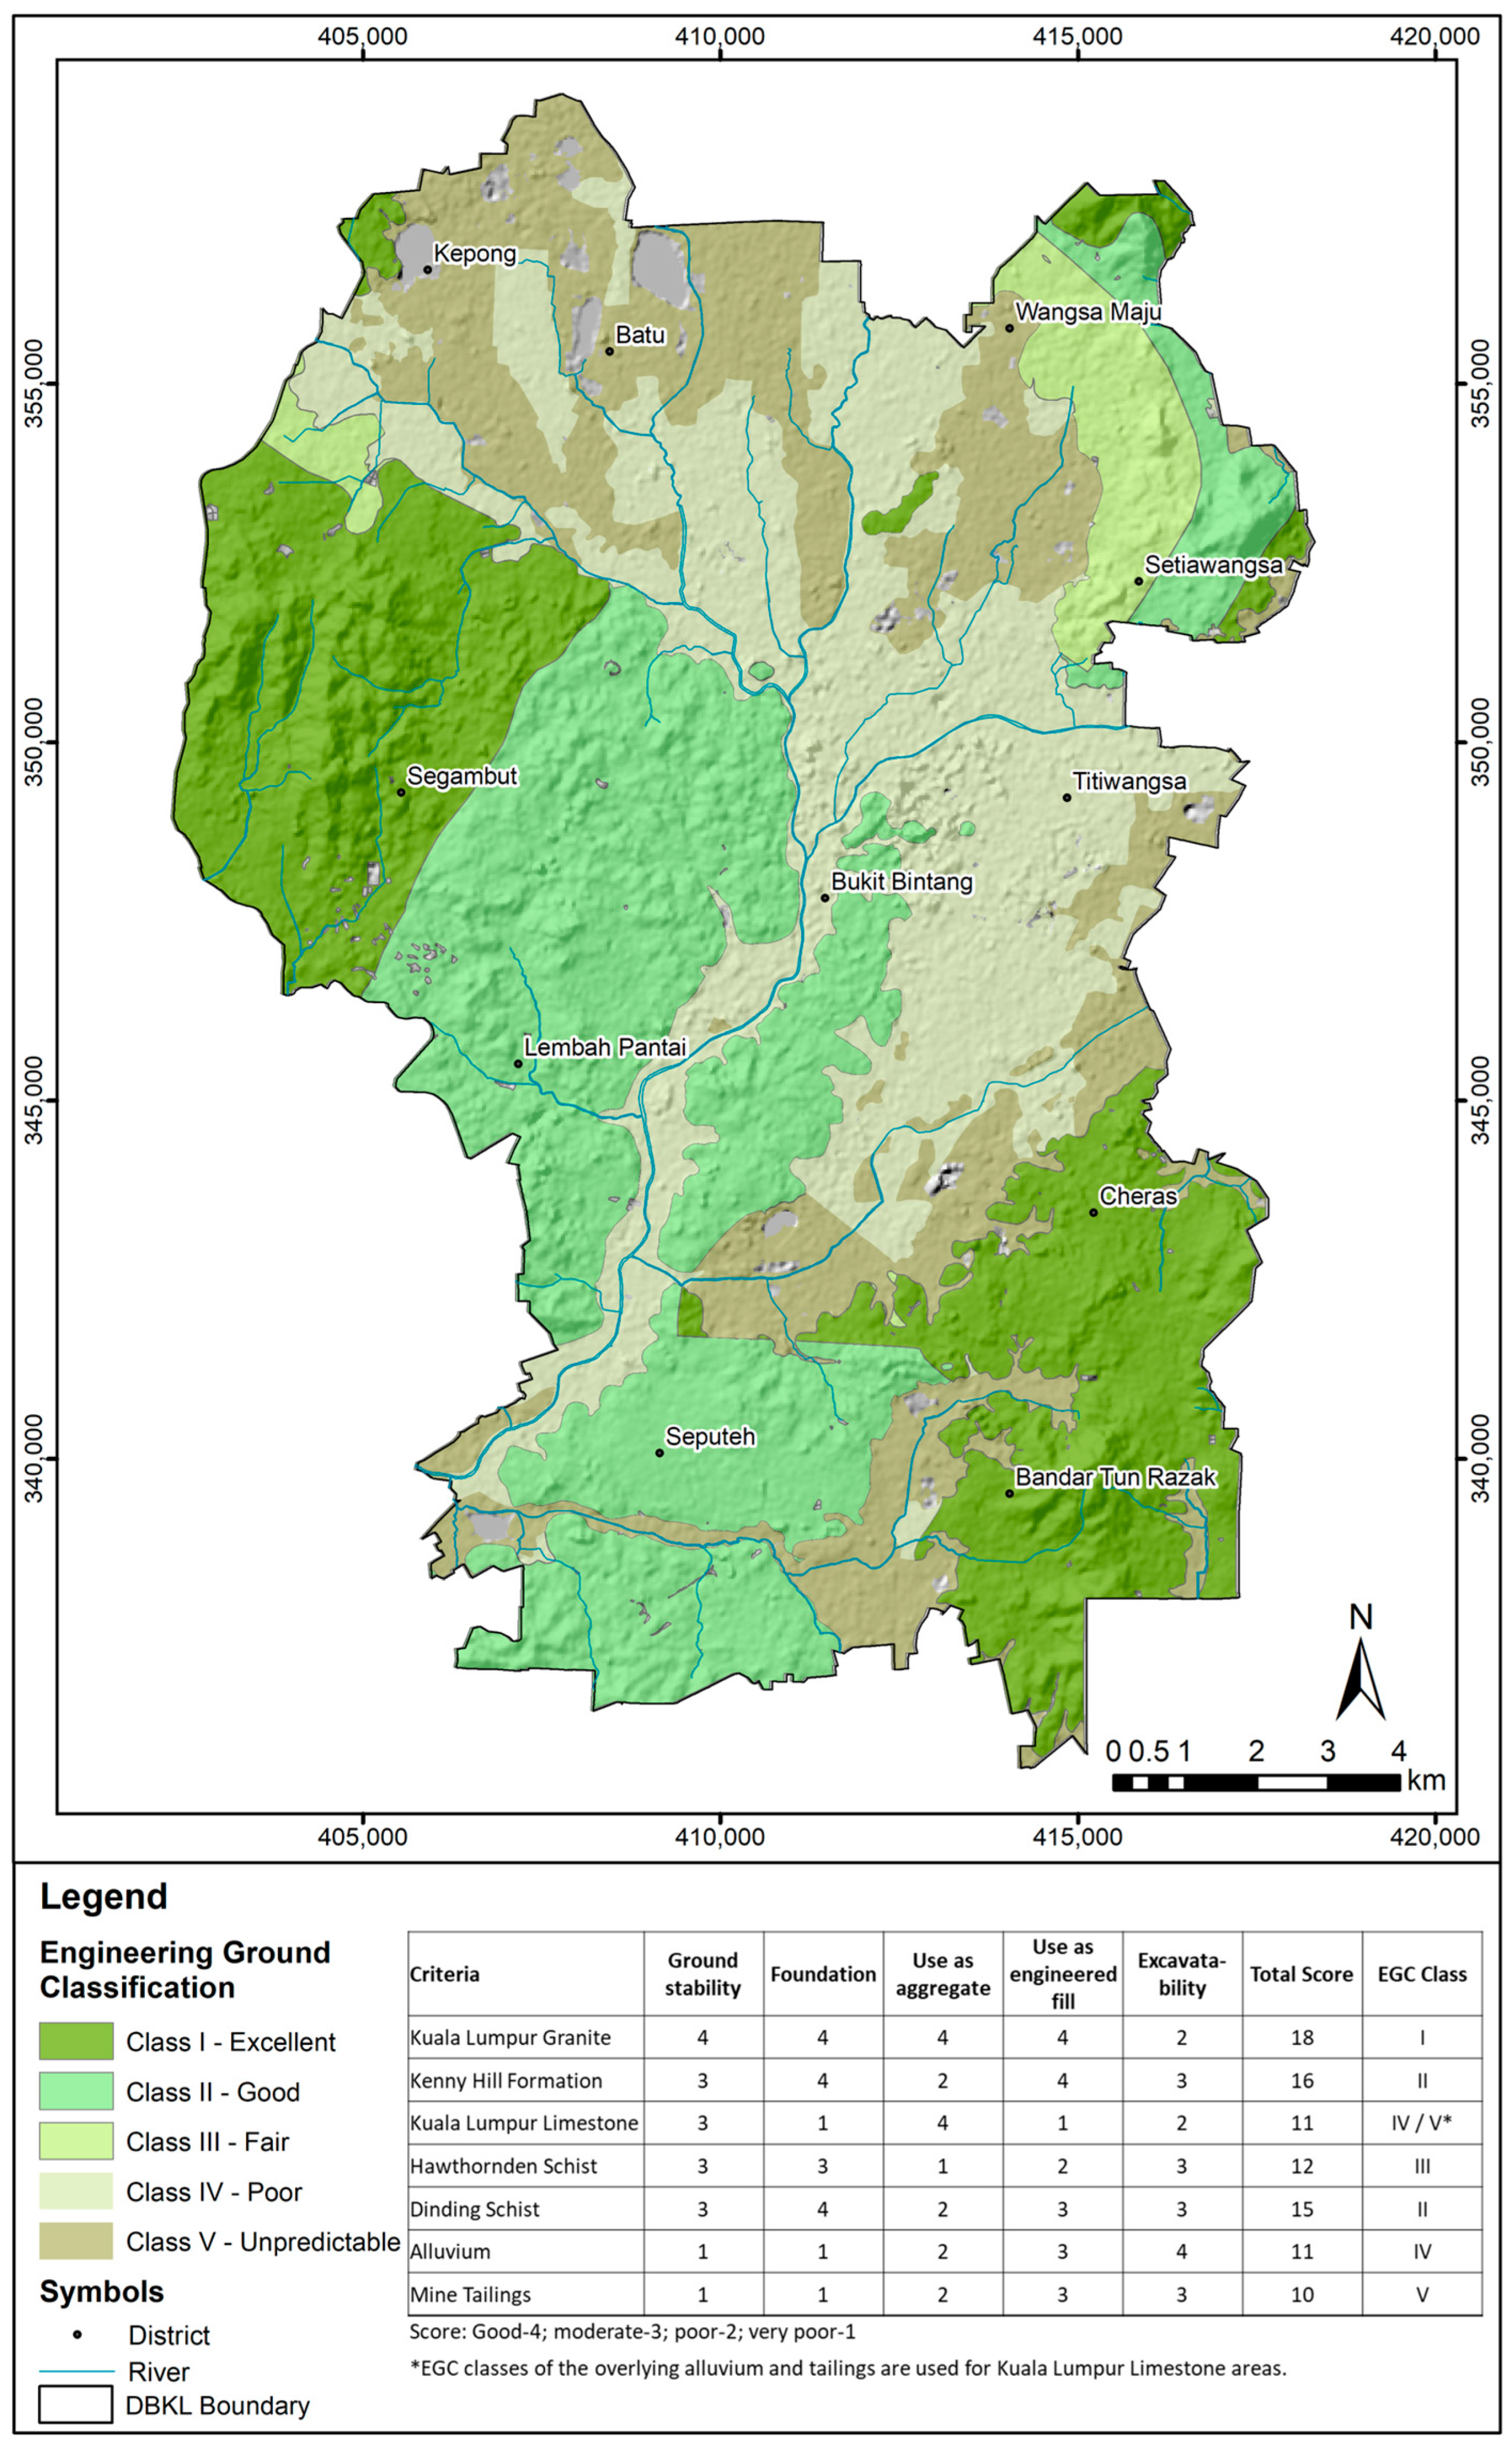
3.1. Engineering Ground Classification

The engineering ground classification (EGC) map gives an overview of the ground condition, including potential and limitation of the material as construction aggregates, engineered fill and foundation in engineering work, as well as stability in terms of slope failure and ground settlement. The five classes determined by ground condition in decreasing order are Class I—Excellent (22.4%), Class II—Good (26.5%), Class III—Fair (3.8%), Class IV—Poor (23.3%), and Class V—Unpredictable (22.1%) (Figure 4). Consequently, the order of the classes relates to the increasing level of ground constraints. Class I to Class III is represented by the in situ material, which is represented by both bedrock and residual soil and indicates the overall stability and ability of the material to support engineering work. However, Class IV and Class V areas are covered by transported material mostly found overlain the pinnacled bedrock of Kuala Lumpur Limestone and characterised by its high ground constraint due to the unfavourable engineering properties.

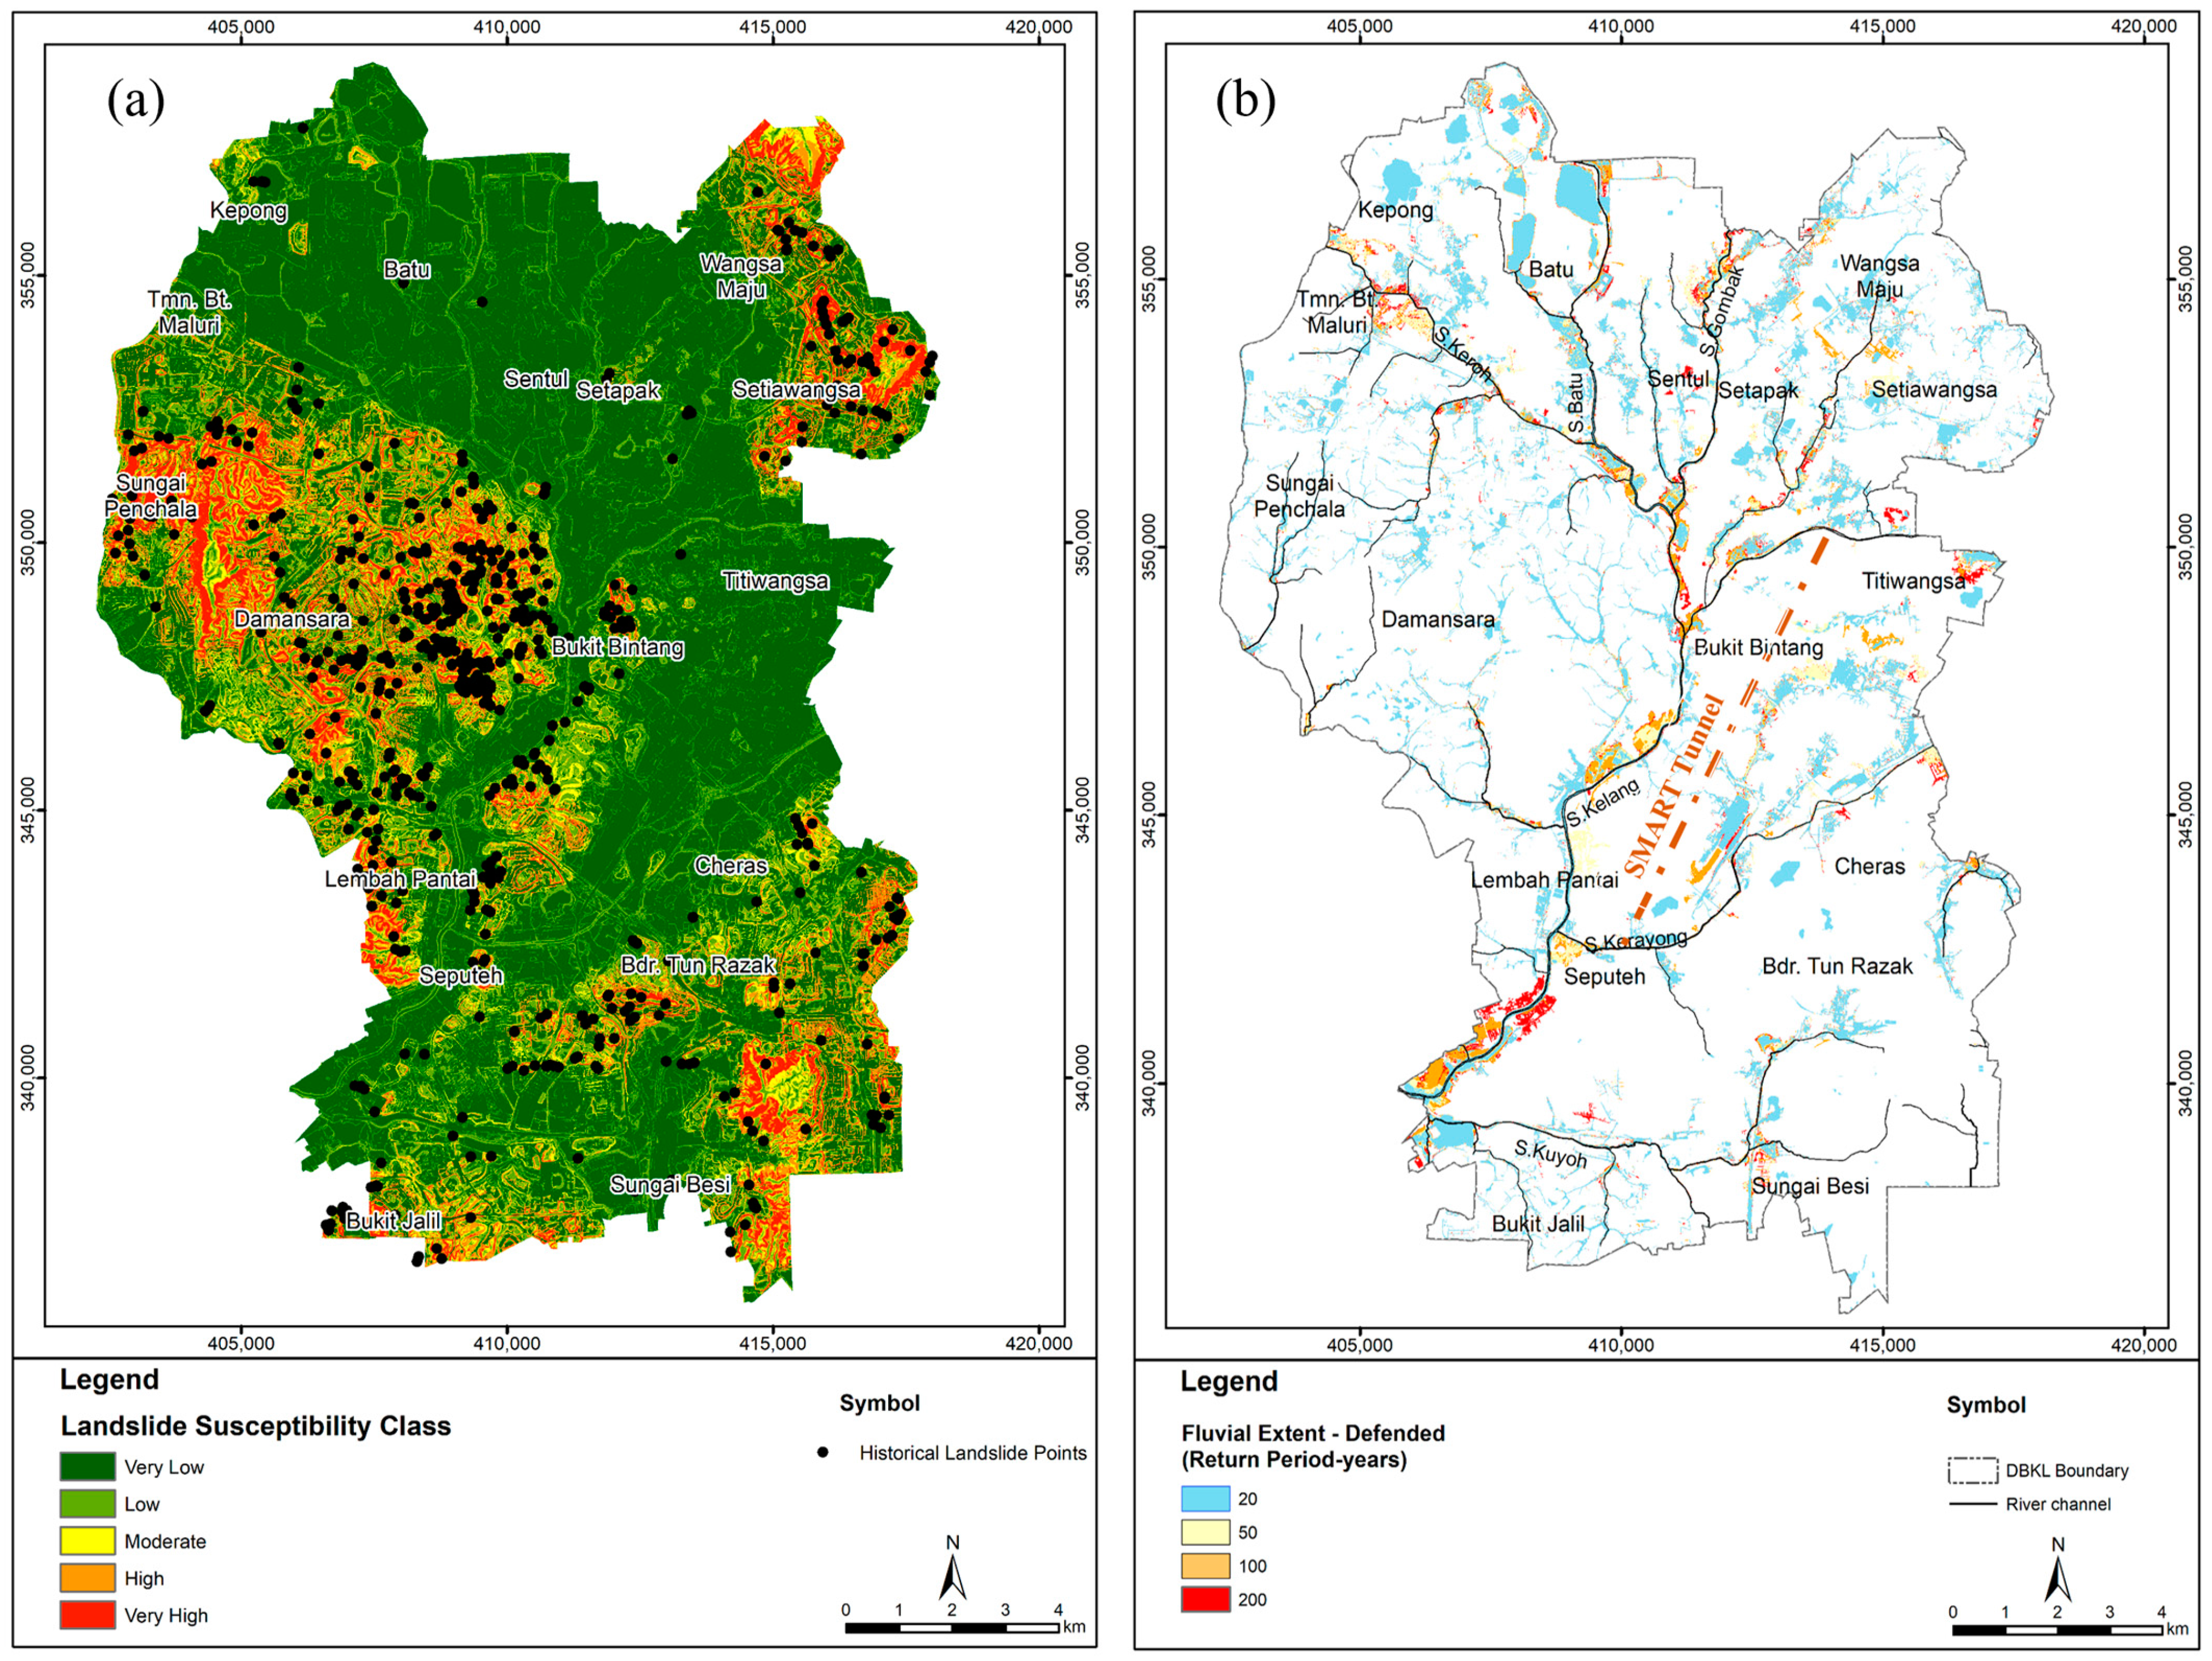
3.2. Geohazard Susceptibility

Derivation of the weightage value calculated from the influence of the parameter classes and the landslide distribution produced the susceptibility map of five classes: very high, high, moderate, low and very low (Figure 5a). The landslide susceptibility model delineates landslide-prone areas based on historical events. The information contributes to decision making on hazards and risk mitigation for development planning. Validation of the susceptibility model using the spatial cross-validation and retrospective methods shows high predictive accuracy with area under curve (AUC) values of 0.90 and 0.93, respectively [18]. The very high and high landslide susceptibility classes occupy 7% and 9% of the study area, respectively. These two susceptibility classes are concentrated in the northeastern, west–central and southern parts of the Kuala Lumpur. The moderate susceptibility areas cover 7% of the city, which are distributed mainly in the vicinity of the two earlier classes. The low susceptibility class occupies 20% of the area found mostly scattered around the earlier classes and within the very low susceptibility class. The largest area distribution (57%) is represented by the very low susceptibility class, which is distributed mainly in the northern and eastern Kuala Lumpur in relatively flat areas underlain by alluvium and mine tailings.
The flood susceptibility model showcased a defended scenario where it considered the Stormwater Management and Road Tunnel (SMART) tunnel system and other flood mitigation projects emplaced within the city with consideration of 20, 50, 100 and 200-year return periods (Figure 5b). The extent of areas susceptible to flood for 20, 50, 100 and 200-year return periods cover 10.6%, 12.5%, 14.1% and 15.2% of Kuala Lumpur, respectively. There was positive impact from the incorporation of flood mitigation works in the city such as the SMART tunnel, Sg. Keroh and Sg. Gombak Diversion Project and Sg. Bunus System, as shown by the smaller flood extent. In one case, the Tun Perak Bridge located in downtown Kuala Lumpur shows an increase in channel capacity from the 5-year flow assumption to a 20-year assumption when considering the engineering improvements to the Sg. Kelang channel as exhibited in the defended fluvial flood map [59]. The model has a resolution of 5 m, delineating flood-prone areas in the city. After validation using the compilation of flood incidents spanning 1977–2020, nearly 92% of the 569 flood locations are within the extent of the susceptibility zones. A comparison of modelled data with known discharge rates through the tunnels and expected rates of flow downstream of inlet and outlet ponds confirm that the model set-up successfully reconstructs the water retention and diversion in Kuala Lumpur in the defended scenario [50].

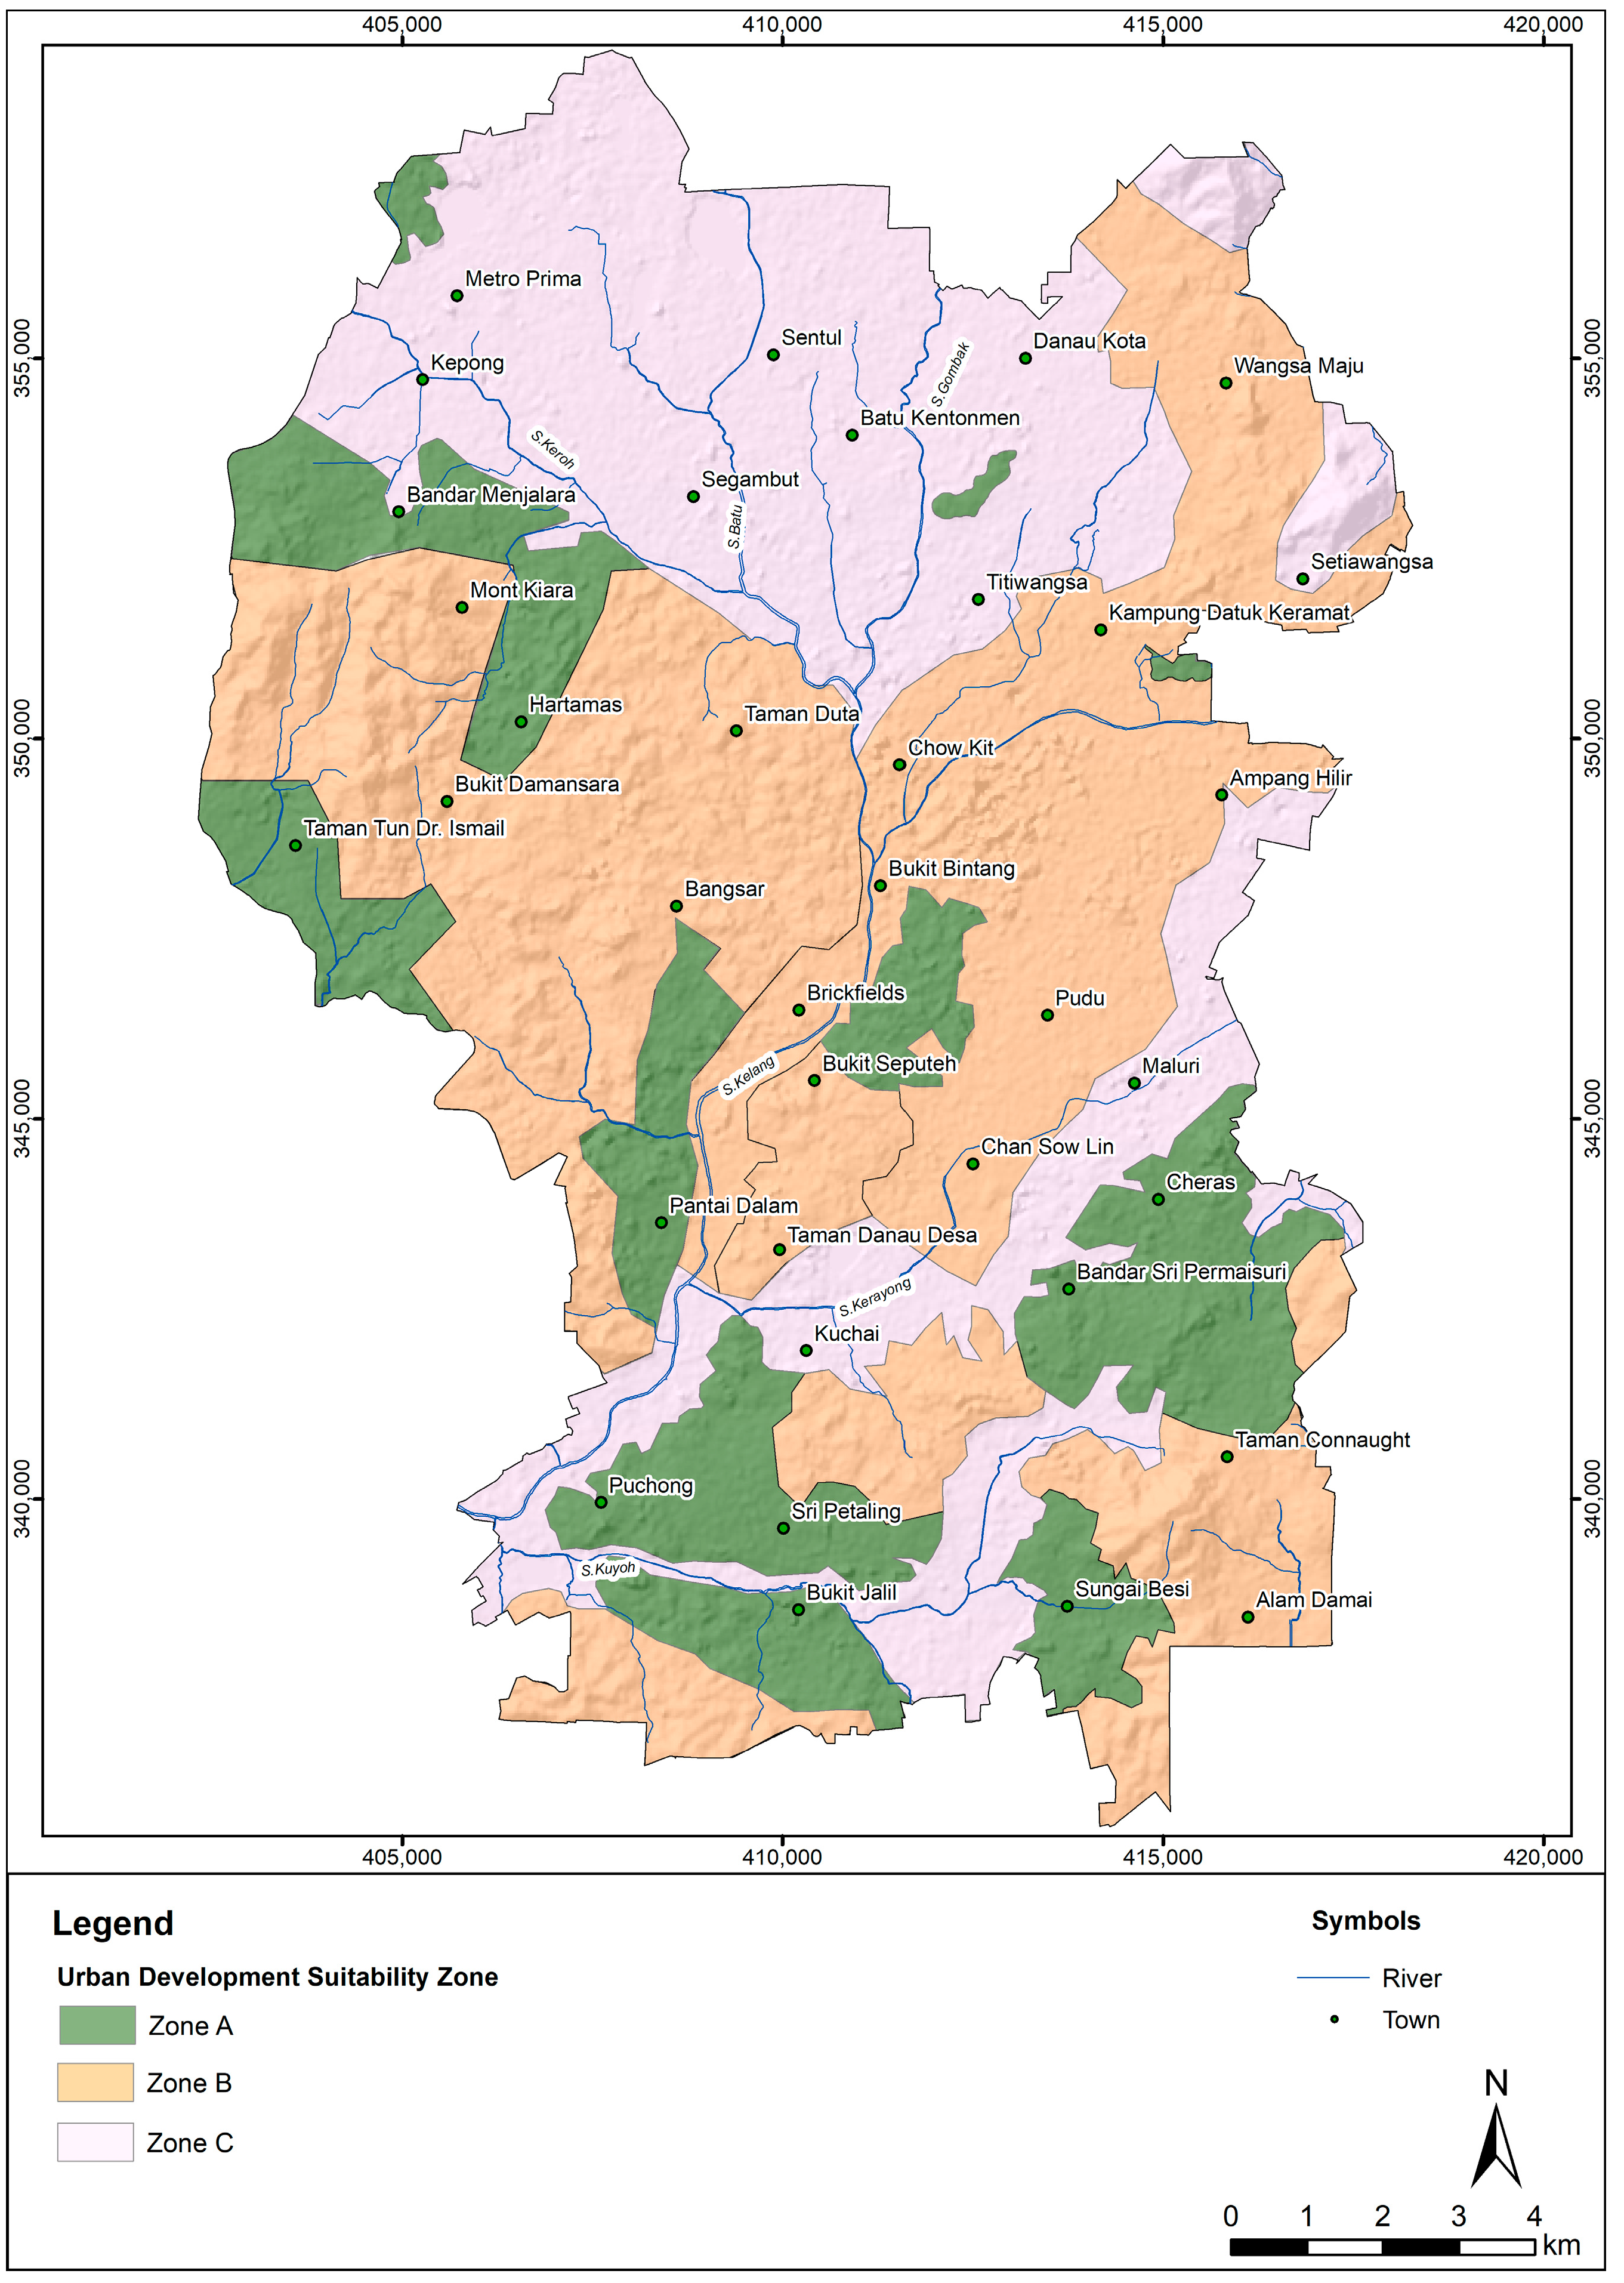
3.3. Urban Development Suitability and Development Planning Zones

The Urban Development Suitability (UDS) map produced from the integration of EGC and geohazard susceptibility maps is shown in Figure 6. The integration of thematic maps allows for the consideration of the environmental and geological factors to determine the boundary of classes or zones of development. The integration does not take into account land use restrictions in the city, such as reserves of green spaces, river buffers and indigenous Malay reserves. Areas with high suitability (UDS Class I) are mostly in areas that are not covered by the alluvium, anthropogenic deposit or underlain by karstic marble. The UDS Class I areas occur mainly in the west–central, southern, and northeastern parts of the city within areas underlain by residual soils which have low geohazard susceptibility. The moderately suitable (UDS Class II) areas are mainly underlain by alluvium and have low geohazard susceptibility in the northern and west central part of the city. In general, areas with low suitability (UDS Class III) are mostly adjacent to the river channels within the alluvial plain. The combination of unfavourable engineering properties of the surficial deposit, presence of flood hazard and ground condition of the karstic marble underneath resulted in considerable ground constraints. UDS Class III areas also occur in hilly areas susceptible to landslide.
Spatially scattered classes of non-contiguous areas in the UDS map were grouped into zones. The grouping of the spatially contiguous development suitability zones (DSZ, Figure 7) is more practical for the purpose of development planning. The DSZ map aims to guide development planning where zone A, zone B and zone C are defined in the order of increasing ground constraints, indicating its suitability for various purposes. This includes development or redevelopment, requirement for site investigation work and mitigation techniques that are associated with higher development cost. Thus, planners and developers are informed of ground conditions, its implications and associated risks to support decision making for minimising geohazards or engineering problems.
Covering 20.2% of the city, Zone A is defined by areas that have potential for development or redevelopment as ground constraint is minimal in areas represented by mostly UDS Class I and minor Class II. New development is possible in some areas where it is not built up, such as vacant land with no physical constraint. However, most of the areas within this zone already comprise residential areas, with a portion within institution and public facilities. In this zone, standard site investigation and minimal intervention from engineering remedial works are required. Therefore, normal costs involved in engineering works are anticipated due to the negligible hazard potential within the area and the relatively good ground condition.
Encompassing 44.2% of the city, Zone B represents areas with moderate ground constraint as represented by mostly UDS Class II and lesser Class I or areas with both Class I and III present. The zone is largely built up, thus limiting future development due to land scarcity. It includes hilly areas of Kuala Lumpur Granite, Kenny Hill Formation and the schists consisting of various land use categories. The undeveloped, hilly terrain of Sg. Penchala in the northwestern region is also incorporated within this zone. This area is classified as Malay reserve where development is strictly regulated. In Zone B, intensive site investigation is needed and development requires high intervention with engineering remedial works prior to construction. Post-development, frequent and close monitoring and potentially the emplacement of mitigation works are required to assess the ground conditions and the risk of geohazard. Thus, any new development along the non-built-up hilly areas or redevelopment on built-up areas would involve moderately high cost, as some engineering remedial works are needed to mitigate flood or landslide hazard and associated ground limitations.
About 35.6% of the city is assigned as Zone C that has high ground constraint as represented by UDS Class III and Class II areas with some Class III present. The high ground constraint restricts redevelopment in the area and may cause problems to current development. The zone is categorised as fully built up where future development is hindered by land scarcity. It occurs mostly along the alluvial plain represented by UDS Class III where surficial material with unfavourable engineering properties is dominant. The presence of flood hazard and the unpredictable ground conditions associated with the karstic marble below justifies the classification of the region as being problematic to existing development or any future redevelopment works. Intensive site investigation is needed, and the ground conditions require high intervention from engineering remedial works prior to construction. In terms of post-development, more frequent and close monitoring and the emplacement of mitigation works are required to review the ground conditions and the risk of geohazard. Subsequently, high-cost engineering works are expected to evaluate and continuously monitor the ground.

4. Discussion

The KLSP 2040 outlines the aspiration for a well-integrated, sustainable, and resilient metropolitan Kuala Lumpur that serves everyone as the city addresses urbanisation and other challenges, including climate change and associated hazards. As land scarcity is an issue, redevelopment is vital for the rejuvenation of old areas to better serve the community. Major infrastructure projects are already directed towards the subsurface to cope with the scarcity of space. Redevelopment projects with higher densities are increasingly common in the city. The resilience and prosperity of an urban area could be attained by reducing the risk of surface and subsurface geohazards, proper management of environmentally sensitive areas and conservation of geological heritage, and exploring alternative resources to encourage sustainable development of the city [18,21,60]. In the context of resilience to geohazards, this study integrates geoscience information for susceptibility modelling and development suitability to support land use planning in Kuala Lumpur. The focus on two hazards, i.e., landslide and flood susceptibility as well as engineering geological constraints, has resulted in a new approach of delineating zones that are relatively more suitable for development. In addition, zones that are the least suitable have also been demarcated. This enables the planning of relevant measures to increase the resilience of the city. This enables the planning of targeted and hazard specific measures to increase resilience. In comparison, previous researchers have focused on single hazards [34,35,36,37]. Studies on multiple hazards are limited [24,27,28,61], where conditioning parameters for the hazards are analysed collectively to produce one final suitability map without generating susceptibility maps for each hazard, hindering targeted hazard-specific mitigating measures.
The results reveal that 80% of the land area In Kuala Lumpur has medium to high ground constraint, and this includes around 25% of the city that is susceptible to landslides and floods. As the city is moving to the phase of rejuvenation due to land scarcity, the pace of development is more deliberate, and factors that control both these hazards are relatively more stable compared to the trigger element, i.e., rainfall, which is projected increase in intensity and frequency for this region due to climate change [62]. Based on these assumptions, and adopting the worst-case scenario in line with the precautionary principle, climate change is expected to exacerbate the occurrence of landslides and floods in these susceptible areas. Hence, further development of such areas should be minimised to prevent the exposure and vulnerability of communities and urban assets to future hazards. Appropriate measures should be taken in areas that have already been developed. These include disaster risk transfer and insurance schemes for exposed communities, social safety nets for lower-income groups, area-based business continuity plans for industries and the commercial sector, as well as early warning alerts and public warning systems. The use of this information for strategic development planning would enhance the resilience of Kuala Lumpur to climate hazards.
The integration of geoscience inputs into local development plans under the KLSP 2040 supports informed decision making for enhanced reliance. In this context, the communication of risk has been facilitated by GIS, which is an effective tool for various end-users with different ranges of knowledge and skills [28,33,63]. Geoscience information on ground characteristics and hazards has been transformed into easily understood and relevant output in the form of zoning maps for better understanding of non-geoscience specialists. Practitioners and non-geoscience specialists need to be informed of the role of geoscience information in development planning to benefit from the growing research in this field. This could be facilitated through the formulation of guidance and active engagement between geoscientists, planners and policy makers as well as other multidisciplinary professionals. The application of geoscience knowledge in any urban area runs beyond a single disciplinary expertise but requires systematic multidisciplinary communication encompassing planners, engineers, geologist, economists and social scientists [28,42].
There are some limitations in this work, particularly with respect to susceptibility modelling. Areas susceptible to landslides and floods have been delineated. Further work is required to determine the rainfall threshold values that would actually trigger a landslide or flood incident. This would facilitate hazard forecasting, which is not within the scope of the current study. In addition, during a fluvial flood event, high river flow can erode the river bed and increase the risk of bank collapse as well as seawater intrusion in coastal cities [64,65]. While Kuala Lumpur is located relatively far from the coastline, more research is required to determine areas that are susceptible to the cascading impacts of high river flow in the city. Climate change projection for the region includes more frequent and intense rainfall patterns and extreme events [62]. In this regard, the identification of underground and surface water resources should be considered to manage water stress issues in the city. Furthermore, the impacts of industrial activity should also be considered where geogenic contamination from radon, arsenic and other heavy metals as well as anthropogenic contamination such as hydrocarbons, asbestos and nitrates would be a great concern to the city [66].
Institutional arrangements have to be strengthened in the city to preserve the ground information obtained from development projects. Accurate forecasting systems and mitigation strategies supported by advanced technology in GIS and remote sensing are only reliable when the input data are sufficient and frequently updated. Alongside enhanced data acquisition and management practice, the authorities must invest in capacity building and technology that draws on local geoscience information to enhance early warning and disaster preparedness.
Data sharing and management are issues that should also be urgently addressed to ensure valuable scientific information is not lost. A way forward is to encourage the establishment of a local geoscience database through consistent reporting and management in a centralised repository for better geohazard assessment and forecasting in the city. Information on geohazards should be made available and easily understood to non-geoscience specialists, whose professional services would be availed to in the development of a parcel of land. The formulation of planning guidance could be considered targeting non-geoscience specialists with information to support decision making regarding risks, potential technical solutions and relevant expertise. The study has also delineated hazard-specific areas that are useful for conducting targeted community preparedness to build resilience. Efforts should be made to promote seamless data sharing between government agencies and the public so that non-governmental and civil society organisations can develop targeted programmes for community preparedness. This study has provided pathways for a resilient city by delineating areas suitable for development and those that require hazard-specific measures in targeted areas for building resilience. Further work is required for evaluating the effectiveness of the approach. Indeed, evaluating resilience is in itself a distinct research domain. It could cover relatively narrow areas represented by indicators of social vulnerability, hazard exposure and adaptive capacity [3,8,11,12,13,14,15] to broader aspects of economy, organisation, environment and society [1].

5. Conclusions

Kuala Lumpur aspires to be a well-integrated, sustainable, and resilient metropolitan city that serves everyone. This aspiration is challenged by issues such as landslides, floods, and unfavourable ground conditions. A novel approach has been used where geoscience information is integrated to determine engineering ground conditions and susceptibility to multiple geohazards, which are then combined to demarcate suitable zones for urban development. The combination of both engineering geology conditions and susceptibility to multiple geohazards contributes to better understanding for building resilience to disasters influenced by climate change. The findings reveal that 20% of the city has high suitability for development and is generally not prone to climate hazards. About 80% of the land area in Kuala Lumpur has medium to high ground constraint, and this includes around 25% of the city area that is susceptible to landslides and floods. In the worst-case scenario where no action is taken, communities and urban assets within these susceptible areas would be exposed and vulnerable to more hazard events due to climate change. It is suggested that additional development be limited in such areas to minimise risk. Where already developed, hazard-specific measures can be taken in targeted areas to build resilience. Examples include disaster risk transfer and insurance schemes for exposed communities, social safety nets for lower-income groups, area-based business continuity plans for industries and the commercial sector, early warning alerts and public warning systems, as well as increasing public awareness and preparedness.

Author Contributions

Funding acquisition, J.J.P.; resources, J.J.P.; conceptualisation, methodology and analysis, T.F.N. and E.A.; writing—original draft preparation, E.A.; writing—review and editing, T.F.N. and J.J.P. All authors have read and agreed to the published version of the manuscript.

Funding

This research was funded by Newton-Ungku Omar Fund (Application ID: 59348-455144, UM Project No. IF002–2017, UKM Project No. XX-2017-002) for supporting this research.

Institutional Review Board Statement

Not applicable.

Informed Consent Statement

Not applicable.

Data Availability Statement

The datasets generated during and analysed are available from the corresponding author on reasonable request.

Acknowledgments

The authors would like to thank the anonymous reviewers and the academic editor for their constructive input to this manuscript. The assistance of project members from multiple institutions is gratefully acknowledged.

Conflicts of Interest

The authors declare no conflict of interest.

References

  1. Hosseini, S.; Barker, K.; Ramirez-Marquez, J.E. A review of definitions and measures of system resilience. Reliab. Eng. Syst. Saf. 2016, 145, 47–61. [Google Scholar] [CrossRef]
  2. Meerow, S.; Newell, J.; Stults, M. Defining urban resilience: A review. Landsc. Urban Plan. 2016, 147, 38–49. [Google Scholar] [CrossRef]
  3. Ahern, J. From fail-safe to safe-to-fail: Sustainability and resilience in the new urban world. Landsc. Urban Plan. 2011, 100, 341–343. [Google Scholar] [CrossRef] [Green Version]
  4. UNISDR. UNISDR Terminology on Disaster Risk Reduction. Available online: https://www.preventionweb.net/publication/2009-unisdr-terminology-disaster-risk-reduction (accessed on 28 December 2022).
  5. Xu, H.; Li, Y.; Tan, Y.; Deng, N. A Scientometric Review of Urban Disaster Resilience Research. Int. J. Environ. Res. Public Health 2021, 18, 3677. [Google Scholar] [CrossRef]
  6. Bozza, A.; Asprone, D.; Manfredi, G. Developing an integrated framework to quantify resilience of urban systems against disasters. Nat Hazards 2015, 78, 1729–1748. [Google Scholar] [CrossRef]
  7. IPCC. Summary for Policymakers. In Climate Change 2022: Impacts, Adaptation, and Vulnerability. Contribution of Working Group II to the Sixth Assessment Report of the Intergovernmental Panel on Climate Change; Pörtner, H.-O., Roberts, D.C., Poloczanska, E.S., Mintenbeck, K., Tignor, M., Alegría, A., Craig, M., Langsdorf, S., Löschke, S., Möller, V., et al., Eds.; Cambridge University Press: Cambridge, UK, 2022. [Google Scholar]
  8. Gavari-Starkie, E.; Casado-Claro, M.-F.; Navarro-González, I. The Japanese Educational System as an International Model for Urban Resilience. Int. J. Environ. Res. Public Health 2021, 18, 5794. [Google Scholar] [CrossRef] [PubMed]
  9. Sanchez, A.X.; Van der Heijden, J.; Osmond, P. The city politics of an urban age: Urban resilience conceptualisations and policies. Palgrave Commun. 2018, 4, 25. [Google Scholar] [CrossRef] [Green Version]
  10. United Nations, U. Goal 11: Make Cities Inclusive, Safe, Resilient and Sustainable. Available online: https://www.un.org/sustainabledevelopmhttps://sdgs.un.org/goals/goal11 (accessed on 18 August 2021).
  11. Yang, Y.; Ng, S.T.; Xu, F.J.; Skitmore, M. Towards sustainable and resilient high density cities through better integration of infrastructure networks. Sustain. Cities Soc. 2018, 42, 407–422. [Google Scholar] [CrossRef]
  12. IPCC. An IPCC Special Report on the impacts of global warming of 1.5 °C above pre-industrial levels andrelated global greenhouse gas emission pathways, in the context of strengthening the global response to the threat of climate change, sustainable development, and efforts to eradicate poverty. In Global Warming of 1.5 °C; Masson-Delmotte, V., Zhai, P., Pörtner, H.-O., Roberts, D., Skea, J., Shukla, P.R., Pirani, A., Moufouma-Okia, W., Péan, C., Pidcock, R., et al., Eds.; IPCC: Geneva, Switzerland, 2018. [Google Scholar]
  13. Yamori, K.; Goltz, J.D. Disasters without Borders: The Coronavirus Pandemic, Global Climate Change and the Ascendancy of Gradual Onset Disasters. Int. J. Environ. Res. Public Health 2021, 18, 3299. [Google Scholar] [CrossRef] [PubMed]
  14. Kong, L.M.Z.; Hu, G.; Zhang, Z. The application of resilience theory in urban development: A literature review. Environ. Sci. Pollut. Res. 2022, 29, 49651–49671. [Google Scholar] [CrossRef]
  15. Liu, L.L.Y.; Zhuang, M.; Ding, S. The impact of climate change on urban resilience in the Beijing-Tianjin-Hebei region. Sci. Total Environ. 2022, 827, 154157. [Google Scholar] [CrossRef] [PubMed]
  16. Rau, J. The State of Geosecurity in Asian Cities. In Ground Beneath Our Feet: A Factor in Urban Planning. Atlas of Urban Geology; United Nations Publications: New York, NY, USA, 2003; Volume 14, p. 488. [Google Scholar]
  17. Pereira, J.J.; Ng, T.; Hunt, J. Climate Action. In Geosciences and the Sustainable Development Goals, Sustainable Development Goals Series; Gill, J.C., Smith, M., Eds.; Springer Nature: Cham, Switzerland, 2021; pp. 313–337. [Google Scholar]
  18. Affandi, E.; Ng, T.F.; Pereira, J.J.; Ahmad, F.; Banks, V.J. Revalidation Technique on Landslide Susceptibility Modelling: An Approach to Local Level Disaster Risk Management in Kuala Lumpur, Malaysia. Appl. Sci. 2023, 13, 768. [Google Scholar] [CrossRef]
  19. U.S. Geological Survey. Geoscience for a Changing World; U.S. Geological Survey: Reston, VA, USA, 2018.
  20. National Research Council. Geoscience Data and Information for Decision Making; National Academies Press: Washington, DC, USA, 2007.
  21. Omar, R.C.; Komoo, I.; Hashim, H.S.; Aziz, S.; Yaakub, J. Incorporating of geosciences framework for sustainable development at MSC. Bull. Geol. Soc. Malays. 2002, 45, 93–96. [Google Scholar] [CrossRef]
  22. Malczewski, J. GIS-based land-use suitability analysis: A critical overview. Prog. Plan. 2004, 62, 3–65. [Google Scholar] [CrossRef]
  23. Bagheri, M.; Zaiton Ibrahim, Z.; Mansor, S.; Manaf, L.A.; Akhir, M.F.; Talaat, W.I.A.W.; Beiranvand Pour, A. Land-Use Suitability Assessment Using Delphi and Analytical Hierarchy Process (D-AHP) Hybrid Model for Coastal City Management: Kuala Terengganu, Peninsular Malaysia. ISPRS Int. J. Geo-Inf. 2021, 10, 621. [Google Scholar] [CrossRef]
  24. Liu, R.; Zhang, K.; Zhang, Z.; Borthwick, A. Land-use suitability analysis for urban development in Beijing. J. Environ. Manag. 2014, 145, 170–179. [Google Scholar] [CrossRef] [Green Version]
  25. Yang, Y.; Tang, X.-L.; Li, Z.-H. Land use suitability analysis for town development planning in Nanjing hilly areas: A case study of Tangshan new town, China. J. Mt. Sci. 2021, 18, 528–540. [Google Scholar] [CrossRef]
  26. Labiso, T.T.; Yagaso, Z.S. Land suitability analysis for surface irrigation in Humbo woreda, wolaita zone, Southern Ethiopia. EQA 2021, 44, 32–43. [Google Scholar] [CrossRef]
  27. Dai, F.; Lee, C.; Zhang, X. GIS-based geo-environmental evaluation for urban land-use planning: A case study. Eng. Geol. 2001, 61, 257–271. [Google Scholar] [CrossRef]
  28. El May, M.; Dlala, M.; Chenini, I. Urban geological mapping: Geotechnical data analysis for rational development planning. Eng. Geol. 2010, 116, 129–138. [Google Scholar] [CrossRef]
  29. Reichenbach, P.; Rossi, M.; Malamud, B.D.; Mihir, M.; Guzzetti, F. A review of statistically-based landslide susceptibility models. Earth Sci. Rev. 2018, 180, 60–91. [Google Scholar] [CrossRef]
  30. Mudashiru, R.B.; Sabtu, N.; Abustan, I. Quantitative and semi-quantitative methods in flood hazard/susceptibility mapping: A review. Arab. J. Geosci. 2021, 14, 941. [Google Scholar] [CrossRef]
  31. Daniel, M.T.; Ng, T.F.; Kadir, A.; Farid, M.; Pereira, J.J. Landslide Susceptibility Modeling Using a Hybrid Bivariate Statistical and Expert Consultation Approach in Canada Hill, Sarawak, Malaysia. Front. Earth Sci. 2021, 9, 616225. [Google Scholar] [CrossRef]
  32. Muhamad, N.; Arshad, S.H.M.; Pereira, J.J. Exposure Elements in Disaster Databases and Availability for Local Scale Application: Case Study of Kuala Lumpur, Malaysia. Front. Earth Sci. 2021, 9, 616246. [Google Scholar] [CrossRef]
  33. Luan, C.; Liu, R.; Peng, S. Land-use suitability assessment for urban development using a GIS-based soft computing approach: A case study of Ili Valley, China. Ecol. Indic. 2021, 123, 107333. [Google Scholar] [CrossRef]
  34. Artikov, T.U.; Ibragimov, R.S.; Ibragimova, T.L.; Mirzaev, M.A. Complex of general seismic zoning maps OSR-2017 of Uzbekistan. Geod. Geodyn. 2020, 11, 273–292. [Google Scholar] [CrossRef]
  35. Fan, Y.; Suwen, X.; Jiangang, O.; Ziyu, Z.; Ting, L. Human Settlement Resilience Zoning and Optimizing Strategies for River-Network Cities under Flood Risk Management Objectives: Taking Yueyang City as an Example. Sustainability 2022, 14, 9595. [Google Scholar] [CrossRef]
  36. Batarseh, M.; Imreizeeq, E.; Tilev, S.; Al Alaween, M.; Suleiman, W.; Al Remeithi, A.M.; Al Tamimi, M.K.; Al Alawneh, M. Assessment of groundwater quality for irrigation in the arid regions using irrigation water quality index (IWQI) and GIS-Zoning maps: Case study from Abu Dhabi Emirate, UAE. Groundw. Sustain. Dev. 2021, 14, 100611. [Google Scholar] [CrossRef]
  37. Doorga, J.R.S.; Magerl, L.; Bunwaree, P.; Zhao, J.; Watkins, S.; Staub, C.G.; Rughooputh, S.D.D.V.; Cunden, T.S.M.; Lollchund, R.; Boojhawon, R. GIS-based multi-criteria modelling of flood risk susceptibility in Port Louis, Mauritius: Towards resilient flood management. Int. J. Disaster Risk Reduct. 2022, 67, 102683. [Google Scholar] [CrossRef]
  38. Fischer, K.; Häring, I.; Riedel, W.; Vogelbacher, G.; Hiermaier, S. Susceptibility, vulnerability, and averaged risk analysis for resilience enhancement of urban areas. Int. J. Prot. Struct. 2016, 7, 45–76. [Google Scholar] [CrossRef]
  39. Mabrouk, M.; Haoying, H. Urban resilience assessment: A multicriteria approach for identifying urban flood-exposed risky districts using multiple-criteria decision-making tools (MCDM). Int. J. Disaster Risk Reduct. 2023, 91, 103684. [Google Scholar] [CrossRef]
  40. DBKL. Draft of Kuala Lumpur Structure Plan 2040: A City for All; Dewan Bandaraya Kuala Lumpur: Kuala Lumpur, Malaysia, 2021. [Google Scholar]
  41. Petley, D. On the impact of urban landslides. Geol. Soc. Lond. Eng. Geol. Spec. Publ. 2009, 22, 83–99. [Google Scholar] [CrossRef]
  42. Chand, F. Environmental geology in urban development. In Proceedings of the Ninth Regional Congress on Geology, Mineral and Energy Resources of Southeast Asia—GEOSEA’98, Kuala Lumpur, Malaysia, 17–19 August 1999; pp. 329–333. [Google Scholar]
  43. Pereira, J.J.; Komoo, I. Geoscience in landuse planning for environmental sustainability. Bull. Geol. Soc. Malays. 2006, 52, 7–15. [Google Scholar] [CrossRef]
  44. Elmahdy, S.I.; Mostafa, M.M. Natural hazards susceptibility mapping in Kuala Lumpur, Malaysia: An assessment using remote sensing and geographic information system (GIS). Geomat. Nat. Haz. Risk. 2013, 4, 71–91. [Google Scholar] [CrossRef]
  45. Suratman, S. Engineering Geological Mapping of Wilayah Persekutuan and Surrounding Areas; UG/1/1993; Geological Survey of Malaysia: Kuala Lumpur, Malaysia, 1993. [Google Scholar]
  46. Althuwaynee, O.F.; Pradhan, B. Semi-quantitative landslide risk assessment using GIS-based exposure analysis in Kuala Lumpur City. Geomat. Nat. Haz. Risk. 2017, 8, 706–732. [Google Scholar] [CrossRef] [Green Version]
  47. Tan, B.K. Urban Geology: Case Studies in Malaysia. In Proceedings of the ISRM International Symposium, Melbourne, Australia, 19–24 November 2000. [Google Scholar]
  48. Ng, T.F. Joint characteristics in granitic rocks of eastern Kuala Lumpur, Peninsular Malaysia. War. Geol. 1994, 20, 5–18. [Google Scholar]
  49. Tan, B.K. Urban Geology of Kuala Lumpur and Ipoh, Malaysia. In Engineering Geology Special Publication: Engineering Geology of Tomorrow’s Cities; Geological Society London: London, UK, 2006; Volume 22. [Google Scholar]
  50. Massam, A.; Smith, H.; Filipova, V.; Waller, S.; Muhamad, N.; Pereira, J.J. Flood risk in Kuala Lumpur, Malaysia: A consideration of flood defences in a broadscale hydraulic model. J. Flood Risk Manag. 2023, e12907. [Google Scholar] [CrossRef]
  51. Gobbett, D. The lower palaeozoic rocks of Kuala Lumpur, Malaysia. Fed. Mus. J. 1964, 9, 67–79. [Google Scholar]
  52. Yin, E.H. The Geology and Mineral Resources of the Kuala Lumpur-Klang Area; Unpublished Report; Geological Survey Department of Malaysia: Kuala Lumpur, Malaysia, 1986.
  53. Tálita de Sena Nola, I.; Zuquette, L.V. Procedures of engineering geological mapping applied to urban planning in a data-scarce area: Application in southern Brazil. J. South Am. Earth Sci. 2021, 107, 103141. [Google Scholar] [CrossRef]
  54. Van Westen, C.J.; Castellanos, E.; Kuriakose, S.L. Spatial data for landslide susceptibility, hazard, and vulnerability assessment: An overview. Eng. Geol. 2008, 102, 112–131. [Google Scholar] [CrossRef]
  55. Süzen, M.L.; Doyuran, V. A comparison of the GIS based landslide susceptibility assessment methods: Multivariate versus bivariate. Env. Geol. 2004, 45, 665–679. [Google Scholar] [CrossRef]
  56. Van Westen, C. Statistical landslide hazard analysis. In ILWIS 2.1 For Windows Application Guide; ITC Publication: Enschede, The Netherlands, 1997; pp. 73–84. [Google Scholar]
  57. Flentje, P.N.; Miner, A.; Whitt, G.; Fell, R. Guidelines for Landslide Susceptibility, Hazard and Risk Zoning for Land Use Planning. Available online: https://ro.uow.edu.au/engpapers/2823 (accessed on 25 January 2021).
  58. Massam, A.; Smith, H. Urban Flood Modelling in Kuala Lumpur. In Proceedings of the Technical Presentation on Urban Flood Modelling in Kuala Lumpur, Kuala Lumpur, Malaysia, 18 December 2020. [Google Scholar]
  59. Webb, D. Kuala Lumpur: A Model of Resilience. Available online: https://www.jbarisk.com/news-blogs/kuala-lumpur-a-model-of-resilience/ (accessed on 12 December 2021).
  60. Mulder, E.; Pereira, J. Earth Science for the city. Geol. Soc. Lond. Eng. Geol. Spec. Publ. 2009, 22, 25–31. [Google Scholar] [CrossRef]
  61. Bathrellos, G.D.; Skilodimou, H.D.; Chousianitis, K.; Youssef, A.M.; Pradhan, B. Suitability estimation for urban development using multi-hazard assessment map. Sci. Total Environ. 2017, 575, 119–134. [Google Scholar] [CrossRef] [PubMed]
  62. IPCC. Summary for Policymakers. In Climate Change 2021: The Physical Science Basis. Contribution of Working Group I to the Sixth Assessment Report of the Intergovernmental Panel on Climate Change; Masson-Delmotte, V., Zhai, P., Pirani, A., Connors, S.L., Péan, C., Berger, S., Caud, N., Chen, Y., Goldfarb, L., Gomis, M.I., et al., Eds.; Cambridge University Press: Cambridge, UK, 2021. [Google Scholar]
  63. Zervakou, A.; Tsombos, P. GIS in urban geology: The case study of Nafplio, Argolis Prefecture, Greece. Bull. Geol. Soc. Greece 2017, 43, 1559–1571. [Google Scholar] [CrossRef] [Green Version]
  64. Xie, D.; Gao, S.; Wang, Z.B.; Pan, C.; Wu, X.; Wang, Q. Morphodynamic modeling of a large inside sandbar and its dextral morphology in a convergent estuary: Qiantang Estuary, China. J. Geophys. Res. Earth Surf. 2017, 122, 1553–1572. [Google Scholar] [CrossRef] [Green Version]
  65. Xie, D.; Bing Wang, Z.; Huang, J.; Zeng, J. River, tide and morphology interaction in a macro-tidal estuary with active morphological evolutions. CATENA 2022, 212, 106131. [Google Scholar] [CrossRef]
  66. Banks, V.J.; Bricker, S.H.; Affandi, E.; Ng, T.F. The Role of Urban Geoscience in Building a More Resilient Kuala Lumpur. In Proceedings of the Workshop on Disaster and Climate Resilience in Cities, Kuala Lumpur, Malaysia, 15–16 October 2019. [Google Scholar]
Figure 2. General workflow commencing with analysis of geoscience and related information and GIS modelling, followed by spatial integration, and zonation of contiguous areas.
Applsci 13 07004 g002
Figure 3. Research flowchart of the methodology used to generate the development suitability zones in the study area.
Applsci 13 07004 g003
Figure 4. Engineering ground classification map of Kuala Lumpur, indicating potential engineering work performance for future development. The criteria and score used are shown in the matrix.
Applsci 13 07004 g004
Figure 5. Geohazard susceptibility maps of Kuala Lumpur. (a) Landslide susceptibility map. (b) Fluvial flood susceptibility map in Kuala Lumpur with consideration of the SMART tunnel infrastructure. The areal extent of flood susceptibility is the cumulative of the lower return periods.
Applsci 13 07004 g005
Figure 6. Urban development suitability (UDS) map of Kuala Lumpur. The scoring matrix is used to produce the UDS map based on the criteria in Table 1. The numbers in the parentheses indicate the scores for the criteria.
Applsci 13 07004 g006
Figure 7. Urban development suitability zones of Kuala Lumpur. Note: A description of the zones is included in the previous text.
Applsci 13 07004 g007
Table 1. Criteria for classification of land suitability for urban development.
SuitabilityDescription
I—High
(UDS Class I)
Areas with negligible flood or landslides occurrence and where the ground is classified as having EGC Class I or Class II.
II—Moderate
(UDS Class II)
Areas where geohazards are negligible; the ground is identified as having EGC Class III or Class IV. Flood hazard may be present in areas where the ground is classified as having EGC Class I.
III—Low
(UDS Class III)
Flood hazard may be present in areas where the ground is classified as having EGC Class II to Class V. Landslide hazard or both geohazards may be present in areas underlain by ground classified as having EGC Class I to Class V.
Disclaimer/Publisher’s Note: The statements, opinions and data contained in all publications are solely those of the individual author(s) and contributor(s) and not of MDPI and/or the editor(s). MDPI and/or the editor(s) disclaim responsibility for any injury to people or property resulting from any ideas, methods, instructions or products referred to in the content.

