Article

Tensiometric and Thermodynamic Study of Aliphatic and Aromatic Amine in Aqueous D-Glucose Solutions: A Comparative Study

Department of Chemistry, Faculty of Sciences, Jazan University, Jazan P.O. Box 114, Saudi Arabia
Appl. Sci. 2023, 13(12), 7012; https://doi.org/10.3390/app13127012
Submission received: 30 April 2023 / Revised: 5 June 2023 / Accepted: 8 June 2023 / Published: 10 June 2023
(This article belongs to the Section Food Science and Technology)

Abstract

:
The surface tensions of aqueous taurine (TAU) and tyramine (TYR) with D-glucose mixed solvents were elevated from 298.15 to 318.15 K by the KSV sigma 702 tensiometer. The purpose of the study was to elucidate comparative studies of the thermodynamic and transport aggregation properties of aliphatic and aromatic amine, i.e., taurine and tyramine, which provide information in pharmacology and biochemistry. The experimental data investigated by this study were utilized to evaluate various interfacial parameters, including surface pressure, surface excess concentration, and other thermodynamic parameters of surface assembly, which are discussed in terms of solute–solvent and solute–solute interactions. The surface tension data have been analyzed using the Gibbs adsorption isotherm. The results signify that the negative isotherm exhibited by the ionic solute, i.e., taurine, an aliphatic amine, is contrary to the positive isotherm of tyramine, a biogenic aromatic amine. Both the amines exhibit surface properties such as surfactant molecules, which is elucidated in terms of ionic–hydrophilic and hydrophobic–hydrophobic interactions. The positive entropy values state that the process of surface formation is favored by entropy gain as well as the enthalpy effect. The present system provides a better understanding of the intermolecular interactions, which are required for their usefulness in the field of nutrition, pharmacy, and the food industry.

1. Introduction

The interactions of aliphatic and aromatic amine with sugar have been studied extensively in the literature due to their immense significance in the food industry [1,2,3,4]. Amino acids are an essential component of our dietary nutrition, acting as an essential building block and playing an important role in the biosynthesis of essential proteins [5]. Hereby, we utilized tyramine amine (TYR) and taurine amino acid (TAU) with distinct molecular sizes and substitution as side chains of different natures [6,7] to explore molecular interactions with D-glucose. Amino acid and amine are inherited with surface activities including water solubility, binding, surface absorption, rheology modifications, gel formation, emulsifying activity, fat absorption, and foam formation behind their comparatively large molecular weights and owning amphipathic nature [8].
It is worth noting that the intricate network of proteins causes protein adsorption to be a complex process. The adsorption of protein is influenced by various factors, such as the addition of cosolutes, solvents, intermolecular forces between the proteins and the adsorbed molecules, that impact the solvent–solvent and solute–solute interactions [9]. However, the surface activity is controlled by surface hydrophobicity and depends upon the flexibility of the protein molecule. Indeed, it was early reported that the hydrophobicity of a protein controls its adsorption at the surface, while the flexibility property of a protein molecule amplifies its residence time at the surface [10,11]. Meanwhile, a protein molecule at the surface frequently undergoes conformational changes, leading to the unfolding of proteins at the surface [12,13].
Proteins are an important asset for industrial applications, and many attempts are made by industrial and academic scientists to improve their functional and surface activities [14,15,16]. The physicochemical study of amino acid amine rather than protein has been widely investigated because of its significant importance in many technological processes used in food, pharmaceutical, and dietary industries [17]. However, during this study, we deduce the possible molecular interaction between tyramine (TYR) amine and taurine (TAU) amino acid in aqueous sugar (D-glucose) media. The aim of the study is to deduce the surface behavior of the aliphatic and aromatic amine with increasing catenation in an aqueous sugar solution. The surface activity and possible molecular interactions between taurine amino acid–tyramine amine molecules and D-glucose (concentrations range from 0.01 to 0.05 mol kg−1) in aqueous solution are inferred using surface tension measurements. The surface tension technique is a worldwide recognized and appreciated method used to understand the interactions that occur at the molecular level by their physiochemical and thermodynamic properties. Aliphatic and aromatic amine in their additive aqueous solution are significantly investigated to gather information about intermolecular interactions, such as ionic–hydrophilic, hydrophilic–hydrophobic, and hydrophobic–hydrophobic interactions.
Taurine is an amino sulfonic acid, but it is often referred to as a conditional amino acid that is manufactured by the body. Taurine is a required building block of protein [17]. It is an essential supplement for infants who are not usually breastfed. Thus, taurine is frequently added to infant formulas. However, a maximum of 13 gm per 100 kcal is recommended for the total carbohydrates in the infant formulations given to infants who are not breastfed [18]. Taurine is formulated as a well-tolerated nitrogen source in diet supplements. The administration of taurine in diet supplements regulates the nitrogen balance, thus improving the nutritional status. Glucose, meanwhile, is given in minimum amounts, and is needed by infants to help in the oxidation of the central nervous system [19]. Taurine’s antioxidant and anti-inflammatory properties may enhance insulin sensitivity, thereby reducing the risk of type 2 diabetes or improving blood sugar management in those with the condition. Taurine is a sulfur-containing amino acid with an amine on the other side, which belongs to the class of aliphatic amines. In tyramine, the phenolic substituent is too low in acidity to be called an acid, so it belongs to the class of aromatic amine. Comparing the behavior of an amino acid and an amine is of interest. Keeping the importance of amino acid and amine with D-glucose as an aqueous formulation in mind, we are interested in this study to scrutinize the molecular interaction behavior of these aliphatic and aromatic amines in an aqueous solvent of D-glucose. The possible molecular interactions prevailing between taurine (TAU) amino acids and tyramine (TYR) amine in an aqueous sugar (D-glucose) solution upon their molecular structures are illustrated in Figure 1. Moreover, taurine being a β-amino acid is involved in neurological development and plays an integral role in regulating the balance of water and minerals in the blood. In addition, taurine has recently been approved for its antioxidant properties to help adults recover from diseases such as arteriosclerosis, diabetes, hypertension, and even in heart failure [20,21,22]. A literature survey has shown that the taurine–glucose study was conducted to enhance the taurine absorption rate in the body using a carbohydrate transport, such as glucose. Moreover, taurine–glucose was studied on an animal model for anti-adipogenesis effects in vivo conditions, and some of the transportation mechanisms and the biological effects as a result of taurine–glucose derivatives are still under investigation [23,24]. Meanwhile, to counter the effects of high-sugar diets, taurine has been studied in improving glucose tolerance behind the increase in the action of insulin with enhanced antioxidant levels [25]. On the other hand, tyramine has been reported to stimulate glucose transportation to adipocytes, cardiomyocytes, and skeletal muscle, subsequently, that has been attributed to in vivo glucose utilization with enhanced antihyperglycemic and anti-diabetic effects [4]. It is worth mentioning that both taurine (TAU) amino acids and tyramine (TYR) amines possess polar groups in their molecular structures, thus the system have inherited the ability to give surface phenomenon.
Our study, as mentioned before, will deduce the molecular aggregation behavior of amino acids tyramine (TYR) and taurine (TAU) in an aqueous D-glucose solution. Hereby, to comprehend the possible molecular interactions by surface tension, this study has been utilized to understand the behavior of the component molecules of the mixture on the surface and at the bulk in aqueous phase [26,27,28]. The component molecules of the mixture at the surface are subject to decrease the surface tension in the aqueous phase, which is associated with the breakdown of the hydrogen bond at the surface with the increase concentration of amphiphiles. In addition, the mixture solution has been investigated at different temperatures and compositions. Thus, this enables us to evaluate many thermodynamic parameters, such as Gibbs free energy, entropy, and enthalpy of surface formation. The surface excess concentrations were estimated from the Gibbs adsorption isotherm, which imparts a temperature-dependent quantity. In addition, depending on the behavior of the amino acid biomolecules, the concentration and temperature dependence of the surface tension data of the systems have been used for the estimation of surface excess concentration (Γ), surface area per molecule (Am), and surface pressure (π). Further, the investigation of the thermodynamic parameters of surface formation, aggregation, and adsorption in the bulk and at the interface is important for scientific as well as practical viewpoints. We believe our investigation of molecular interactions will guide us to extend the research in an applied field of developing viable pharmaceutical formulations, in the field of solutions and biotechnology. Moreover, addressing the possible process of micellization between tyramine and long-chain glucosides is an important phenomenon from the applied point of view.

2. Experimental Section

2.1. Materials

The D-glucose was purchased from VWR Chemicals BDH with a vendor purity profile of about 99.99%. The amino acid amine used (i.e., taurine and tyramine) was purchased from HCl, supplied by Sigma laboratory reagent, with a purity of about 99%, as mentioned by the vendor. Before the further use of these chemicals in our research work, we ensured their moistureless involvement. As the presence of moisture led to the deterring of our experimental data, the purchased chemicals were processed and dried over molecular sieves (Sigma Union Carbide 0.4 nm). The stock solution of 0.05 m (mol kg−1) taurine and tyramine was prepared in aqueous media and was used as a solvent for the preparation of the 0.01 to 0.05 m concentration of D-glucose solution. Electronic balance (Precisa XB 220 A, Swiss make) with precision, within a range ±0.02 K, was used for weighing entire concentrations and was prepared by a molality unit. All concentrations are prepared using double distilled water of conductivity below 3 μS cm−1 at 298.15 K. However, special glass bottles with airtight caps were used to store all concentrations to avoid evaporation, and the necessary precautions were adopted during surface tension measurements. The chemical structure of (a) taurine, (b) tyramine, and (c) D-glucose are presented in Figure 2.

2.2. Method

The surface tension measurements functioned using the KSV sigma 702 tensiometer between 298.15 and 318.15 K. At the same time, the Pt–Fe ring was used for all samples’ surface tension measurements. After every reading, the ring was burnt on low flames of ethanol and thoroughly washed with deionized water to take concurrent readings. The thermostated water bath (Julabo, Germany) with a precision of ±0.02 K was used to maintain the temperature in the sample solutions upon constant stirring. Meanwhile, the readings were averaged for all sample solutions. The accuracy of the surface tension measurement was ascertained by measuring the surface tension values of pure water and methanol, and was found to be 71.9 and 22.3 mNm−1 of pure water and methanol, and the measurements were carried out for each sample until the values were reproducible.

2.3. Surface Parameters along Thermodynamic Physicochemical Interpretations of Molecular Interactions by Various Mathematical Equations

2.3.1. Gibbs Adsorption Isotherm Equations of Interfacial Parameters

To estimate the Gibbs adsorption isotherm equation, the values of surface tension (γ) were plotted against the concentration of aqueous taurine and tyramine with D-glucose (concentration in mol kg−1) at different temperature ranges. The intercept and slope were obtained by fitting the data into the linear regression equation, i.e., Y = a + mX [27,29]
γ = γ ο + d γ d C T , P C
Further, by using the value of slope (dγ/dC) at a constant temperature, the concentration of the solute in the surface and bulk, i.e., the surface excess concentration (Γ), was estimated by applying the Gibbs adsorption equation [27,29].
Γ = C R T d γ d C T , P
where the symbol Γ, represents the surface excess concentration. R as the universal gas constant (R = 8.3144 J mol−1 K−1) and T as the temperature in K. In addition, from the value of slope (dγ/dlogC), the surface excess concentrations were evaluated by using the Gibbs adsorption isotherm [26,30,31].
Γ = 1 2.303   R T d γ d   log C T
Further, the surface excess concentration (Γ) and the minimum surface area per molecule (Am) for the filled monolayer at the air/liquid interface were obtained by using the surface tension measurements for the concentration range from 0.01 to 0.05 m (mol kg−1), carried out at 298.15–318.15 temperatures, and the minimum area per head group (Am) can be evaluated by the equation given below [32,33]:
A m = 10 20 N A   Γ m
where NA is Avogadro’s number (6.02 × 10²³ molecules/atoms/ions) and the values of Am are calculated from the above Equation (3) and summarized in Table 1. Am as such is related to the minimum area per head group in Angstrom square units. The surface pressure, π C M C , i.e., the change in the surface tension caused by the solute, was calculated using an equation [34]:
π C M C = γ ο γ C M C
where γ ο is the surface tension of the solvent and γ C M C is that of the surface tension of the solution at CMC, respectively.

2.3.2. Linear Regression Equations of Thermodynamic Parameters

In addition, the physicochemical thermodynamic equations were used for the prevailing intermolecular interactions between the amino acid taurine (TAU) and amine tyramine (TYR) with D-glucose in aqueous media. The enthalpy (ΔH) and entropy (ΔS) of surface formation are evaluated by the fitting of surface tension (γ) versus temperature data at constant concentration, from a linear regression equation. The coefficient of a linear regression equation, (dγ/dT)c,p slope, was used to estimate the following equation [35]:
Δ H = γ   T   d γ dT C , P
where γ is the surface tension of the aqueous mixture, T is the temperature and coefficient, (dγ/dT)c,p is the slope obtained from the regression equation. The entropy (ΔS) was estimated by applying the following thermodynamic relation [35]:
Δ S = d γ dT C , P

2.3.3. Interfacial Adsorption Equations of Aggregation

We further explored that the free energy of tyramine aggregation, Δ G ο a g , in an aqueous mixture is associated with changes from their monomeric to an aggregated state, although such states are usually found in the case of a non-ionic surfactant and are given by an equation such as [36]:
Δ G ο a g =   -   RT ln C M C
where R is the universal gas constant and T is the temperature The free energy of adsorption ( Δ G a d ο ), i.e., the energy change associated with a molecule going from the bulk to the surface, was calculated by using the values of surface pressure ( π C M C ), minimum surface area per molecule (Am), and the Gibbs free energy of aggregation ( Δ G ο a g ), as given below [37]:
Δ G a d ο = Δ G ag π CM Γ m
The standard entropy of adsorption Δ S a d ο was estimated from the slope of the free energy of adsorption Δ G a d ο versus temperature T. The enthalpy of adsorption Δ H a d ο was calculated by using the following thermodynamic relation [38]:
Δ H a d ο = Δ G a d ο +   T Δ S a d ο

3. Results and Discussion

The molecular interaction of aqueous amine tyramine (TYR) and amino acid taurine (TAU) with D-glucose is possible through hydrophobic–hydrophobic interaction. In this case, water molecules are removed from the overlapping hydration shells into the bulk of the solvent. There is no repulsion between the solute and co-solute molecules, and the hydrophobic parts of the molecules approach each other. In an aqueous medium, the amino acid behaves as a simple electrolyte that exists as a free monomer, but as the concentration is increased, the solution behavior changes. Surface-active molecules of taurine and tyramine tend to concentrate at the air/liquid interface, behaving as surfactants, which have important applications in the pharmaceutical and food industries. Thus, it would be interesting to examine aggregation transport properties and various thermodynamic parameters, which are significant in understanding the influence of the aggregation and structural contributions of amines towards the CMC values. Therefore, it helps to deduce the arising effects of the aliphatic and aromatic structures of amines, and environmental deviations in the presence of different components. Hereby, we construe the occurrence of possible molecular interactions prevailing between D-glucose with an aqueous TYR and TAU by the concentration and temperature dependence of surface tension measurements.

3.1. Self-Aggregation, i.e., Critical Micelle Concentration (CMC)

The molecules of taurine and tyramine with D-glucose aggregate at the surface like micelles. The assembly of self-aggregated molecules above a concentration is called critical micelle concentration. The value of CMC is estimated from the intersection points of two lines above and below CMC for each temperature. These values of CMC are utilized to evaluate many thermodynamic and transport parameters, which helps to understand the hydrophilic and hydrophobic characteristics of molecules. The surface tension of the five different concentrations of glucose, i.e., 0.01, 0.02, 0.03, 0.04, and 0.05 mol kg−1 in aqueous taurine and tyramine solutions at 298.15, 303.15, 308.15, 313.15, and 318.15 K temperatures, have been measured experimentally. The observed data were essential parameters for the estimation of the Gibbs adsorption isotherm equation and the thermodynamic parameters of surface formation.

3.2. Influence of Aliphatic Amines on the Surface Tension Data

Surface tension data at different temperatures were interpreted to comprehend the possible molecular interactions between aqueous taurine with D-glucose, as depicted in Figure 3a. However, an introduction of D-glucose generally increases the surface tension of water with cavity formation. The stabilization of taurine with D-glucose in aqueous media causes cavity formations, which in turn affects the surface interactions and surface energy [39]. The surface energy of cavity formation can be deduced, hereby, from the obtained surface tension numerical values of the solution’s interface. As the glucose concentration increases in aqueous media, the added taurine molecules lead to a decrease in the numerical surface tension (γ) values at the various temperatures (298.15–318.15 K). Meanwhile, with the rising temperature, the adsorption process takes place with an expanse of dehydrated hydrophilic groups, which results in the surface energy slackening. Moreover, the small amount of surface energy indicates that the adsorption at the air/liquid interface is more favorable as compared to the bulk phase. Thus, the observed decreasing trend of the surface tension suggests that in aqueous taurine, a strong intermolecular force (IMF), including hydrogen bonding, was developed between Nδ+ of taurine amino acid and Oδ− of water molecules in its aggregates [40,41]. Further, the addition of glucose molecules as a solute results in the replacement of the taurine that was interacting with water, causing the weakening of IMF and hence, leading to a decrease in γ values. A linear decrease in the surface tension values was observed with the temperature rise (as shown in Figure 3b). With increasing temperatures, the molecules of D-glucose are directly interacting with the taurine molecules by possible hydrogen bonds between the –OH of D-glucose and (S-OH) groups of taurine molecules. We proposed these preferential interactions due to the decrease in surface tension and the comparatively strong binding of molecules as aggregates in bulk and then as free molecules at the interface. The surface tension on the interface depends on the temperature, which is attributed to the rise of the cohesive force between the taurine and water molecule, which in turn, increases the thermal activity and adhesive action [42,43].

3.3. Influence of Aromatic Amines on the Surface Tension Data, Formation of cac, and CMC

The obtained experimental data were interpreted for both systems, i.e., aqueous tyramine (TYR) and taurine (TAU) with D-glucose. In contrary to taurine behavior with glucose, tyramine has a breaking point in the curve at a critical aggregation concentration (cac), suggesting that the behavior of mixed D-glucose with the aqueous tyramine (TYR) system is equivalent to the system of a surfactant in aqueous media. Further, it was demonstrated in Figure 4 that the observed first curve break at concentration 0.02998 mol kg−1 at 298.15 K was emphasized as the critical aggregation concentration (cac). Further, as the concentration (C) increases, there is a sharp decrease in the curve obtained, and after a point, it becomes constant. This point is considered as a critical micelle concentration (CMC). However, the results we attained for D-glucose in the aqueous tyramine (TYR) system in terms of CMC were treated similarly to the CMC of a surfactant molecule, as illustrated in Figure 4a. Meanwhile, the attained and observed values of CMC at different temperatures are believed to be observed after the hydrophobicity, surface energy, and bulkiness of the interacting mono-amino acid tyramine (TYR) with D-glucose in aqueous media. In addition, the surface tension versus log C profile was depicted in Figure 4b to deduce the effect of tyramine aggregation in aqueous media with D-glucose molecules.

3.4. Counterion Effects on the Micellization Process

A slight increase in the surface tension shows critical aggregation concentration (cac), which governs the nature of the head group/alkyl chain length and counterion of tyramine amino acid [44]. Tyramine behaves like a surfactant, i.e., the surface tension after cac formation decreases linearly with the increase of concentration to a certain point, i.e., CMC, and then nearly constant values are obtained. The linear portion shows the adsorption of tyramine at the interface. The decreasing trend in the curve shows the formation of the Gibbs monolayer and, after a point, it becomes aggregate like the micellization of a surfactant, which deals with the bulk of the solution. The value of CMC depends on the temperature, and on the micellization process. As the temperature increases, the CMC value also increases because the hydrophobicity increases. An increase in temperature results in the breaking down of different molecular aggregations in the mixtures, which in turn results in the increase of the hydrophobic–hydrophobic interaction in the aqueous medium and decrease in the electrostatic repulsion. This indicates that the structural and solution aspects are predominant in the components of the solution mixture. This leads to favorable micellization due to the counterion effect of the micelle. Moreover, the various surface parameters of aqueous tyramine with glucose at different temperatures are tabulated in Table 1.

3.5. Interfacial Parameters and Gibbs Adsorption Isotherm

In order to calculate the Gibbs adsorption isotherm equation, the values of γ were plotted against C at different temperatures. The intercept and slope were obtained by fitting the data into the linear regression equation, i.e., Y = a + mX, as per Equation (1) mentioned in Section 2.3. In addition, the surface excess concentrations were estimated by applying the Gibbs adsorption (Equation (2) in Section 2.3). The utilization of Equation (2) was to comprehend the concentration of the solute in the bulk and interface of the system containing D-glucose in aqueous tyramine media. The experimentally obtained data of the surface tension of D-glucose in the aqueous tyramine system at the entire concentration and temperatures range was utilized to determine surface excess Γ values, as depicted in Figure 5a,b, and further related surface parameters are tabulated in Table 2. Meanwhile, our studies on D-glucose-taurine system, observed an increasing trend of Γ versus concentration, which was attributed to the micelle formation at the bulk of the solution; thus, the aggregation of molecules is aided by the use of more solute molecules in the bulk compared to the surface.

3.5.1. Surface Excess Concentration (Γ)

Surface excess concentration, Γ, of the glucose–tyramine system was plotted against log C, as shown in Figure 6 and Table 1, which further supports our observed surface excess properties by specifying a gradual decrease in surface tension with the increase of temperature.
It is clearly illustrated that at a concentration close to CMC, aggregation happened, which shows that adsorption tends to a limiting value, and therefore, the surface tension curve appears to be essentially linear. To study the interfacial properties of glucose in tyramine solutions, the surface tension of the linear portion (seen in Figure 4b) versus log C was fitted in the linear regression equation. From the value of slope (dγ/dlogC), the surface excess concentrations were evaluated by using the Gibbs adsorption isotherm (Equation (2) in Section 2.3). However, the concentration and temperature-dependent graphs of (Γ) are demonstrated in Figure 5a,b. Surface excess concentration decreases linearly with the increase of concentration, which indicates that at a low concentration, Γ is independent of temperature, whereas at a high concentration, Γ depends on temperature [4]. At a particular concentration, as temperature increases, the Γ value decreases, as shown in Figure 6. The reason for such behavior might be the high kinetic energy of the solute counterions. With the increase in temperature, kinetic energy increases because the holding capacity of the solute at the interface decreases, which leads to a decrease in the Γ values. Therefore, the surface tension of glucose in aqueous taurine also decreases because of the reduced force of attraction (IMF) between the molecules.
For the tyramine system, the Γ values are shown in Table 1 and the illustrative plots are given in Figure 6. It is observed that as the temperature rises, there is a nearly consistent decrease in the Γ values. This is due to the expansion of monomers and hence, the smaller number of monomers located at the interface with increasing temperature. The positive isotherm of tyramine indicates its surfactant-like behavior, in which solutes mostly accumulate onto the surface [32]. As the concentration increases, the hydrophobic interactions increase in the case of the tyramine (because of the aromatic ring C6H5CH2-) group as compared to taurine (aliphatic chain). Similar behavior is observed in the work of Abhishek Chandra et al. [45], which provides a good explanation of the surface tension behavior of amino acids with water and surfactant. For Glycine and L-Alanine, probably at higher temperatures, weaker ion–dipole interactions get disrupted and give way for the formation of new hydrogen bond between the water molecules. Consequently, this will lead to an increase in Γ values. Due to the C6H5CH2- aromatic group, L-Phenylalanine acts as a surfactant molecule with a steady decrease in surface tension with an increased concentration with water. It is interesting to note that decreased γ values upon the increase in L-Phenylalanine concentration produce a hydrophobically rich environment at the air–liquid interface, which dominates over the effect of π-conjugation. Thereby, it contributes to the fact that on hydrogen bonding, the surfactants act as structure-makers, but this effect is stronger with π-conjugated L-Phenylalanine due to the shift in charge on sp2 hybridization. Hence, it is very obvious that taurine resembles the Gly/L-Ala behavior and tyramine, like phenylalanine, which supports the accuracy of the work presented in this paper. Therefore, it is concluded that at lower concentrations, with the C6H5CH2-group, tyramine acts as a surfactant, but on a further increase in concentration, its hydrophobic part engages the solute molecules. Thus, it results in releasing water molecules from amino acids, leading to the formation of hydrogen bonds, with a steady increase in surface tension. Hence, the side chain of amino acids contributes to the hydrogen bonding capacity, hydrophobicity, and related interactions. These considerations led us to undertake the study of β-amino acids with glucose.

3.5.2. The Minimum Surface Area per Molecule (Am)

The change in the surface tension of the solutions compared to the pure solvent is linked to the excess or deficit of the solute at the interface than in the bulk, as interpreted by the Gibbs adsorption equation. A decreasing surface tension corresponds to a surface enhancement, whereas an increasing surface tension corresponds to a surface deficit. Thus, the properties of amino acids in aqueous with carbohydrates are essential for understanding the chemistry of biological systems [26,30,45]. The investigation of the surface excess concentration of D-glucose in taurine and tyramine solutions can provide information about solute–solute and solute–solvent interactions. From the surface excess concentration Γ, the surface area per molecule (Am) for the filled monolayer at the air/solvent interface was obtained using the surface tension measurements according to Equation (4), as shown in Section 2.3, where NA is Avogadro’s constant and the values of Am are given in Table 1. An increase in the surface area per molecule at the air/water interface with the increase of the temperature is reflected with the corresponding expansion of the solute at the interface. This expansion in surface area originates from the higher flexibility of the hydrophobic group at high temperatures. This also supports the interaction of the hydrophilic head group with each other as well as with the interface [37,46].

3.5.3. Surface Pressure ( π C M C )

Surface pressure, i.e., π C M C is the change in the surface tension caused by the solute molecules in amino acid tyramine with D-glucose, which was calculated as per Equation (5) of Section 2.3, where γ ο and γ C M C are the surface tension of the solvent and solution at CMC, respectively. The surface pressure of glucose in taurine is found to increase with the increase in concentration at different temperatures. The values tabulated in Table 3 fall very close to each other, which indicates that the surface pressure is a temperature-dependent parameter.
However, in the case of tyramine, the surface pressure of glucose is calculated by the difference in the surface tension of the solvent and that of the solute at CMC, i.e., ( π c m c = γ ο γ c m c ) [37]. In addition, the calculated surface pressure (π/mNm−2) of D-glucose in aqueous taurine at different temperatures is tabulated in Table 3. Moreover, in determining surfactant efficiency, the role of the molecular structure is primarily thermodynamic, while its role in effectiveness is directly related to the relative size of the hydrophilic and hydrophobic portions of the adsorbing molecule. In recent years, several workers have determined the various thermodynamic properties of these model compounds in aqueous solutions containing simple electrolytes having a hydrophilic nature [35]. Nevertheless, very few studies have been conducted on aqueous amino acids with glucose solutions.

3.6. Thermodynamic Physiochemical Parameters of Surface Formation

Thermodynamic physiochemical interactions in terms of changing enthalpy ΔH and entropy ΔS via surface formation are evaluated by fitting experimentally obtained data of surface tension versus temperatures at constant concentration into the linear regression equation. The coefficient of the linear equation (dγ/dT)c slope was calculated by Equations (6) and (7), as described in Section 2.3. The plotted graph of enthalpy versus concentration at varying temperatures was depicted in Figure 7. The enthalpy of the surface formation increases with concentration linearly, and after 0.04 mol kg−1, it further declines in numerical values when calculated at different temperatures, as tabulated in Table 4. Similar inferences, i.e., the increasing trend, were almost the same as observed with the enthalpy of the surface formation of chloride salts of Na+, NH4+, and K+ [47], whereas the decreasing trend supports the study of Matubayasi et al. [48], who reported an appreciable decrease in the enthalpy of the NaCl solution with concentration formation. The entropy of the surface formation decreases with a rise in the concentration of the solute, as shown in Table 5.
The interaction between the water dipole and the charge of the ion constitutes a fundamental factor for the entropy of surface formation. The entropy change (ΔS) of the surface formation of the aqueous taurine with glucose solution shows a slight decrease with the concentration increase, as tabulated in Table 5. It can be interpreted by taking into account the difference in the partial molal entropy of the solvent between the surface region and the bulk solution [49,50]. The interaction between the water dipole and the molecules present in the solution, such as glucose and taurine, is a fundamental factor for the change in ΔS. The larger value of the entropy of the solvent indicates that the partial molal entropy of the water is increased by the contact of the water and air in the surface region. Through the addition of glucose to aqueous taurine, there is a steady decrease in entropy change value over the whole concentration range studied. This leads to causing more ordering of solvent molecules at the interface.

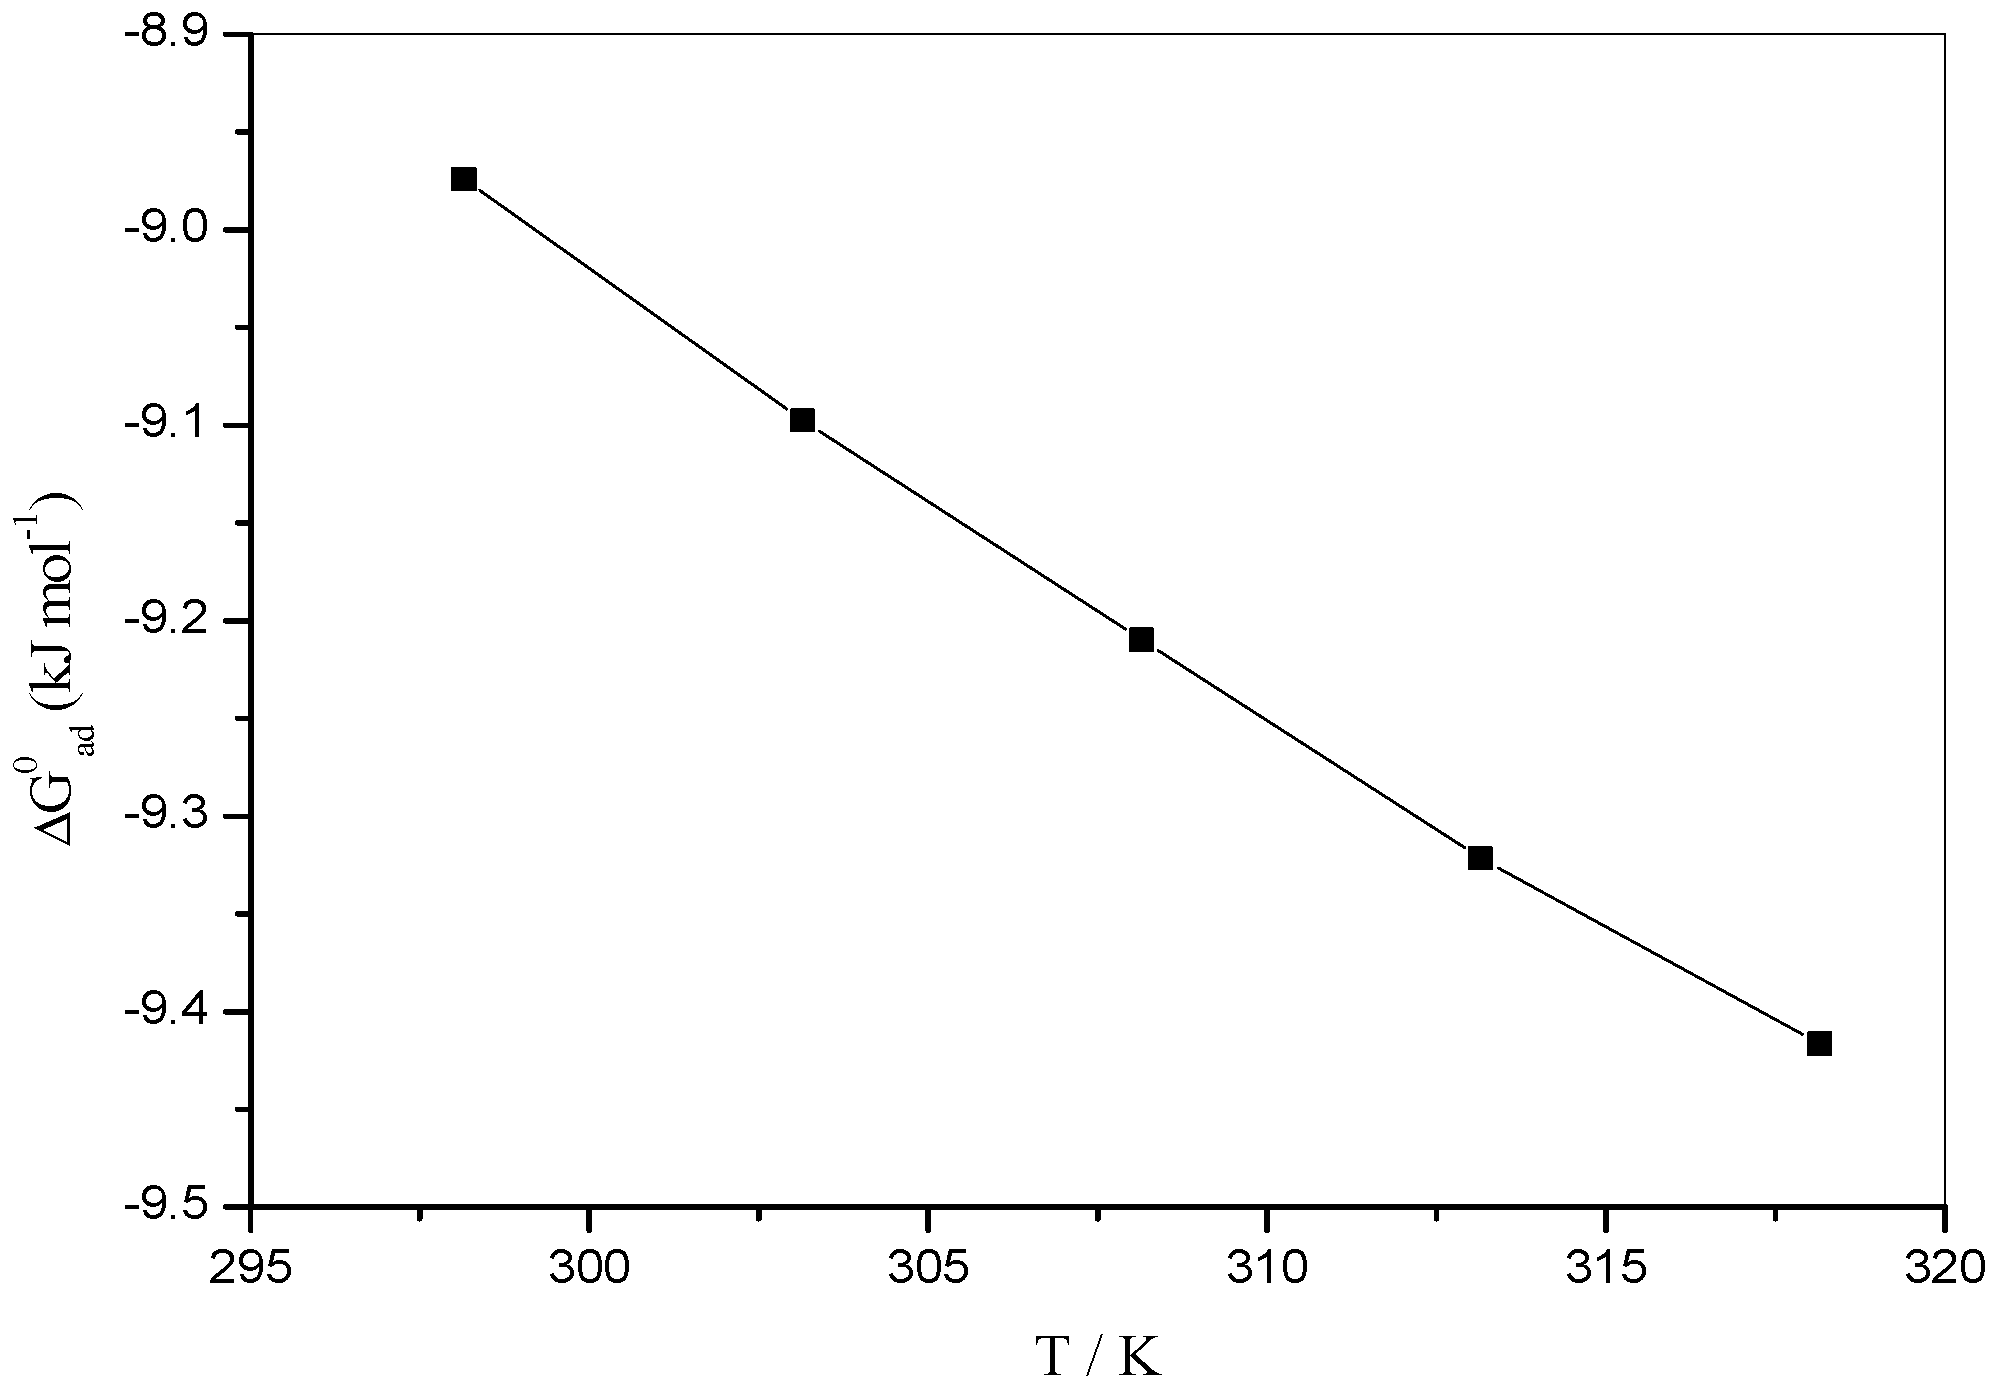
3.7. Thermodynamic Parameter of Adsorption

The thermodynamic parameter of adsorption at the air/water interface for tyramine is different as compared to taurine because of the presence of the C6H5CH2 -group. The tyramine aromatic moiety and a highly hydrophilic head group of glucose molecules induce a hydrophobically rich environment at the air–liquid interface, which dominates over the effect of π-conjugation. Tyramine was found to behave as a non-ionic surfactant and its phenyl ring was directed into the micellar core, where it is held by hydrophobic interaction. Therefore, it is concluded that the free energy of tyramine aggregation, Δ G ο a g , is associated with the change from a monomeric to an aggregated state, in the case of a non-ionic surfactant, as calculated by Equation (8) of Section 2.3. Moreover, the Equations (9) and (10) of Section 2.3 were used to calculate the free energy of adsorption, Δ G a d ο , and standard entropy of adsorption, Δ S a d ο , respectively. Δ G a d ο has been calculated from the values of surface pressure, surface area per molecule, and the Gibbs free energy of aggregation. Meanwhile, the standard entropy of adsorption, Δ S a d ο , was estimated from the slope of the free energy of adsorption Δ G a d ο versus temperature T, as depicted in Figure 7, and the said values are tabulated in Table 6. In addition, the enthalpy of adsorption, Δ H a d ο , was calculated by a thermodynamic relation, as per Equations (10) (Section 2.3). The Δ G ο a g and Δ G a d ο values are listed in Table 6, which shows negative values at all temperatures, indicating that the micellization and adsorption process is spontaneous in nature. The values of Δ G a d ο are more negative than Δ G ο a g because less energy is required for adsorption at a higher temperature; hence, the dehydration of the hydrophilic group occurs [48]. On the other hand, the Δ H a d ο values, as tabulated in Table 6, are positive, which suggests that the process of adsorption at the air/water interface is endothermic in nature. The numerical positive Δ S a d ο values (illustrated in Table 6) indicate the freedom of monomers at the interface; thus, the tyramine–glucose interaction is favored only by the entropy change. The Δ H a d ο and Δ S a d ο compensation effect is reported in the literature for many physiochemical processes. An increase in temperature reveals that the numerical values of Δ G a d ο are increased slightly, which governs that the adsorption of the glucose molecule at surface formation is mainly favored by the entropy-driven and enthalpy effect.

4. Conclusions

Surface tension plays a very important role in the understanding of the intermolecular interactions that exist on the surface and in the bulk of the solution. The decrease in the surface tension with the increasing concentration of glucose confirms that the structure-maker character of glucose in aqueous taurine has less of a significant influence than tyramine aggregates. Thus, the study on the molecular interaction of taurine and tyramine with D-glucose in aqueous solvent was inspected in terms of solute–solute and solute–solvent interactions. The observed phenomena are mainly affected by the size and nature of the side chain of aliphatic and aromatic amines. The negative value of free energy indicates that the adsorption process is spontaneous in nature. However, the adsorption process is favored by entropy gain as well as the enthalpy effect. The reported thermodynamic characteristics conclude that the hydrogen bonding and hydrophobic–hydrophilic and hydrophobic–hydrophobic interactions are more dominant than the ion–hydrophilic interaction.

Funding

This research received no external funding.

Institutional Review Board Statement

Not applicable.

Acknowledgments

The authors acknowledge the support of the Department of Chemistry, The Faculty of Science, University of Jazan (KSA), for providing facilities and necessary support in conducting experiments.

Conflicts of Interest

The author declare no conflict of interest.

References

  1. Coleman, W.; Chung, H. Pyrolys is GC-MS analysis of Amadori compounds derived from selected amino acids with glucose and rhamnose. J. Anal. Appl. Pyrolysis 2002, 63, 349–366. [Google Scholar] [CrossRef]
  2. Zhuo, K.; Liu, Q.; Wang, Y.; Ren, Q.; Wang, J. Volumetric and Viscosity Properties of Monosaccharides in Aqueous Amino Acid Solutions at 298.15 K. J. Chem. Eng. Data 2006, 51, 919–927. [Google Scholar] [CrossRef]
  3. Huyghues-Despointes, A.; Yaylayan, V.A.; Keyhani, A. Pyrolysis/GC/MS Analysis of 1-[(2′-carboxyl)pyrrolidinyl]-1-deoxy-D-fructose (Proline Amadori Compound). J. Agric. Food Chem. 1994, 42, 2519–2524. [Google Scholar] [CrossRef]
  4. Visentin, V.; Marq, P.; Bour, S.; Subra, C.; Prévot, D.; Morin, N.; Valet, P.; Monje, M.-C.; Nepveu, F.; Carpéné, C. Effect of prolonged treatment with tyramine on glucose tolerance in streptozotocin-induced diabetic rats. J. Physiol. Biochem. 2003, 59, 225–232. [Google Scholar] [CrossRef]
  5. Belitz, H.-D.; Grosch, W.; Schieberle, P. Food Chemistry; Springer: Berlin/Heidelberg, Germany, 2009. [Google Scholar]
  6. Kulikova, G.A.; Parfenyuk, E.V. Influence of Side Chain of L-α-amino Acids on Their Interaction with D-glucose in Dilute Aqueous Solutions. J. Solut. Chem. 2008, 37, 835–840. [Google Scholar] [CrossRef]
  7. Pal, A.; Kumar, S. Volumetric properties of l-alanine, and l-valine in aqueous sucrose solutions at T = (288.15 and 308.15) K. J. Chem. Thermodyn. 2005, 37, 1085–1092. [Google Scholar] [CrossRef]
  8. Magdassi, S. Surface Activity of Proteins: Chemical and Physicochemical Modifications; CRC Press: Boca Raton, FL, USA, 1996. [Google Scholar]
  9. Romero, C.M.; Albis, A. Influence of Polyols and Glucose on the Surface Tension of Bovine α-Lactalbumin in Aqueous Solution. J. Solut. Chem. 2010, 39, 1865–1876. [Google Scholar] [CrossRef]
  10. Sengupta, T.; Razumovsky, L.; Damodaran, S. Energetics of Protein−Interface Interactions and Its Effect on Protein Adsorption. Langmuir 1999, 15, 6991–7001. [Google Scholar] [CrossRef]
  11. Kaushik, J.K.; Bhat, R. Thermal Stability of Proteins in Aqueous Polyol Solutions: Role of the Surface Tension of Water in the Stabilizing Effect of Polyols. J. Phys. Chem. B 1998, 102, 7058–7066. [Google Scholar] [CrossRef]
  12. Yampolskaya, G.; Platikanov, D. Proteins at fluid interfaces: Adsorption layers and thin liquid films. Adv. Colloid Interface Sci. 2006, 128–130, 159–183. [Google Scholar] [CrossRef]
  13. Valderrama, J.M. Caracterización Interfacial de Proteínas y Tensioactivos: Aplicación a Dispersiones Alimentarias. Ph.D. Thesis, Universidad de Granada, Granada, Spain, 2006. [Google Scholar]
  14. Mehr, H.M.; Koocheki, A. Physicochemical properties of Grass pea (Lathyrus sativus L.) protein nanoparticles fabricated by cold atmospheric-pressure plasma. Food Hydrocoll. 2021, 112, 106328. [Google Scholar] [CrossRef]
  15. Oladzadabbasabadi, N.; Nafchi, A.M.; Ariffin, F.; Wijekoon, M.J.O.; Al-Hassan, A.; Dheyab, M.A.; Ghasemlou, M. Recent advances in extraction, modification, and application of chitosan in packaging industry. Carbohydr. Polym. 2022, 277, 118876. [Google Scholar] [CrossRef] [PubMed]
  16. Zamani, Z.; Razavi, S.M. Physicochemical, rheological and functional properties of Nettle seed (Urtica pilulifera) gum. Food Hydrocoll. 2021, 112, 106304. [Google Scholar] [CrossRef]
  17. Huxtable, R.J. Physiological actions of taurine. Physiol. Rev. 1992, 72, 101–163. [Google Scholar] [CrossRef] [PubMed] [Green Version]
  18. Carver, J.D. Advances in nutritional modifications of infant formulas. Am. J. Clin. Nutr. 2003, 77, 1550S–1554S. [Google Scholar] [CrossRef] [PubMed] [Green Version]
  19. Ben, X.-M. Nutritional management of newborn infants: Practical guidelines. World J. Gastroenterol. WJG 2008, 14, 6133–6139. [Google Scholar] [CrossRef]
  20. Roysommuti, S.; Wyss, J.M. Perinatal taurine exposure affects adult arterial pressure control. Amino Acids 2014, 46, 57–72. [Google Scholar] [CrossRef] [Green Version]
  21. Suwanich, A.; Wyss, J.M.; Roysommuti, S. Taurine supplementation in spontaneously hypertensive rats: Advantages and limitations for human applications. World J. Cardiol. 2013, 5, 404. [Google Scholar] [CrossRef]
  22. Yamori, Y.; Taguchi, T.; Hamada, A.; Kunimasa, K.; Mori, H.; Mori, M. Taurine in health and diseases: Consistent evidence from experimental and epidemiological studies. J. Biomed. Sci. 2010, 17, S6. [Google Scholar] [CrossRef] [PubMed] [Green Version]
  23. Ames, J.M. The Maillard Reaction, Biochemistry of Food Proteins; Springer: Berlin/Heidelberg, Germany, 1992; pp. 99–153. [Google Scholar]
  24. Sajid, I.; Khaliq, S.; Tabassum, S.; Anis, L.; Ahmed, S.; Haider, S. A dose related study on the effects of taurine administration on recognition and spatial memory functions and depression like symptoms in rats. Int. J. Adv. Res. 2013, 1, 364–371. [Google Scholar]
  25. Morin, N.; Visentin, V.; Calise, D.; Marti, L.; Zorzano, A.; Testar, X.; Valet, P.; Fischer, Y.; Carpéné, C. Tyramine stimulates glucose uptake in insulin-sensitive tissues in vitro and in vivo via its oxidation by amine oxidases. J. Pharmacol. Exp. Ther. 2002, 303, 1238–1247. [Google Scholar] [CrossRef] [Green Version]
  26. Ali, K.; Shah, A.-U.A.; Bilal, S. Surface tensions and thermodynamic parameters of surface formation of aqueous salt solutions: III. Aqueous solution of KCl, KBr and KI. Colloids Surfaces A Physicochem. Eng. Asp. 2009, 337, 194–199. [Google Scholar] [CrossRef]
  27. Nabi, A.; Tasneem, S.; Jesudason, C.G.; Lee, V.S.; Zain, S.B.M. Study of interaction between cationic surfactant (CTAB) and paracetamol by electrical conductivity, tensiometric and spectroscopic methods. J. Mol. Liq. 2018, 256, 100–107. [Google Scholar] [CrossRef]
  28. Nabi, A.; Jesudason, C.G.; Malik, M.A.; Nabi, F. Prediction of viscosities and COSMO-RS analyses in binary mixtures of N,N-dimethylformamide with acetone. Phys. Chem. Liq. 2017, 55, 264–275. [Google Scholar] [CrossRef]
  29. Ali, K.; Haq, A.U.; Bilal, S.; Siddiqi, S. Concentration and temperature dependence of surface parameters of some aqueous salt solutions. Colloids Surfaces A Physicochem. Eng. Asp. 2006, 272, 105–110. [Google Scholar] [CrossRef]
  30. Castro, E.; Taboada, P.; Mosquera, V. Cosolvent Effects on the Micellization of Oxyphenyl(copoly)ethylene Oxide Copolymers in Aqueous Solution. J. Phys. Chem. B 2006, 110, 13113–13123. [Google Scholar] [CrossRef]
  31. Belton, G. Langmuir adsorption, the Gibbs adsorption isotherm, and interfacial kinetics in liquid metal systems. Metall. Mater. Trans. B 1976, 7, 35–42. [Google Scholar] [CrossRef]
  32. Naess, S.N.; Elgsaeter, A.; Foss, B.J.; Li, B.; Sliwka, H.-R.; Partali, V.; Melø, T.B.; Naqvi, K.R. Hydrophilic Carotenoids: Surface Properties and Aggregation of Crocin as a Biosurfactant. Helv. Chim. Acta 2006, 89, 45–53. [Google Scholar] [CrossRef]
  33. Chauhan, S.; Sharma, P.; Rana, D. Thermodynamics and micellization of cetyltrimethyl ammonium bromide in the presence of lysozyme. J. Mol. Liq. 2013, 187, 1–6. [Google Scholar] [CrossRef]
  34. Rao, K.S.; Singh, T.; Trivedi, T.J.; Kumar, A. Aggregation Behavior of Amino Acid Ionic Liquid Surfactants in Aqueous Media. J. Phys. Chem. B 2011, 115, 13847–13853. [Google Scholar] [CrossRef] [PubMed]
  35. Abraham, M.; Abraham, M.C. Ziogas, Surface tension of liquids from molten nitrate mixtures to water. J. Am. Chem. Soc. 1991, 113, 8583–8590. [Google Scholar] [CrossRef]
  36. Maeda, H. A Simple Thermodynamic Analysis of the Stability of Ionic/Nonionic Mixed Micelles. J. Colloid Interface Sci. 1995, 172, 98–105. [Google Scholar] [CrossRef]
  37. Shah, A.-U.A.; Ali, K.; Bilal, S. Surface tension, surface excess concentration, enthalpy and entropy of surface formation of aqueous salt solutions. Colloids Surfaces A Physicochem. Eng. Asp. 2013, 417, 183–190. [Google Scholar] [CrossRef]
  38. Soni, S.S.; Sastry, N.V.; Aswal, V.K.; Goyal, P.S. Micellar Structure of Silicone Surfactants in Water from Surface Activity, SANS and Viscosity Studies. J. Phys. Chem. B 2002, 106, 2606–2617. [Google Scholar] [CrossRef]
  39. Sínanoĝlu, O.; Abdulnur, S. Hydrophobic stacking of bases and the solvent denaturation of DNA. Photochem. Photobiol. 1964, 3, 333–342. [Google Scholar] [CrossRef]
  40. Noudeh, G.D.; Housaindok, M.; Bazzaz, B.S.F. The Effect of Temperature on Thermodynamic Parameters of Micellization of Some Surfactants. J. Appl. Sci. 2007, 7, 47–52. [Google Scholar] [CrossRef] [Green Version]
  41. Ikeda, N.; Aratono, M.; Motomura, K. Thermodynamic study on the adsorption of sodium chloride at the water/hexane interface. J. Colloid Interface Sci. 1992, 149, 208–215. [Google Scholar] [CrossRef]
  42. Zhao, C.; Ma, P.; Li, J. Partial molar volumes and viscosity B-coefficients of arginine in aqueous glucose, sucrose and l-ascorbic acid solutions at T = 298.15 K. J. Chem. Thermodyn. 2005, 37, 37–42. [Google Scholar] [CrossRef]
  43. Banipal, T.S.; Kaur, J.; Banipal, P.K.; Singh, K. Study of Interactions between Amino Acids and Zinc Chloride in Aqueous Solutions through Volumetric Measurements at T = (288.15 to 318.15) K. J. Chem. Eng. Data 2008, 53, 1803–1816. [Google Scholar] [CrossRef]
  44. Hamid, M.K.; Rüter, A.; Kuczera, S.; Olsson, U. Slow Dissolution Kinetics of Model Peptide Fibrils. Int. J. Mol. Sci. 2020, 21, 7671. [Google Scholar] [CrossRef]
  45. Chandra, A.; Patidar, V.; Singh, M.; Kale, R. Physicochemical and friccohesity study of glycine, l-alanine and l-phenylalanine with aqueous methyltrioctylammonium and cetylpyridinium chloride from T = (293.15 to 308.15)K. J. Chem. Thermodyn. 2013, 65, 18–28. [Google Scholar] [CrossRef]
  46. Niraula, T.P.; Shah, S.K.; Chatterjee, S.K.; Bhattarai, A. Effect of methanol on the surface tension and viscosity of sodiumdodecyl sulfate (SDS) in aqueous medium at 298.15–323.15 K. Karbala Int. J. Mod. Sci. 2018, 4, 26–34. [Google Scholar] [CrossRef]
  47. Matubayasi, N.; Yoshikawa, R. Thermodynamic quantities of surface formation of aqueous electrolyte solutions: VII. Aqueous solution of alkali metal nitrates LiNO3, NaNO3, and KNO3. J. Colloid Interface Sci. 2007, 315, 597–600. [Google Scholar] [CrossRef] [PubMed]
  48. Matubayasi, N.; Matsuo, H.; Yamamoto, K.; Yamaguchi, S.-I.; Matuzawa, A. Thermodynamic Quantities of Surface Formation of Aqueous Electrolyte Solutions: I. aqueous solutions of NaCl, MgCl2, and LaCl3. J. Colloid Interface Sci. 1999, 209, 398–402. [Google Scholar] [CrossRef]
  49. Matubayasi, N.; Tsunetomo, K.; Sato, I.; Akizuki, R.; Morishita, T.; Matuzawa, A.; Natsukari, Y. Thermodynamic quantities of surface formation of aqueous electrolyte solutions: IV. Sodium halides, anion mixtures, and sea water. J. Colloid Interface Sci. 2001, 243, 444–456. [Google Scholar] [CrossRef]
  50. Khan, A.; Siddiq, M. Surface activity and micellar behavior of dimethylamino- and trimethylammonium- tipped oxyethylene-oxybutylene diblock copolymers in aqueous media. J. Appl. Polym. Sci. 2010, 118, 3324–3332. [Google Scholar] [CrossRef]
Figure 1. Possible molecular interactions between taurine and tyramine in aqueous D-glucose media.
Applsci 13 07012 g001
Figure 2. Chemical structure of (a) taurine, (b) tyramine, and (c) D-glucose.
Applsci 13 07012 g002
Figure 3. (a) Surface tension versus concentration plot of aqueous taurine with D-glucose at different temperatures, (b) Surface tension versus temperature plot of aqueous taurine with D-glucose at different concentrations.
Applsci 13 07012 g003
Figure 4. (a) Surface tension versus concentration plot of aqueous tyramine with D-glucose at different temperatures, (b) Surface tension versus Log C plot of aqueous tyramine with D-glucose at different temperatures.
Applsci 13 07012 g004
Figure 5. (a) Surface excess concentration (G) versus concentration plot of aqueous taurine with D-glucose at different temperatures, (b) Surface excess concentration (G) versus temperature (T) plot of aqueous taurine with D-glucose at different concentrations.
Applsci 13 07012 g005
Figure 6. Surface excess concentration (G) versus temperature (T) plot of aqueous tyramine with D-glucose at different concentrations.
Applsci 13 07012 g006
Figure 7. Gibbs free energy of aggregation Δ G a d ο versus temperature (T) plot of aqueous tyramine with D-glucose.
Applsci 13 07012 g007
Table 1. Surface parameters, γCMC (surface tension of solution at CMC), π C M C (the surface pressure), CMC (critical micelle concentration), ∂γ/∂log10 C (value of slope), Γ (the surface excess concentration), and Am (the minimum area per head group) of aqueous tyramine with D-glucose solutions at different temperatures.
Parameters
T/(K)
γCMC
(mNm−1)
π C M C
(mNm−1)
CMC
(mol·kg−1)
γ/∂log10 C−Γ
(103 mol·m−2)
Am
(10−5 nm2)
298.1555.952.450.0299850.148.7831 ± 0.0981.8903
303.1553.332.370.0301944.817.7199 ± 0.0912.1507
308.1550.592.410.0303537.416.3405 ± 0.0922.6186
313.1547.700.800.0304833.565.5971 ± 0.0972.9663
318.1544.810.890.0306232.365.3122 ± 0.0943.1255
Table 2. Surface excess concentration (Γ × 10−4/mol m−2) of aqueous taurine with D-glucose solutions at different temperatures.
m (mol·kg−1)T/(K)
298.15303.15308.15313.15318.15
Glucose + aq. TaurineSurface excess concentration (Γ × 10−4/mol m−2)
0.016.0341 ± 0.0235.6845 ± 0.0665.1978 ± 0.0114.8457 ± 0.0514.6561 ± 0.038
0.0212.0683 ± 0.02211.3689 ± 0.06910.3956 ± 0.0209.6915 ± 0.0849.3122 ± 0.093
0.0318.1024 ± 0.02417.0534 ± 0.03615.5931 ± 0.05114.5372 ± 0.06713.9683 ±0.056
0.0424.1365 ± 0.02422.7379 ± 0.03020.7911 ± 0.03519.3829 ± 0.03018.6243 ± 0.090
0.0530.1707 ± 0.03328.4224 ± 0.09125.9889 ± 0.02924.2287 ±0.06123.2804 ± 0.036
Table 3. Surface pressure (π/mNm−2) of aqueous taurine with D-glucose solution at different temperatures.
m (mol·kg−1)T/(K)
298.15303.15308.15313.15318.15
Glucose + aq. TaurineSurface pressure (π/mNm−2)
0.012.002.072.032.062.06
0.023.703.803.633.503.53
0.035.305.305.034.794.76
0.046.706.576.165.905.75
0.057.337.036.566.276.16
Table 4. Enthalpies, ΔH (kJ/mol), of surface formation of aqueous taurine amino acid with D-glucose solution at different temperatures.
m (mol·kg−1)T/(K)
298.15303.15308.15313.15318.15
Glucose. aq. TaurineEnthalpies, ΔH (kJ/mol)
013.26 ± 0.03611.185 ± 0.0438.94 ± 0.0216.735 ± 0.0964.723 ±0.113
0.0110.664 ± 0.0339.594 ± 0.0698.464 ± 0.0947.304 ± 0.0896.364 ± 0.119
0.0213.434 ± 0.04012.334 ± 0.03511.334 ± 0.08310.334 ± 0.0849.364 ± 0.125
0.0317.496 ± 0.08216.496 ± 0.04415.596 ± 0.08714.706 ± 0.08713.796 ± 0.106
0.0421.758 ± 0.06920.888 ± 0.06220.128 ± 0.06119.258 ± 0.02318.468 ± 0.121
0.0515.466 ± 0.06114.766 ± 0.06414.066 ± 0.09113.226 ± 0.03112.396 ± 0.109
Table 5. Entropies, ΔS/(kJ·mol−1 K−1), and linear regression coefficients, R2 (surface tension vs. temperature), of surface formation of aqueous taurine amino acid with D-glucose solution at different temperatures.
Glucose + aq. Taurine
m (mol·kg−1)ΔS/(kJ·mol−1 K−1)R2
00.215 ± 0.00460.99826
0.010.217 ± 0.00500.99862
0.020.202 ± 0.00440.99928
0.030.183 ± 0.00790.99947
0.040.164 ± 0.00450.99715
Table 6. Free energy of aggregation, Δ G ο a g , free energy of adsorption, Δ G a d ο enthalpy, Δ H a d ο and entropy, Δ S a d ο of adsorption for D-glucose in the aqueous tyramine at different temperatures.
T/K Δ G ο a g /(kJ·mol−1) Δ G a d ο /(kJ·mol−1) Δ H a d ο /(kJ·mol−1) Δ S a d ο /(kJ·mol−1 K−1)
298.15−8.6953 ± 0.041−8.9743 ± 0.02015.5336 ± 0.0240.022 ± 0.103
303.15−8.8230 ± 0.033−9.0976 ± 0.01615.7669 ± 0.0240.022 ± 0.103
308.15−8.9559 ± 0.033−9.2098 ± 0.01915.9891 ± 0.0270.022 ± 0.103
313.15−9.0894 ± 0.031−9.3217 ± 0.01816.2110 ± 0.0230.022 ± 0.103
318.15−9.2225 ± 0.044−9.4164 ± 0.01516.4157 ± 0.0290.022 ± 0.103
Disclaimer/Publisher’s Note: The statements, opinions and data contained in all publications are solely those of the individual author(s) and contributor(s) and not of MDPI and/or the editor(s). MDPI and/or the editor(s) disclaim responsibility for any injury to people or property resulting from any ideas, methods, instructions or products referred to in the content.

