Review

Advances in Computer-Aided Medical Image Processing

1
College of Software, Jilin University, Changchun 130012, China
2
College of Computer Science and Technology, Jilin University, Changchun 130012, China
*
Author to whom correspondence should be addressed.
Appl. Sci. 2023, 13(12), 7079; https://doi.org/10.3390/app13127079
Submission received: 24 April 2023 / Revised: 31 May 2023 / Accepted: 2 June 2023 / Published: 13 June 2023

Abstract

:

Featured Application

Enhancing Clinical Diagnosis through the Integration of Deep Learning Techniques in Medical Image Recognition. This comprehensive review highlights the transformative potential of deep learning techniques in medical image recognition, with a focus on applications that can improve the accuracy and efficiency of clinical diagnosis. By examining a range of approaches, including image enhancement, multimodal medical image fusion, and intelligent image recognition tailored to specific anatomical structures, this study demonstrates the effectiveness of advanced neural network designs in extracting multilevel features from medical images. The featured application emphasizes the importance of addressing key challenges, such as data quality, model interpretability, generalizability, and computational resource requirements. By exploring future directions in data accessibility, active learning, explainable AI, model robustness, and computational efficiency, this study paves the way for the successful integration of AI in clinical practice, ultimately leading to enhanced patient care. Through this featured application, the potential of deep learning techniques to revolutionize medical imaging is brought to the forefront, demonstrating how these advanced methods can support clinicians in making more informed diagnostic decisions, ultimately improving patient outcomes and the overall quality of healthcare.

Abstract

The primary objective of this study is to provide an extensive review of deep learning techniques for medical image recognition, highlighting their potential for improving diagnostic accuracy and efficiency. We systematically organize the paper by first discussing the characteristics and challenges of medical imaging techniques, with a particular focus on magnetic resonance imaging (MRI) and computed tomography (CT). Subsequently, we delve into direct image processing methods, such as image enhancement and multimodal medical image fusion, followed by an examination of intelligent image recognition approaches tailored to specific anatomical structures. These approaches employ various deep learning models and techniques, including convolutional neural networks (CNNs), transfer learning, attention mechanisms, and cascading strategies, to overcome challenges related to unclear edges, overlapping regions, and structural distortions. Furthermore, we emphasize the significance of neural network design in medical imaging, concentrating on the extraction of multilevel features using U-shaped structures, dense connections, 3D convolution, and multimodal feature fusion. Finally, we identify and address the key challenges in medical image recognition, such as data quality, model interpretability, generalizability, and computational resource requirements. By proposing future directions in data accessibility, active learning, explainable AI, model robustness, and computational efficiency, this study paves the way for the successful integration of AI in clinical practice and enhanced patient care.

1. Introduction

Common tumor imaging methods include computed tomography (CT), magnetic resonance imaging (MRI), and radionuclide imaging. However, the recognition of medical images relies heavily on the experience, responsibility, and awareness of doctors, so each film needs to be carefully screened by doctors, which consumes considerable energy. Meanwhile, too much mechanical and repetitive work also causes doctors to make mistakes in judgement due to excessive fatigue. At this time, using computer technology to assist in tumor diagnosis to help doctors improve speed and reduce errors has gradually become a research hotspot.
With the continuous development of medical imaging technology and computer technology and the improvement of computing power, big data technology makes the application of artificial intelligence increasingly extensive [1]. Currently, automated medical image analysis has become an indispensable technical means in medical research, clinical diagnosis, and treatment. At the same time, medical image segmentation based on deep learning has made rapid progress. Some segmentation models with good performance have been proposed successively. Deep learning algorithms, especially convolutional networks [2], have quickly become the preferred method for analyzing medical images [3,4]. Compared with the manual segmentation method, the model based on deep learning is more accurate and quicker, which can greatly reduce the work burden of clinicians. Medical image segmentation based on deep learning has become an important research branch in the field of computer vision and has been widely studied by researchers at home and abroad. In the sudden outbreak of COVID-19, the detection method of deep learning was also an important tool for medical image recognition, which helps to automatically and quickly evaluate CT images to distinguish COVID-19 from other clinical entities and plays a huge role in actual life [5,6,7]. At the same time, deep learning plays a key role in the identification of cervical cancer and breast cancer, a disease with high death rate among women [8,9,10,11].
This paper presents a comprehensive overview of computer technology applications in medical imaging, addressing both the unique characteristics of medical images and the similarities they share with common images. This paper provides a comprehensive analysis of medical imaging techniques, specifically MRI and CT, along with their associated challenges. It discusses direct image processing methods, such as image enhancement and multimodal medical image fusion, as well as intelligent image recognition tailored to specific body parts using deep learning models such as CNNs, transfer learning, attention mechanisms, and cascading strategies. The significance of neural network design in medical imaging is emphasized, with a focus on extracting multilevel features through U-shaped structures, dense connections, 3D convolution, and multimodal feature fusion. Deeper and wider networks, smaller convolution kernels, pretraining, and feature augmentation are explored to improve network performance and efficiency. The paper also addresses the challenges in medical image recognition, such as data quality, model interpretability, generalizability, and computational resources. To overcome these obstacles, future directions include improving data accessibility, employing active learning, developing explainable AI, enhancing model robustness, and optimizing computational efficiency. By addressing these challenges, the successful integration of AI in clinical practice can be achieved, ultimately leading to improved patient care.

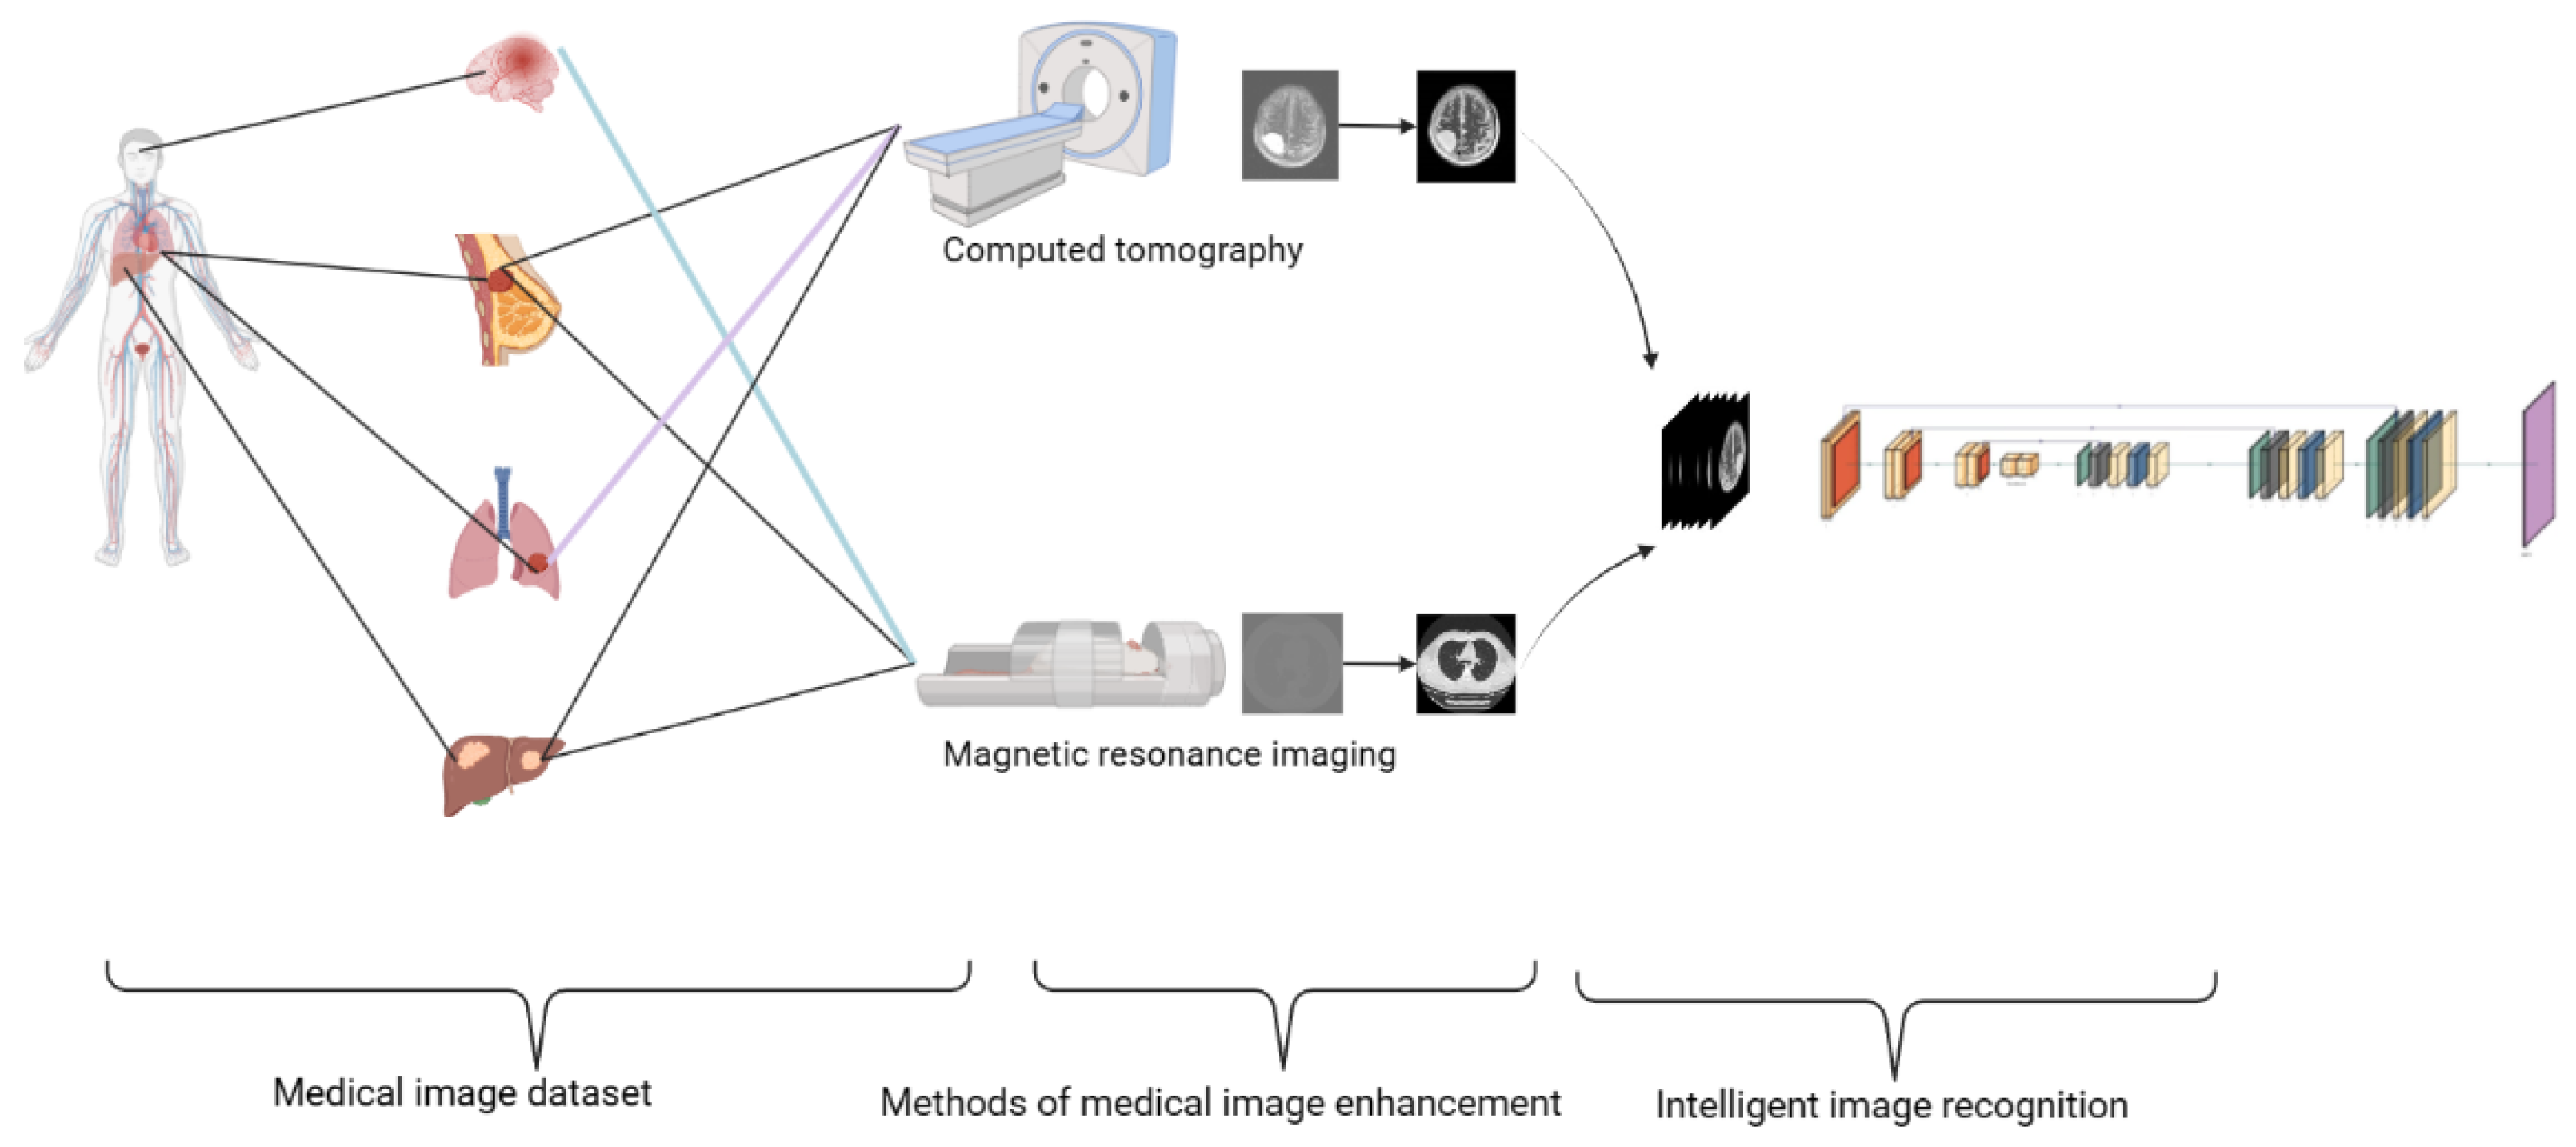
2. The Formation of Medical Images

Magnetic resonance imaging (MRI) and computed tomography (CT) are the two most common multimodal medical imaging technologies for diagnosing the most common pretumor [12,13]. It is also the main object of most image-type methods. The following introduces the characteristics, datasets, and existing problems of the two kinds of images.

2.1. Dataset

Equation (1) determines the landing application capability of the model: generalization error, where n represents the number of training samples, and complexity represents the complexity of the model (i.e., the size of the family of functions).
ϵ t e s t ϵ ^ t r a i n + c o m p l e x i t y n
From the 1974 AI winter to today, the widespread application of deep learning has benefited from advances in related fields, including central processing unit (CPU) and graphics processing unit (GPU) advances, the availability of big data, and the formation of the underlying models and frameworks for deep learning. Deep learning neural network training often requires a large amount of medical image data, which can improve the accuracy of the model, prevent overfitting of the model, and increase the generalizability of the model. Only when the test error of the model is small can the model have generalizability and be applied in practice. As seen from Formula (1), the larger the size of the dataset is, the greater is the possibility that the deep learning model can be applied in practice [14]. However, for medical applications, datasets are rare and precious: (1) First, for rare tumors, there are not enough cases, which makes the data source very rare. (2) Second, annotation requires considerable time spent by medical experts, and multiple expert opinions are needed to overcome human error. The lack of qualified experts makes the marked trainable dataset even rarer. (3) Meanwhile, due to the privacy of patients and the confidentiality of hospitals, sharing scarce medical data becomes complicated and difficult. For the above reasons, the dataset possessed by deep learning in this field is very limited [15], which obviously contradicts the requirement of deep learning generalization for massive data. When the number of available samples in the training stage is large, deep learning is very effective. Thus, one of the major challenges in applying deep learning to medical images comes from the limited training samples available to build depth models without suffering from overfitting. In this section, we emphasize the types and features of datasets of some open challenges [16,17], as well as the data in the literature. Table 1 presents a summary of the MRI dataset, and Table 2 presents a summary of the CT dataset. Researchers can obtain data from open challenges based on location and image features or track the corresponding literature datasets to obtain data with regional characteristics.

2.2. Defects in Medical Imaging

2.2.1. Defects of MRI

In Section 2.1, for MRI imaging technology, we introduce the advantages. However, MRI scanners rely on complex superconducting electromagnets and excellent electronic equipment for imaging, which leads to high cost, a large area of site occupancy, and demanding imaging site conditions. Therefore, people have begun to promote the development of low-cost MRI technology with ultralow field (ULF) intensity for large-scale medical image detection [53,54], which leads the MRI images’ disadvantage in that most clinical images are lost to computers [55]. Figure 1, Figure 2 and Figure 3 show the differences between T1-weighted images, T2-weighted images, and FLAIR-weighted images based on a high magnetic field, standard MRI images, and an ultralow field MRI, respectively. It can be seen from the comparison that these ultralow field MRI images have low brightness, poor contrast, no obvious details, and considerable noise, which is not convenient for computer and doctor detection.

2.2.2. Defects of CT

In Section 2.1, for CT imaging technology, we introduce its advantages. CT is one of the most popular tumor imaging techniques to date, but it has caused concerns due to its extensive radiation. Studies have shown that the projected radiation to body organs during CT scans is very high in the thyroid, lung, mammary gland, and esophagus, and high-dose CT promotes the proliferation of mammary gland tissue and cells to a higher extent. Children and young women are more susceptible to radiation damage, and the risk of malignant tumors after radiation is increased [56,57,58,59]. This has made people reluctant to use CT scans for fear of cancer or genetic disease. Therefore, many clinical examinations use low-dose CT (LDCT) imaging to minimize radiation-related risks without substantially damaging the screener’s body [60,61]. Low-dose CT scanning is an imaging method that considerably reduces the X-ray dose on the basis of a conventional dose of CT scanning, and it mainly reduces the dose by reducing the current and voltage intensity and irradiation time of the X-ray emitter tube, which leads to serious artifacts and noise pollution in the projected data. As a result, the contrast of low-dose CT images is lower, and the clarity is poor. Compared with conventional-dose CT images, the nodules are not obvious, and the tissue surrounding the nodules is poor. Figure 4 and Figure 5 show the CT at the conventional-dose level and the CT at the 1/10-dose level, respectively. Through comparison, it was found that the currently commonly used CT image datasets have disadvantages, such as high noise, burr phenomenon at the image edge, excessive particle noise, and poor contrast.

3. Medical Image Processing

3.1. Direct Image Processing

3.1.1. Medical Image Enhancement Technology

In Section 2, we explain that medical imaging is one of the most important diagnosis and treatment methods in modern hospitals, which is of great importance for tumor detection. However, the existing medical images have problems, such as low brightness, poor contrast, indistinct detail, and a large amount of granular noise. The medical images are dark, the contrast between the target area and the background is low, and there are burrs at the edge of the image. These problems make it difficult and easy to distinguish fine features, which is not conducive to the recognition of observers. Therefore, research on image enhancement of medical images [62] has always been a popular topic in the fields of automatic tumor identification and intelligent medicine. The basic principle of image enhancement is to enhance the contrast and information contained in the image to make it more suitable for specific applications, enhance the detection of the edge of the lesion area, and make the image easier to analyze by humans or computers.
As a result of the low brightness and poor contrast of medical images, methods, such as spatial image enhancement, can be well solved. The most commonly used method of spatial image enhancement is the global histogram equalization algorithm (GHE), which is based on the principle that all pixels of the image are uniformly distributed according to the pixel level; that is, the gray distribution of the original image is spread from the more concentrated area to the entire gray range and evenly distributed. This not only can enhance the local contrast without affecting the overall contrast but also can make the picture brightness more evenly distributed on the histogram. On the method of global histogram equalization, contrast limiting adaptive histogram equalization (CLAHE) changes the image contrast by calculating the local histogram of the image and reallocating the brightness, increases the contrast limiting for each small region, and overcomes the problem of excessive noise amplification in adaptive histogram equalization. However, the spatial image enhancement method can only enhance the brightness and contrast of the image, and there are still many problems, such as nonuniform noise distributed in the medical image, and some image details will disappear after transformation, which is un-natural overenhancement in areas with high brightness, such as bones.
Due to the problem of medical image particle noise and edge burrs, frequency image enhancement can be a good solution. The frequency domain enhancement method is a general term for image enhancement methods in the frequency domain through different filters. Among them, the wavelet transform [63,64] and curvelet transform [65] are the most common. Wavelet transform is a new transform analysis method based on short-time Fourier transform. It changes the infinite trigonometric function basis into a finite decaying wavelet basis, which makes the time–frequency analysis and signal processing more efficient. The curvelet transform is an improvement based on the Fourier transform and wavelet transform. Compared with the traditional wavelet transform, the azimuth factor is added to obtain a high degree of anisotropy. For shape restoration along the edge and peripheral noise suppression of the main structure, the wavelet transform has unique advantages and can better express the image edge.
The above methods can improve the image quality in the single aspect of enhancing contrast or reducing noise. Therefore, many researchers consider merging the two methods. They divide the image into two parts: low frequency and high frequency. The high-frequency image represents the texture part of the image, that is, the edge (contour) or noise and detail part of the image, and the low-frequency image represents the main part of the image, in which the gray scale is relatively flat. The method of image decomposition processes the high-frequency and low-frequency images separately to achieve the balance of improving contrast and reducing noise and achieve a better effect overall.

3.1.2. Multimodal Medical Image Fusion

A single medical device can only obtain a single modal image, which leads to limited information. Doctors usually need a large number of multimodal images to obtain comprehensive information for diagnosing diseases. The fusion algorithm can well integrate a wide range of information in multimodal images, including image pixel-based methods, image feature-based methods, and weighted average method: the weighted average of the corresponding pixel gray values between each source image. The multiresolution pyramid method is used to filter the source image many times to form a tower structure. At each layer of the tower, an algorithm is used to fuse the data of this layer to obtain a composite tower structure, and then the composite tower structure is reconstructed.

3.2. Intelligent Image Recognition

3.2.1. Image Processing Methods According to the Image Characteristics of Each Medical Part of the Body

In Section 2, we summarize the current problems in medical imaging. In this section, we summarize the current problems in medical imaging and the characteristics of the brain, breast, liver, and lung that affect imaging and review the image processing methods proposed for the characteristics of these parts, as well as the effects achieved.
Faced with the problems of unclear edges, slender structure, structural changes along pathways, and low contrast with neighboring anatomical structures in the general details of brain tumors, Mansoor et al. [62] proposed a learning method based on local shape and sparse appearance by taking advantage of the stable characteristics of the general structure of the brain. Solving the problem of unclear edges through a fast and robust shape localization method using conditional space deep learning used an optimized zonal statistical shape and appearance model based on regional shape changes to more flexibly adapt to long and thin brain structures. MRI sequences from 165 child subjects were evaluated, and the DICE similarity coefficient was 0.779. Pareek et al. [27] used Sklearn’s multilayer perceptron algorithm in the CNN model to learn both nonlinear and linear models and evaluated the CNN model by using the confusion matrix, achieving 86.63% accuracy in Kaggle’s dataset. Saba et al. [22] applied VGG-19 in the series with hand-marked features, and the DSC test results on BRATS 2015, BRATS 2016, and BRATS 2017 were 0.99, 1.00, and 0.99, respectively.
Faced with the problem that liver tumors have overlapping regions and unclear edge imaging, the boundary of tumor regions is uncertain during segmentation. Baâzaoui et al. [66] proposed an entropy-based fuzzy region growth method to address the segmentation of multiple tumors in the same CT image between overlapping tumors in liver CT images. The mean values of AOE, RAD, and DSM obtained on the ImageCLEF dataset were 19.9, 15.45, and 0.88, respectively. Wang [53] proposed a CT liver image segmentation algorithm based on fuzzy C-means (FCM) and random walk to delineate CT liver tumor boundaries. In MIDAS database image segmentation, an average DSC of 0.81, OE of 15.61%, and RD of 4.02% can be obtained based on this research algorithm.
Faced with the problem of breast tumor structure distortion and difficulty in recognition and feature extraction, Srivastava et al. [36] proposed an enhanced workflow based on the CNN model, a CNN modelling method based on explainable context, which intelligently selected disease-related input images for training and modelling. The final results were generated using CNN tag predictions and an observable qualitative tag signature for each new image, with an accuracy of 82% using the auxiliary dataset provided by the Tumor Proliferation Assessment Challenge 2016 (TUPAC 2016). Liu et al. [11] adopted the Inception-ResNet-V2 deep convolutional neural network model to realize the eight classifications of pathological images of breast cancer and adopted the BreaKHis dataset to achieve a tumor recognition rate of 82.6%.
Faced with the uncertainty of possible sites of lung cancer, including the chest wall, airway, pulmonary fissure, or blood vessels, clinical diagnosis is therefore a complex task. Taking advantage of the fact that the strength surface of malignant nodules is coarser than that of benign nodules, Lin et al. [67] proposed a set of fractal features based on the fractional Browne motion model to automatically distinguish malignant nodules from benign nodules. In a group of 107 CT images from 107 different patients, the results were tested with an accuracy rate of 88.82%. Bi et al. [68] used YOLO v3 and Google Inception v3 network training to form end-to-end detection. H–E staining pathological sections of lung lesions of 952 patients were used to assist doctors in identifying 100% vs. 95.52% independently.

3.2.2. Intelligent Algorithm for Medical Image Recognition after Image Enhancement

In Section 3.2.1, for the defects of medical images in different parts, we introduce the network model designed. In this section, we present the transfer learning method of medical images introduced due to the lack of a tumor dataset and the attention mechanism of medical images introduced due to the excessive noise of medical images and the inconspicuous details of some medical images. When the image is not multimodal fusion when the spatial information loss is due to the introduction of cascading strategies, the introduction of these strategies is analyzed, including the basic network model and dataset, to achieve a good effect.
Transfer learning: Faced with the problem of a small tumor dataset in the same site, people began to use transfer learning for tumor identification. Since tumors with internal structures in the human body are the result of abnormal cells, the abnormal images with mutations are similar. Therefore, people can learn more features by using transfer learning [69], use high-quality tumor data with similar features to pretrain the model, and then fine-tune the parameters of the convolution layer to migrate the model to the tumor site where data are scarce to improve the generalization performance of the model. Wang [64] took ResNet50 as the basic network framework, used transfer learning to realize the model function, and tested it on the BreaKHis dataset, and the accuracy rate converged to 98%. Han et al. [31] adopted the transfer learning ResNet50 network, formed two symmetric source domain and target domain conversion subnetworks by sharing encoders and two dedicated decoders, and proposed the deeply symmetric UDA architecture. The MMWHS2017 challenge heart dataset [45] was adopted, and the segmentation accuracy reached 78.50%. Khan et al. [37] adopted the transfer learning method; used GoogLeNet, ResNet, and VGGNet to extract image features; input them into the fully connected layer; and used mean pool classification to classify benign and malignant cells. The standard benchmark dataset [52] was used to construct the dataset with the image of the LRH Hospital in Peshawar, Pakistan, and the accuracy rate reached 97.525%. Zhou et al. [46] adopted the transfer learning method; used ResNet, AlexNet, and GoogLeNet models to extract image features; used the softmax function to classify the full connectivity layer; and classified the lung CT images of 2933 patients with COVID-19. The classification accuracy rate reached 99.054%. Polat and Güngen [70] adopted the transfer learning method and optimized the methods of ADADADDelta, ADAM, RMSprop, and SGD by using the VGG16, VGG19, ResNet50, and DenseNet21 networks. When tested on the dataset of Cheng et al.’s [71] published Figshare [46], the accuracy rate of the optimization method with the ResNet network and Adadelta reached 99.02%, and the accuracy rate with the DenseNet121 network was 98.91%.
Scale attention (SA): Since medical images are multimodal and have many problems, such as noise, poor contrast, and obscure details, the attention module can capture low-level features and high-level semantic features of all scales so that the weight of each feature channel can be adjusted adaptively, and unimportant scale information can be suppressed, which can not only eliminate irrelevant and noisy features but also reduce unnecessary parameters. At the same time, it can highlight the local features and improve the accuracy of the model. Importantly, the scale attention mechanism also aids in model interpretability. By highlighting the most significant features contributing to a prediction, it provides insights into the model’s decision-making process, which in turn fosters a better understanding and trust among clinicians. Noori et al. [23] embedded the attention module SE (Squeeze-and-Excitation) into U-Net for the MRI glioma segmentation task. Multiview fusion technology is proposed to obtain the 3D image context information on a 2D model. On the BRATS 2018 dataset, the average Dice scores of ET, WT, and TC were 0.813, 0.895, and 0.823, respectively. Fu et al. [42] used a multimode spatial attention module to guide tumor localization and a U-Net network for segmentation and used Siemens Healthineers Hospital NSCL disease images and the STS dataset [21] for lung tumor segmentation, with an accuracy of 71.44%. Zhang et al. [72] embedded the multiscale channel attention module SA (scale attention) into the U-Net network so that the weight of each channel could be adjusted adaptively. Meanwhile, residual blocks were used to reduce the number of references, and the HECKTOR2020 challenge dataset was used to segment head and neck tumors. The segmentation accuracy reached 75.20%.
Cascade policies: When multimodal CT and PET images are not fused, many useful features will be lost in the recognition of 2D images alone. Therefore, the cascade network, including the input-level fusion strategy, hierarchical fusion strategy, and decision-level fusion strategy, can make full use of different features in the network. In Zhao et al. [45], two CNN networks were used to extract features of PET and CT images, sequential convolution blocks were used for feature fusion, and the softmax function was used to obtain a tumor mask at the end of the network as output. Fifty-four PET/CT patients in Knoxville, USA, were used for lung tumor segmentation, and the segmentation accuracy reached 89.10%. Gao et al. [32] fused a 2D CNN with a 3D CNN, coordinated the softmax scores of the two CNN networks, and integrated and built a new CNN network. The head CT images of China Naval General Hospital were used to build datasets and classify AD, lesions (tumors), and normal ageing of Alzheimer’s disease. The classification accuracy reached 87.6%.

4. Neural Network Design for Medical Imaging

In the previous sections, for different medical image problems, we introduced image recognition methods and summarized and compared them in Table 3. This section presents the importance of underlying features in medical image recognition, multiangle features of the medical image itself, and the ability of the model to extract multilevel features of medical images and discuss what kind of deep learning model has a better effect on image recognition and why.

4.1. Reuse of Low-Level Features in Medical Images

Since medical images are multimodal and semantic information of context is also very important for medical image segmentation, we need to design a better network to extract the features of different modes. In this section, this paper introduces two popular ways of U-shaped structure and a close connection of underlying information reuse, how they are reused, and the kind of effects that are achieved by using U-shaped structure and dense connection cases.

4.1.1. U-Shaped Structure Reuse Low-Dimensional Edge Features

The internal structure of the human body is relatively fixed, the distribution of segmentation objects in the human body image is very regular, the semantics are simple and clear, and low-resolution information can provide this information for target object recognition [76]. Therefore, CNN can still be used for feature extraction of such tasks. However, due to the fuzzy boundary and complex gradient of medical images, more high-resolution information is required for accurate segmentation, which is obviously inconsistent with the feature extraction part. The feature extraction loses the original low-dimensional high-resolution features in exchange for multidimensional low-resolution features. Faced with the problem of sampling, Figure 6 shows the U-shaped network structure; this architecture, noted for its “U” shape, is designed with a unique two-part structure composed of a contracting path (encoder) and an expansive path (decoder). A standard U-Net has 23 convolutional layers, divided between these paths. The encoder is a series of convolutional layers and max pooling layers, which help the network to learn the contextual/spatial information about the input images. The decoder is also composed of a series of convolutional layers but with upsampling layers (or transposed convolutions), which help the network to precisely locate and delineate the features learned by the encoder. U-Net [77] proposed extracting high-dimensional features by downsampling first and supplementing some image information by upsampling, but the information supplement must be incomplete, so it needs to be connected with the image with higher resolution on the left. This is equivalent to making a direct connection between high-resolution and more abstract features because the extracted features are more effective and abstract as the number of convolutions increases. The upsampled image is formed after multiple deconvolutions, which is different from the original image. At this time, the upsampled image can be directly connected with the original image of the same dimension and high resolution to obtain more valuable information. The U-Net network can be divided into three parts. The first part of the U-Net network is the backbone feature extraction part. The backbone feature extraction part consists of a convolution+ maximum pooling layer. The convolution layer is used to initially extract the effective features, and then the maximum pooling layer is used to conduct downsampling to obtain the effective feature layer. The second part of the U-Net network strengthens the feature extraction part. In this paper, the preliminary effective feature layer obtained from the backbone feature extraction part is used for upsampling; the resolution of the feature map is restored to the resolution of the original image by deconvolution, and then it is fused with the effective feature layer obtained from the backbone part so that a final effective feature layer with all features can be obtained. The third part of the U-Net network is the prediction part, which uses the final effective feature layer to classify each feature point, equivalent to the classification of each pixel point.

4.1.2. Dense Connection Reuse of Medical Image Low-Level Features

Due to the characteristics of large differences in the shape of medical image objects and weak organizational boundary information, high-level features cannot reflect accurate edge information. Huang et al. [78] found that since the two adjacent layers of ResNet can be directly connected, they can be directly connected to any two layers. The architecture comprises multiple dense blocks with transition layers between them. Each dense block consists of multiple convolutional layers, where each layer receives feature maps from all preceding layers and passes on its own feature maps to all subsequent layers. Specifically, each layer implements the operations: BatchNorm -> ReLU -> Convolution. A transition layer is used between two consecutive dense blocks, which consists of BatchNorm, ReLU, Convolution, and then a 2 × 2 average pooling. As shown in Figure 7, the dense block makes the gradient propagation more direct, and even the gradient of the last layer can be directly transmitted to the first layer. The low-level features of medical images are very important features [79]. Compared with the residual network, which can only use high-level features, the dense block can reuse the low-level features to better retain the original features of the input image and extract feature information to the maximum through specific network design due to the direct connection of any two layers. At the same time, in terms of computing power, the dense block adds up the low-level features and high-level features so that the number of channels is greater, the parameters are more effective, and each layer can use fewer parameters.

4.2. Utilization of Multilevel Information of Medical Images

Compared with ordinary images, medical images include 3D images and multimodal images. Three-dimensional images provide spatial information and contextual semantic information for medical image segmentation. Multimodal images help to extract features from different views and provide complementary information, which is conducive to better data representation and network discrimination. The application of multimodal images can reduce the uncertainty of information and improve the accuracy of clinical diagnosis and segmentation [80]. In this section, we introduce the use of 3D convolution to extract multimodal features of images and the use of medical image multimodal feature fusion.

4.2.1. 3D Convolution

Medical 3D images are defined on 3D grids, which can have different sizes according to the body parts and resolution of the imaging. The grid size is w × h × d, representing the width, height, and depth of the 3D image. Each 3D point on the mesh is called a voxel [81]. Common medical images have 3D information, but when using a single image for medical tasks, it will lose its multidimensional information [82]. As shown in Figure 8, when another convolution kernel adds a dimension (for example, a simple window), the model can also obtain its spatial scene information so that there are scanning results on the x, y, and z axes. Dou et al. [40] used a 3D CNN to directly guide the objective function of training in the lower and upper layers of the network to achieve end-to-end training while fully connecting conditional random fields. Under the training of the 3D depth supervision mechanism, they used the SLiver07 dataset to achieve VOE5.42. Li et al. [39] proposed H-DenseUNet, which is a collection of 2D DenseNet and 3D DenseNet. Two-dimensional DenseNet is used to effectively extract features within slices to reduce computing costs. Three-dimensional DenseNet context aggregation is used to make full use of spatial information. Under the 3DIRCADb dataset, the accuracy rate reaches 93.7%. Henschel et al. [26] introduced an independent neural network (VINN) by modifying the first layer of the U-Net network structure encoder and the last layer of the decoder. In addition, FastSurf VIN is proposed to solve the problem of resolution independence. It supports 0.7–1.0 mm whole brain segmentation. Under the ABIDE I dataset and compared with the original FastSurf CNN network [20], using FastSurf VIN can achieve an average improvement of 1.46% DSC and 10.06% ASD. Lei et al. [74] proposed a lightweight V-Net (LV Net) for liver segmentation. Its structure is similar to that of 3D U-Net. When tested on the LiTS dataset, the dice value reached 95.43%.

4.2.2. Multimodal Feature Fusion

In medical imaging, different MRI modes are usually used to add more hierarchical features. Taking brain segmentation research as an example, as shown in Figure 9, T1-weighted images can produce good contrast between gray matter and white matter, while T2-weighted images can help to visualize abnormal tissue lesions. FLAIR sequences can more sensitively detect lesions near the brain tissue CSF junction. Therefore, it is very important to consider multidimensional image information to obtain accurate diagnosis results. Xiao et al. [75] took U-Net as the main framework, extracted multiscale features of different modes, fused multimodal features at the decision-making level, and used MRI images of the liver from the McGill University Health Center to build a dataset, with a segmentation accuracy of 81.98%. Zhao et al. [45] proposed a multimodal segmentation network based on a 3D FCN. The network uses two independent V-Net architectures to extract high-dimensional features from PET and CT images with a segmentation accuracy of 89.10%.

4.3. The Dimension of Medical Image Feature Extraction

Inspired by human neuroscience [83], in the CNN hierarchical representation image, the bottom feature is a local operator related to direction, the middle feature is a local feature with semantics, and the high-level feature is a semantic feature. Convolutional neural networks extract important features by filtering input functions and cross-correlation functions, such as Formula (2).
S w ,   h ,   d = I K ( w , h , d ) = k = 1 c i = 1 k j = 1 k I ( w + i , h + j , k ) K ( i , j , k )
In Equation (2), w stands for medical image width, h stands for medical image height, d stands for medical image dimension, I stands for original image, and K stands for convolution kernel. stands for cross-correlation function.
Medical image features are hierarchical. The more layers there are, the more channels in each layer there are, and the richer are the extracted features. To improve the segmentation accuracy, the depth learning model must fully extract the rich features contained in each mode of multimodal medical images as much as possible. At the same time, it is also necessary to consider reducing parameters in practical operation to improve the training and reasoning speed. The expression ability of a neural network is similar to an exponential function. The width of the network determines the base number of the function, and the depth of the network determines the exponent of the function. Compared with the ReLU operation proposed by the traditional LeNet [84], AlexNet [85] can better back propagate and increase the learnability of the overall network compared with the previous tanh operation. At the same time, the AlexNet network uses Dropout0.5 [86], L2 weight decal [87,88,89], and data enhancement operations to considerably reduce the parameters of the MLP layer, thereby reducing overfitting. Simonyan proposed the VGG network [90]. He proposed replacing the large convolution kernel with a smaller convolution kernel to obtain a deeper number of layers. As shown in Figure 10, he found that the receptive field of two 3 × 3 convolution cores is the same as that of one 5 × 5 convolution core. This increased the number of layers of the network, and activation functions can be added between layers, increasing the nonlinear expression ability of the network. At the same time, he used fewer parameters, but because the computing power at that time was not enough to train such a deep network, VGG introduced pretraining. The basic module of GoogLeNet, Inception, is the first to incorporate the idea of feature augmentation [91] into the design of network structures. Each convolution core of different sizes extracts different features and connects different features after they become the same dimension through padding. The Inception structure uses a 1 × 1 convolution to raise and lower dimensions and clusters the sparse matrix into a relatively dense submatrix to improve computing performance. At the same time, multiple dimensions can be used for convolution and reaggregation at the same time. By designing a sparse network structure, dense data can be generated at the same time, and more multilevel features of medical images can be extracted under the same amount of computation to improve the model effect and make more efficient use of computing resources. According to the different degree of medical image extraction by the network, this paper draws the network structure in Figure 11.

5. Discussion

In this paper, we have reviewed various image recognition methods for medical image problems and their underlying features. We now address the key challenges hindering the widespread adoption of AI in medical imaging and propose potential directions for future development to enhance patient care.

5.1. Challenge

The primary challenges faced in the application of AI in medical imaging include data quality and availability, model interpretability, generalizability and robustness, and computational resource requirements. These challenges create obstacles for the successful integration of AI-based medical image recognition methods in clinical practice.
  • Data quality and availability: The limited availability of high-quality, labeled medical image datasets due to privacy concerns, data acquisition costs, and the need for expert annotations, as well as inconsistencies in medical images, pose significant challenges for training deep learning models.
  • Model interpretability: The “black box” nature of AI-based medical image recognition models makes their inner workings difficult to understand, hindering their adoption in clinical practice as doctors may be reluctant to trust AI-generated diagnoses without clear explanations.
  • Generalizability and robustness: Deep learning models’ sensitivity to variations in input data and their potential struggle to generalize to unseen data or new imaging modalities make it critical to ensure their robustness and generalizability in clinical settings.
  • Computational resource requirements: The resource-intensive nature of training and deploying deep learning models, requiring powerful GPUs and high memory capacity, can be a barrier to the widespread adoption of AI in medical imaging, particularly in resource-limited settings.

5.2. Future Directions

To overcome these challenges, we propose the following future directions:
  • Improve data accessibility: Promote the sharing of medical image datasets, develop open-source data repositories, and leverage synthetic or augmented data and transfer learning techniques to overcome data-related challenges.
  • Given the heterogeneity of medical imaging data across different institutions and modalities, data harmonization techniques need to be developed. These will help to standardize datasets, reducing technical variations and making aggregated data more reliable and useful. Implement machine learning algorithms, such as ComBat or DeepHarmony, to minimize batch effects and other sources of nonbiological variation in datasets acquired from different sources. Harmonization can help to standardize datasets, making aggregated data more reliable and useful.
  • Enhance model interpretability: Explore the use of explainable AI techniques, such as layer-wise relevance propagation (LRP), SHAP (SHapley Additive exPlanations), or attention mechanisms, which can make the model’s decision-making process more transparent. Additionally, techniques such as feature visualization and saliency maps can be utilized to identify key input features responsible for predictions, thereby building trust with clinicians.
  • Foster generalizability and robustness: Employ data augmentation, domain adaptation, adversarial training, and novel model architectures to enhance the generalizability and robustness of AI-based medical image recognition methods.
  • Optimize computational efficiency: Explore lightweight models, pruning techniques, and distributed training approaches to reduce the computational resource requirements of AI-based medical image recognition methods.
  • Active learning techniques: Utilize active learning strategies to identify the most informative samples for manual annotation, addressing the limitations of annotated data.
  • Clinical integration and interpretability: Work closely with clinical teams to understand their workflows and needs. Focus on developing models that not only have high predictive performance but also provide interpretable outputs. For instance, developing a model that can output a heatmap showing areas of concern in an image, alongside its predictions, could make it more useful to clinicians.
By focusing on these future directions, we can pave the way for the successful integration of AI in medical imaging, ultimately improving the speed and accuracy of diagnoses and enhancing patient care.

6. Conclusions

Computer technology has had a substantial impact on medical image recognition in both clinical applications and scientific research. CNN methods have achieved state-of-the-art performance across different medical applications; however, there is still room for improvement: (1) From other models: graph neural network for medical image, inference of cause and effect for medical image, and yolo or RNN for medical images; (2) datasets problem: federated learning is a direction to solve lacking dataset. Federated learning is an emerging basic artificial intelligence technology that can ensure the privacy of patients’ personal data during the exchange of medical image datasets and carry out efficient deep learning among multiple participants or multiple computing nodes without violating the hospital confidentiality principle. (3) Low computing power of small and medium-sized hospitals: distributed learning computing at the edge is a direction to solve low computing power. In Part 4, it can be seen from the AlexNet network structure that dividing the network along the number of channels is a feasible and effective distributed design, and researchers can design the network according to this idea. (4) Network structure design and parameter tuning: after the wave of classical networks, there are still new structures suitable for medical image networks, which shows that the transformation of network structure has not reached the extreme. Researchers can adjust the network according to the basic network modules and network design techniques proposed in Section 4.

Author Contributions

Conceptualization, H.C. and L.H.; methodology, L.H.; software, L.C.; formal analysis, H.C.; investigation, H.C.; resources, L.C.; data curation, H.C.; writing—original draft preparation, H.C.; writing—review and editing, L.C.; visualization, H.C.; supervision, L.H.; project administration, L.H.; funding acquisition, L.H. All authors have read and agreed to the published version of the manuscript.

Funding

This research was funded by the Project of Jilin Province Development and Reform Commission, grant number 2019FGWTZC001; Key Technology Innovation Cooperation Project of Government and University, grant number SXGJSF2017-4.

Data Availability Statement

Not applicable.

Acknowledgments

Thanks to Guo Xiaoxin of Jilin University for his help, he gave us inspiration and encouragement in difficult times. Thanks to the help of Yang Bo from Jilin University, whose course called “Knowledge Engineering” provided us with some inspiration.

Conflicts of Interest

The authors declare no conflict of interest.

References

  1. Yu, K.H.; Beam, A.L.; Kohane, I.S. Artificial intelligence in healthcare. Nat. Biomed. Eng. 2018, 2, 719–731. [Google Scholar] [CrossRef] [PubMed]
  2. LeCun, Y.; Bengio, Y.; Hinton, G. Deep learning. Nature 2015, 521, 436–444. [Google Scholar] [CrossRef] [PubMed]
  3. Litjens, G.; Kooi, T.; Bejnordi, B.E.; Setio, A.A.A.; Ciompi, F.; Ghafoorian, M.; van der Laak, J.A.W.M.; van Ginneken, B.; Sánchez, C.I. A survey on deep learning in medical image analysis. Med. Image Anal. 2017, 42, 60–88. [Google Scholar] [CrossRef] [PubMed] [Green Version]
  4. Topol, E.J. High-performance medicine: The convergence of human and artificial intelligence. Nat. Med. 2019, 25, 44–56. [Google Scholar] [CrossRef]
  5. Harmon, S.A.; Sanford, T.H.; Xu, S.; Turkbey, E.B.; Roth, H.; Xu, Z.; Yang, D.; Myronenko, A.; Anderson, V.; Amalou, A.; et al. Artificial intelligence for the detection of COVID-19 pneumonia on chest CT using multinational datasets. Nat. Commun. 2020, 11, 4080. [Google Scholar] [CrossRef]
  6. Fang, Y.; Zhang, H.; Xie, J.; Lin, M.; Ying, L.; Pang, P.; Ji, W. Sensitivity of Chest CT for COVID-19: Comparison to RT-PCR. Radiology 2020, 296, E115–E117. [Google Scholar] [CrossRef]
  7. Yazdani, A.; Fekri-Ershad, S.; Jelvay, S. Diagnosis of COVID-19 Disease in Chest CT-Scan Images Based on Combination of Low-Level Texture Analysis and MobileNetV2 Features. Comput. Intell. Neurosci. 2022, 2022, 1658615. [Google Scholar] [CrossRef]
  8. Fekri-Ershad, S.; Alsaffar, M.F. Developing a Tuned Three-Layer Perceptron Fed with Trained Deep Convolutional Neural Networks for Cervical Cancer Diagnosis. Diagnostics 2023, 13, 686. [Google Scholar] [CrossRef]
  9. Fekri-Ershad, S.; Ramakrishnan, S. Cervical cancer diagnosis based on modified uniform local ternary patterns and feed forward multilayer network optimized by genetic algorithm. Comput. Biol. Med. 2022, 144, 105392. [Google Scholar] [CrossRef]
  10. AlEisa, H.N.; Touiti, W.; Ali ALHussan, A.; Ben Aoun, N.; Ejbali, R.; Zaied, M.; Saadia, A. Breast Cancer Classification Using FCN and Beta Wavelet Autoencoder. Comput. Intell. Neurosci. 2022, 2022, 8044887. [Google Scholar] [CrossRef]
  11. Rahman, H.; Naik Bukht, T.F.; Ahmad, R.; Almadhor, A.; Javed, A.R. Efficient Breast Cancer Diagnosis from Complex Mammographic Images Using Deep Convolutional Neural Network. Comput. Intell. Neurosci. 2023, 2023, 7717712. [Google Scholar] [CrossRef] [PubMed]
  12. Brody, H. Medical imaging. Nature 2013, 502, S81. [Google Scholar] [CrossRef] [PubMed] [Green Version]
  13. Owens, B. Scans: Enhanced medical vision. Nature 2013, 502, S82–S83. [Google Scholar] [CrossRef] [Green Version]
  14. Caro, M.C.; Huang, H.-Y.; Cerezo, M.; Sharma, K.; Sornborger, A.; Cincio, L.; Coles, P.J. Generalization in quantum machine learning from few training data. Nat. Commun. 2022, 13, 4919. [Google Scholar] [CrossRef] [PubMed]
  15. Li, Y.; Su, Y.; Guo, M.; Han, X.; Liu, J.; Vishwasrao, H.D.; Li, X.; Christensen, R.; Sengupta, T.; Moyle, M.W.; et al. Incorporating the image formation process into deep learning improves network performance. Nat. Methods 2022, 19, 1427–1437. [Google Scholar] [CrossRef] [PubMed]
  16. Available online: https://www.rms.org.uk/community/networks-affiliates/bioimaginguk-network.html (accessed on 1 June 2023).
  17. Grand Challenge. Available online: https://www.grand-challenge.org/ (accessed on 1 June 2023).
  18. Boss, A.; Stegger, L.; Bisdas, S.; Kolb, A.; Schwenzer, N.; Pfister, M.; Claussen, C.D.; Pichler, B.J.; Pfannenberg, C. Feasibility of simultaneous PET/MR imaging in the head and upper neck area. Eur. Radiol. 2011, 21, 1439–1446. [Google Scholar] [CrossRef] [Green Version]
  19. Kim, H.W.; Lee, H.E.; Oh, K.; Lee, S.; Yun, M.; Yoo, S.K. Multi-slice representational learning of convolutional neural network for Alzheimer’s disease classification using positron emission tomography. Biomed. Eng. Online 2020, 19, 1–15. [Google Scholar] [CrossRef] [PubMed]
  20. Kim, H.W.; Lee, H.E.; Lee, S.; Oh, K.T.; Yun, M.; Yoo, S.K. Slice-selective learning for Alzheimer’s disease classification using a generative adversarial network: A feasibility study of external validation. Eur. J. Nucl. Med. 2020, 47, 2197–2206. [Google Scholar] [CrossRef]
  21. Alzheimer’s Disease Neuroimaging Initiative (ADNI). Available online: http://adni.loni.usc.edu/ (accessed on 1 June 2023).
  22. Saba, T.; Mohamed, A.S.; El-Affendi, M.; Amin, J.; Sharif, M. Brain tumor detection using fusion of hand crafted and deep learning features. Cogn. Syst. Res. 2020, 59, 221–230. [Google Scholar] [CrossRef]
  23. Noori, M.; Bahri, A.; Mohammadi, K. Attention-guided version of 2D UNet for automatic brain tumor segmentation. In Proceedings of the 9th International Conference on Computer and Knowledge Engineering (ICCKE), Mashhad, Iran, 24–25 October 2019; pp. 269–275. [Google Scholar]
  24. Menze, B.H.; Jakab, A.; Bauer, S.; Kalpathy-Cramer, J.; Farahani, K.; Kirby, J.; Burren, Y.; Porz, N.; Slotboom, J.; Wiest, R.; et al. The Multimodal Brain Tumor Image Segmentation Benchmark (BRATS). IEEE Trans. Med. Imaging 2014, 34, 1993–2024. [Google Scholar] [CrossRef]
  25. Bakas, S.; Akbari, H.; Sotiras, A.; Bilello, M.; Rozycki, M.; Kirby, J.S.; Freymann, J.B.; Farahani, K.; Davatzikos, C. Advancing the Cancer Genome Atlas glioma MRI collections with expert segmentation labels and radiomic features. Sci. Data 2017, 4, 170117. [Google Scholar] [CrossRef] [PubMed] [Green Version]
  26. Henschel, L.; Kügler, D.; Reuter, M. FastSurferVINN: Building resolution-independence into deep learning segmentation methods—A solution for HighRes brain MRI. Neuroimage 2022, 251, 118933. [Google Scholar] [CrossRef] [PubMed]
  27. Pareek, K.; Tiwari, P.K.; Bhatnagar, V. State of the art and prediction model for brain tumor detection. In Smart Systems: Innovations in Computing; Somani, A.K., Mundra, A., Doss, R., Bhattacharya, S., Eds.; Springer: Singapore, 2022; pp. 557–563. [Google Scholar]
  28. University of South Florida Digital Mammography Home Page. Available online: http://www.eng.usf.edu/cvprg/Mammography/Database.html (accessed on 1 June 2023).
  29. The Cancer Genome Atlas (TCGA) Research Network. Comprehensive molecular portraits of human breast tumours. Nature 2012, 490, 61–70. [Google Scholar] [CrossRef] [PubMed] [Green Version]
  30. Spanhol, F.A.; Oliveira, L.S.; Petitjean, C.; Heutte, L. A Dataset for Breast Cancer Histopathological Image Classification. IEEE Trans. Biomed. Eng. 2015, 63, 1455–1462. [Google Scholar] [CrossRef] [PubMed]
  31. Han, X.; Qi, L.; Yu, Q.; Zhou, Z.; Zheng, Y.; Shi, Y.; Gao, Y. Deep Symmetric Adaptation Network for Cross-Modality Medical Image Segmentation. IEEE Trans. Med. Imaging 2021, 41, 121–132. [Google Scholar] [CrossRef]
  32. Gao, X.W.; Hui, R.; Tian, Z. Classification of CT brain images based on deep learning networks. Comput. Methods Programs Biomed. 2017, 138, 49–56. [Google Scholar] [CrossRef] [Green Version]
  33. Wan, Z.; Dong, Y.; Yu, Z.; Lv, H.; Lv, Z. Semi-Supervised Support Vector Machine for Digital Twins Based Brain Image Fusion. Front. Neurosci. 2021, 15, 705323. [Google Scholar] [CrossRef]
  34. Yuan, Y. Automatic head and neck tumor segmentation in PET/CT with scale attention network. In Head and Neck Tumor Segmentation; Andrearczyk, V., Oreiller, V., Depeursinge, A., Eds.; Springer International Publishing: Cham, Switzerland, 2021; pp. 44–52. [Google Scholar]
  35. Andrearczyk, V.; Oreiller, V.; Boughdad, S.; Le Rest, C.C.; Elhalawani, H.; Jreige, M.; Prior, J.O.; Vallières, M.; Visvikis, D.; Hatt, M.; et al. Overview of the HECKTOR Challenge at MICCAI 2021: Automatic Head and Neck Tumor Segmentation and Outcome Prediction in PET/CT Images. In Head and Neck Tumor Segmentation and Outcome Prediction: Second Challenge, HECKTOR 2021, Strasbourg, France, 27 September 2021; Springer: Cham, Switzerland, 2021; pp. 1–37. [Google Scholar] [CrossRef]
  36. Srivastava, A.; Kulkarni, C.; Huang, K.; Parwani, A.; Mallick, P.; Machiraju, R. Imitating Pathologist Based Assessment with Interpretable and Context Based Neural Network Modeling of Histology Images. Biomed. Inform. Insights 2018, 10, 1–7. [Google Scholar] [CrossRef] [Green Version]
  37. Khan, S.; Islam, N.; Jan, Z.; Din, I.U.; Rodrigues, J.J.P.C. A novel deep learning based framework for the detection and classification of breast cancer using transfer learning. Pattern Recognit. Lett. 2019, 125, 1–6. [Google Scholar] [CrossRef]
  38. Seo, H.; Huang, C.; Bassenne, M.; Xiao, R.; Xing, L. Modified U-Net (mU-Net) with Incorporation of Object-Dependent High Level Features for Improved Liver and Liver-Tumor Segmentation in CT Images. IEEE Trans. Med. Imaging 2019, 39, 1316–1325. [Google Scholar] [CrossRef] [Green Version]
  39. Li, X.; Chen, H.; Qi, X.; Dou, Q.; Fu, C.-W.; Heng, P.-A. H-DenseUNet: Hybrid Densely Connected UNet for Liver and Tumor Segmentation from CT Volumes. IEEE Trans. Med. Imaging 2018, 37, 2663–2674. [Google Scholar] [CrossRef] [PubMed] [Green Version]
  40. Dou, Q.; Yu, L.; Chen, H.; Jin, Y.; Yang, X.; Qin, J.; Heng, P.-A. 3D deeply supervised network for automated segmentation of volumetric medical images. Med. Image Anal. 2017, 41, 40–54. [Google Scholar] [CrossRef] [PubMed]
  41. Soler, L.; Hostettler, A.; Agnus, V.; Charnoz, A.; Fasquel, J.B.; Moreau, J.; Osswald, A.B.; Bouhadjar, M.; Marescaux, J. 3D Image Reconstruction for Comparison of Algorithm Database: A Patient Specific Anatomical and Medical Image Database; Tech. Rep 1.1; IRCAD: Strasbourg, France, 2010. [Google Scholar]
  42. Fu, X.; Bi, L.; Kumar, A.; Fulham, M.; Kim, J. Multimodal Spatial Attention Module for Targeting Multimodal PET-CT Lung Tumor Segmentation. IEEE J. Biomed. Health Inform. 2021, 25, 3507–3516. [Google Scholar] [CrossRef]
  43. Available online: https://luna16.grand-challenge.org/ (accessed on 1 June 2023).
  44. Vallières, M.; Freeman, C.R.; Skamene, S.R.; El Naqa, I. A radiomics model from joint FDG-PET and MRI texture features for the prediction of lung metastases in soft-tissue sarcomas of the extremities. Phys. Med. Biol. 2015, 60, 5471–5496. [Google Scholar] [CrossRef] [PubMed]
  45. Zhao, X.; Li, L.; Lu, W.; Tan, S. Tumor co-segmentation in PET/CT using multi-modality fully convolutional neural network. Phys. Med. Biol. 2018, 64, 015011. [Google Scholar] [CrossRef]
  46. Zhou, T.; Lu, H.; Yang, Z.; Qiu, S.; Huo, B.; Dong, Y. The ensemble deep learning model for novel COVID-19 on CT images. Appl. Soft Comput. 2021, 98, 106885. [Google Scholar] [CrossRef]
  47. Pehrson, L.M.; Nielsen, M.B.; Lauridsen, C.A. Automatic Pulmonary Nodule Detection Applying Deep Learning or Machine Learning Algorithms to the LIDC-IDRI Database: A Systematic Review. Diagnostics 2019, 9, 29. [Google Scholar] [CrossRef] [Green Version]
  48. Available online: https://wiki.cancerimagingarchive.net/display/Public/TCGA-LUAD (accessed on 1 June 2023).
  49. Hutter, C.; Zenklusen, J.C. The Cancer Genome Atlas: Creating Lasting Value beyond Its Data. Cell 2018, 173, 283–285. [Google Scholar] [CrossRef]
  50. Available online: https://www.cancerimagingarchive.net/ (accessed on 1 June 2023).
  51. Available online: https://cdas.cancer.gov/datasets/nlst/ (accessed on 1 June 2023).
  52. Available online: https://wiki.cancerimagingarchive.net/display/Public/SPIEAAPM+Lung+CT+Challenge#534f52ab0e4d4bd8b2e7ef16d2b2bd0d (accessed on 1 June 2023).
  53. Wald, L.L.; McDaniel, P.C.; Witzel, T.; Stockmann, J.P.; Cooley, C.Z. Low-cost and portable MRI. J. Magn. Reson. Imaging 2019, 52, 686–696. [Google Scholar] [CrossRef]
  54. Lustig, M.; Donoho, D.L.; Santos, J.M.; Pauly, J.M. Compressed Sensing MRI. IEEE Signal Process. Mag. 2008, 25, 72–82. [Google Scholar] [CrossRef]
  55. Lu, H.; Nagae-Poetscher, L.M.; Golay, X.; Lin, D.; Pomper, M.; van Zijl, P.C. Routine clinical brain MRI sequences for use at 3.0 Tesla. J. Magn. Reson. Imaging 2005, 22, 13–22. [Google Scholar] [CrossRef] [PubMed]
  56. De González, A.B.; Mahesh, M.; Kim, K.-P.; Bhargavan, M.; Lewis, R.; Mettler, F.; Land, C. Projected Cancer Risks From Computed Tomographic Scans Performed in the United States in 2007. Arch. Intern. Med. 2009, 169, 2071–2077. [Google Scholar] [CrossRef] [Green Version]
  57. Smith-Bindman, R.; Lipson, J.; Marcus, R.; Kim, K.F.; Mahesh, M.; Gould, R.; de González, A.B.; Miglioretti, D.L. Radiation Dose Associated with Common Computed Tomography Examinations and the Associated Lifetime Attributable Risk of Cancer. Arch. Intern. Med. 2009, 169, 2078–2086. [Google Scholar] [CrossRef] [PubMed]
  58. Miglioretti, D.L.; Johnson, E.; Williams, A.; Greenlee, R.T.; Weinmann, S.; Solberg, L.I.; Feigelson, H.S.; Roblin, D.; Flynn, M.J.; Vanneman, N.; et al. The Use of Computed Tomography in Pediatrics and the Associated Radiation Exposure and Estimated Cancer Risk. JAMA Pediatr. 2013, 167, 700–707. [Google Scholar] [CrossRef] [PubMed]
  59. Pearce, M.S.; Salotti, J.A.; Little, M.P.; McHugh, K.; Lee, C.; Kim, K.P.; Howe, N.L.; Ronckers, C.M.; Rajaraman, P.; Craft, A.W., Sr.; et al. Radiation exposure from CT scans in childhood and subsequent risk of leukaemia and brain tumours: A retrospective cohort study. Lancet 2012, 380, 499–505. [Google Scholar] [CrossRef] [PubMed] [Green Version]
  60. National Lung Screening Trial Research Team; Aberle, D.R.; Adams, A.M.; Berg, C.D.; Black, W.C.; Clapp, J.D.; Fagerstrom, R.M.; Gareen, I.F.; Gatsonis, C.; Marcus, P.M.; et al. Reduced Lung-Cancer Mortality with Low-Dose Computed Tomographic Screening. N. Engl. J. Med. 2011, 365, 395–409. [Google Scholar] [CrossRef] [Green Version]
  61. Liu, X.; Primak, A.N.; Krier, J.D.; Yu, L.; Lerman, L.O.; McCollough, C.H. Renal Perfusion and Hemodynamics: Accurate in Vivo Determination at CT with a 10-Fold Decrease in Radiation Dose and HYPR Noise Reduction. Radiology 2009, 253, 98–105. [Google Scholar] [CrossRef] [Green Version]
  62. Mansoor, A.; Cerrolaza, J.J.; Idrees, R.; Biggs, E.; Alsharid, M.A.; Avery, R.A.; Linguraru, M.G. Deep Learning Guided Partitioned Shape Model for Anterior Visual Pathway Segmentation. IEEE Trans. Med. Imaging 2016, 35, 1856–1865. [Google Scholar] [CrossRef]
  63. Garduño, E.; Herman, G.T.; Davidi, R. Reconstruction from a few projections by ℓ1-minimization of the Haar transform. Inverse Probl. 2011, 27, 055006. [Google Scholar] [CrossRef] [Green Version]
  64. Wang, X.B. Image enhancement based on lifting wavelet transform. In Proceedings of the 2009 4th International Conference on Computer Science & Education, Nanning, China, 25–28 July 2009; pp. 739–741. [Google Scholar]
  65. Starck, J.-L.; Candes, E.J.; Donoho, D.L. The curvelet transform for image denoising. IEEE Trans. Image Process. 2002, 11, 670–684. [Google Scholar] [CrossRef] [Green Version]
  66. Baâzaoui, A.; Barhoumi, W.; Ahmed, A.; Zagrouba, E. Semi-Automated Segmentation of Single and Multiple Tumors in Liver CT Images Using Entropy-Based Fuzzy Region Growing. IRBM 2017, 38, 98–108. [Google Scholar] [CrossRef]
  67. Lin, P.-L.; Huang, P.-W.; Lee, C.-H.; Wu, M.-T. Automatic classification for solitary pulmonary nodule in CT image by fractal analysis based on fractional Brownian motion model. Pattern Recognit. 2013, 46, 3279–3287. [Google Scholar] [CrossRef]
  68. Kanavati, F.; Toyokawa, G.; Momosaki, S.; Rambeau, M.; Kozuma, Y.; Shoji, F.; Yamazaki, K.; Takeo, S.; Iizuka, O.; Tsuneki, M.; et al. Weakly-supervised learning for lung carcinoma classification using deep learning. Sci. Rep. 2020, 10, 9297. [Google Scholar] [CrossRef]
  69. Rehman, A.; Naz, S.; Razzak, M.I.; Akram, F.; Imran, M. A Deep Learning-Based Framework for Automatic Brain Tumors Classification Using Transfer Learning. Circuits Syst. Signal Process. 2020, 39, 757–775. [Google Scholar] [CrossRef]
  70. Polat, Ö.; Güngen, C. Classification of brain tumors from MR images using deep transfer learning. J. Supercomput. 2021, 77, 7236–7252. [Google Scholar] [CrossRef]
  71. Cheng, J.; Huang, W.; Cao, S.; Yang, R.; Yang, W.; Yun, Z.; Wang, Z.; Feng, Q. Enhanced Performance of Brain Tumor Classification via Tumor Region Augmentation and Partition. PLoS ONE 2015, 10, e0140381. [Google Scholar] [CrossRef]
  72. Zhang, F.; Song, Y.; Cai, W.; Zhou, Y.; Shan, S.; Feng, D. Context curves for classification of lung nodule images. In Proceedings of the International Conference on Digital Image Computing: Techniques and Applications (DICTA), Hobart, TAS, Australia, 26–28 November 2013; pp. 1–7. [Google Scholar]
  73. Zhang, J.; Jiang, Z.; Dong, J.; Hou, Y.; Liu, B. Attention gate resU-Net for automatic MRI brain tumor segmentation. IEEE Access 2020, 8, 58533–58545. [Google Scholar] [CrossRef]
  74. Lei, T.; Zhou, W.; Zhang, Y.; Wang, R.; Meng, H.; Nandi, A.K. Lightweight V-Net for liver segmentation. In Proceedings of the IEEE International Conference on Acoustics, Speech and Signal Processing (ICASSP), Barcelona, Spain, 4–8 May 2020; pp. 1379–1383. [Google Scholar]
  75. Xiao, X.; Zhao, W.; Zhao, J.; Xiao, N.; Yang, X.; Yang, X. Segmentation and detection of liver tumors in contrast-free MRI images combined with multimodal features. J. Taiyuan Univ. Technol. 2021, 52, 411–416. [Google Scholar]
  76. Lu, L.; Dercle, L.; Zhao, B.; Schwartz, L.H. Deep learning for the prediction of early on-treatment response in metastatic colorectal cancer from serial medical imaging. Nat. Commun. 2021, 12, 6654. [Google Scholar] [CrossRef]
  77. Ronneberger, O.; Fischer, P.; Brox, T. U-Net: Convolutional networks for biomedical image segmentation. In MICCAI 2015: Medical Image Computing and Computer-Assisted Intervention–MICCAI 2015; Navab, N., Hornegger, J., Wells, W.M., Frangi, A.F., Eds.; Springer International Publishing: Cham, Switzerland, 2015; pp. 234–241. [Google Scholar]
  78. Huang, G.; Liu, Z.; Maaten, L.V.D.; Weinberger, K.Q. Densely connected convolutional networks. In Proceedings of the IEEE Conference on Computer Vision and Pattern Recognition (CVPR), Honolulu, HI, USA, 21–26 July 2017; pp. 2261–2269. [Google Scholar]
  79. Kim, D.W.; Jang, H.Y.; Kim, K.W.; Shin, Y.; Park, S.H. Design Characteristics of Studies Reporting the Performance of Artificial Intelligence Algorithms for Diagnostic Analysis of Medical Images: Results from Recently Published Papers. Korean J. Radiol. 2019, 20, 405–410. [Google Scholar] [CrossRef]
  80. Zhou, T.; Ruan, S.; Canu, S. A review: Deep learning for medical image segmentation using multi-modality fusion. Array 2019, 3–4, 100004. [Google Scholar] [CrossRef]
  81. Taha, A.A.; Hanbury, A. Metrics for evaluating 3D medical image segmentation: Analysis, selection, and tool. BMC Med. Imaging 2015, 15, 29. [Google Scholar] [CrossRef] [PubMed] [Green Version]
  82. Hara, K.; Kataoka, H.; Satoh, Y. Can spatiotemporal 3D CNNs retrace the history of 2D CNNs and ImageNet? In Proceedings of the 2018 IEEE/CVF Conference on Computer Vision and Pattern Recognition, Salt Lake City, UT, USA, 18–23 June 2018; pp. 6546–6555. [Google Scholar]
  83. Hubel, D.H.; Wiesel, T.N. Receptive fields of single neurones in the cat’s striate cortex. J. Physiol. 1959, 148, 574–591. [Google Scholar] [CrossRef]
  84. Lecun, Y.; Bottou, L.; Bengio, Y.; Haffner, P. Gradient-based learning applied to document recognition. Proc. IEEE 1998, 86, 2278–2324. [Google Scholar] [CrossRef] [Green Version]
  85. Krizhevsky, A.; Sutskever, I.; Hinton, G.E. Imagenet classification with deep convolutional neural networks. Commun. ACM 2017, 60, 84–90. [Google Scholar] [CrossRef] [Green Version]
  86. Srivastava, N.; Hinton, G.; Krizhevsky, A.; Sutskever, I.; Salakhutdinov, R. Dropout: A simple way to prevent neural networks from overfitting. J. Mach. Learn. Res. 2014, 15, 1929–1958. [Google Scholar]
  87. Loshchilov, I.; Hutter, F. Decoupled weight decay regularization. arXiv 2017, arXiv:1711.05101v3. [Google Scholar]
  88. Krogh, A.; Hertz, J. A simple weight decay can improve generalization. In Proceedings of the 4th International Conference on Neural Information Processing Systems, Denver, CO, USA, 2–5 December 1991; ACM: New York, NY, USA, 1991; pp. 950–957. [Google Scholar]
  89. Loshchilov, I.; Hutter, F. Fixing weight decay regularization in adam. arXiv 2018, arXiv:1711.05101v2. [Google Scholar]
  90. Simonyan, K.; Zisserman, A. Very deep convolutional networks for large-scale image recognition. arXiv 2014, arXiv:1409.1556. [Google Scholar]
  91. DeVries, T.; Taylor, G.W. Dataset augmentation in feature space. arXiv 2017, arXiv:1702.05538. [Google Scholar]
Figure 1. Article context: shows the logic of our lite review, including medical image data, methods of medical image enhancement, multimodal image fusion technology, medical image feature extraction, and medical image segmentation. The line between the tumor image and CT or MRI represents the type of dataset suitable for this tumor site.
Applsci 13 07079 g001
Figure 2. The top picture is taken from the T1W strong magnetic field, and the bottom picture is taken from the T1W weak magnetic field in the same position from left to right.
Applsci 13 07079 g002
Figure 3. The top image is taken from the T2W strong magnetic field, and the bottom image is taken from the T2W weak magnetic field in the same position from left to right.
Applsci 13 07079 g003
Figure 4. The top image is taken from FLAIR’s strong magnetic field, and the bottom image is taken from FLAIR’s weak magnetic field in the same position from left to right.
Applsci 13 07079 g004
Figure 5. The picture on the left is a CT at the regular-dose level, and the picture on the right is a CT at the 1/10-dose level.
Applsci 13 07079 g005
Figure 6. U-shape: It can be seen from the network structure that U-Net combines low-resolution information (providing the basis for object category recognition) and high-resolution information (providing the basis for accurate segmentation and positioning) and is perfectly suitable for medical image segmentation.
Applsci 13 07079 g006
Figure 7. DenseNet: The arrows in the figure represent the transmission of medical image feature information in DenseNet. The structured information at the lower level of the medical image can be transferred to the higher level through shortcuts.
Applsci 13 07079 g007
Figure 8. The three-dimensional convolution effect. The blue picture is the original multidimensional feature map, the purple is the three-dimensional convolution operator, the green is the output image feature, and the number of channels of the operator is hidden.
Applsci 13 07079 g008
Figure 9. The features of medical images in different dimensions. The left side is the T1-weighted image, the middle is the T2-weighted image, and the right side is the FLAIR-weighted image. It can be seen that images in various dimensions provide different features.
Applsci 13 07079 g009
Figure 10. The field of view of two 3 × 3 small convolution kernels can reach the field of view of one 5 × 5 large convolution kernel.
Applsci 13 07079 g010
Figure 11. Diagram clearly showing the structural features and basic modules of different networks introduced in Section 4.3 to help researchers better understand and innovate.
Applsci 13 07079 g011aApplsci 13 07079 g011b
Table 1. MRI dataset for the head; with the development of MRI technology, MRI has become an important tool for the diagnosis of head tumors [18]. For head and neck tumors, an MRI can provide clearer soft tissue imaging, and it is easier to find small tumors below the skull, while a CT easily misses small tumors due to cranial interference.
Tumor SiteDataset Series NameDataset Composition
BrainADNI483 elderly controls, 551MCI and 437AD. 300 early MCI and 150 late MCI [19,20,21]
BRATS1251 training cases and 219 test cases [22,23,24,25]
ABIDE1114 datasets, including 521 ASD and 593 controls [26]
Kaggle247 images, including 155 tumorous and 92 nontumorous [27]
BreastDDSM538 positive samples and 2313 negative samples [28,29]
BreaKHis7909 images, including 2480 benign and 5429 images [30]
LiverISBI 201920 volumes of T2-SPIR MRI [25,31]
Table 2. CT dataset for the lungs, MRI images of the lungs are few, which is because the lung tissue contains a large amount of gas, the MRI signal is weak, and the lung lesions are not clear, especially not sensitive to calcification, and it is easy to cause motion artifacts. However, a CT can find small lesions well and scan quickly, reducing the generation of motion artifacts.
Tumor SiteDataset Series NameDataset Composition
Brain335 slices285 datasets, including 57 AD, 115 lesion, and 113 normal [32]
20 groups of clinical data + digital twin20 groups of clinical data processed by registration, skull peeling, and contrast enhancement [33]
HECKTOR 2020201 training cases and 53 test cases [34,35]
BreastTUPAC 2016500 training cases and 321 test cases [36]
TGGA1000 images, including details of AJCC stage, tumor subtypes, and relevant mutational status [29,36]
Standard benchmark dataset6000 training cases and 2000 test cases [37]
LiverLiTS challenge 201722,500 images for training, 2550 images for validation, and 16,125 test images [38,39]
SLiver0730 CT scans, including 20 training and 10 testing [40]
3DIRCADb20 CT scans with 15 liver tumors [39,41]
LungNSCLC50 patients with 128-slice PET-CT [42]
LUNA888 CT images of 1084 tumors, with the help of experts, excluding tumors smaller than 3 mm [43]
STSsCT and MRI from 51 patients [42,44]
Lung cancer patient dataset48 training cases and 36 test cases [45]
COVID-19 dataset2500 high-quality images of COVID-19 [46]
LIDC-IDRI1018 patients’ CT data and their marker information, [47]
TCGA51 patients’ CT data [48,49]
NIH Deeplesion datasetover 32,000 annotated lesions identified on CT images, representing 4400 unique patients [50]
NLSTMore than 75,000 CT images and more than 1200 pathological images from NLST lung cancer patients [51]
SPIE-AAPM70 patients who underwent CT and received diagnoses [52]
Table 3. Summary and comparison of different medical imaging methods.
Tumor TypesData ComplementMethodResult
Brain tumor165 child subjectsLearning method based on local shape and sparse appearance [62]DICE0.779
KaggleMultilayer perceptron algorithm in the CNN [27]ACCURACY86.63%
BRATS 2017VGG-19 with hand-marked features [22]DSC0.99
FigshareDenseNet21 and Adadelta with transfer learning [70]ACCURACY98.91%
BRATS 2018U-Net with Squeeze-and-Excitation [23]DICE0.823
HECKTOR2020U-Net with SA [73]ACCURACY75.2
CT images of Naval General Hospitalfuse a 2D CNN with a 3D CNNACCURACY87.60%
ABIDEU-Net with VINN [26]DSC1.46
HECKTOR 20203D FCN uses two independent V-Net [45]ACCURACY89.10%
Liver tumorImageCLEFEntropy-based fuzzy region growth method [66]DSM0.88
MIDASFuzzy C-means [53]DSC0.81
MMWHS2017 challengeUDA architecture with transfer learning [31]ACCURACY78.50%
Benchmark dataset GoogLeNet with transfer learning [37]ACCURACY97.53%
LiTSV-Net [74]DICE0.954
SLiver073D CNN to directly guide the objective function [40]VOE5.42
3DIRCADbH-DenseUNet [39]ACCURACY93.70%
MRI from McGil Health CenterU-Net extracted multiscale features of different modes [75]ACCURACY81.98%
Breast TumorTUPAC 2016CNN modelling method based on explainable context [36]ACCURACY82%
BreaKHisResNet with Inception model [11]ACCURACY82.60%
BreaKHisResNet50 with transfer learning [64]ACCURACY98%
lung tumor107 different patientsFractional Browne motion model [67]ACCURACY88.82%
952 patientsYOLO v3 with Google Inception v3 network [68]ACCURACY-IMPROVE95.52%
2933 patients with COVID-19AlexNet with transfer learning [46]ACCURACY99.05%
STSU-Net with multimode spatial attention module [42]ACCURACY71.44%
Disclaimer/Publisher’s Note: The statements, opinions and data contained in all publications are solely those of the individual author(s) and contributor(s) and not of MDPI and/or the editor(s). MDPI and/or the editor(s) disclaim responsibility for any injury to people or property resulting from any ideas, methods, instructions or products referred to in the content.

