
Blasting Fragmentation Study Using 3D Image Analysis of a Hard Rock Mine

Abstract
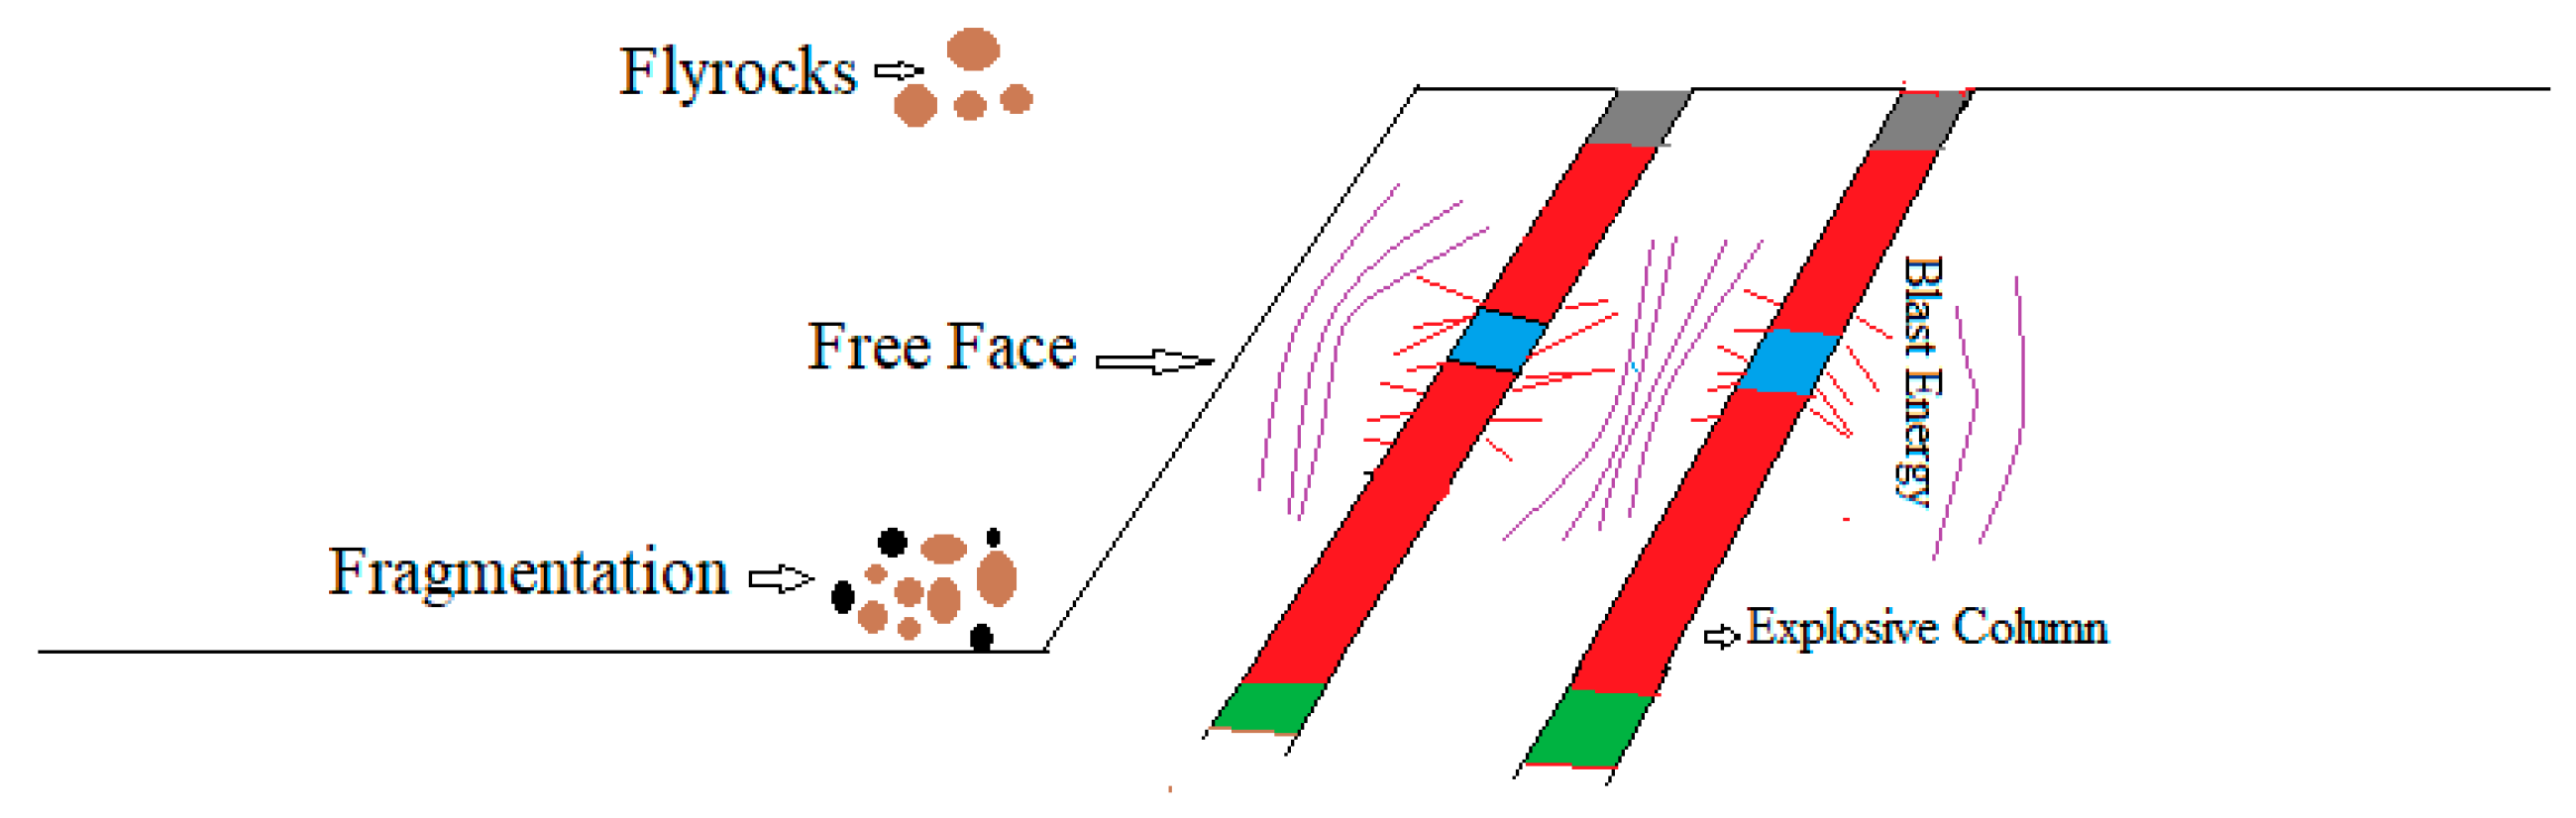
:1. Introduction
2. Materials and Methods
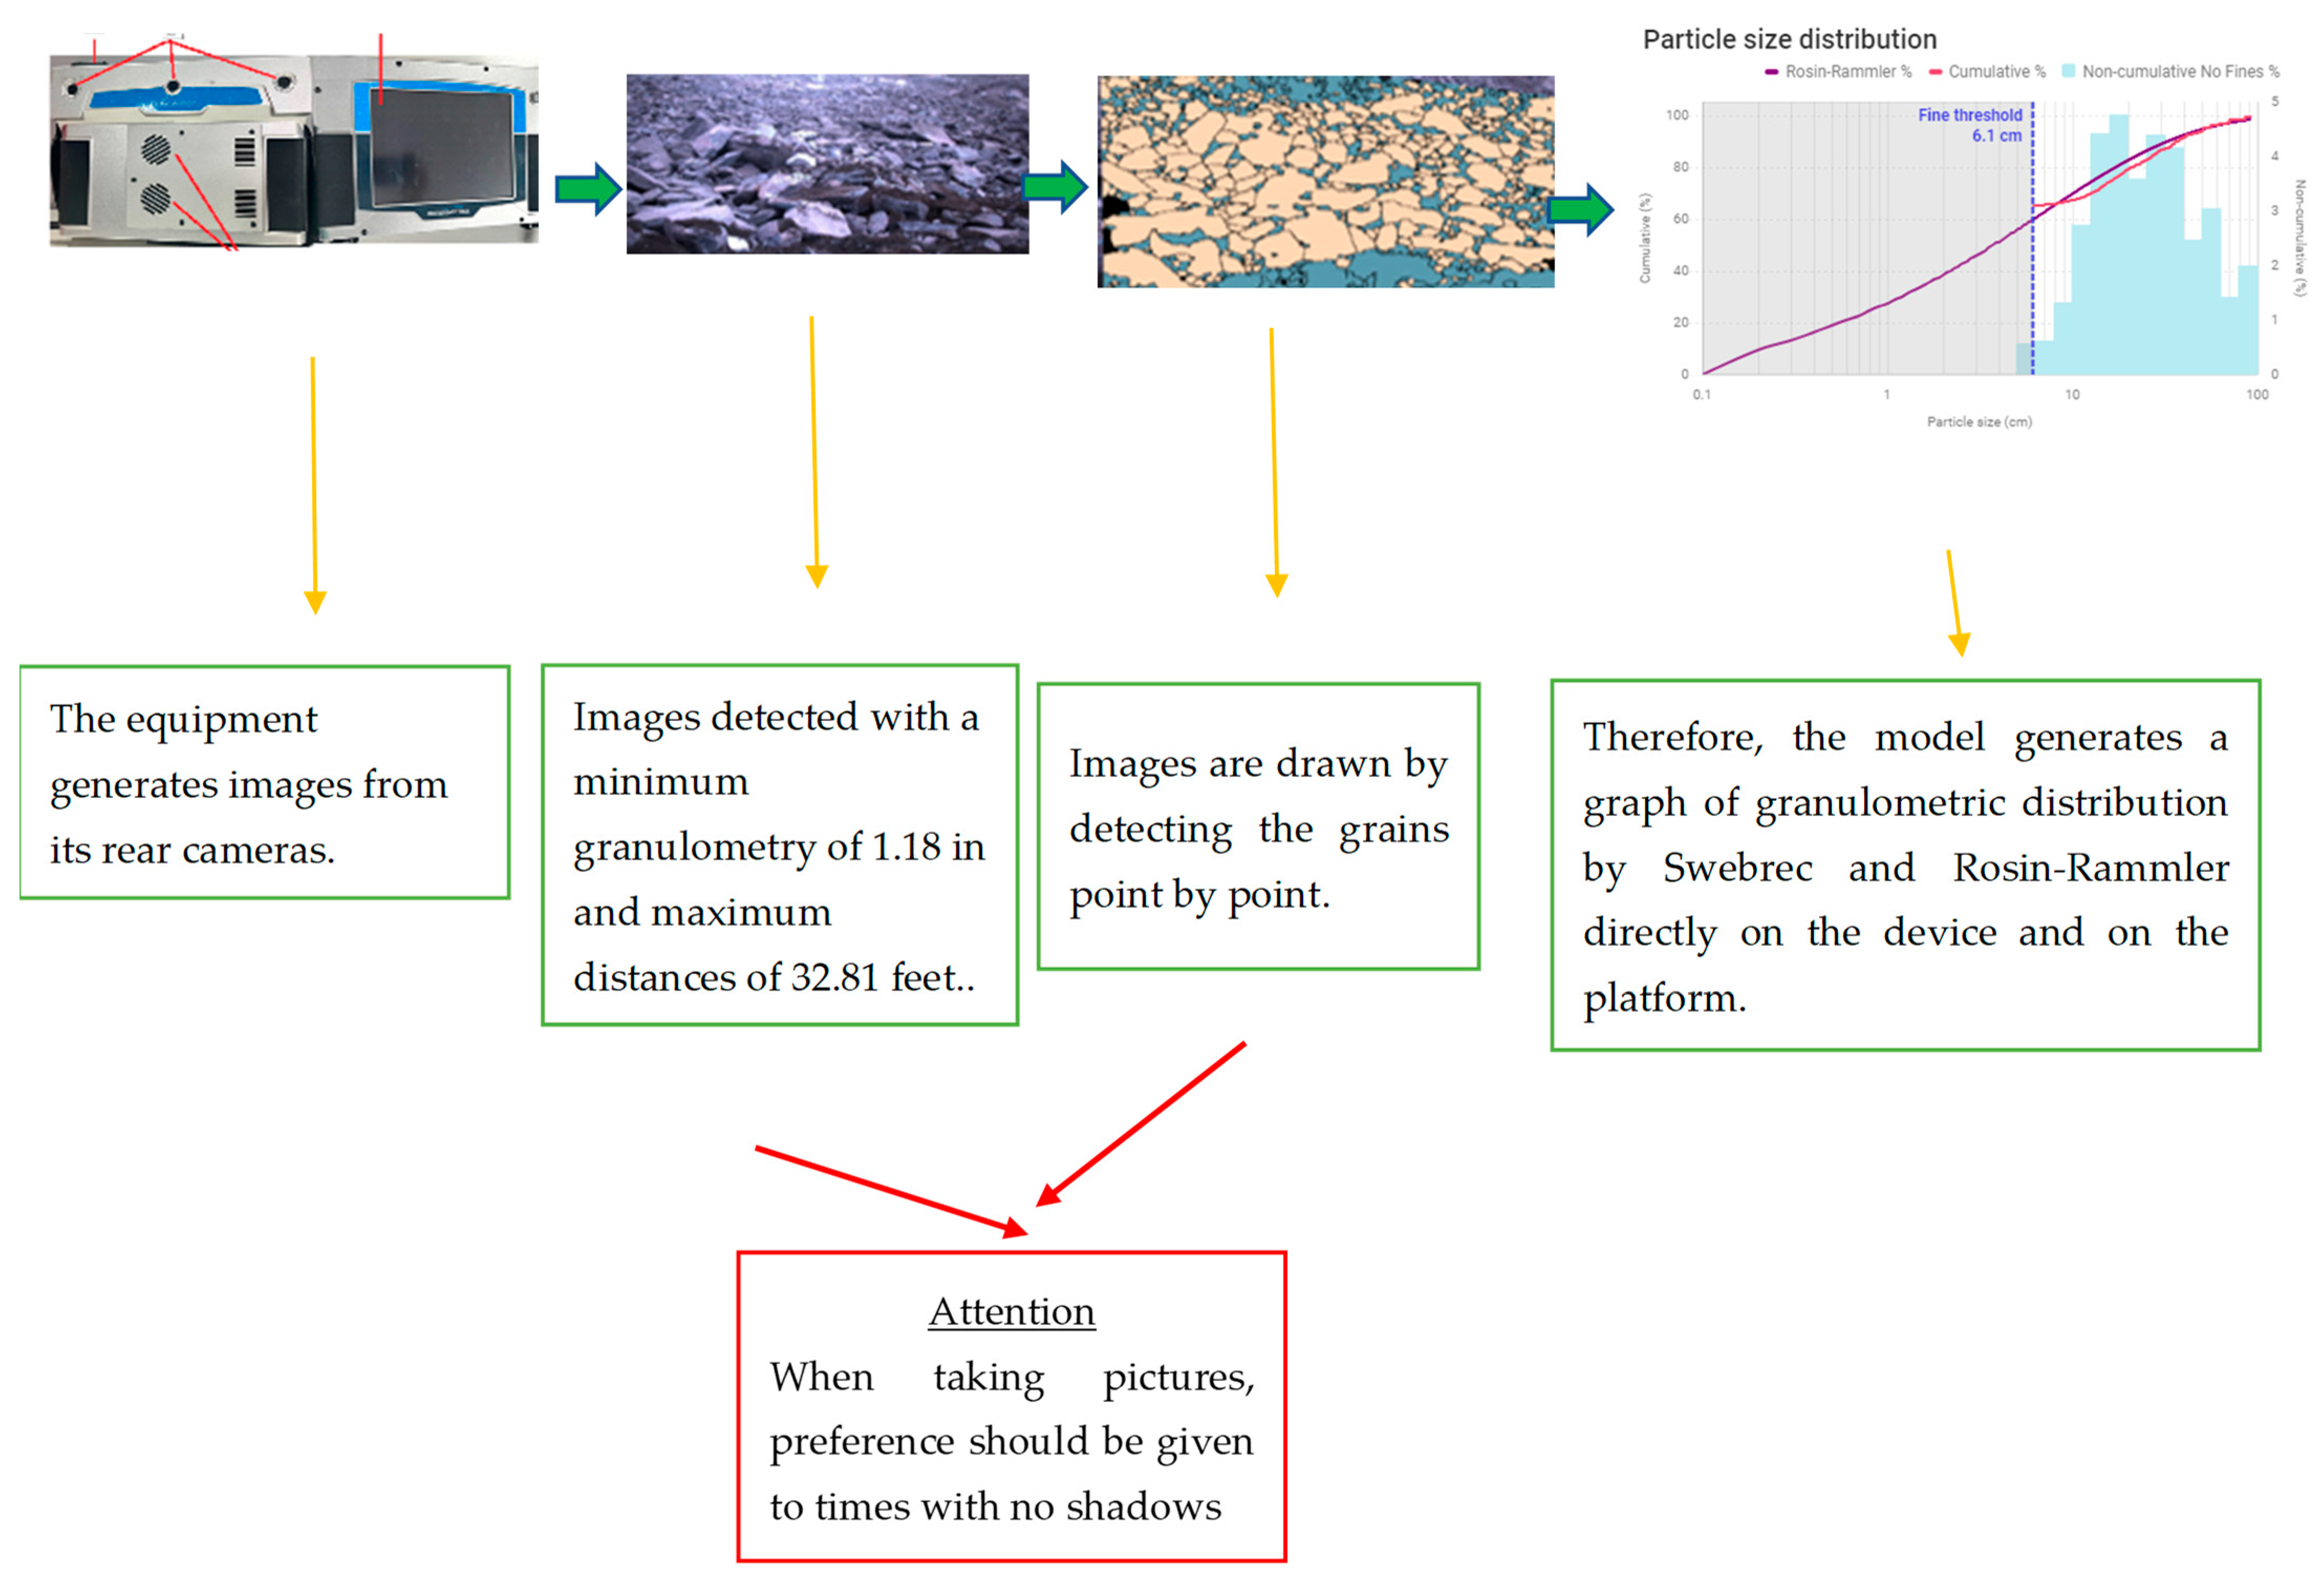
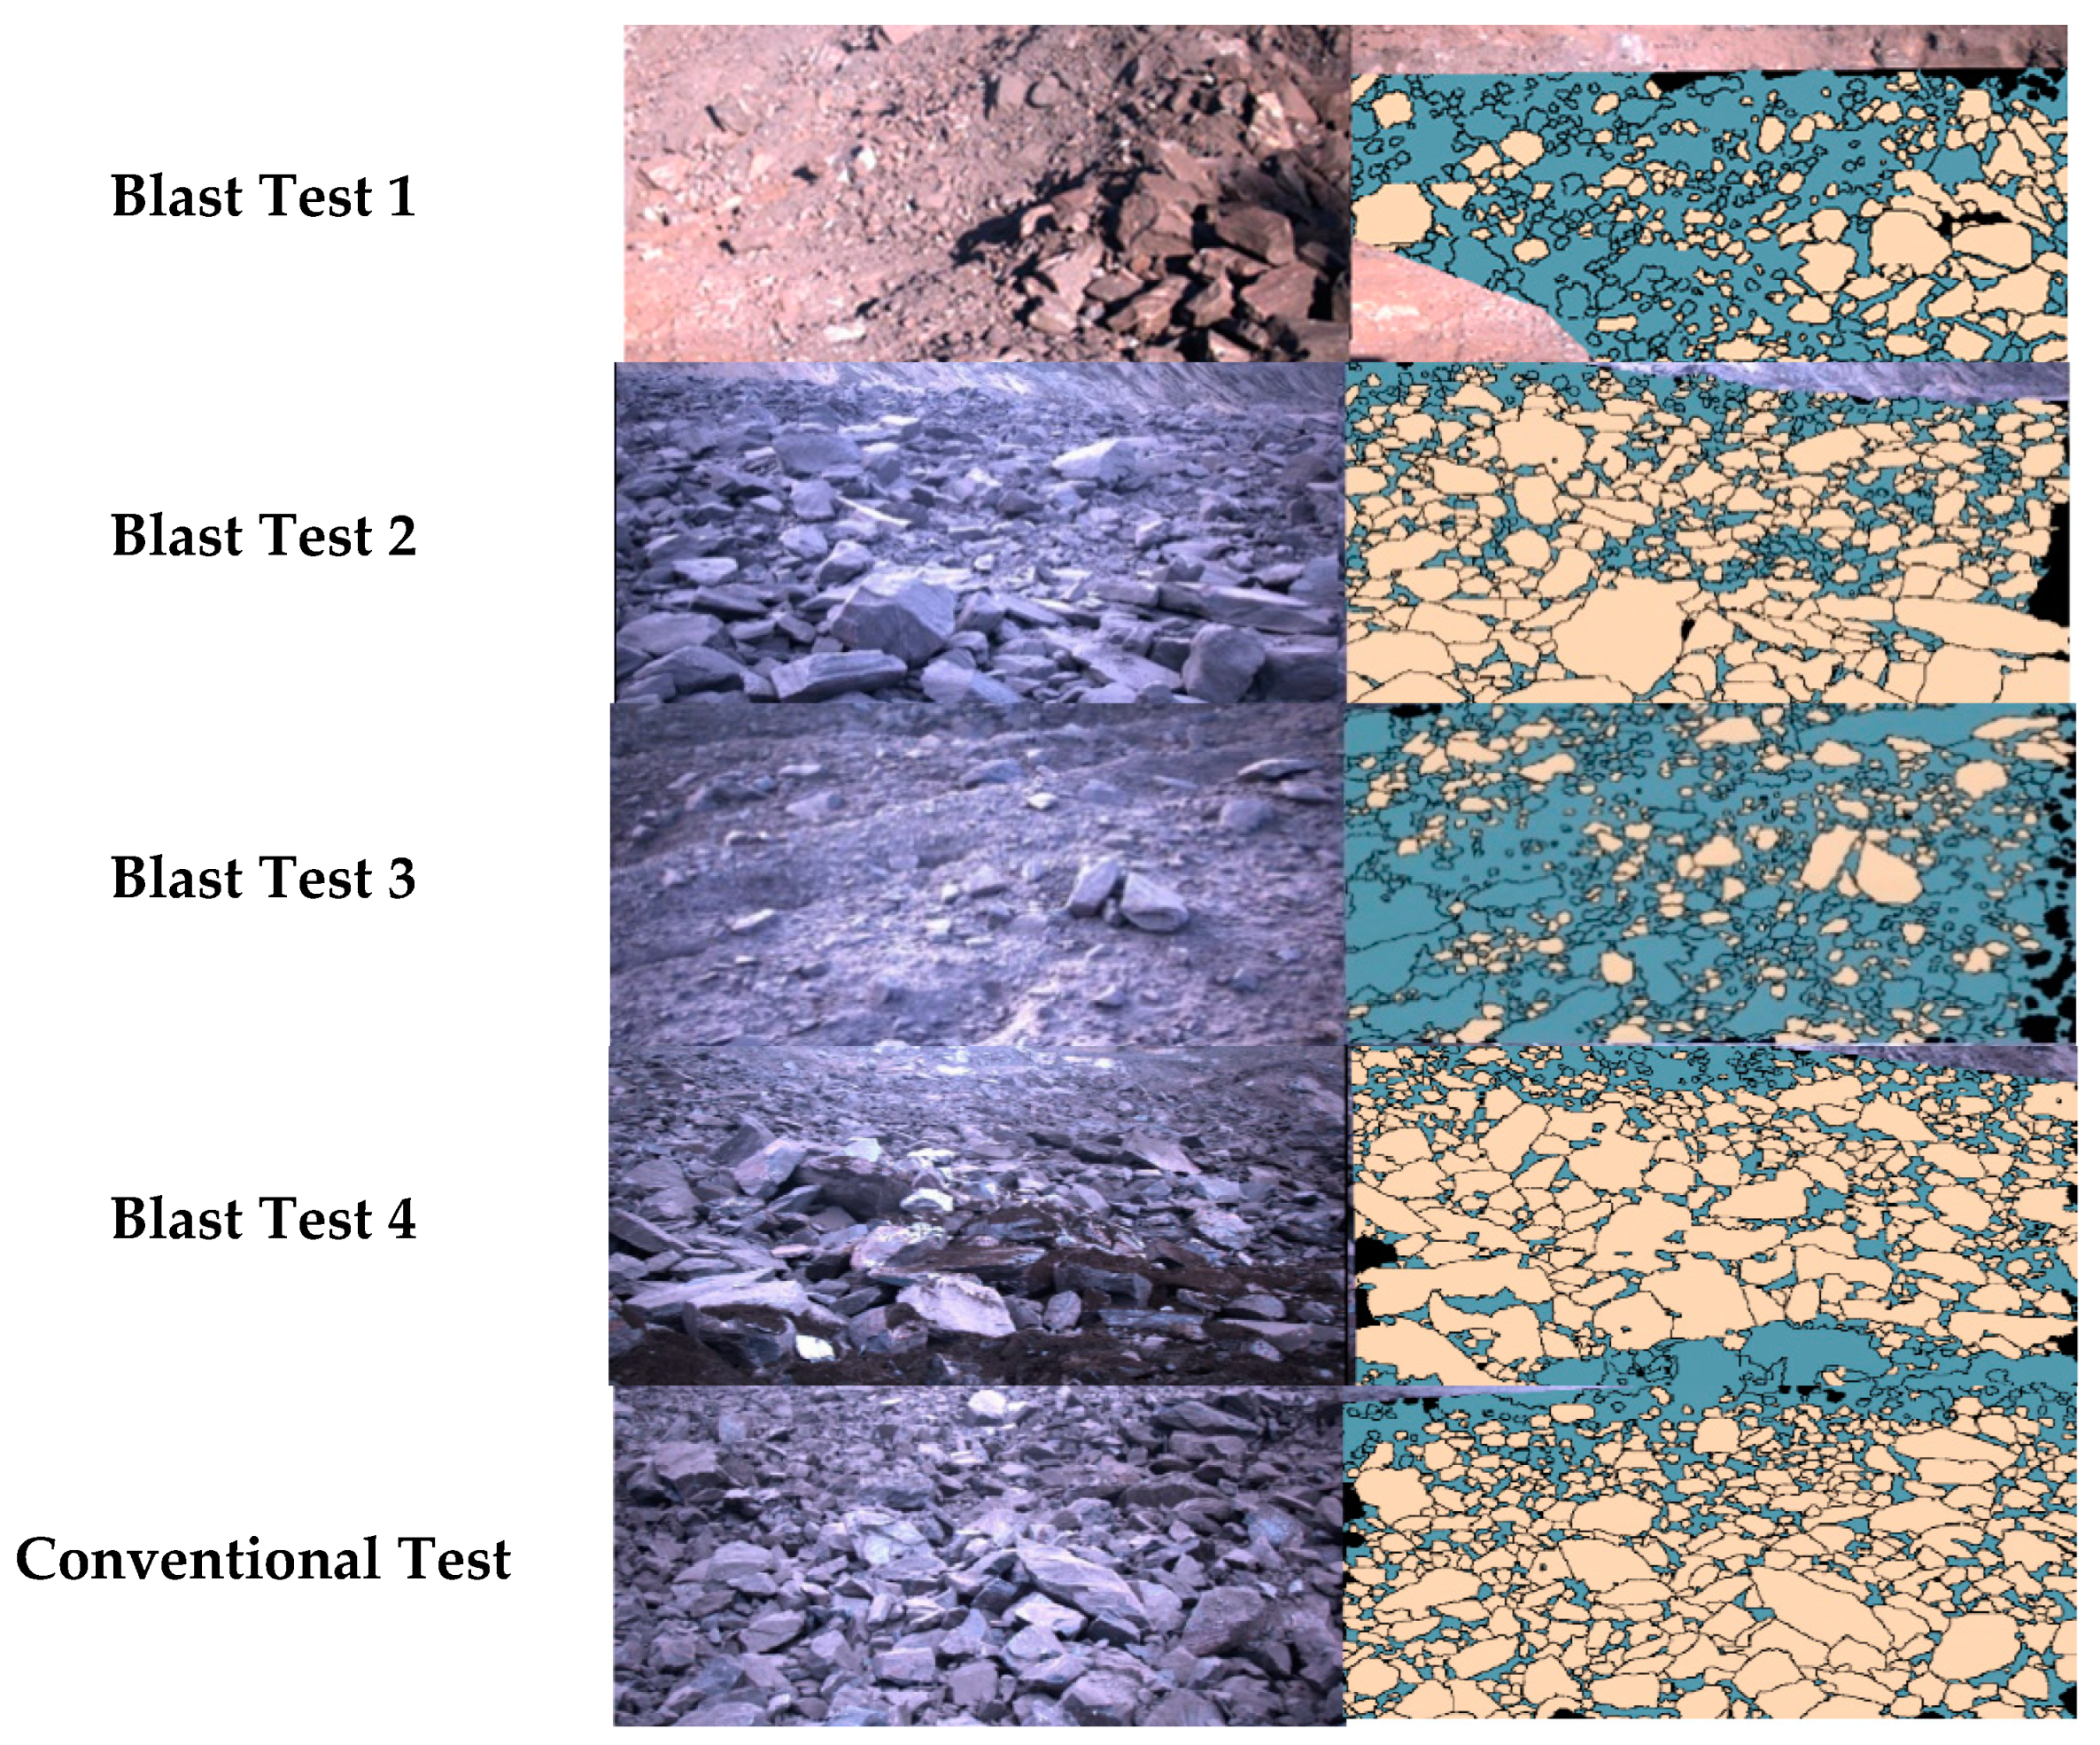
2.1. PortaMetrics™ Image Capture
2.2. PortaMetrics™ Image Analysis
2.3. Kuz–Ram Model Analysis
2.4. Blasting Design Tests
2.5. Impacts on Mine Productivity
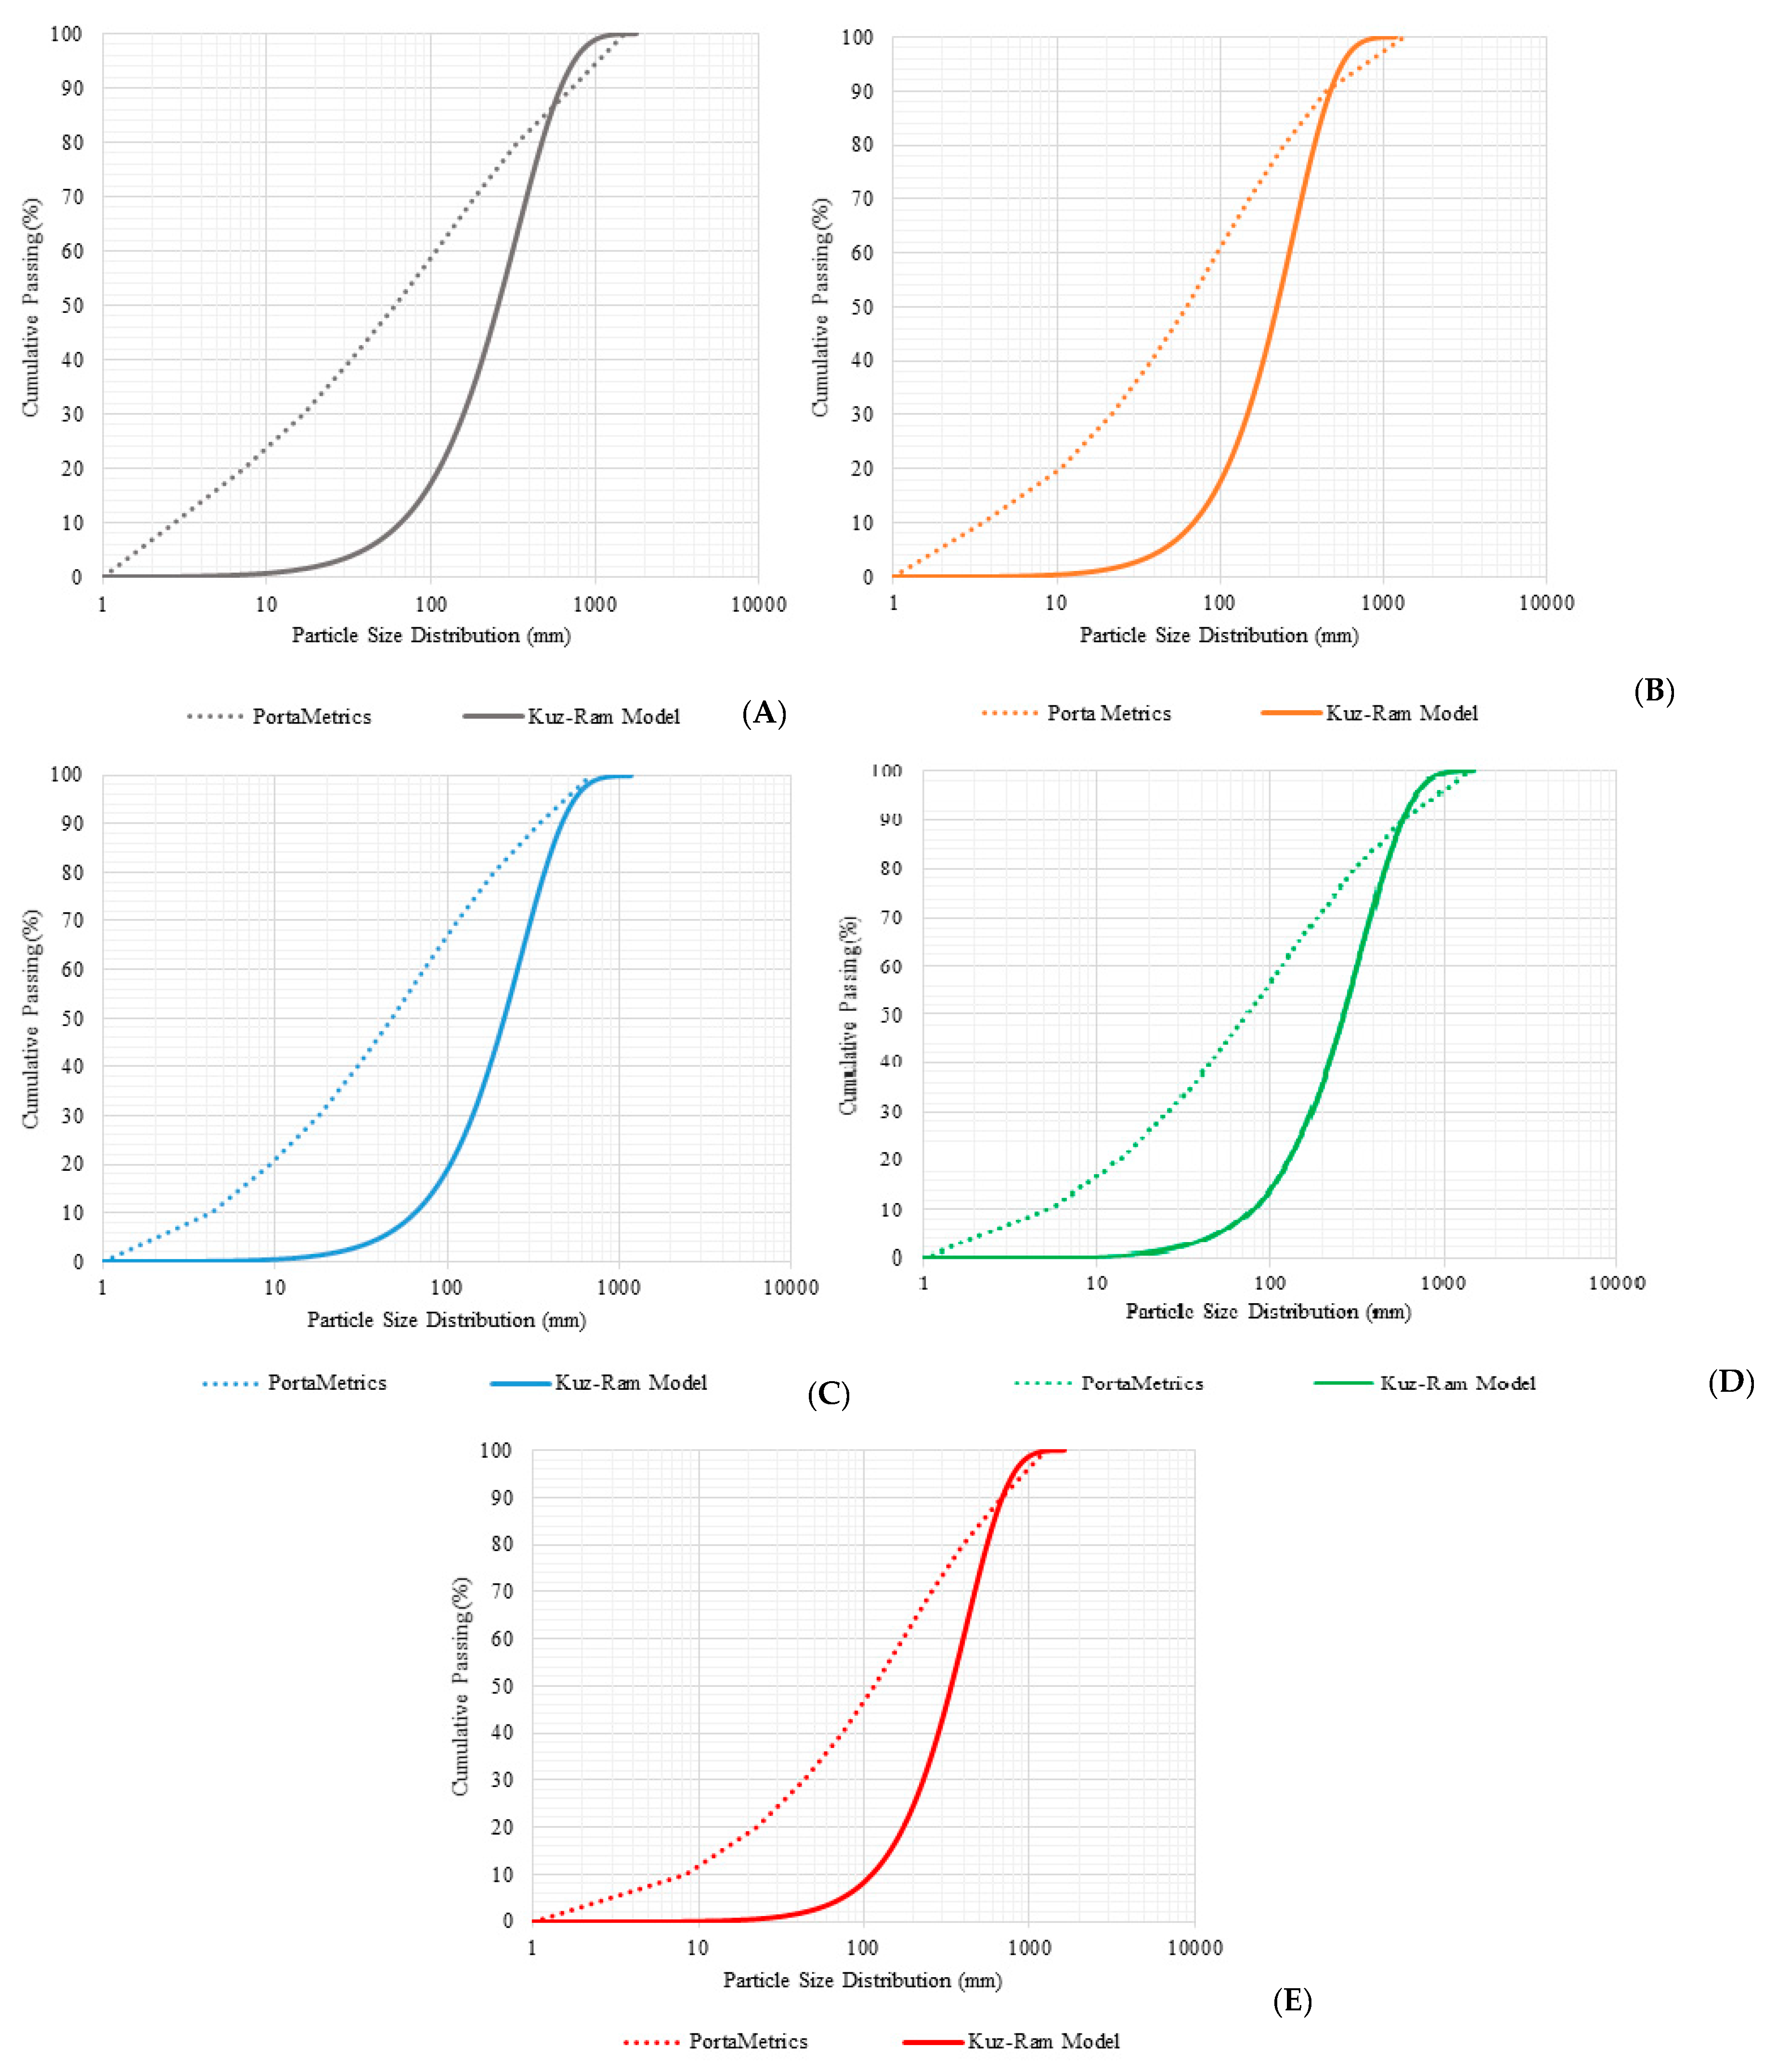
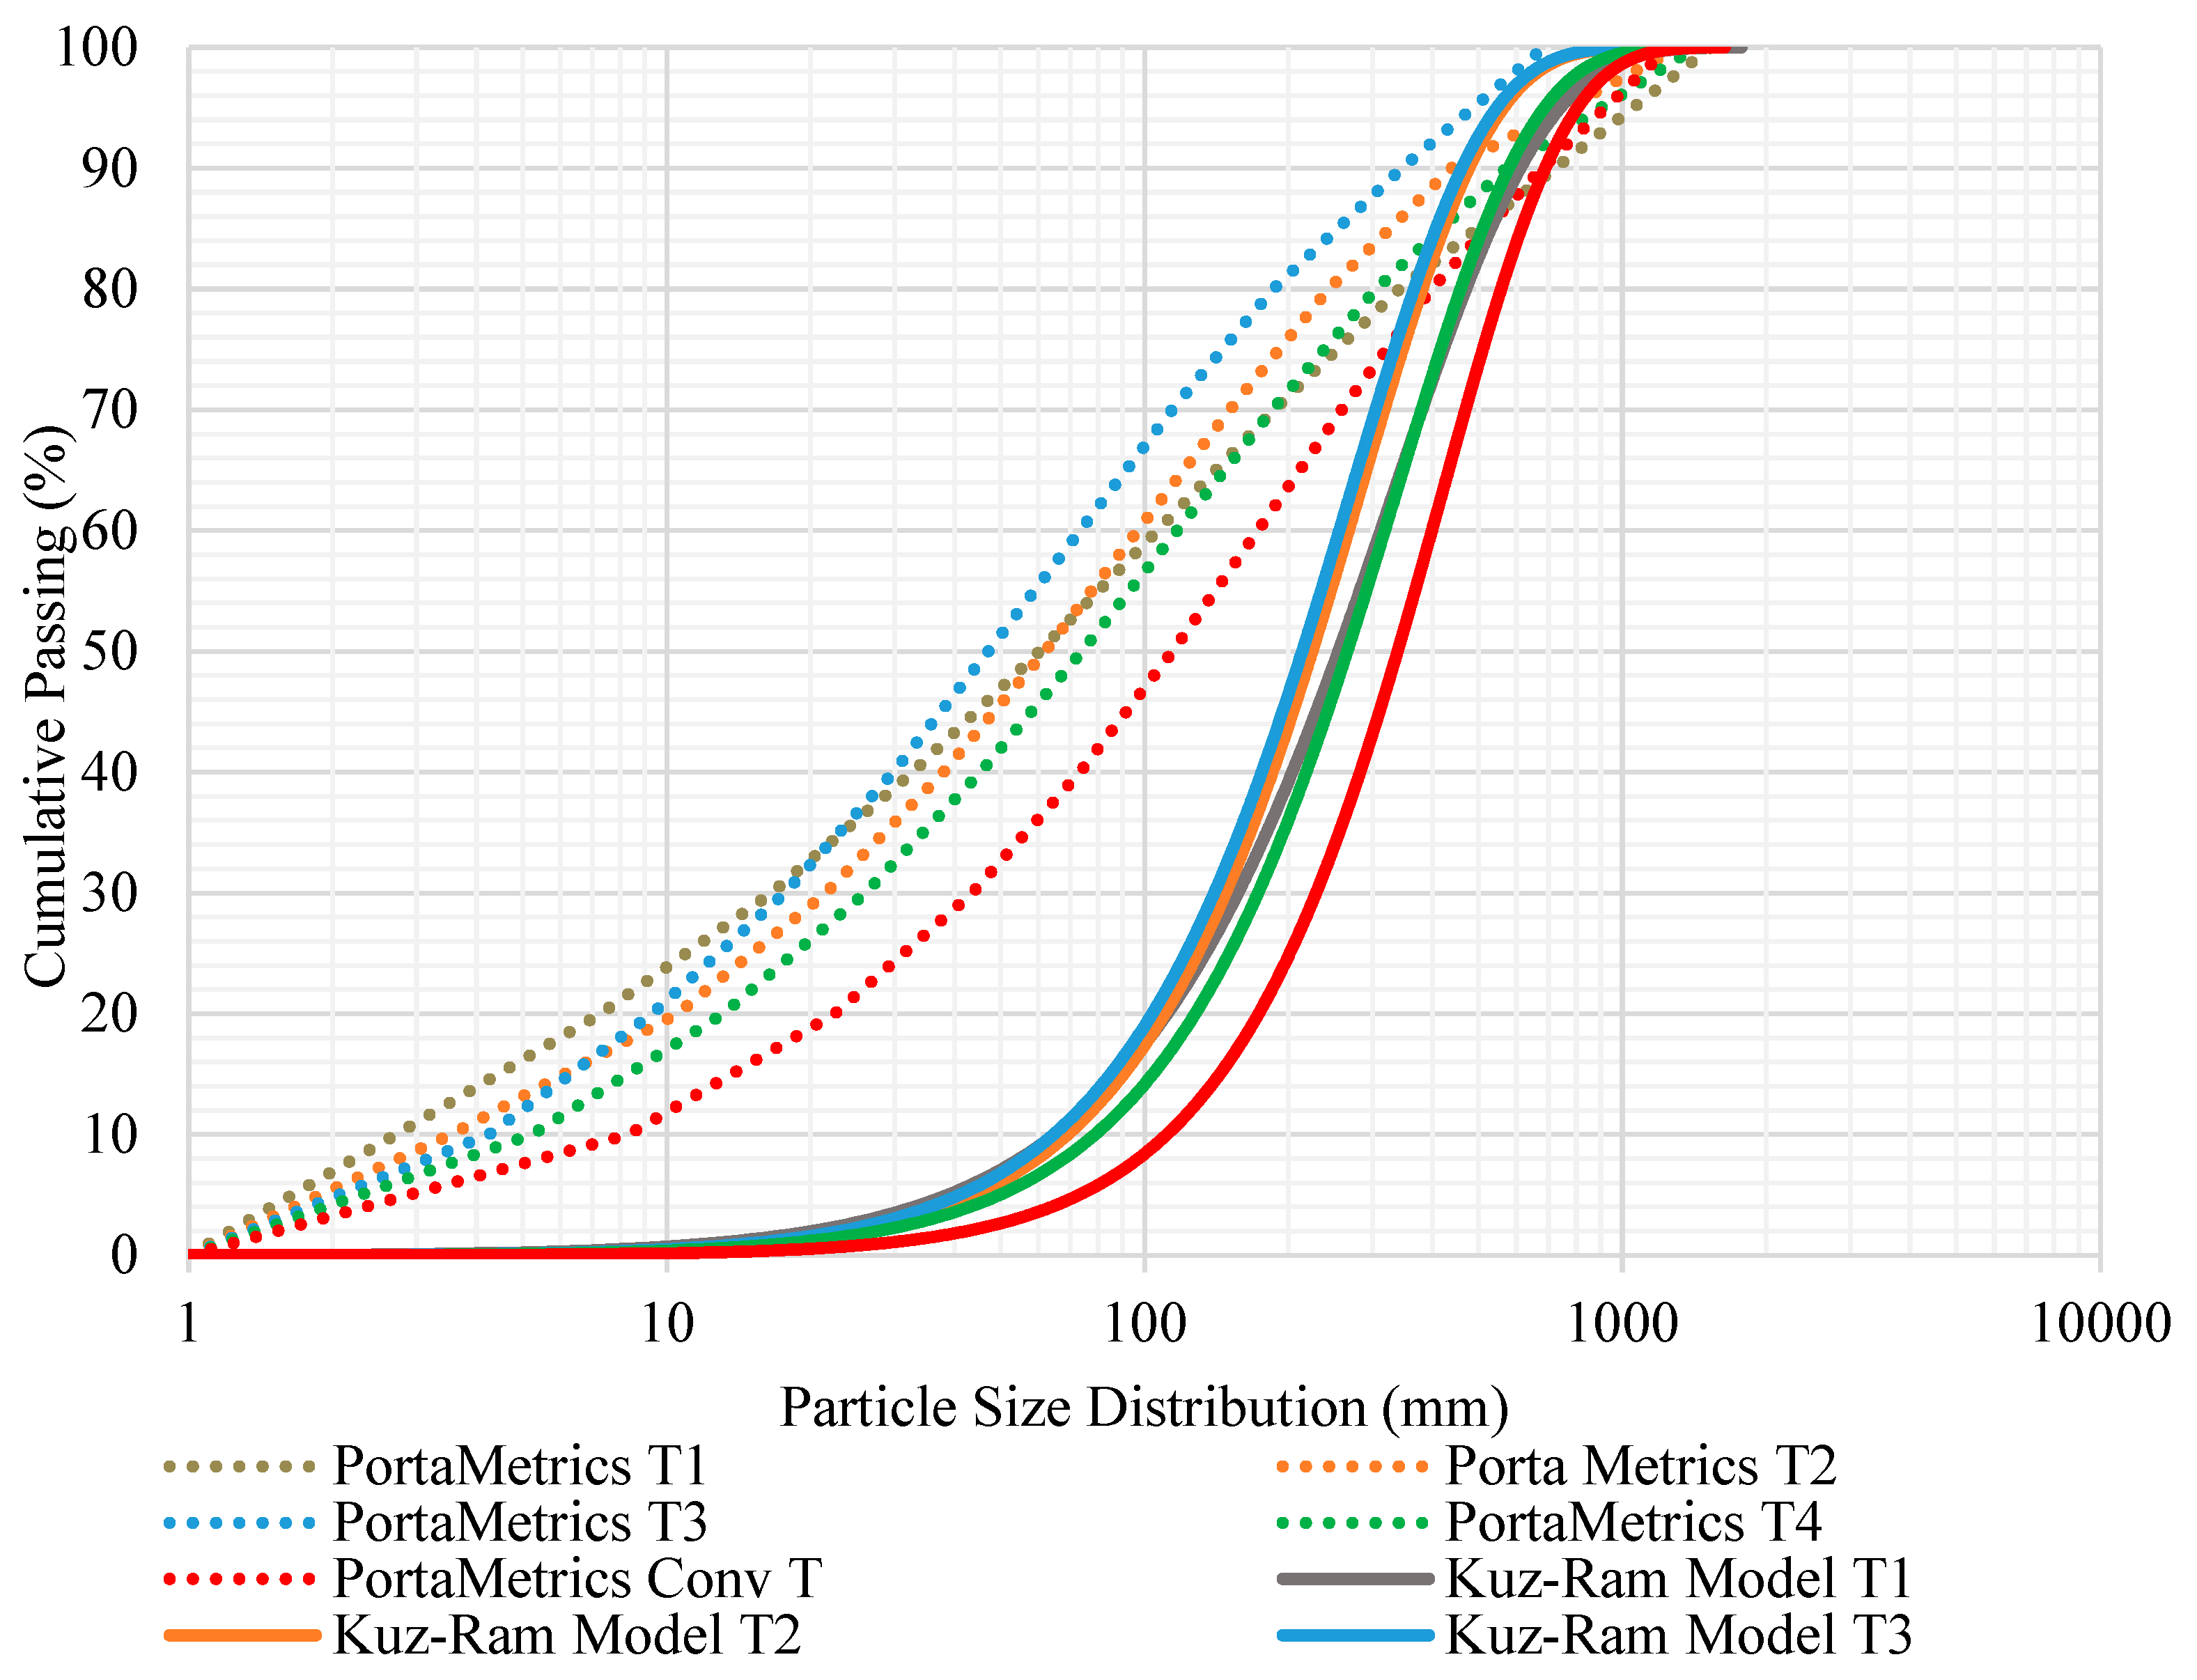
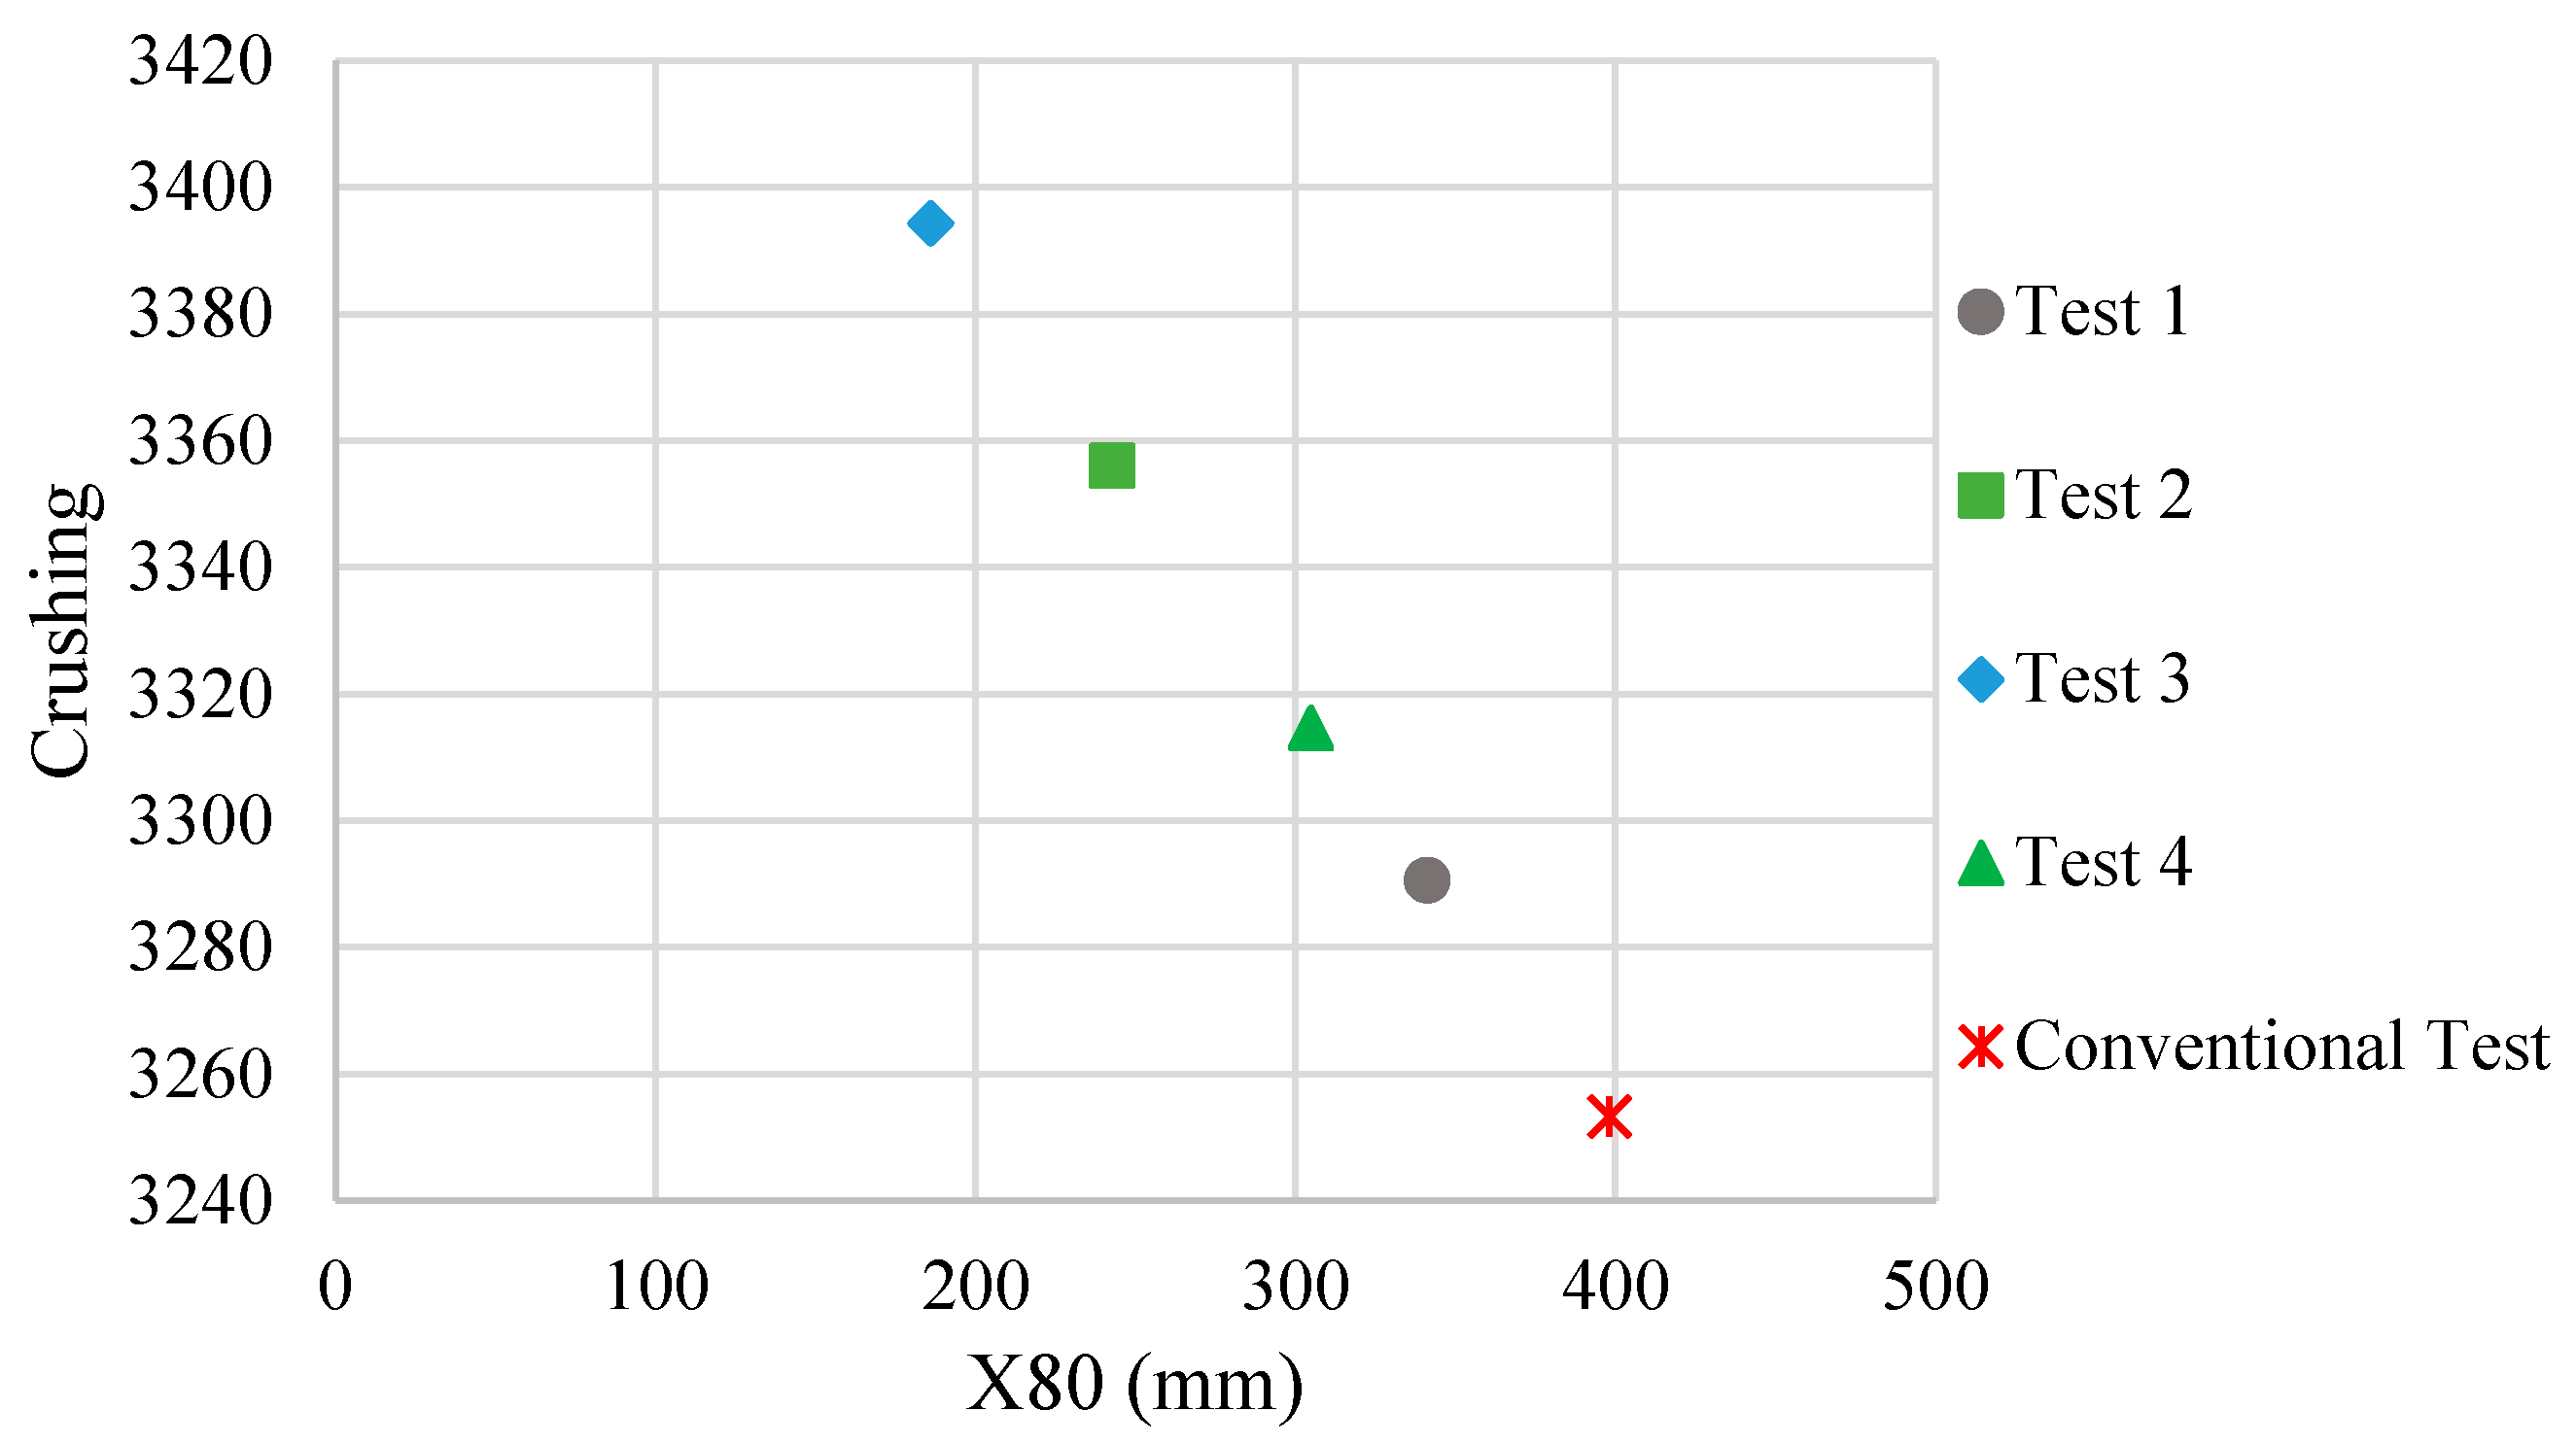
3. Results and Discussion
4. Conclusions and Recommendations
- Via the execution of blasting tests, it was possible to evaluate the quality of the fragmented material and the proposed blasting design using explosives for very compact itabirite.
- The new methodology of blasting design demonstrated compatibility with the particle size requirements of the mine, presenting a considerable reduction in X80 values.
- The comparison of the particle size distribution curves generated using PortaMetrics with the curves of the Kuz–Ram distribution model was an important method for verifying the applicability and effectiveness of the equipment.
- Through this investigation, it was possible to evaluate the productivity of the mine phases after blasting, in which the increase in the load ratio and alteration of the drilling design generated immediate results in the blasting process and, consequently, in the subsequent phases.
5. Future Works
- Using the mine to crusher methodology, it is possible to approach future work via multivariable statistical analysis and the stochastic method, transmitting in this way greater knowledge about the predictability of blasts.
- A simulation using the Monte Carlo method can also be considered, making the KPIs covered by the operations clearer and broader.
- It is also possible to evaluate other blasting parameters, such as the energy released and the amount of explosives generated, to establish optimization around this factor of interest.
Author Contributions
Funding
Informed Consent Statement
Data Availability Statement
Acknowledgments
Conflicts of Interest
Ethical Statement
References
- Nikkhah, A.; Vakylabad, A.B.; Hassanzadeh, A.; Niedoba, T.; Surowiak, A. An evaluation of the impact of ore fragmented by blasting on mining performance. Minerals 2022, 12, 258. [Google Scholar] [CrossRef]
- Shehu, S.A.; Abdulazeez, S.; Yusuf, K.O.; Hashim, M.H.M. Comparative study of WipFrag image analysis and Kuz-Ram empirical model in granite aggregate quarry and their application for blast fragmentation rating. Geomech. Geoeng. 2020, 17, 197–205. [Google Scholar] [CrossRef]
- Navarro Torres, V.F.; Figueiredo, J.R.; De La Hoz, R.C.; Botaro, M.; Chaves, L.S. A mine-to-crusher model to minimize costs at a truckless open-pit iron mine in Brazil. Minerals 2022, 12, 1037. [Google Scholar] [CrossRef]
- Dumakor-Dupey, N.K.; Arya, S.; Jha, A. Advances in Blast-Induced Impact Prediction—A Review of Machine Learning Applications. Minerals 2021, 11, 601. [Google Scholar] [CrossRef]
- Yu, Z.; Shi, X.; Zhou, J.; Chen, X.; Qiu, X. Effective Assessment of Blast-Induced Ground Vibration Using an Optimized Random Forest Model Based on a Harris Hawks Optimization Algorithm. Appl. Sci. 2020, 10, 1403. [Google Scholar] [CrossRef] [Green Version]
- Al-Bkri, A.Y.; Sazid, M. Application of Artificial Neural Network (ANN) for Prediction and Optimization of Blast-Induced Impacts. Mining 2021, 1, 315–334. [Google Scholar] [CrossRef]
- Zamora, A.N.B. Analisis del uso de Emulsion Gasificable San-G APU para Optimizar la Fragmentaciòn de Voladuras Primarias—Compañía Minera Antamina S. A—Huaraz; Tese para o título de Engenharia de Minas; Universidad Nacional San Antonio Abad Del Cusco: Cusco, Peru, 2019. [Google Scholar]
- Chang, J.; Sun, L.; Dai, B.; Li, H.; Liu, Z.; Zhao, X.; Ke, B. Research on the fracture properties and mechanism of carbon dioxide blasting based on rock-like materials. Minerals 2023, 13, 3. [Google Scholar] [CrossRef]
- Zhang, Z.X. Rock Fracture and Blasting: Theory and Applications; Elsevier: Amsterdam, The Netherlands, 2016. [Google Scholar]
- Jimeno, L.C.; Jimeno, E.L.; Bermúdez, P.G. Manual de Perforación, Explosivos y Voladura en Minería y Obras Públicas. Grupo de Proyectos de Ingeniería, ETSI Minas y Energía; Universidad Politécnica de Madrid: Madrid, Spain, 2017. [Google Scholar]
- Akbari, M.; Lashkaripour, G.; Bafghi, A.Y.; Ghafoori, M. Blastability evaluation for rock mass fragmentation in Iran central iron ore mines. Int. J. Min. Sci. Technol. 2015, 25, 59–66. [Google Scholar] [CrossRef]
- Nielsen, K.; Lownds, C. Enhancement of taconite crushing and grinding through primary blasting. Int. J. Rock Mech. Min. Sci. 1997, 34, 625. [Google Scholar] [CrossRef]
- Adel, G.; Kojovic, T.; Thornton, D. Mine-to-mill optimization of aggregate production. In Semi-Annual Report No. 4; Virginia Polytechnic Institute & State University: Blacksburg, VA, USA, 2006; p. 168. [Google Scholar]
- Jethro, M.A.; Shehu, S.A.; Kayode, T.S. Effect of Fragmentation on loading at Obajana Cement Company Plc, Nigeria. Int. J. Sci. Eng. Res. 2016, 7, 608–620. [Google Scholar]
- Taqieddin, S.A. Evaluation of the efficiency of a blasting operation designed for a dragline strip mining process. Min. Sci. Technol. 1989, 8, 59–64. [Google Scholar] [CrossRef]
- Hamdi, E.; Du Mouza, J. A methodology for rock mass characterization and classification to improve blast results. Int. J. Rock Mech. Min. Sci. 2005, 42, 177–194. [Google Scholar] [CrossRef]
- Kulula, M.I.; Nashongo, M.N.; Akande, J.M. Influence of blasting parameters and density of rocks on blast performance at Tschudi Mine, Tsumeb, Namibia. J. Miner. Mater. Charact. Eng. 2017, 5, 339–352. [Google Scholar] [CrossRef] [Green Version]
- Khademian, A.; Bagherpour, R. Alteration of grindability of minerals due to applying different explosives in blasting operation. Miner. Eng. 2017, 111, 174–181. [Google Scholar] [CrossRef]
- Nanda, S.; Pal, B.K. Analysis of blast fragmentation using WipFrag. Int. J. Innov. Sci. Res. Technol. 2020, 5, 1561–1566. Available online: https://ijisrt.com/assets/upload/files/IJISRT20JUN1086.pdf (accessed on 7 March 2023). [CrossRef]
- Liu, B. Characterisation of Block Cave Mining Secondary Fragmentation. Master’s Dissertation, The University of British Columbia, Vancouver, BC, Canada, 2016. Available online: https://open.library.ubc.ca/soa/cIRcle/collections/ubctheses/24/items/1.0306909 (accessed on 7 March 2023).
- Weir, M.M. Porta Metrics. Available online: https://www.motionmetrics.com/portametrics/ (accessed on 2 February 2023).
- Kuznetsov, V.M. The mean diameter of the fragments formed by blasting rock. Sov. Min. Sci. 1973, 9, 144–148. [Google Scholar] [CrossRef]
- Mertuszka, P.; Kramarczyk, B.; Pytlik, M.; Szumny, M.; Jaszcz, K.; Jarosz, T. Implementation and Verification of Effectiveness of Bulk Emulsion Explosive with Improved Energetic Parameters in an Underground Mine Environment. Energies 2022, 15, 6424. [Google Scholar] [CrossRef]
- Cunningham, C.V.B. The Kuz–Ram model for prediction of fragmentation from blasting. In Proceedings of the First International Symposium on Rock Fragmentation by Blasting, Luleå, Sweden, 23–26 August 1983; Holmberg, R., Rustan, A., Eds.; Lulea University of Technology: Luleå, Sweden, 1983; pp. 439–454. [Google Scholar]
- Cunningham, C.V.B. Fragmentation estimations and the Kuz–Ram model—Four years on. In Proceedings of the Second International Symposium on Rock Fragmentation by Blasting, Keystone, CO, USA, 23–26 August 1987; Society for Experimental Mechanics: Bethel, CT, USA, 1987; pp. 475–487. [Google Scholar]
- Cunningham, C.V.B. The Kuz-Ram fragmentation model—20 years on. In Brighton Conference Proceedings; Holmberg, R., Ed.; European Federation of Explosives Engineer: Brighton, UK, 2005; pp. 201–210. [Google Scholar]
- Rosin, P.; Rammler, E. The law governing the fineness of powdered coal. J. Inst. Fuel 1933, 7, 29–36. [Google Scholar]
- Amoako, R.; Jha, A.; Zhong, S. Rock Fragmentation prediction using an artificial neural network and support vector regression hybrid approach. Mining 2022, 2, 233–247. [Google Scholar] [CrossRef]
- Hustrulid, W.A. Blasting Principles for Open Pit Mining: Theoretical Foundations, 1st ed.; AA Balkema: Rotterdam, The Netherlands, 1999. [Google Scholar]
- Cameron, P.; Drinkwater, D.; Pease, J. The ABC of Mine to Mill and Metal Price Cycles; Australasian Institute of Mining and Metallurgy (AusIMM) Bulletin: Carlton, Australia, 2017; p. 9. [Google Scholar]
- Mckee, D.J. Understanding Mine to Mil, 1st ed.; The Cooperative Research Centre for Optimizing Resource Extraction (CRC ORE): Brisbane, Australia, 2013; p. 96. [Google Scholar]
- Varannai, B.; Johansson, D.; Schunnesson, H. Crusher to mill transportation time calculation—The Aitik case. Minerals 2022, 12, 147. [Google Scholar] [CrossRef]
- Ebrahimi, E.; Monjezi, M.; Khalesi, M.R.; Armaghani, D.J. Prediction and optimization of back-break and rock fragmentation using an artificial neural network and a bee colony algorithm. Bull. Eng. Geol. Environ. 2015, 75, 27–36. [Google Scholar] [CrossRef]
- Monjezi, M.; Rezaei, M.; Yazdian Varjani, A. Prediction of rock fragmentation due to blasting in Gol-E-Gohar iron mine using fuzzy logic. Int. J. Rock Mech. Min. Sci. 2009, 46, 1273–1280. [Google Scholar] [CrossRef]


| Component | Function |
|---|---|
| A: Touch screen | Edits and selects images |
| B: GPS antenna | Provides positioning information |
| C: Capture button | Captures/records the fragmentation for analysis |
| D: On/off button | For turning the equipment on and off |
| E: Cameras | Three stereoscopic cameras that create and analyze 3D fragmentations |
| F: Fan | Provides cooling to the equipment, preventing damage from overheating |
| Properties | Values |
|---|---|
| Density (kg/m 3) | 3.300 |
| P wave velocity (m/s) | 4.308 |
| Simple compressive strength (MPa) | 350 |
| Tensile strength (MPa) | 33 |
| Young’s modulus (GPa) | 47 |
| Poisson’s coefficient | 0.22 |
| Protodyakov’s coefficient | 13 |
| Diving lithology (°) | 60 |
| Blasting | No. of Drills | H (m) | B (m) | Y (m) | L (m) | St (m) | J (m) | Q (kg) | Rc (kg/m3) |
|---|---|---|---|---|---|---|---|---|---|
| Test 1 | 24 | 15.00 | 4.00 | 4.80 | 10.14 | 5.65 | 0.79 | 668 | 2.06 |
| Test 2 | 48 | 16.00 | 4.00 | 5.00 | 12.40 | 3.96 | 0.36 | 776 | 2.49 |
| Test 3 | 36 | 15.00 | 4.00 | 5.00 | 11.43 | 4.21 | 0.64 | 701 | 2.59 |
| Test 4 | 35 | 16.00 | 4.20 | 5.40 | 11.94 | 4.00 | 0.00 | 714 | 1.98 |
| Conventional Test | 114 | 16.00 | 4.20 | 5.40 | 11.94 | 4.00 | 0.00 | 713 | 1.46 |
| Productivity (t/h) | Variables |
|---|---|
| : loading productivity; : physical use of the excavator (%); : excavator payload; : lithology calibration coefficient; : turnaround time (s); and : discharge time (s). | |
| : transportation productivity; : physical use of transport (%); average transport load (t); : number of passes; : variable time (min); and : fixed time (min). | |
| : primary crushing productivity and : real productivity (t/h). |
| Parameter | Tests | |||||
|---|---|---|---|---|---|---|
| 1 | 2 | 3 | 4 | Conventional | ||
| n | Kuz–Ram model | 1.37 | 1.58 | 1.56 | 1.54 | 1.69 |
| PortaMetrics | 0.48 | 0.61 | 0.51 | 0.52 | 0.36 | |
| Xc (mm) | Kuz–Ram model | 331.46 | 281.44 | 269.19 | 335.72 | 419.48 |
| PortaMetrics | 125.86 | 111.00 | 82.83 | 134.00 | 194.92 | |
| X50 (mm) | Kuz–Ram model | 253.44 | 223.28 | 212.73 | 264.52 | 337.45 |
| PortaMetrics | 60.29 | 61.91 | 47.08 | 74.00 | 114.42 | |
| X80 (mm) | Kuz–Ram model | 469.19 | 379.80 | 365.14 | 457.12 | 556.01 |
| PortaMetrics | 341.29 | 242.82 | 186.00 | 304.76 | 398.08 | |
| X100 (mm) | Kuz–Ram model | 1775.00 | 1198.00 | 1175.00 | 1492.00 | 1637.00 |
| PortaMetrics | 1530.00 | 1319.36 | 686.33 | 1421.86 | 1252.08 | |
| Parameter | Tests | ||||
|---|---|---|---|---|---|
| 1 | 2 | 3 | 4 | Conventional | |
| 100.00 | 100.00 | 100.00 | 100.00 | 100.00 | |
| 40.76 | 40.76 | 40.76 | 40.76 | 40.76 | |
| a | 12.15 | 12.15 | 12.15 | 12.15 | 12.15 |
| 21.67 | 21.67 | 21.67 | 21.67 | 21.67 | |
| 3.95 | 3.95 | 3.95 | 3.95 | 3.95 | |
| 100.00 | 100.00 | 100.00 | 100.00 | 100.00 | |
| 243.00 | 243.00 | 243.00 | 243.00 | 243.00 | |
| p | 6.00 | 6.00 | 6.00 | 6.00 | 6.00 |
| 23.62 | 23.62 | 23.62 | 23.62 | 23.62 | |
| 6.38 | 6.38 | 6.38 | 6.38 | 6.38 | |
| 3523.00 | 3523.00 | 3523.00 | 3523.00 | 3523.00 | |
Disclaimer/Publisher’s Note: The statements, opinions and data contained in all publications are solely those of the individual author(s) and contributor(s) and not of MDPI and/or the editor(s). MDPI and/or the editor(s) disclaim responsibility for any injury to people or property resulting from any ideas, methods, instructions or products referred to in the content. |
© 2023 by the authors. Licensee MDPI, Basel, Switzerland. This article is an open access article distributed under the terms and conditions of the Creative Commons Attribution (CC BY) license (https://creativecommons.org/licenses/by/4.0/).
Share and Cite
Figueiredo, J.; Torres, V.; Cruz, R.; Moreira, D. Blasting Fragmentation Study Using 3D Image Analysis of a Hard Rock Mine. Appl. Sci. 2023, 13, 7090. https://doi.org/10.3390/app13127090
Figueiredo J, Torres V, Cruz R, Moreira D. Blasting Fragmentation Study Using 3D Image Analysis of a Hard Rock Mine. Applied Sciences. 2023; 13(12):7090. https://doi.org/10.3390/app13127090
Chicago/Turabian StyleFigueiredo, Janine, Vidal Torres, Rodolfo Cruz, and Douglas Moreira. 2023. "Blasting Fragmentation Study Using 3D Image Analysis of a Hard Rock Mine" Applied Sciences 13, no. 12: 7090. https://doi.org/10.3390/app13127090