Figure 1.
Structure diagram of the ring spring–friction pendulum isolation bearing.
Figure 1.
Structure diagram of the ring spring–friction pendulum isolation bearing.
Figure 2.
Mass-spring-damper system.
Figure 2.
Mass-spring-damper system.
Figure 3.
Transmissibility of harmonic oscillation.
Figure 3.
Transmissibility of harmonic oscillation.
Figure 4.
Ring spring model: (a) ring spring size diagram and (b) three-dimensional diagram of the ring spring.
Figure 4.
Ring spring model: (a) ring spring size diagram and (b) three-dimensional diagram of the ring spring.
Figure 5.
Diagram of the ring spring mesh: (a) outer ring and (b) inner ring.
Figure 5.
Diagram of the ring spring mesh: (a) outer ring and (b) inner ring.
Figure 6.
Comparison of load–displacement curves between theoretical calculations and finite element simulations: (a) normal working condition (480 mm) and (b) ultimate limit condition.
Figure 6.
Comparison of load–displacement curves between theoretical calculations and finite element simulations: (a) normal working condition (480 mm) and (b) ultimate limit condition.
Figure 7.
Diagram of the friction pendulum bearing: (a) bearing deformation diagram and (b) force analysis of the friction pendulum bearing.
Figure 7.
Diagram of the friction pendulum bearing: (a) bearing deformation diagram and (b) force analysis of the friction pendulum bearing.
Figure 8.
Friction pendulum model: (a) friction pendulum size diagram and (b) three-dimensional diagram of the friction pendulum.
Figure 8.
Friction pendulum model: (a) friction pendulum size diagram and (b) three-dimensional diagram of the friction pendulum.
Figure 9.
Finite element simulation and formula calculation hysteresis curve comparison diagrams. (a) Model a. (b) Model b. (c) Model c. (d) Model d.
Figure 9.
Finite element simulation and formula calculation hysteresis curve comparison diagrams. (a) Model a. (b) Model b. (c) Model c. (d) Model d.
Figure 10.
Dakai station model: (a) section size diagram of the structure and (b) finite element model of the structure.
Figure 10.
Dakai station model: (a) section size diagram of the structure and (b) finite element model of the structure.
Figure 11.
Bearing arrangement diagram: (a) friction pendulum bearing arrangement, (b) ring spring bearing arrangement, and (c) ring spring–friction pendulum support arrangement.
Figure 11.
Bearing arrangement diagram: (a) friction pendulum bearing arrangement, (b) ring spring bearing arrangement, and (c) ring spring–friction pendulum support arrangement.
Figure 12.
The stress diagram of the underground station in an earthquake.
Figure 12.
The stress diagram of the underground station in an earthquake.
Figure 13.
Horizontal acceleration time history curve: (a) Kobe earthquake and (b) El Centro earthquake.
Figure 13.
Horizontal acceleration time history curve: (a) Kobe earthquake and (b) El Centro earthquake.
Figure 14.
Vertical acceleration time–history curve: (a) Kobe earthquake and (b) El Centro earthquake.
Figure 14.
Vertical acceleration time–history curve: (a) Kobe earthquake and (b) El Centro earthquake.
Figure 15.
Fourier spectrum of vertical acceleration: (a) Kobe earthquake and (b) El Centro earthquake.
Figure 15.
Fourier spectrum of vertical acceleration: (a) Kobe earthquake and (b) El Centro earthquake.
Figure 16.
Fourier spectrum of horizontal acceleration: (a) Kobe earthquake and (b) El Centro earthquake.
Figure 16.
Fourier spectrum of horizontal acceleration: (a) Kobe earthquake and (b) El Centro earthquake.
Figure 17.
Horizontal equivalent resonance force: (a) Kobe earthquake and (b) El Centro earthquake.
Figure 17.
Horizontal equivalent resonance force: (a) Kobe earthquake and (b) El Centro earthquake.
Figure 18.
Key cross-section diagram.
Figure 18.
Key cross-section diagram.
Figure 19.
Comparison between simulation results and the actual seismic damage to the subway station: (a) damage diagram of the subway station in the Kobe earthquake, (b) damage diagram of the subway station in the El Centro earthquake, (c) photos of the destruction of the Dakai station, (d) the most damaged location, and (e) damage conditions of the Dakai subway station in the longitudinal direction.
Figure 20.
Comparison between simulation results and the actual seismic damage to the subway station: (a) condition 3, (b) condition 4, (c) condition 5, (d) condition 6, (e) condition 7, and (f) condition 8.
Figure 20.
Comparison between simulation results and the actual seismic damage to the subway station: (a) condition 3, (b) condition 4, (c) condition 5, (d) condition 6, (e) condition 7, and (f) condition 8.
Figure 21.
Horizontal relative displacement of the structure in the (a) El Centro earthquake and (b) Kobe earthquake.
Figure 21.
Horizontal relative displacement of the structure in the (a) El Centro earthquake and (b) Kobe earthquake.
Figure 22.
Comparison of the shear allocation percentage at the upper mid-pillar.
Figure 22.
Comparison of the shear allocation percentage at the upper mid-pillar.
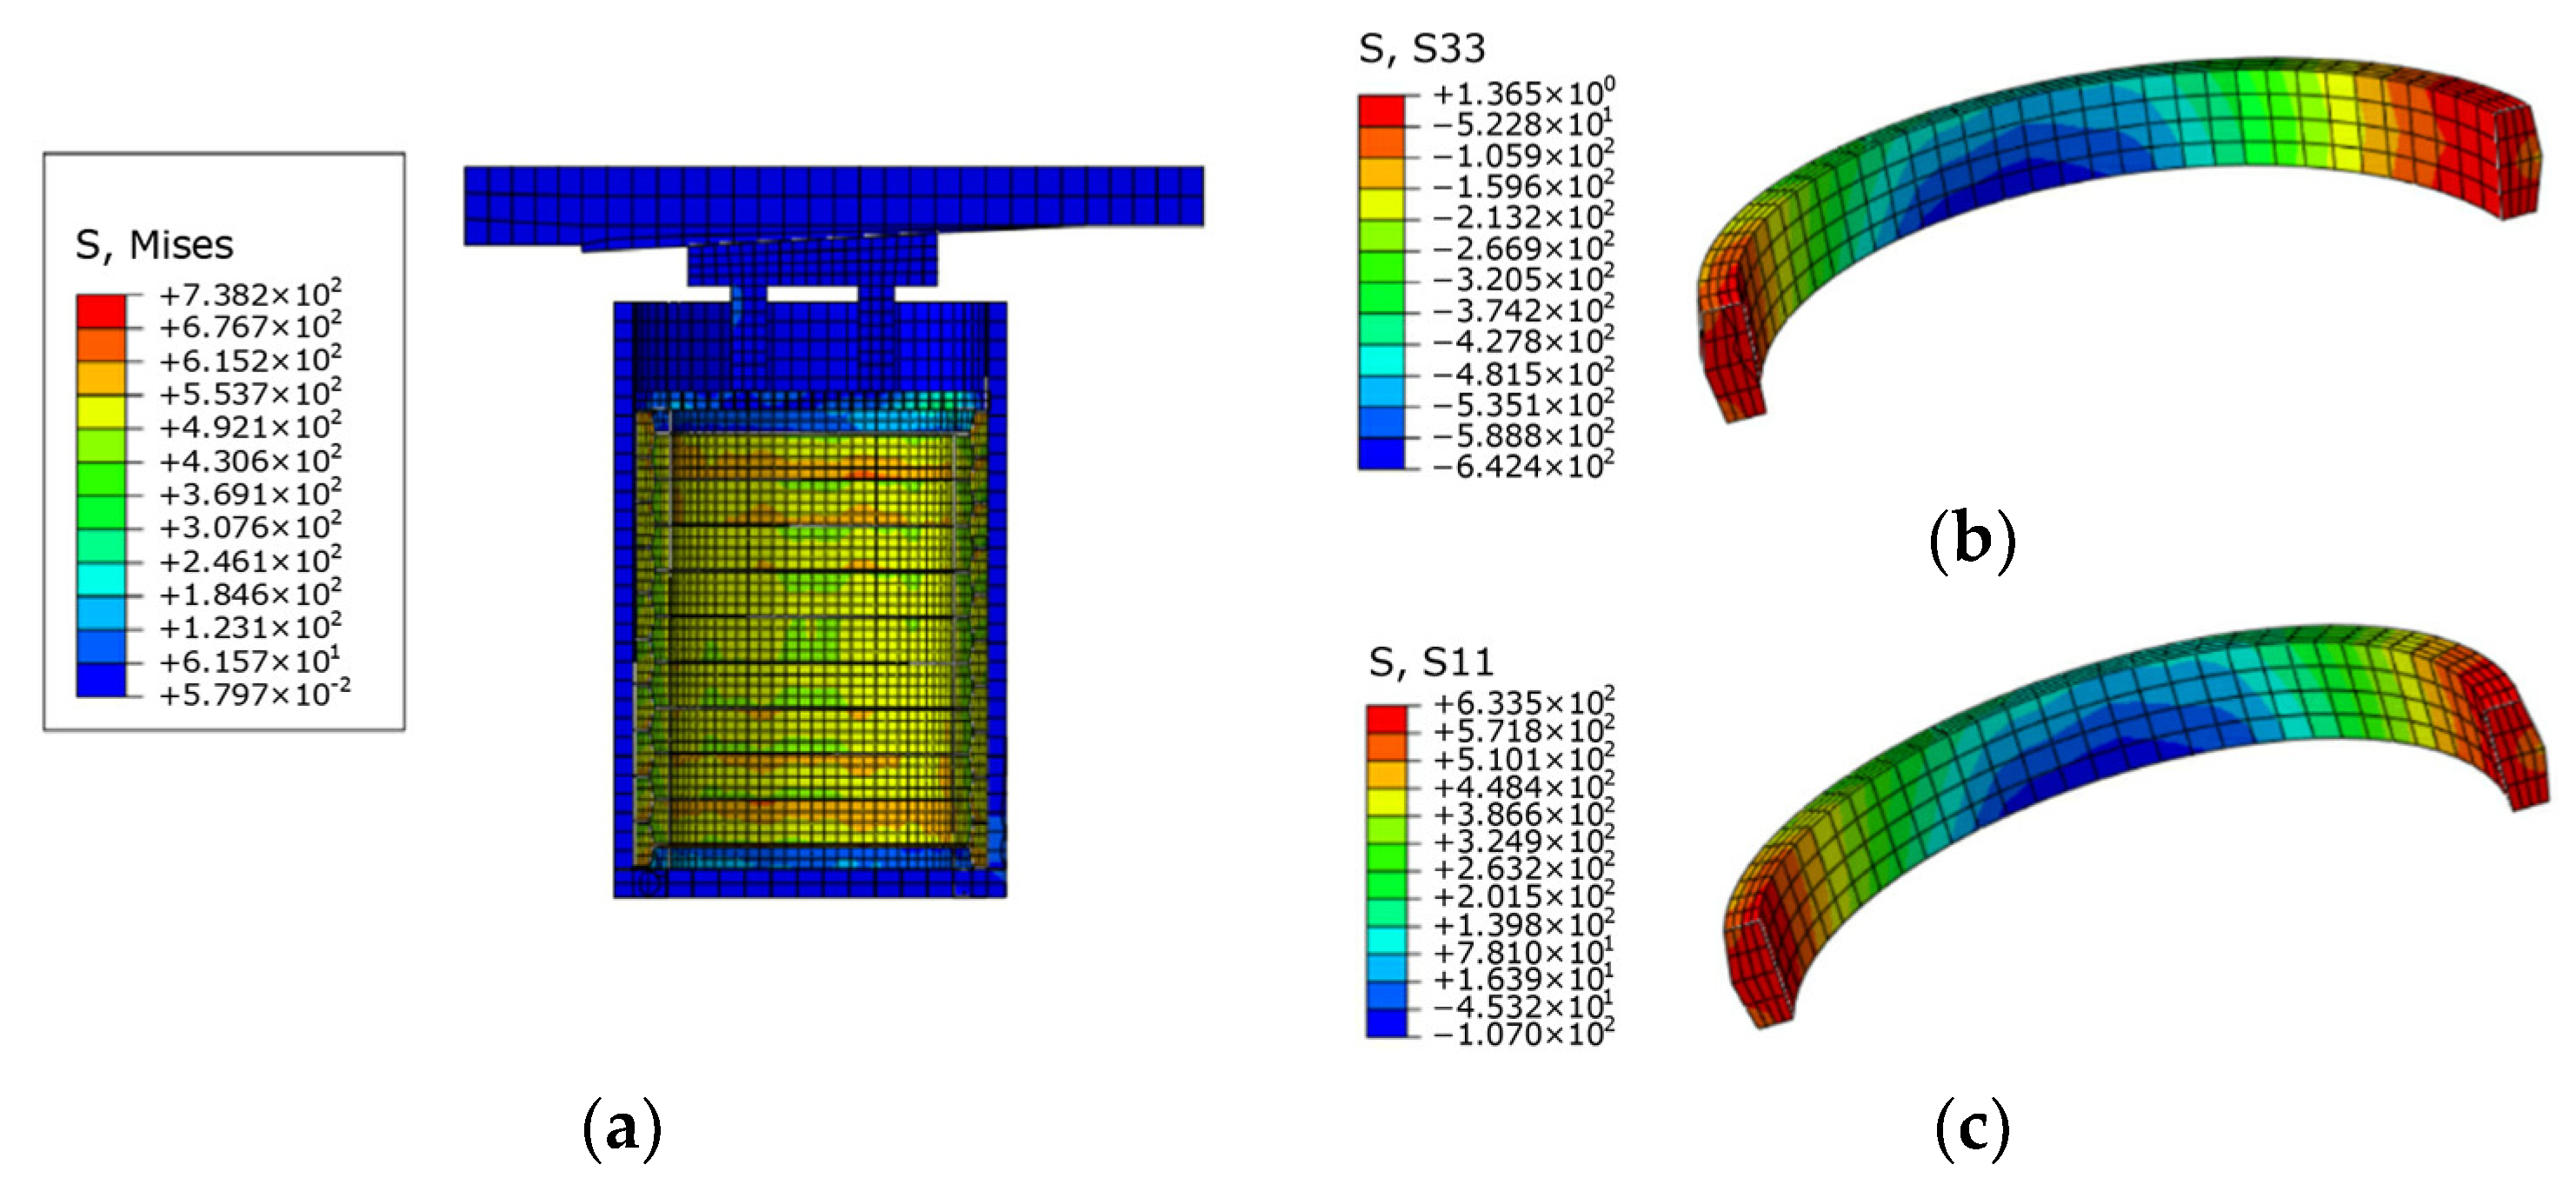
Figure 23.
Stress cloud diagram of the ring spring–friction pendulum bearing during the El Centro earthquake: (a) bearing section, (b) stress of the inner ring, and (c) stress of the outer ring.
Figure 23.
Stress cloud diagram of the ring spring–friction pendulum bearing during the El Centro earthquake: (a) bearing section, (b) stress of the inner ring, and (c) stress of the outer ring.
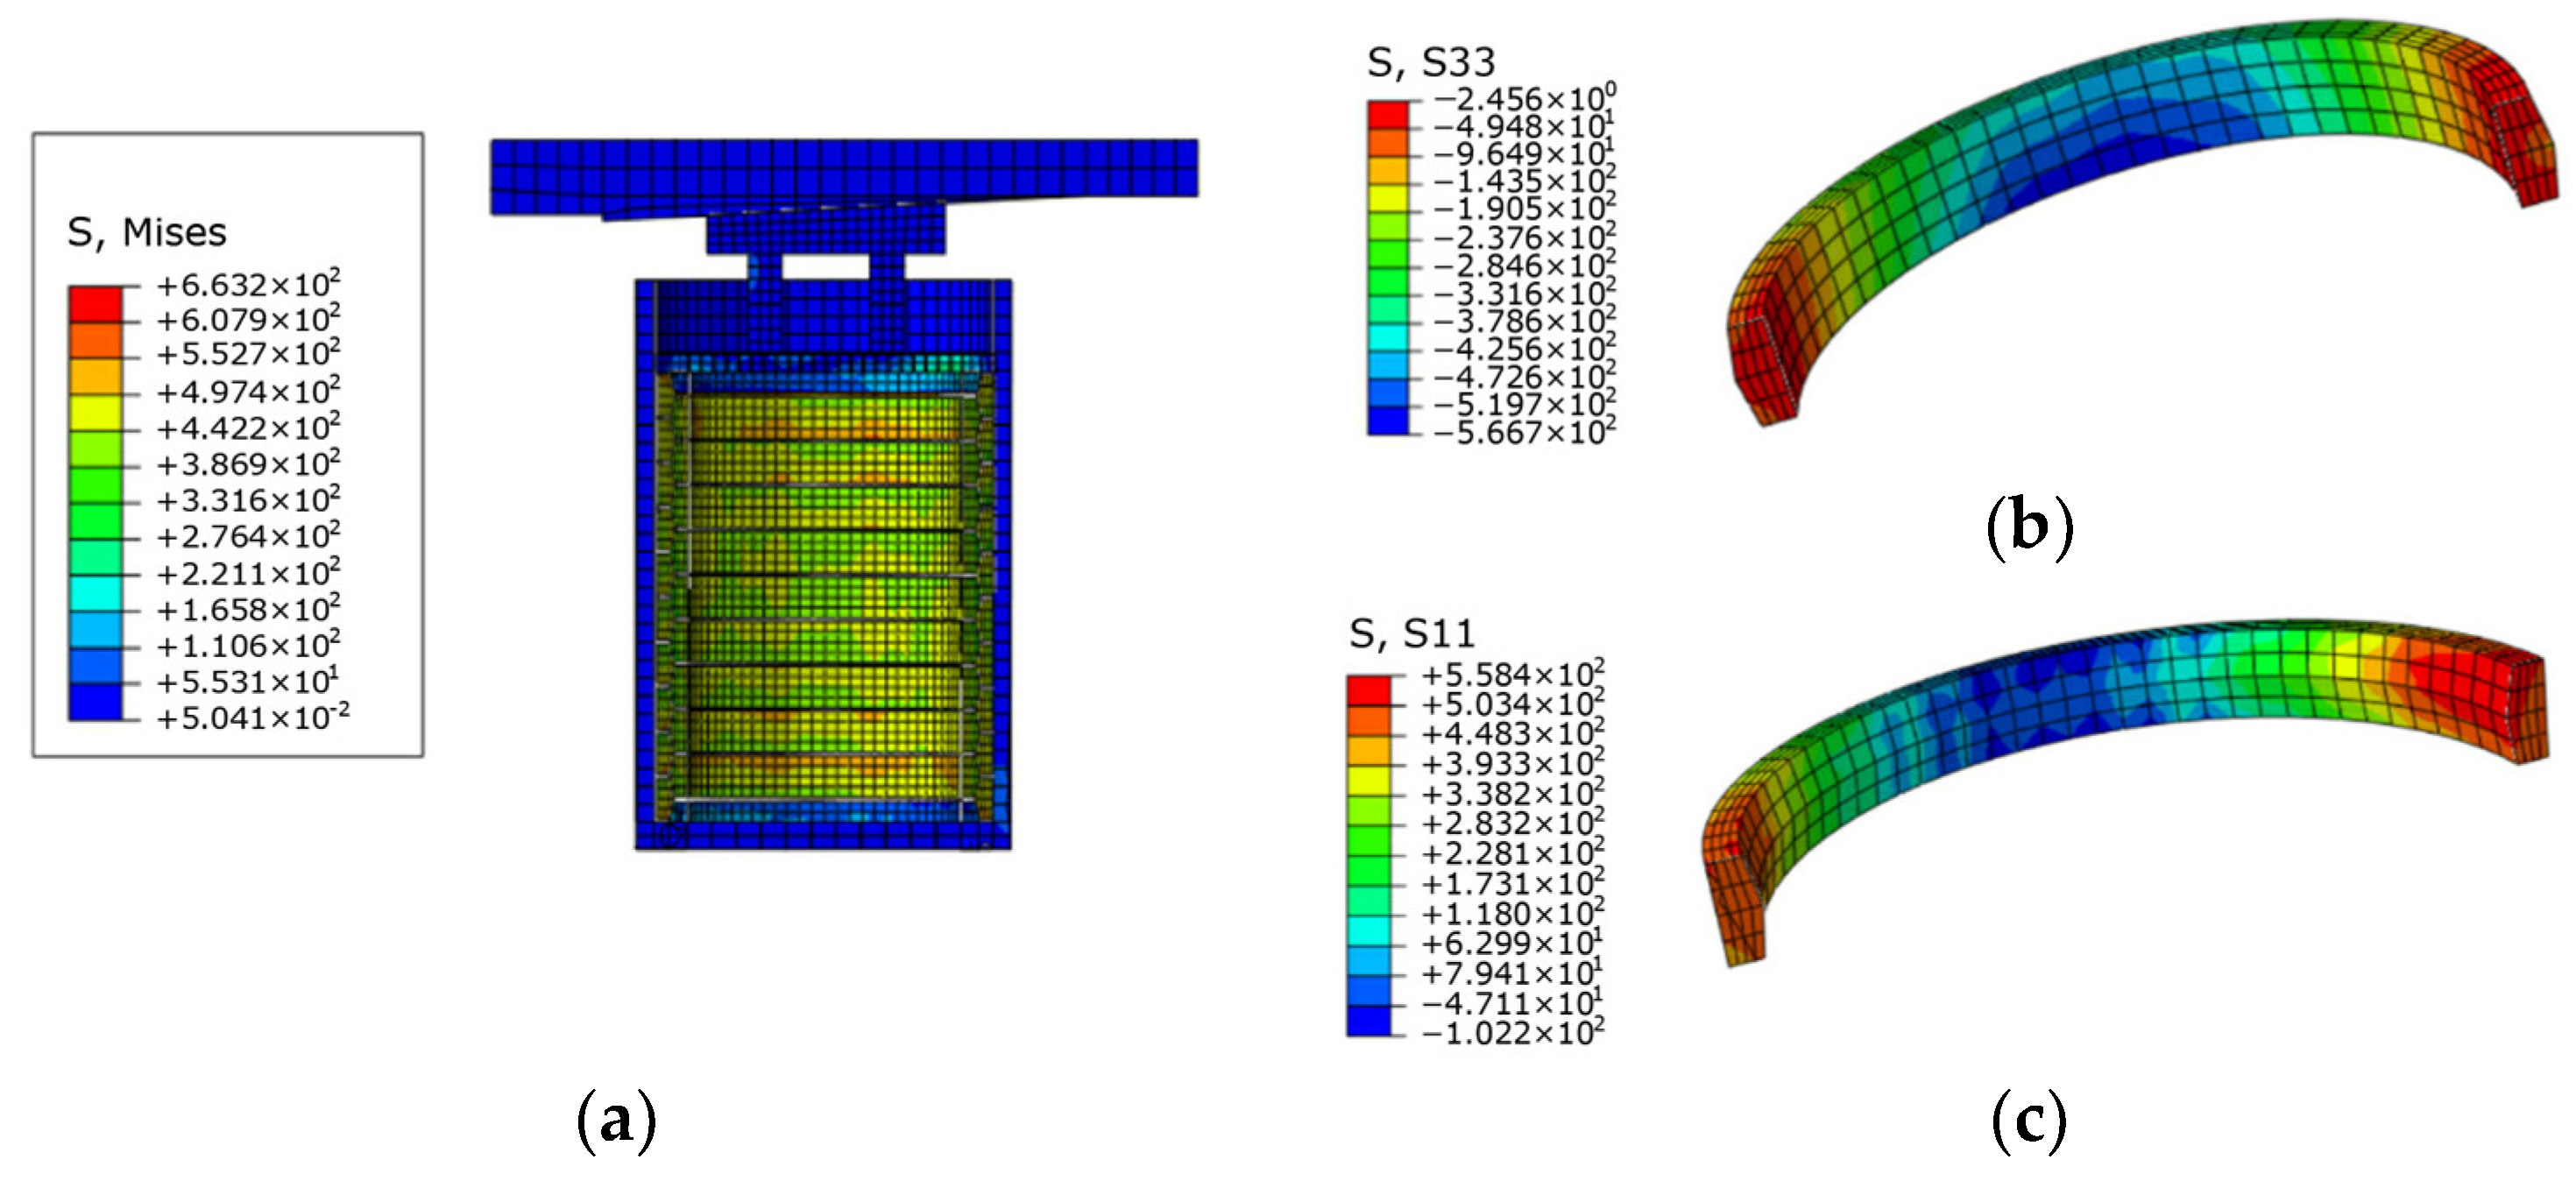
Figure 24.
Stress cloud diagram of the ring spring–friction pendulum bearing during the Kobe earthquake: (a) bearing section, (b) stress of the inner ring, and (c) stress of the outer ring.
Figure 24.
Stress cloud diagram of the ring spring–friction pendulum bearing during the Kobe earthquake: (a) bearing section, (b) stress of the inner ring, and (c) stress of the outer ring.
Table 1.
Model parameters.
Table 1.
Model parameters.
| Model | θ | μ | Kv (kN/mm) | W (kN) | D (mm) |
|---|
| a | 3° | 0.04 | 13.2 | 11,200 | 500 |
| b | 6° | 0.04 | 13.2 | 11,200 | 500 |
| c | 6° | 0.02 | 13.2 | 11,200 | 500 |
| d | 6° | 0.02 | 6.6 | 11,200 | 500 |
Table 2.
Concrete and rebar material parameters.
Table 2.
Concrete and rebar material parameters.
| Material | Elastic Modulus (GPa) | Density
(kg/m3) | Poisson’s Ratio | Peak Compressive Strength (MPa) | Peak Tensile Strength (MPa) |
|---|
| Concrete for the roof | 30 | 12,750 | 0.2 | 29.6 | 2.95 |
| Wall and baseplate concrete | 30 | 2500 | 0.2 | 29.6 | 2.95 |
| Mid-pillars | 35 | 2500 | 0.2 | 38.5 | 3.22 |
| Rebar | 200 | 7800 | 0.33 | 240 | 240 |
Table 3.
Simulated loading conditions.
Table 3.
Simulated loading conditions.
| Conditions | Arrangement of Supports | Earthquake |
|---|
| 1 | Original structure | El Centro |
| 2 | Original structure | Kobe |
| 3 | Friction pendulum bearing | El Centro |
| 4 | Friction pendulum bearing | Kobe |
| 5 | Ring spring bearing | El Centro |
| 6 | Ring spring bearing | Kobe |
| 7 | Ring spring–friction pendulum bearing | El Centro |
| 8 | Ring spring–friction pendulum bearing | Kobe |
Table 4.
Axial force at key parts of the structure in different conditions.
Table 4.
Axial force at key parts of the structure in different conditions.
| Key Cross Section | Condition 1 | Condition 2 | Condition 3 | Condition 4 | Condition 5 | Condition 6 | Condition 7 | Condition 8 |
|---|
| A (106 N) | 7.20 | 7.23 | 2.52 | 2.73 | 36.2 | 37.9 | 12 | 10 |
| B (106 N) | 24 | 23.5 | 5.90 | 8.45 | 31.2 | 32.4 | 7.87 | 8.50 |
| C (106 N) | 6.14 | 6.14 | 3.69 | 4.41 | 3.19 | 3.33 | 2.34 | 2.80 |
| D (106 N) | 6.16 | 6.16 | 3.71 | 4.44 | 3.26 | 3.36 | 2.41 | 2.85 |
Table 5.
Axial force change rate of the key section in different conditions.
Table 5.
Axial force change rate of the key section in different conditions.
| Key Cross Section | Condition 3 | Condition 4 | Condition 5 | Condition 6 | Condition 7 | Condition 8 |
|---|
| A | −65.00% | −62.24% | 402.78% | 424.20% | 66.67% | 38.31% |
| B | −75.42% | −64.04% | 30.00% | 37.87% | −67.21% | −63.83% |
| C | −39.90% | −28.18% | −48.05% | −45.77% | −61.89% | −54.40% |
| D | −39.77% | −27.92% | −47.08% | −45.45% | −60.88% | −53.73% |
Table 6.
Shear force at key parts of the structure in different conditions.
Table 6.
Shear force at key parts of the structure in different conditions.
| Key Cross Section | Condition 1 | Condition 2 | Condition 3 | Condition 4 | Condition 5 | Condition 6 | Condition 7 | Condition 8 |
|---|
| A (106 N) | 1.63 | 1.67 | 1.26 | 1.46 | 8.30 | 2.77 | 2.63 | 2.63 |
| B (106 N) | 2.60 | 2.51 | 0.68 | 0.91 | 6.49 | 2.17 | 0.65 | 0.72 |
| C (106 N) | 0.28 | 0.23 | 0.025 | 0.067 | 0.22 | 0.08 | 0.029 | 0.027 |
| D (106 N) | 0.25 | 0.20 | 0.027 | 0.06 | 0.21 | 0.08 | 0.027 | 0.027 |
Table 7.
Shear change rate of the key section of the structure in different working conditions.
Table 7.
Shear change rate of the key section of the structure in different working conditions.
| Key Cross Section | Condition 3 | Condition 4 | Condition 5 | Condition 6 | Condition 7 | Condition 8 |
|---|
| A | −22.34% | −12.38% | 70.08% | 75.65% | 61.89% | 57.68% |
| B | −73.85% | −63.79% | −16.79% | −13.79% | −75.13% | −71.49% |
| C | −90.84% | −70.87% | −73.49% | −65.22% | −89.40% | −88.12% |
| D | −89.61% | −70.04% | −72.73% | −62.60% | −89.61% | −86.67% |


