Abstract
The task of relation classification is an important pre-task in natural language processing tasks. Relation classification can provide a high-quality corpus for tasks such as machine translation, human–computer dialogue, and structured text generation. In the process of the digitalization of standards, identifying the entity relationship in the standard text is an important prerequisite for the formation of subsequent standard knowledge. Only by accurately labeling the relationship between entities can there be higher efficiency and accuracy in the subsequent formation of knowledge bases and knowledge maps. This study proposes a standard text relational classification model based on cascaded word vector attention and feature splicing. The model was compared and ablated on our labeled standard text Chinese dataset. At the same time, in order to prove the performance of the model, the above experiments were carried out on two general English datasets, SemEval-2010 Task 8 and KBP37. On standard text datasets and general datasets, the model proposed in this study achieved excellent results.
1. Introduction
The task of relation classification is an important upstream task of natural language processing tasks such as machine translation [1,2], human–computer dialogue [3], and structured text generation [4]. Whether the relationship classification between entities is accurate has an important impact on the above natural language processing tasks. A key task in the digitalization of standards process is the generation of structured data. This task requires providing the relationship between two entities in a sentence. If this relationship relies on manual classification, not only the cost is extremely high, but also the time period is long, which cannot meet the actual needs. Therefore, it is necessary to automatically classify the entity relationship in the text through the deep learning algorithm [4].
The essence of the relationship classification task is to extract the relationship between two entities from an unstructured text. In Table 1, a sentence is taken as an example from the standard text dataset used in this study and two general datasets. Among them, we used <e1>, </e1>, <e2>, </e2> to mark the two entities, respectively. Taking the sentence in the first standard text as an example, the goal of relation classification is to identify Entity 1 “雪峰蜜桔’ and Entity 2 “横径60–70毫米” from the sentence “雪峰蜜桔果实横径60–70毫米” and extract the relationship “外形” between the two.

Table 1.
Data samples in three datasets.
In the early days of relation classification tasks, researchers proposed a relation classification model based on Rule [5,6]. Although this method replaces manual classification, the classification efficiency can be improved. However, there are problems such as serious feature loss and low classification accuracy. In order to solve the above shortcomings, later researchers proposed relational classification models based on machine learning [7]. Such methods have improved classification feature extraction and classification accuracy (Accuracy refers to whether the model can correctly identify and label the types of relationships between entities in relationship classification. The larger the proportion of correct classification, the higher the accuracy rate is.). However, it still performs poorly on large-scale and complex entity–relationship datasets. On this basis, the researchers proposed a deep-learning-based relational classification network. Convolutional-neural-network-based, recurrent-neural-network-based, and attention-based relational classification models were included. The relationship classification model based on deep learning [8,9] can establish logical connections between the front and back of the text and can consider contextual information. Through the learning and analysis of contextual information, the relationship between two entities is judged and classified. The relationship classification network based on deep learning further improves the quality of model extraction features and, at the same time, improves the accuracy of relationship classification.
In practical application scenarios, the relationship classification model based on cascaded word vector attention and feature splicing can be applied to the writing process of standard documents. Traditional standard documents face the problem of a long cycle from project approval, drafting, to the release of standard documents. The standard text classification model can improve drafting efficiency and shorten drafting time in the process of standard drafting. Using deep learning algorithms to analyze and classify texts, existing standard texts can be used as training materials. This enables the model to tell where a certain type of data should appear in the drafting process. The deep learning model assists drafters in drafting standard documents, which can greatly improve the efficiency of standard drafting.
The standard text has a relatively standardized expression form, and the conventional relational classification model still has the following problems when dealing with the standard text. Standards are the technical support for economic activities and social development. Standards are standardized constraints on products, technologies, processes, and systems. The representation form of the standard text is also constrained by relevant standards, so the format of the standard text is relatively fixed. However, the text in the standard is a binding text, so there will be various terms, indicators, attributes, etc., that do not often appear in ordinary texts. At the same time, there are a large number of concept description sentences, process specification sentences, and index quantification sentences. Most of the general texts are natural language, following the rules of daily communication. Therefore, a relationship classification model that performs well on general text may not necessarily be applicable in standard text datasets. As a result, some models have unsatisfactory performance in relation recognition on standard text datasets. The main problem is that, in the process of obtaining classification features, the weight assigned to each element in the word vector is the same, which means that the importance of each element for the relationship classification task is consistent. However, the reality is that most existing relation classification models use the features corresponding to entities to classify relations, ignoring the impact of sentence context features on the performance of relation classification models. To address this issue, the main contributions of this study can be summarized as follows:
(1) Propose a cascaded word vector attention: By calculating the weight of each element in the word vector, the positive and negative features can be distinguished. The goal was to enhance the positive impact of positive features on model performance and suppress the negative impact of negative features on model performance. (2) Propose a splicing module of entity features and sentence global features: Feature fusion was achieved through the splicing of entity features and sentence features, and the role of each part of the features in improving the performance of the model was fully utilized. (3) A standard text dataset is proposed: Extract the sentences in the standardized file, and perform data cleaning according to certain rules; select sentences containing two entities, and mark the relationship between entities to form a standard text dataset. (4) Based on the above models and datasets, the comparative experiments and ablation experiments showed that the model proposed in this study had good performance on standard text datasets. It can also achieve good results on the general datasets SemEval-2010 Task 8 and KBP37.
The remainder of this paper is structured as follows. The Section 2 presents related work on relational classification models. The Section 3 is a detailed description of the relation classification model proposed in this paper based on cascaded word vector attention and feature splicing. The Section 4 introduces the specific situation of the dataset and the experimental results and data analysis of multiple groups. The Section 5 summarizes and looks toward the future of the work of this research.
2. Related Work
2.1. Standard-Text-Digitization-Related Work
Liu et al. [10] researched and analyzed the status quo and trends of standard digital development. A generic template for use cases was teased out by Liu et al. [11] for the collection, collation, and validation methods. It also expounded on the role and inspiration of use case research from the technical basis and the means and motivation of standard digital transformation. Liu et al. [12] proposed a domain standard digital modeling method based on knowledge graphs. This method solves the problems of overlapping standard knowledge content and rough knowledge granularity. Another research hotspot in the digitalization of standards is the establishment of a standard ontology. Gruninger et al. [13] built a top-level ontology of standards. The top-level ontology was composed of a set of general ontologies, each of which axiomatizes a specific set of general concepts. Kwon, S et al. [14] extracted and stored standard data in the form of a resource description framework and linked unstructured data in medical field standards through an ontology. Ning, HS et al. [15] processed data generated in IoT devices. A semantic sensor-based ontology that was consistent with current standards was proposed.
2.2. Relation Classification Model Based on Convolutional Neural Network
Learning the context information near entities through a CNN is the key to the relationship classification task based on the CNN-based relationship classification network. Based on this, many researchers have proposed multiple CNN-based relation classification models. Ma et al. [16] proposed the PCCNN. The network addresses the inability to recognize unknown relation categories through an innovative probabilistic confidence mechanism. Han et al. [17] proposed a structure called the FCN. This structure can extract the features of different frequencies only and then fuse the relationship features of different frequencies to improve the quality of the feature vector and improve the performance of the relationship classification network. Nguyen et al. [18] proposed a CNN-based model for relational classification with multi-scale windows. Text features were extracted through convolution kernels of different scales to learn contextual information in different ranges. Compared with the traditional single-scale convolution kernel relational classification model, the performance was significantly improved. Pratap et al. [19] proposed a self-learning module that can combine the features extracted by the neural network with domain expert knowledge to improve the performance of relational classification networks.
2.3. Relation Classification Model Based on Recurrent Neural Network
The relationship classification model based on the RNN [20] can learn long-distance word sequences and overcomes the shortcomings of CNN-based models that only focus on local information. Bidirectional RNN is an early neural network model applied to relational classification tasks. Zhang et al. [21] used bidirectional RNN to extract the features in sentences and used the extracted semantic information to perform relationship classification tasks. There are many problems faced when using bidirectional RNNs to perform relation classification tasks. Issues include vanishing and exploding gradients, poor-quality semantic features, etc. Zhang et al. [22] used BiLSTM in relational classification tasks in order to solve the problem of the exponential rise or decay of gradients. At the same time, elements such as POS tags and named entity information were added to the relationship classification model. Several combined relational classification models followed, combining RNNs with attention mechanisms. For example, Att-BiLSTM [23] used the combination of BiLSTM and attention to improve the performance of the relationship classification model. Models such as Bi-RNN + Bi-LSTM [24], BiGRU MCNN Att [25], and Bi-LSTM + LET [26] combine neural networks such as the RNN, GRU, BiLSTM, and CNN for relational classification tasks and have achieved good performance.
2.4. Attention-Based Relational Classification Model
The attention mechanism can learn and label according to the correlation between context words in the input text. The attention mechanism can identify the importance of each word or each feature through the attention mechanism and assign the corresponding weights to each word or feature according to the importance. Zhou et al. [23] combined attention mechanism and BiLSTM. By calculating the contribution of each word in the relation classification task, different weights were assigned to each word by evaluating the degree of contribution. Jin et al. [27] also combined the attention mechanism with BiLSTM. After acquiring the text features, feature filtering was performed through the attention mechanism to enhance the usability of the features. Liu et al. [28] added a convolutional layer to the attention mechanism and BiLSTM. By learning the local features and global semantics of the input text, it helps the model understand the relationship between two entities and effectively improve the performance of the model. Liu Y et al. [29] first proposed channel attention in the field of computer vision and calculated and assigned weights to each channel to improve model performance. Hu J et al. [30] also used channel attention to process the features in the model. SENet enhances or suppresses different channels through different tasks by modeling the importance of each feature channel. Woo S et al. [31] proposed a cascade attention CBAM; the difference is that CBAM is a cascade of channel attention and spatial attention, which is mainly used in the field of computer vision. The attention weights are sequentially inferred by cascading along the two dimensions of channel and space and then multiplied by the original feature map to adaptively adjust the features. Since the space cannot be abstracted in the relation classification task, two-channel attention was used for cascading.
2.5. Relational Classification Model Based on BERT Pre-Trained Model
The emergence of the pre-trained model BERT [32] has greatly promoted the development and progress of various tasks in natural language processing. Fine-tuning models for solving various tasks based on BERT extraction features are also emerging. One of them is a relational classification model based on BERT feature fine-tuning. Wu et al. [32] applied the pre-trained model BERT to the relational classification model for the first time. The model made it suitable for the relational classification task by fine-tuning the BERT output features. Soares et al. [33] conducted a related study on the impact of the difference in the input and output patterns of the pre-training model BERT on the relationship classification results.
2.6. Relational Classification Models Applied to Various Domains
In the field of standard texts, there is no research on relational classification of standard texts. However, in the fields of medicine and energy, there is some research on the relational classification of domain texts. Geng et al. [34] proposed a fused-feature-based CNN network for optimizing energy forecasting models with the aim of improving energy utilization in the petrochemical industry. Li et al. [35] proposed an AFKF model to overcome noisy text in electronic medical records and improve the accuracy of medical relationship classification.
3. Method
3.1. Overview
In this section, we propose a network for relation classification based on cascaded word vector attention. It is mainly divided into four levels. The first part is the embedding layer, which mainly converts text data into word vectors that the model can process. The second layer is the entity feature extraction layer, which extracts the feature vectors corresponding to the two entities from the output of the hidden layer of the BERT pre-training model to prepare for subsequent feature splicing. The third layer is the cascaded word vector attention layer, which assigns different weights to different elements in the word vector according to their positive and negative effects on the relationship classification task through the word vector attention. The fourth layer is the feature splicing and relationship classification layer. By splicing entity features and sentence features, the context information and entity information are fully integrated to improve the performance of the relationship classification network. The overall framework of the model is shown in Figure 1.
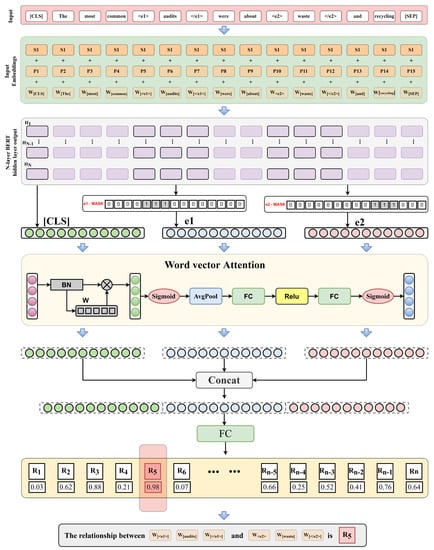
Figure 1.
General architecture diagram of relational classification network based on concatenated word vector attention and feature concatenation.
3.2. Embedding Layer
Word embedding is divided into three parts, namely Token Embeddings, Segment Embeddings, and Position Embeddings. The text needs to be processed before passing through Token Embeddings, and [CLS] and [SEP] will be added at the beginning and end of the sentence, respectively. The function of these two special symbols is to mark the start position and end position of the sentence and provide marks for subsequent Segment Embeddings, etc. Token Embeddings are vector representations that transform text into specific dimensions. In BERTbase, a word is mapped to a 768-dimensional word vector. In BERTlarge, a word is mapped to a 1024-dimensional word vector. Segment Embeddings distinguish two or more sentences in a piece of data. Position Embeddings mark each position of the input sequence. The purpose is to facilitate the BERT model to identify the order of the input sequence and better extract contextual features. The specific embedding process is shown in Figure 2.
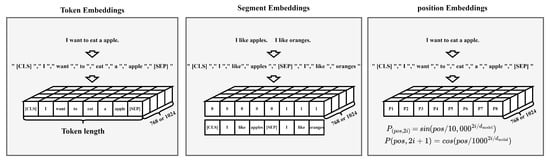
Figure 2.
Word embedding process diagram.
3.3. Entity Feature Extraction
The word embedding is sent to the pre-training model BERT for feature extraction. Multiple hidden layer outputs are produced after BERT training. The version of BERT used in this study was BERTlarge, and the number of hidden layer outputs of this version is 24. Deep features contain richer semantic information and inter-word associations. Therefore, the sum of the output of the last two hidden layers was used as the input feature of the subsequent relational classification model. The output of the last two hidden layers and the input features of the relational classification model are denoted as H, H, and H, respectively, which can be expressed in mathematical form as Equation (1).
In the relational classification network, the features of the entire sentence and entity features need to be spliced to complete the relational classification task. Therefore, we need to extract entity features separately through a certain entity feature extraction mechanism. In this study, the preprocessed text data were used, as shown in Table 1. There are special symbols marking the position of the entities before and after the two entities. During data loading, mask vectors corresponding to Entity 1 and Entity 2 are, respectively, generated by reading special symbols. The mask vector is multiplied by the input feature vector to obtain the feature vectors corresponding to the two entities. The mask generation process and entity feature extraction process are shown in Figure 3.
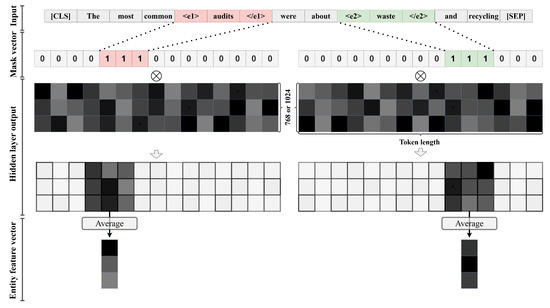
Figure 3.
The word vector extraction process corresponding to the entity.
Through the recognition of special tokens in the text, the mask vector elements outside the special tokens are marked as 0, and the mask vector elements corresponding to entity tokens are marked as 1. This process can be expressed in mathematical form as Equations (2) and (3).
where [] is the hidden layer output and n is 768 or 1024. and are the mask matrices corresponding to Entity 1 and Entity 2 respectively. [] and [] are the extracted feature directions corresponding to Entity 1 and Entity 2, respectively, and a, b, c, and d are the starting and ending positions of Entity 1 and Entity 2, respectively. Since an entity may correspond to a word, no averaging is required in this case. However, usually, an entity may consist of multiple words, in which case it is necessary to average the extracted entity features. The average operation is to sum the multiple eigenvectors corresponding to the entity and then divide the sum vector by the number of eigenvectors. This process can be expressed as Equations (4) and (5) in mathematical form.
Among them, and are the feature vectors corresponding to the two entities obtained after feature extraction and the averaging operation, respectively. a, b, c, and d are the starting and ending positions of Entity 1 and Entity 2, respectively.
3.4. Cascade Word Vector Attention
The attention mechanism has played a relatively important role in artificial intelligence tasks such as computer vision and natural language processing. The channel attention mechanism is a commonly used attention mechanism in computer vision. However, channel attention is rarely applied in the field of natural language processing. The word vector attention proposed in this study applies channel attention to the field of natural language processing. Each element in a word vector is mapped to a channel to form word vector attention. By cascading two word vector attentions to assign weights to each element in the word vector, more weight is given to the elements that have a positive effect on the relation classification task. Conversely, elements that have a negative effect on the relation classification task are assigned lower weights. The word vector after word vector attention will be more suitable for relationship classification tasks, which can better improve the precision and accuracy of relationship classification.
In the word vector attention, it is necessary to pass the features corresponding to the features of the two entities and the [CLS] tag containing the features of the entire sentence through a batch normalization (BN) layer. The purpose of this is to speed up the training of the model, prevent gradient explosion and gradient disappearance, and also, prevent the model from overfitting. This step can be expressed as Equations (6)–(8) in mathematical form.
Among them, , and are the output vectors of Entity 1, Entity 2, and the [CLS] tags after the BN operation, respectively. BN() represents the batch normalization operation. is a scaling factor for each element in the word vector. is the average of the elements in a word vector. is the variance of the elements in a word vector. and can be expressed in mathematical form as Equations (9) and (10).
The requirement for is a value greater than 0. The reason is that, when the variance of the elements in a word vector is 0, it can be guaranteed that the denominator in the BN operation is a value other than 0.
After the data of the BN layer are normalized, the weight calculation is performed on each element in the word vector. The calculation method used is to divide the current element by the sum of other elements. Operate element by element; use the obtained value as the weight of the modified word vector; concatenate it into a parameter matrix with the same dimension as the word vector. The parameter matrix can represent the importance of elements in each word vector in this word vector. After obtaining the weight of the word vector, multiply the weight by the word vector, and apply the weight of the word vector to each element in the word vector. Make the elements with significant and positive effects in the word vector play a more important role. On the contrary, the negative and insignificant elements in the word vector are given lower weights to suppress the negative effects. The above process can be expressed as Equations (11)–(13) in mathematical formulae.
Among them, , , and are the eigenvectors corresponding to Entity 1, Entity 2, and the [CLS] marks multiplied by the weights, respectively. , , and are the word vector weights corresponding to Entity 1, Entity 2, and the [CLS] tags, respectively. is the transposition of the vector, and its function is to realize that the elements in the word vector are multiplied by the corresponding weights.
After the word vector is multiplied by the weight of the first word vector, the elements in the word vector are distinguished to a certain extent. Next, the dimensions are compressed, and the feature vectors across spatial dimensions are compressed into weight vectors of the word vector dimension. Compress the global information into the word vector dimension, and then, extract and learn the features of the word vector dimension through average pooling. Automatically learn the global features by connecting two fully connected layers and the ReLU activation function. Selectively increase the weight of strongly related elements and decrease the weight of weakly related elements, so as to increase the role of positive features in the task and suppress the impact of negative features on performance. The feature compression process can be expressed mathematically as Equations (14)–(16).
Among them, B is the batch size. L is the number of words in a piece of data in the input sentence. is a compression function; the purpose is to compress the spatial feature value word vector dimension. , , and are the feature vectors of the compressed word vector dimension.
After the features are compressed, it is necessary to connect the fully connected layer and the activation function to train and learn the relationship between the two entities. First, the features are normalized through a sigmoid function. Parameter learning is then performed through two fully connected layers. The first fully connected layer is used to reduce the dimensionality and reduce the amount of parameters in model training. The second fully connected layer is used to restore the dimensionality, which restores the dimensionality of the feature vector to the number of elements in the word vector. There is an activation function between the two fully connected layers, and the activation function here is the ReLU function. The role of the activation function is to simplify the complex performance of the model and help the model train better. Finally, connect a Sigmoid function. The above process can be expressed as Equations (17)–(19) in mathematical formulae.
Among them, and are the learnable parameters in the two fully connected layers. is the ReLU activation function.
3.5. Feature Concatenation and Relation Classification
The output features of the cascaded word vector attention were used as the input features for the relation classification task. The cascaded word vector attention has three outputs, which are the feature vectors corresponding to Entity 1, Entity 2, and the [CLS] tokens. The purpose of the relationship classification task is to identify the relationship between two entities, so the feature vectors corresponding to the two entities are more important. Because the relationship classification network extracts the features between two entities, only by acquiring entity features can the relationship between two entities be learned and judged. At the same time, the characteristics of sentences in which two entities exist at the same time are also very important, because the sentence feature not only contains two entities, but also contains the context information between the two entities. With contextual features, the model can better learn the relationship between two entities, thus improving the performance of the relation classification network.
By concatenating Entity 1, Entity 2, and the [CLS] tokens, the total features of relation classification are formed. The total feature contains rich relational features between two entities and also contains contextual information in the [CLS] tags. The feature dimension is mapped to the number of relations through a fully connected layer. Using the output probability after the fully connected layer as the basis for relation classification, the above process can be expressed in mathematical form as Equation (20).
Among them, P is the probability of each relationship output by the fully connected layer. concat represents the splicing operation. , , and denote feature vectors that have undergone concatenated word vector attention, respectively.
4. Experiment
4.1. Datasets
In order to verify the performance of this model in relation classification in standard text, we self-labeled a standard text dataset. The characteristics of the standard texts are as follows. First, the format of standard texts is relatively standardized, and the format of sentences has certain constraints. The second is that, in the standard text, various indicators are relatively common, and most of them are displayed in digital form. The third is that there are many repetitive and similar description sentences in the standard text. When labeling the dataset, it is necessary to label entities and classify relationships according to the characteristics of the standard text. According to the characteristics of the standard text, some standards in Hunan’s iconic product field were selected for labeling, and a total of 500 pieces of data were labeled, including 400 pieces for the training set and 100 pieces for testing the machine. There are six relationships in total. At the same time, in order to verify the generalization ability of the model, this study added two public datasets, SemEval-2010 Task 8 [36] and KBP37 [17]. Comparison tests and ablation experiments were performed on the three models. Through experimental verification, it was proven that the relationship classification model based on cascaded word vector attention proposed in this study had good performance. The amount of data in the SemEval-2010 Task 8 dataset is 10,717, including 8000 training data and 2717 test data. In the SemEval-2010 Task 8 dataset, there are 10 relationship types including 9 relationships and no relationship. The amount of data in the KBP37 dataset is 21,046, including 15,917 training data, 3405 test data, and 1724 extended data. The KBP37 dataset contains 36 relationship categories and 37 relationship types such as no relationship. The quantitative information of each relation in the three datasets is shown in Figure 4, Figure 5 and Figure 6.
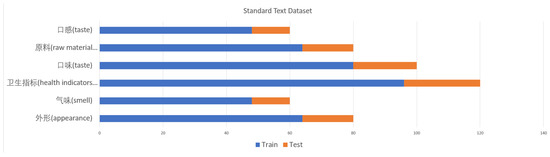
Figure 4.
Introduction to the relationship categories and quantities of standard text datasets.
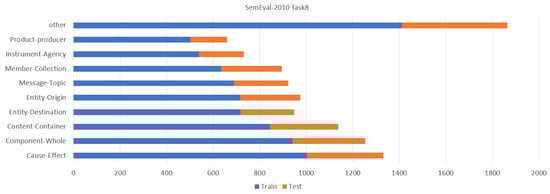
Figure 5.
SemEval-2010 Task 8 dataset relationship category and quantity introduction.
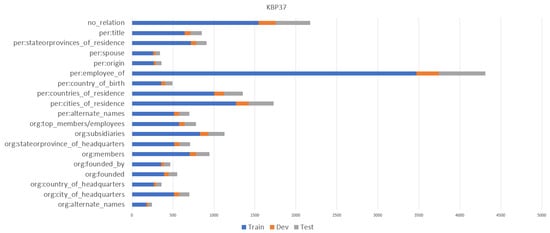
Figure 6.
KBP37 dataset relationship category and quantity introduction.
4.2. Experiment Setup
In the experiment, the F1-score used by most relational classification networks was used as the evaluation index of the model. The F1-score can evaluate the model more comprehensively by considering the two indicators of precision and recall. The calculation formulas of the precision rate (precision), recall rate (recall), and F1-score are shown in Equations (21)–(23).
where TP is the number of correct samples predicted to be correct, FP is the number of wrong samples that are predicted as correct samples, FN is the number of correct samples predicted as wrong samples, and TN is the number of wrong samples that are predicted to be wrong. Table 2 introduces the relevant environmental information and related parameter settings used in the experiment.
Table 2.
Relevant environmental information and related parameter settings used in the experiment.
4.3. Comparative Experiment Results and Analysis
Firstly, a comparative experiment was carried out on the dataset self-labeled in this study. It mainly compared the relationship classification models based on the CNN and the attention-based and two-way long-short-term memory networks. At the same time, two relationship classification networks based on the fine-tuning of the output features of the BERT pre-trained model were compared. These two models had the same feature extraction process as the relationship classification model proposed in this study, and both were fine-tuned based on the output features of the BERT model to perform the relationship classification task.
On the SemEval-2010 Task 8 dataset, the compared models mainly included the relationship classification network based on the long short-term memory network, the relationship classification model based on the convolutional neural network, and the relationship classification network based on the pre-trained model. In the KBP37 dataset, the compared models were mainly based on traditional neural network models, including the CNN and RNN. Attention-based correlation models were also compared with relation classification models proposed by recent work. The comparative test results on the three datasets are shown in Table 3.
Table 3.
Comparative test results on three datasets.
It can be seen from Table 3 that the model in this study achieved good results on the self-labeled standard text. The F1-score reached 78.8%, and compared with the CNN model, the F1-value increased by 8.79%. Compared with the CNN-based relation classification model CR-CNN, the F1-value increased by 6.8%. Compared with the BiLSTM-attention and multi-attention CNN based on bidirectional long-short-term memory network and attention mechanism, it increased by 3.7% and 2.7%, respectively. Compared with CRSAtt [37] and FA-RCNet [38] based on the BERT pre-trained model, it increased by 0.8% and 0.9%, respectively. The experimental results on the emEval-2010 Task 8 dataset showed that the relationship classification model proposed in this paper also achieved good results on the SemEval-2010 Task 8 dataset. The F1-value on the SemEval-2010 Task 8 dataset reached 89.75%. Compared with the existing model, it improved to a certain extent. Compared with the TRE, R-BERT, and BERTEM + MTB models, which were also based on the pre-trained model, the F1-value of the model in this paper increased by 2.56%, 0.5%, and 0.25%, respectively. The experimental results on the KBP37 dataset showed that the relationship classification model proposed in this paper achieved an F1-value of 70.28% on the KBP37 dataset, and compared with the recently proposed relationship classification models MALNet, LGCNN, and D-BERT, the F1-value increased by 8.88%, 7.08%, and 1.08%.
Among them, we integrated the data on the three datasets into an experimental result table. Model performance can be evaluated by comparing longitudinal data. For some models, because the corresponding model code or data processing format cannot be found, the experiment cannot be carried out, so some experimental data in the table are missing. However, in the table, each dataset compares the traditional machine learning model, the relationship classification model based on deep learning, and the relationship classification model based on the pre-trained model. Model performance can be evaluated from the perspective of each model category.
The above experimental results showed that the relationship classification model proposed in this study not only had a good effect on the standard text dataset that was self-labeled, but it also achieved relatively good results on the public datasets in two relational classification tasks. Compared with the existing relationship classification models, the relationship classification model proposed in this study achieved a higher F1-value. The above results showed that the relationship classification model proposed in this paper based on cascaded word vector attention and feature splicing had excellent performance on specific tasks. It was proven that the cascading attention operation was performed on the word vector first, and then, the entity features and the features of the whole sentence were spliced. The above operations can enrich the feature elements in the feature vector and can better improve the performance of the relational classification network.
4.4. Ablation Experiment Results and Analysis
Ablation experiments can be used to demonstrate the effectiveness of each module in the relation classification model proposed in this study. The experimental method was to add modules to the baseline model for the experiments. The ablation experiments were divided into three groups, namely the baseline model + cascade attention module (base + cascade attention), the baseline model + feature splicing module (base + concat), and the extreme model + cascade attention module + feature splicing module (base + cascade attention + concat). The experiments were carried out on the three datasets on the three groups of models, and the F1-value obtained by the model was used to evaluate the performance of the model. The experimental results are shown in Table 4.
Table 4.
Ablation experimental results on three datasets.
The data with higher accuracy in the same category has been highlighted in bold in the table.From the data in Table 4, it can be seen that the two modules proposed in this paper were effective. It can be seen from the data that there were three indicators for each dataset, namely precision (P), recall (R), and F1. Only the maximum value of the P index on the KBP37 dataset appeared for the “base + concat” model. The maximum values of all other indicators appeared for the “base + cascade attention + concat” model, which showed that the improvement effect of the two modules on the model was relatively obvious. The “base + concat” model and the “base + cascade attention” model added a cascade attention module and an attention module, respectively. By comparing the data for the “base” model, only the R indicator in the SemEval-2010 Task 8 dataset and the P indicator in the KBP37 dataset declined, and other indicators improved to varying degrees, which can explain that a single module is also effective at improving the effect of the model.
It can be seen from the data that the cascaded word vector attention module and feature splicing module on the three datasets both promoted the relationship classification task. The cascaded word vector attention module amplified the promotion effect of positive features on model performance multiple times by performing two feature enhancements in the word vector dimension and promoted the development of word vectors to be more suitable for relational classification tasks. The feature splicing module fused the context information at the sentence level and the word information at the entity level. The fusion feature not only contained the relationship features between the two entities, but also contained all the information of the sentence where the two entities were located. The model can learn features from two entities, and the model can also learn the relationship between two entities at the sentence level. The feature learning of the two aspects can promote the improvement of the classification effect of the model.
5. Conclusions
In this paper, we proposed a relational classification model based on concatenated word vector attention and feature stitching. The model operates by cascading attention in the word vector dimension. This amplified the effectiveness of positive features in relation classification tasks, while suppressing the impact of negative features on the performance of relation classification models. In the feature splicing module, entity features and sentence features were fused to obtain feature vectors with multiple scales. The model can be made to learn the relationship between two entities in many ways. The experiments proved that the above two modules can promote the performance of the relational classification model. At the same time, experiments on the self-labeled standard text dataset and two public datasets, SemEval-2010 Task 8 and KBP37, showed that this model was superior to the existing models. The F1-values reached 78.8%, 89.75%, and 70.28%, respectively.
In addition, we believe that the relationship classification model based on cascaded word vector attention and feature splicing still has certain problems. During entity extraction, mask matrix generation can only be performed based on the labels of two entities. This limits the model to the recognition of relationships between two entities. This model also has certain limitations when dealing with the task of relation classification when entities overlap. The current model can only classify the relationship between two entities. When the relationship between Entity 1 and Entity 2 is Relationship 1, and the relationship between Entity 1 and Entity 3 is Relationship 2, the model can only recognize one of the relationships, and the other relationship is missed. This is the limitation that mask matrices can only be generated from entity markers. On the one hand, when there are three or more entities in the text or there are multiple relationships between entities, the recognition accuracy of this model was low and cannot be compared with existing models. On the other hand, on other specific domain datasets, data reading and model adjustment need to be performed according to the characteristics of the domain data. The relationship classification model proposed in this paper may not be ideal for other domain datasets.
In future work, we will build on this model to explore the extraction and classification of entity relationships in texts with multiple entities and multiple relationships. At the same time, introducing external features is also a hot research direction in the field of natural language processing. We will also continue to study how to introduce external features into relation classification tasks to improve the performance of relation classification models. At the same time, we will focus our research on practical applications. Based on artificial intelligence models, we will design and develop relevant software and systems that can be applied.
Author Contributions
Software, resources, methodology, formal analysis, writing—original draft preparation, data curation: X.L.; methodology, validation, formal analysis, data curation, writing—original draft preparation: J.T.; software, visualization N.N.; project administration, funding acquisition J.L.; writing—review and editing J.H. All authors have read and agreed to the published version of the manuscript.
Funding
This research received support from the National Key R&D Program (2022YFF0608000), the President’s Fund Project of the China National Institute of Standardization (572022Y-9397), and the Science and Technology Project of the State Grid Corporation of China (5700-202241437A-2-0-ZN).
Institutional Review Board Statement
Not applicable.
Informed Consent Statement
Not applicable.
Data Availability Statement
Not applicable.
Conflicts of Interest
The authors declare no conflict of interest.
References
- Teng, F.; Wu, Q. Design and Implementation of the Information System of Retired Veteran Cadres Bureau Based on SpringBoot Framework. In Proceedings of the 2021 IEEE International Conference on Consumer Electronics and Computer Engineering (ICCECE), Guangzhou, China, 15 January 2021; pp. 87–92. [Google Scholar]
- Tian, T.; Song, C.; Ting, J.; Huang, H. A French-to-English Machine Translation Model Using Transformer Network. Procedia Comput. Sci. 2022, 199, 1438–1443. [Google Scholar] [CrossRef]
- Vázquez, A.; López Zorrilla, A.; Olaso, J.M.; Torres, M.I. Dialogue Management and Language Generation for a Robust Conversational Virtual Coach: Validation and User Study. Sensors 2023, 23, 1423. [Google Scholar] [CrossRef] [PubMed]
- Shi, K.; Cai, X.; Yang, L.; Zhao, J. Enriched Entity Representation of Knowledge Graph for Text Generation. Complex Intell. Syst. 2023, 9, 2019–2030. [Google Scholar] [CrossRef]
- Leroy, G.; Chen, H.; Martinez, J.D. A Shallow Parser Based on Closed-Class Words to Capture Relations in Biomedical Text. J. Biomed. Inform. 2003, 36, 145–158. [Google Scholar] [CrossRef] [PubMed]
- Kate, R.J.; Mooney, R.J. Using String-Kernels for Learning Semantic Parsers. In Proceedings of the 21st International Conference on Computational Linguistics and the 44th Annual Meeting of the ACL—ACL ’06, Sydney, Australia, 17–18 July 2006; Association for Computational Linguistics: Sydney, Australia, 2006; pp. 913–920. [Google Scholar]
- Zhang, H.; Feng, Y.; Hao, W.; Chen, G.; Jin, D. Relation Extraction with Deep Reinforcement Learning. IEICE Trans. Inf. Syst. 2017, 100, 1893–1902. [Google Scholar] [CrossRef]
- Zhang, M.; Zhang, Y.; Fu, G. End-to-End Neural Relation Extraction with Global Optimization. In Proceedings of the 2017 Conference on Empirical Methods in Natural Language Processing, Copenhagen, Denmark, 7–11 September 2017; Association for Computational Linguistics: Copenhagen, Denmark, 2017; pp. 1730–1740. [Google Scholar]
- Wang, S.; Zhang, Y.; Che, W.; Liu, T. Joint Extraction of Entities and Relations Based on a Novel Graph Scheme. In Proceedings of the Twenty-Seventh International Joint Conference on Artificial Intelligence, Stockholm, Sweden, 13–19 July 2018; International Joint Conferences on Artificial Intelligence Organization: Stockholm, Sweden, 2018; pp. 4461–4467. [Google Scholar]
- Liu, X.; Wang, Y.; Du, X.; Li, J.; Che, D. Development Status and Trend of Standards Digitization. Eng. Sci. 2021, 23, 147–154. [Google Scholar] [CrossRef]
- Liu, X.; Niu, N.; Wang, Y. Use Case Analysis and Inspiration of SMART Standard. Stand. Sci. 2022, 12, 63–67. [Google Scholar]
- Liu, W.; Yang, Y.; Tu, X.; Wang, W. ERSDMM: A Standard Digitalization Modeling Method for Emergency Response Based on Knowledge Graph. Sustainability 2022, 14, 14975. [Google Scholar] [CrossRef]
- Grüninger, M.; Ru, Y.; Thai, J. TUpper: A Top Level Ontology Within Standards. Appl. Ontol. 2022, 17, 143–165. [Google Scholar] [CrossRef]
- Kwon, S.; Yu, J.; Park, S.; Jun, J.-A.; Pyo, C.-S. Automatic Stroke Medical Ontology Augmentation with Standard Medical Terminology and Unstructured Textual Medical Knowledge. In Proceedings of the 2021 International Conference on Platform Technology and Service (PlatCon), Jeju, Republic of Korea, 23–25 August 2021; pp. 1–5. [Google Scholar]
- Ning, H.; Shi, F.; Zhu, T.; Li, Q.; Chen, L. A Novel Ontology Consistent with Acknowledged Standards in Smart Homes. Comput. Netw. 2019, 148, 101–107. [Google Scholar] [CrossRef]
- Ma, B.; Cai, W.; Han, Y.; Yu, G. A Novel Probability Confidence CNN Model and Its Application in Mechanical Fault Diagnosis. IEEE Trans. Instrum. Meas. 2021, 70, 3517111. [Google Scholar] [CrossRef]
- Han, Y.; Zhang, S.; Geng, Z. Multi-Frequency Decomposition with Fully Convolutional Neural Network for Time Series Classification. In Proceedings of the 2018 24th International Conference on Pattern Recognition (ICPR), Beijing, China, 22–24 August 2018; pp. 284–289. [Google Scholar]
- Nguyen, T.H.; Grishman, R. Relation Extraction: Perspective from Convolutional Neural Networks. In Proceedings of the 1st Workshop on Vector Space Modeling for Natural Language Processing, Denver, CO, USA, 5 June 2015; Association for Computational Linguistics: Denver, CO, USA, 2015; pp. 39–48. [Google Scholar]
- Pratap, B.; Shank, D.; Ositelu, O.; Galbraith, B. Talla at SemEval-2018 Task 7: Hybrid Loss Optimization for Relation Classification Using Convolutional Neural Networks. In Proceedings of the 12th International Workshop on Semantic Evaluation, New Orleans, LA, USA, 5–6 June 2018; Association for Computational Linguistics: New Orleans, LA, USA, 2018; pp. 863–867. [Google Scholar]
- Miwa, M.; Bansal, M. End-to-End Relation Extraction Using LSTMs on Sequences and Tree Structures. arXiv 2016, arXiv:1601.00770. [Google Scholar]
- Zhang, D.; Wang, D. Relation Classification via Recurrent Neural Network. arXiv 2015, arXiv:1508.01006. [Google Scholar]
- Zhang, S.; Zheng, D.; Hu, X.; Yang, M. Bidirectional Long Short-Term Memory Networks for Relation Classification. In Proceedings of the 29th Pacific Asia Conference on Language, Information and Computation, Shanghai, China, 30 October–1 November 2015. [Google Scholar]
- Zhou, P.; Shi, W.; Tian, J.; Qi, Z.; Li, B.; Hao, H.; Xu, B. Attention-Based Bidirectional Long Short-Term Memory Networks for Relation Classification. In Proceedings of the 54th Annual Meeting of the Association for Computational Linguistics, Berlin, Germany, 7–12 August 2016; Association for Computational Linguistics: Berlin, Germany, 2016; Volume 2, pp. 207–212. [Google Scholar]
- Xiao, M.; Liu, C. Semantic Relation Classification via Hierarchical Recurrent Neural Network with Attention. In Proceedings of the COLING 2016, the 26th International Conference on Computational Linguistics, Osaka, Japan, 11–16 December 2016. [Google Scholar]
- Zhang, C.; Cui, C.; Gao, S.; Nie, X.; Xu, W.; Yang, L.; Xi, X.; Yin, Y. Multi-Gram CNN-Based Self-Attention Model for Relation Classification. IEEE Access 2019, 7, 5343–5357. [Google Scholar] [CrossRef]
- Lee, J.; Seo, S.; Choi, Y.S. Semantic Relation Classification via Bidirectional LSTM Networks with Entity-Aware Attention Using Latent Entity Typing. Symmetry 2019, 11, 785. [Google Scholar] [CrossRef]
- Jin, Y.; Wu, D.; Guo, W. Attention-Based LSTM with Filter Mechanism for Entity Relation Classification. Symmetry 2020, 12, 1729. [Google Scholar] [CrossRef]
- Liu, G.; Guo, J. Bidirectional LSTM with Attention Mechanism and Convolutional Layer for Text Classification. Neurocomputing 2019, 337, 325–338. [Google Scholar] [CrossRef]
- Liu, Y.; Shao, Z.; Teng, Y.; Hoffmann, N. NAM: Normalization-based attention module. arXiv 2021, arXiv:2111.12419. [Google Scholar]
- Hu, J.; Shen, L.; Sun, G. Squeeze-and-excitation networks. In Proceedings of the IEEE Conference on Computer Vision and Pattern Recognition, Salt Lake City, UT, USA, 18–22 June 2018; pp. 7132–7141. [Google Scholar]
- Woo, S.; Park, J.; Lee, J.Y.; Kweon, I.S. Cbam: Convolutional block attention module. In Proceedings of the European Conference on Computer Vision (ECCV), Munich, Germany, 8–14 September 2018; pp. 3–19. [Google Scholar]
- Wu, S.; He, Y. Enriching pre-trained language model with entity information for relation classification. In Proceedings of the 28th ACM International Conference on Information and Knowledge Management, Beijing, China, 3–7 November 2019; pp. 2361–2364. [Google Scholar]
- Soares, L.B.; FitzGerald, N.; Ling, J.; Kwiatkowski, T. Matching the Blanks: Distributional Similarity for Relation Learning. arXiv 2019, arXiv:1906.03158. [Google Scholar]
- Geng, Z.; Zhang, Y.; Li, C.; Han, Y.; Cui, Y.; Yu, B. Energy Optimization and Prediction Modeling of Petrochemical Industries: An Improved Convolutional Neural Network Based on Cross-Feature. Energy 2020, 194, 116851. [Google Scholar] [CrossRef]
- Li, J.; Huang, Q.; Ren, S.; Jiang, L.; Deng, B.; Qin, Y. A Novel Medical Text Classification Model with Kalman Filter for Clinical Decision Making. Biomed. Signal Process. Control 2023, 82, 104503. [Google Scholar] [CrossRef]
- Hendrickx, I.; Kim, S.N.; Kozareva, Z.; Nakov, P.; Séaghdha, D.Ó.; Padó, S.; Pennacchiotti, M.; Romano, L.; Szpakowicz, S. SemEval-2010 Task 8: Multi-Way Classification of Semantic Relations Between Pairs of Nominals. arXiv 2019, arXiv:1911.10422. [Google Scholar]
- Shao, C.; Li, M.; Li, G.; Zhou, M.; Han, D. CRSAtt: By Capturing Relational Span and Using Attention for Relation Classification. Appl. Sci. 2022, 12, 11068. [Google Scholar] [CrossRef]
- Tian, J.; Li, G.; Zhou, M.; Li, M.; Han, D. FA-RCNet: A Fused Feature Attention Network for Relationship Classification. Appl. Sci. 2022, 12, 12460. [Google Scholar] [CrossRef]


Disclaimer/Publisher’s Note: The statements, opinions and data contained in all publications are solely those of the individual author(s) and contributor(s) and not of MDPI and/or the editor(s). MDPI and/or the editor(s) disclaim responsibility for any injury to people or property resulting from any ideas, methods, instructions or products referred to in the content. |
© 2023 by the authors. Licensee MDPI, Basel, Switzerland. This article is an open access article distributed under the terms and conditions of the Creative Commons Attribution (CC BY) license (https://creativecommons.org/licenses/by/4.0/).