Article

Optimal Thresholding for Multi-Window Computed Tomography (CT) to Predict Lung Cancer

Department of Computer Science, University of the Punjab, Lahore 54590, Pakistan
*
Author to whom correspondence should be addressed.
Appl. Sci. 2023, 13(12), 7256; https://doi.org/10.3390/app13127256
Submission received: 18 May 2023 / Revised: 9 June 2023 / Accepted: 16 June 2023 / Published: 18 June 2023

Abstract

:
Lung cancer is the world’s second-largest cause of cancer mortality. Patients’ lives can be saved if this malignancy is detected early. Doctors, however, encounter difficulties in detecting cancer in computed tomography (CT) images. In recent years, significant research has been devoted to producing automated lung nodule detection methods that can help radiologists. Most of them use only the lung window in their analysis and generally do not consider the mediastinal windows, which, according to recent research, carry important information. In this paper, we propose a simple yet effective algorithm to analyze multi-window CT images for lung nodules. The algorithm works in three steps. First, the CT image is preprocessed to suppress any noise and improve the image quality. Second, the lungs are extracted from the preprocessed image. Based on the histogram analysis of the lung windows, we propose a multi-Otsu-based approach for lung segmentation in lung windows. The case of mediastinal windows is rather difficult due to irregular patterns in the histograms. To this end, we propose a global–local-mean-based thresholding technique for lung detection. In the final step, the nodule candidates are extracted from the segmented lungs using simple intensity-based thresholding. The radius of the extracted objects is computed to separate the nodule from the bronchioles and blood vessels. The proposed algorithm is evaluated on the benchmark LUNA16 dataset and achieves accuracy of over 94% for lung tumor detection, surpassing that of existing similar methods.

1. Introduction

According to the recent report of the American Institute of Cancer published on 14 February 2022, there are over 236,740 reported cancer infections, with 117,910 instances reported in males and 118,830 cases diagnosed in women [1]. Around 130,180 people have died, including 61,360 females and 68,820 males. Both small cell lung cancer (SCLC) and non-small-cell lung cancer (NSCLC) are represented among these patients. NSCLC is a far more typical type of respiratory tumor [1,2]. Lung tumor death rates in men have declined by 56% since the year 1990, whereas women’s death rates have declined by 32% since 2002. Male birth mortality increased by 5% annually from 2015 to 2019, whereas female birth mortality has increased by 4% annually [2]. According to statistical data, up to 80% of malignancies are NSCLC, while up to 20% among all malignancies are SCLC. The three most prevalent types of NSCLC are adenocarcinoma, squamous cell carcinoma, and large cell carcinoma [3]. Mortality rates in males decreased between 2015 and 2019 by 5% annually, while female death rates decreased by 4% annually within this period. As a result, many people have quit smoking, and new technology for lung nodule identification and treatment has been created, such as the dual-energy imaging approach [4]. Researchers have improved tumor identification by combining this method with fluoroscopy during radiotherapy [2,5].
Numerous indicators have been devised by the World Health Organization (WHO) to aid lung cancer prevention, which include avoiding the use of cigarettes and alcohol and exercising regularly to maintain a healthy weight [6]. On the other hand, early detection can help those who have the condition by enabling them to obtain the best care as soon as possible. Scientists struggle to identify minute nodules because the malignancy is so small at this stage, but it is treatable also. To this end, computer-based systems and devices have been proposed to help radiologists who analyze computed tomography (CT) images to detect lung cancer.
In order to design efficient computer-aided diagnosis (CAD) systems for the identification of lung cancer cells, image processing, machine learning, and deep learning have been extensively explored. Most image-processing-based methods use some form of thresholding to identify the nodules in lung CT images, and they have garnered a lot of interest since they allow for the modification of image pixels for more effective analysis. For instance, Li et al. [7] proposed an automated lung nodule detector that is based on thresholding. Six different features, including the effective diameter, degree of compactness, and irregularity, were computed from detected nodule candidates and used to filter the nodule and non-nodule regions. The method presented in [8] utilizes a watershed for lung segmentation. It uses a marker control watershed and region growing approach to segment potential nodule regions from CT images. Different features are then computed from the binarized segmented lung to identify nodules. A similar method is presented in [9], which uses a simple thresholding-based segmentation technique to extract the lung nodule region. Several features, e.g., area, perimeter, and eccentricity, are then computed to separate nodules. The method in [10] uses morphological procedures as a preprocessing approach; subsequently, they extracted the nodule by subtracting the thresholded image from an object removal mask. A technique presented in [11] denoises CT images using image enhancement techniques and uses histogram equalization to enhance the image quality. The images are then segmented using the watershed approach. Finally, the lung nodule candidates are categorized according to their area, perimeter, and eccentricity.
Machine learning (ML) systems can adapt from data, detect patterns, and make different choices without the need for human interaction. Machine learning techniques are widely used in medical diagnosis and the monitoring of patients [12,13,14,15,16,17]. This method aids in the recognition of patterns and the computation of visual attributes that are relevant to the diagnosis process. ML-based nodule detectors generally extract important features from CT images and use some classification techniques to separate the nodules. For example, the model presented in [18] segments the nodule area and extracts 15 texture features from both the segmented nodule and its surrounding region; it then trains a model using support vector machines (SVM) to detect nodules. In the method introduced in [19], gray-scale CT images were preprocessed using median filters to eliminate noise. To separate the image into several parts and retrieve useful information during segmentation, watershed segmentation was performed. The method extracts image characteristics such as the area, perimeter, diameter, etc., from the segmented regions. To determine whether the identified nodule was cancerous or benign, the authors ultimately employed an SVM classifier. Khehrah et al. [20] proposed a CAD system that separates the lungs using a histogram-based method and looks for potential nodules by computing different statistical and shape-based features and classifying them with SVM.
Deep learning (DL) tries to mimic human behavior to gain knowledge [21]. Due to its high performance and versatility, it helps to process a large amount of medical information and shows appreciable performance in tasks such as segmentation, classification, and detection [22]. Several lung cancer detection methods in the literature exploit deep learning. For example, in the method presented in [23], the authors used U-Net [24] and ResNet [25] models to extract the features of CT images and then used different classifiers to classify cancerous CT scans. Asuntha et al. [26] proposed a deep learning method by combining CNN and the fuzzy particle swarm optimization algorithm. The main advantage of this algorithm is that it lessens the computational intricacy of the CNN algorithm and gives better performance. The method introduced in [27] computes a set of features, such as geometric features, intensity features, texture descriptors, gradient features, and region descriptors, and classifies them using deep learning. Masood et al. [28] deployed a cloud-based 3D deep convolutional neural network (3DDCNN) to aid radiologists.
The DL-based lung nodule detection presented in [29] employed histogram equalization to enhance the image quality and applied an improved profuse clustering technique to separate the region of interest. A CAD system [30] that uses CT images as input and identifies regions of interest first, followed by nearby regions, to evaluate CT scans for positive or negative lung cancer is presented. To diagnose cancer at an early stage, it employs 2D and 3D convolutional neural networks, namely Google-net-based models, as classifiers. To identify and categorize lung cancer in CT scans, Wafa et al. [31] proposed a CAD that identifies a small nodule (less than 10 mm) in a 3D CT scan image. For better results, each image was converted into Hounsfield units during the preprocessing step, before being segmented using the Watershed approach. Following segmentation, linear scaling is used to normalize the 3D images, which are provided to the U-Net-based malignancy classifier to locate tiny boxes of the best candidates for nodules. Finally, an image composed of these small 2D slices of the best nodule candidates is obtained, and the layers are classified using the 3D-CNN classifier. The 2017 Kaggle Data Science Bowl was considered by Kuan et al. [32]. They used a modified ResNet for both nodule detection and malignancy detection after preprocessing the CT scans.
Most existing thresholding-based lung nodule detection techniques handle CT scan images consisting of lung windows only and do not consider the mediastinal windows in the detection of the disease. Research such as [33] has shown that the detection rate is improved if both windows are analyzed for lung nodules. On the other hand, deep learning requires a huge amount of data to train a model perfectly; it is challenging to obtain such an extensive dataset in the medical field, where imaging and tagging by experts is a tedious and expensive task. Time consumption is another factor that must be considered in regard to deep learning models. Therefore, a simple and fast yet effective method is needed. In this paper, we propose a thresholding-based, simple and accurate technique for lung nodule detection. The proposed technique can address both lung windows and mediastinal windows efficiently and gives appreciable accuracy in terms of cancer detection.

2. Proposed Method

As with most existing lung nodule detectors, the proposed method also consists of three steps. First, the images are preprocessed to eliminate noise and to improve the image contrast and quality so that the later stages of the algorithm can perform better. Second, the lung is segmented from the processed images, and, in the third and final step, nodules are detected using the shape characteristics.

2.1. Preprocessing

CT scan images can be noisy, which can adversely affect the segmentation accuracy. Therefore, almost every existing lung nodule detection technique implements some preprocessing method to improve the image quality. To reduce the noise effect and enhance the contrast, we propose to use image normalization and image smoothing as preprocessing steps. To increase the pixel intensity and improve the contrast, image normalization is used. The images in our collection have a range of pixel intensities from −1000 to 1000. Image normalization is employed to rescale the intensity values within the 0–255 range. Moreover, to reduce or eliminate the image noise, image smoothing is implemented. To this end, we use the Gaussian smoothing filter.

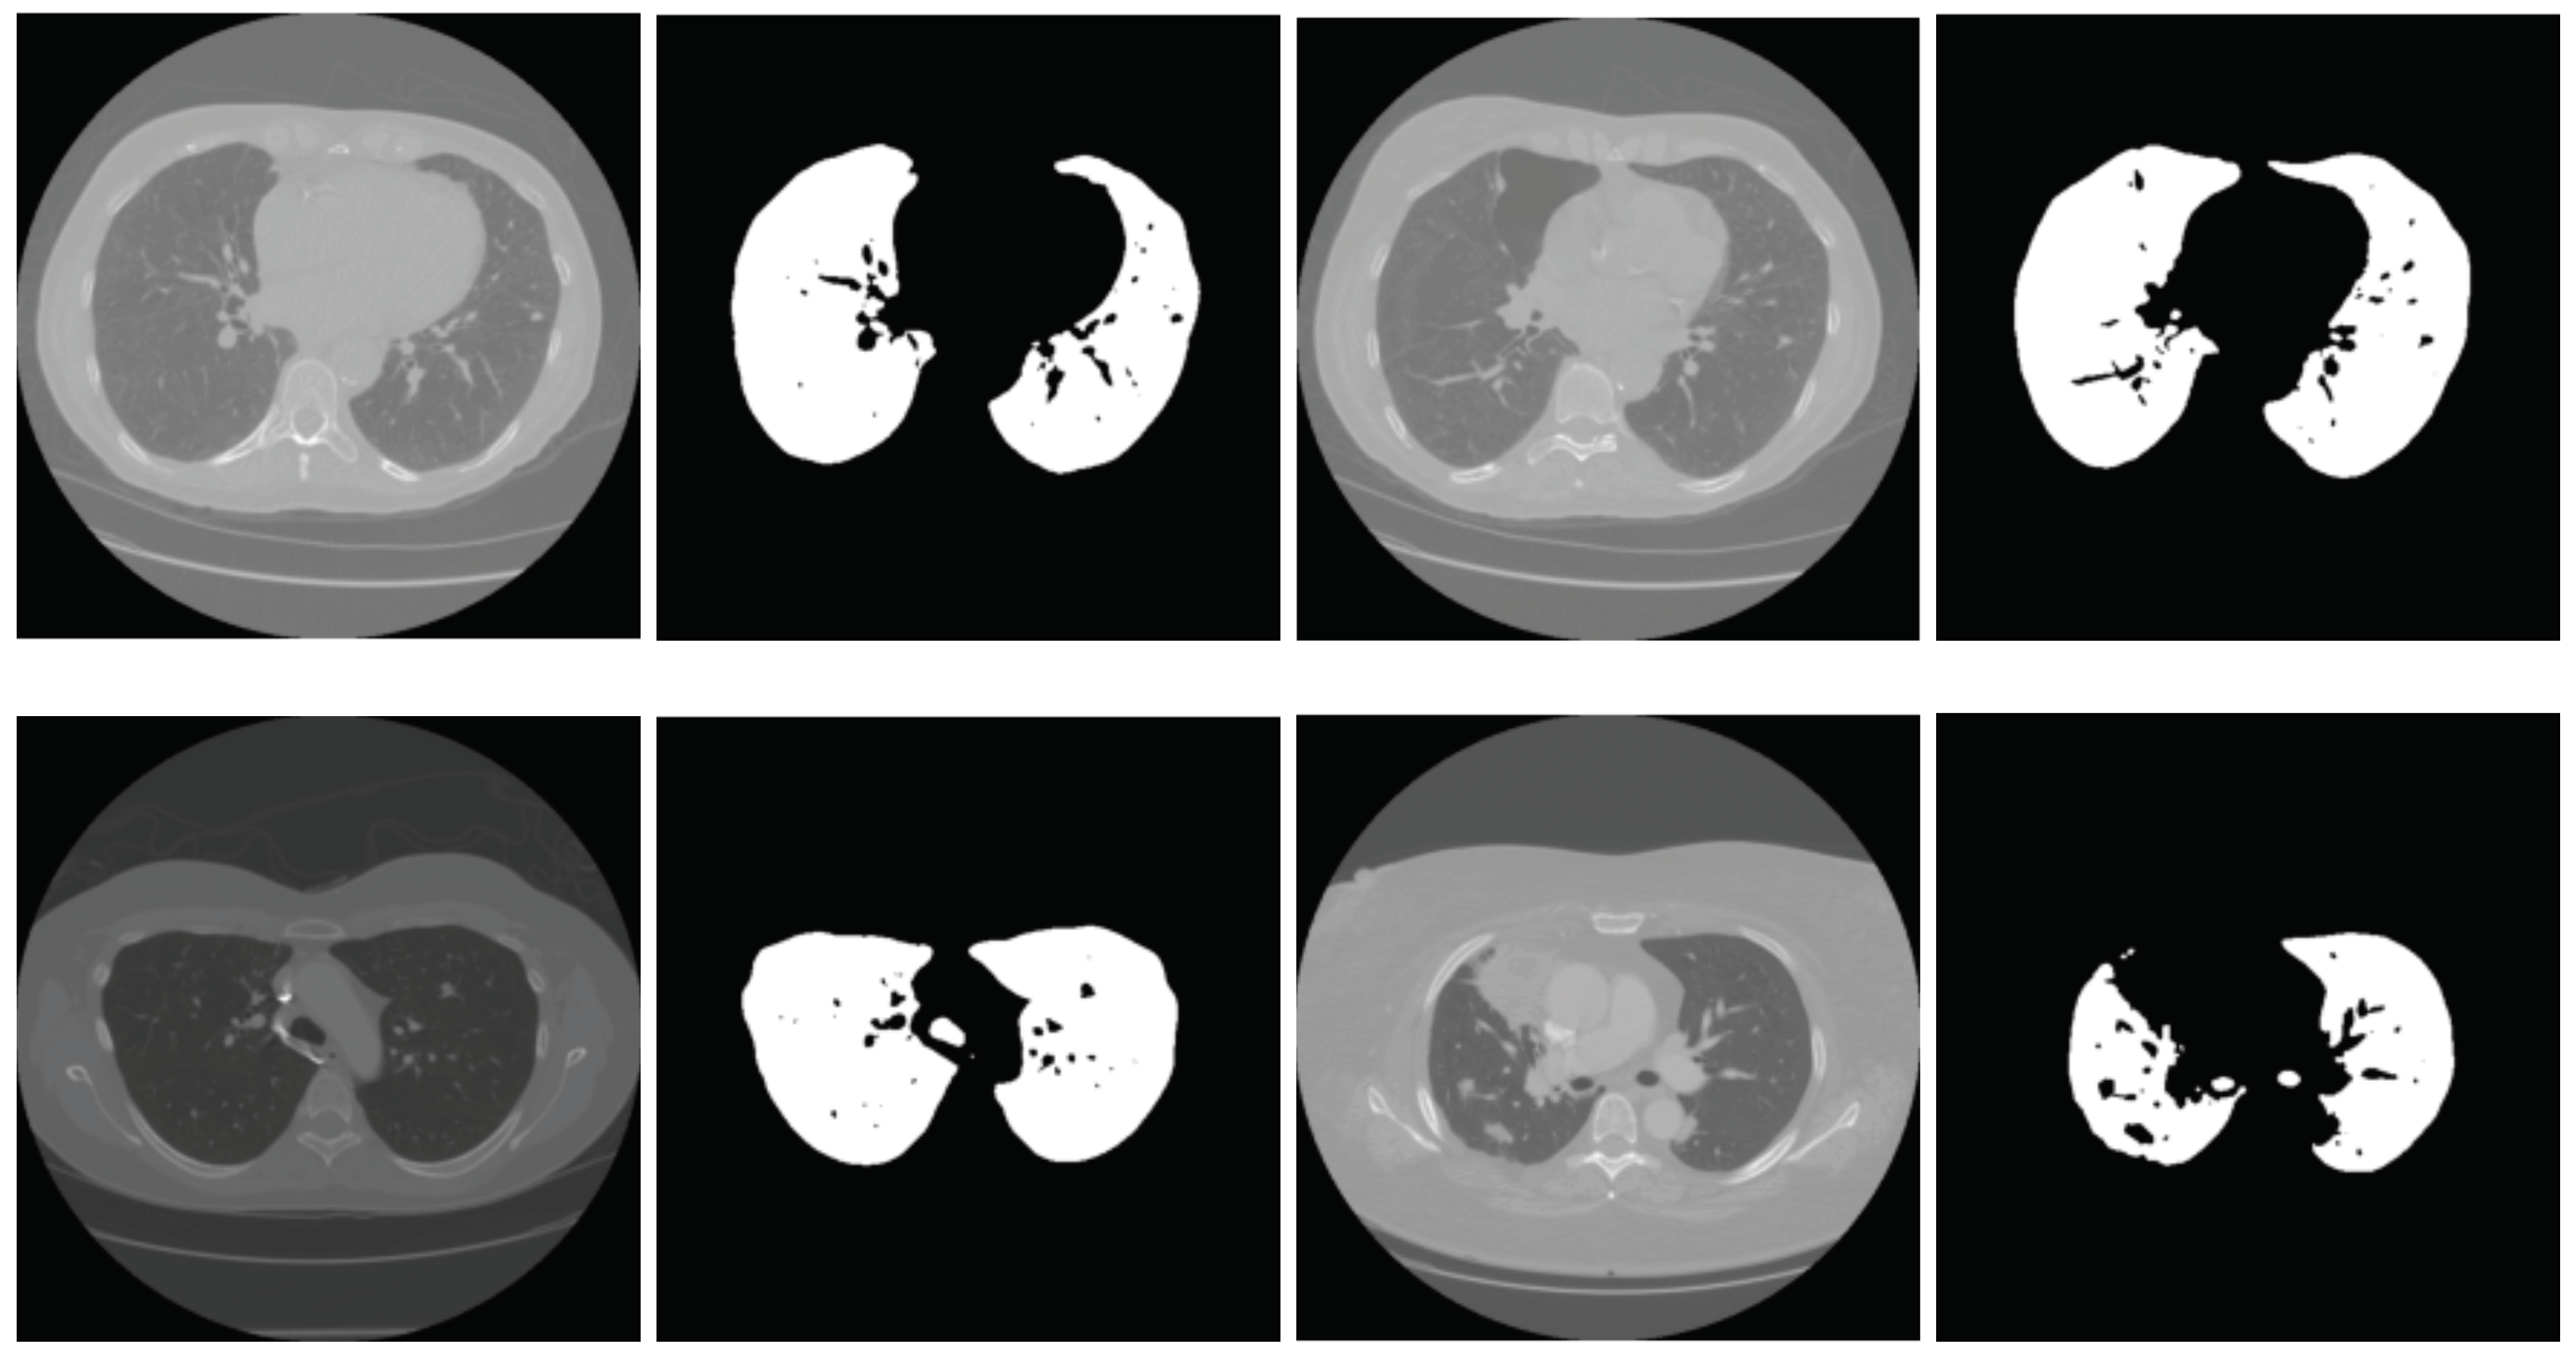
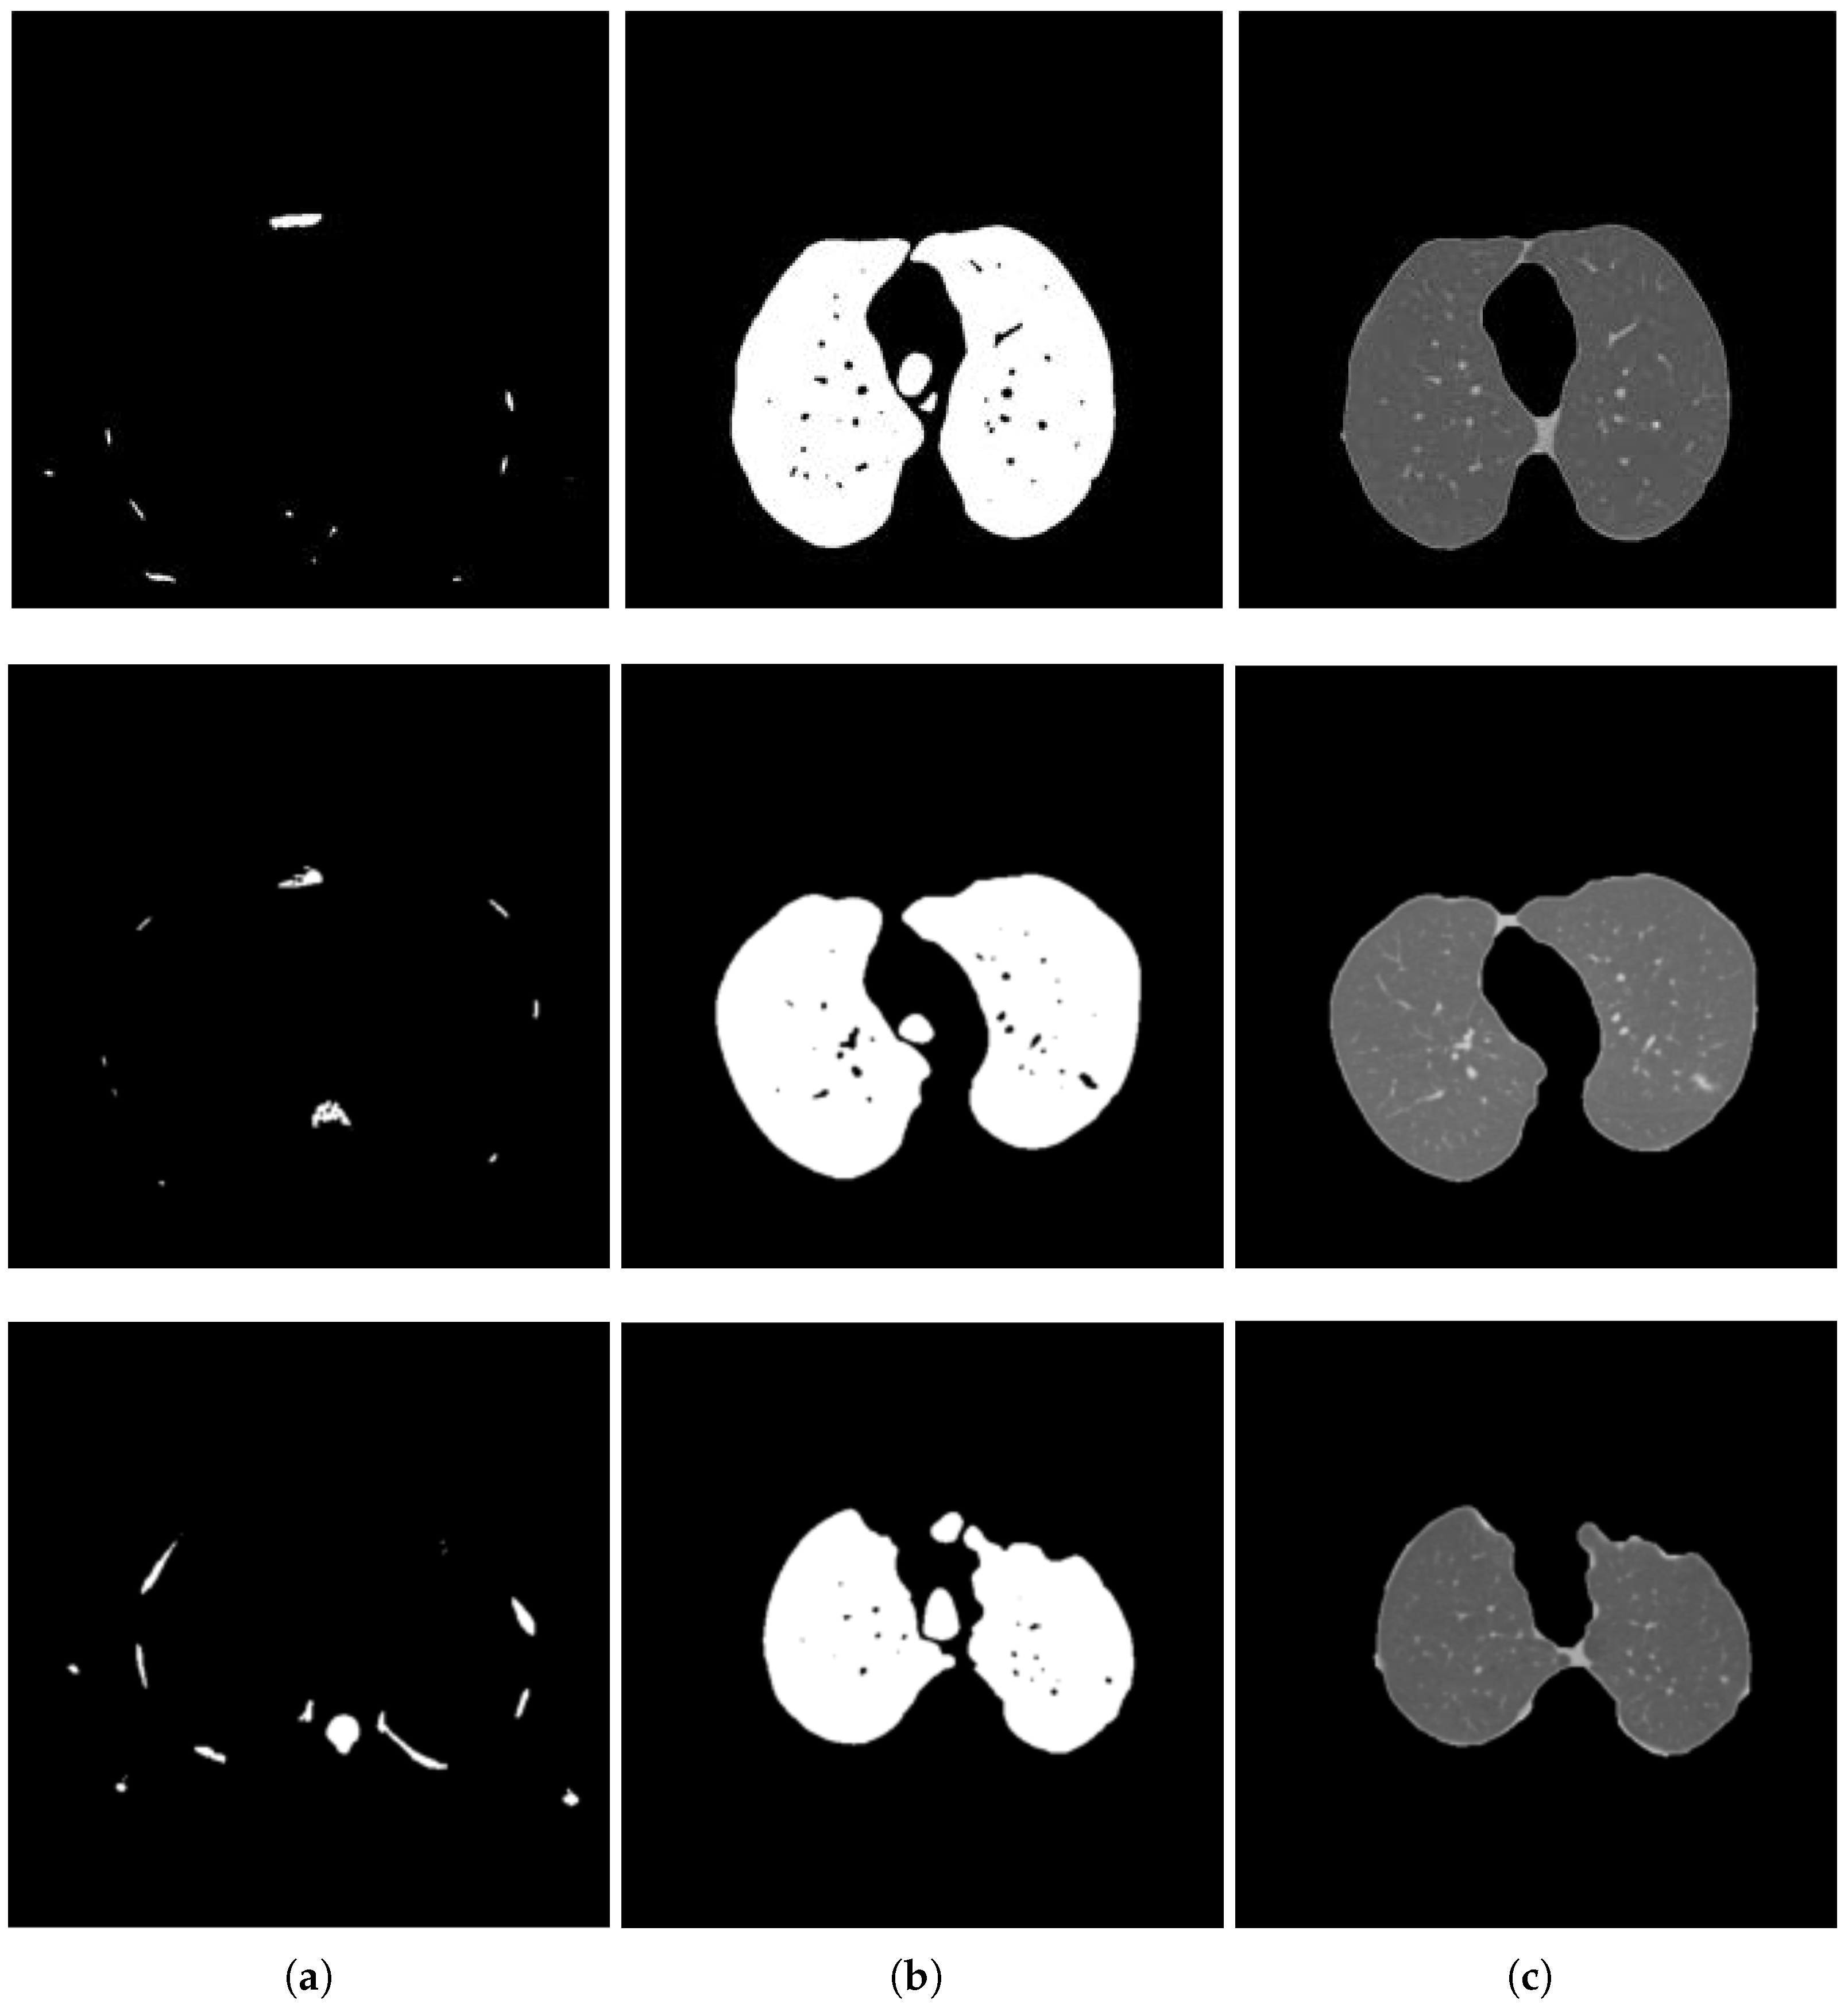
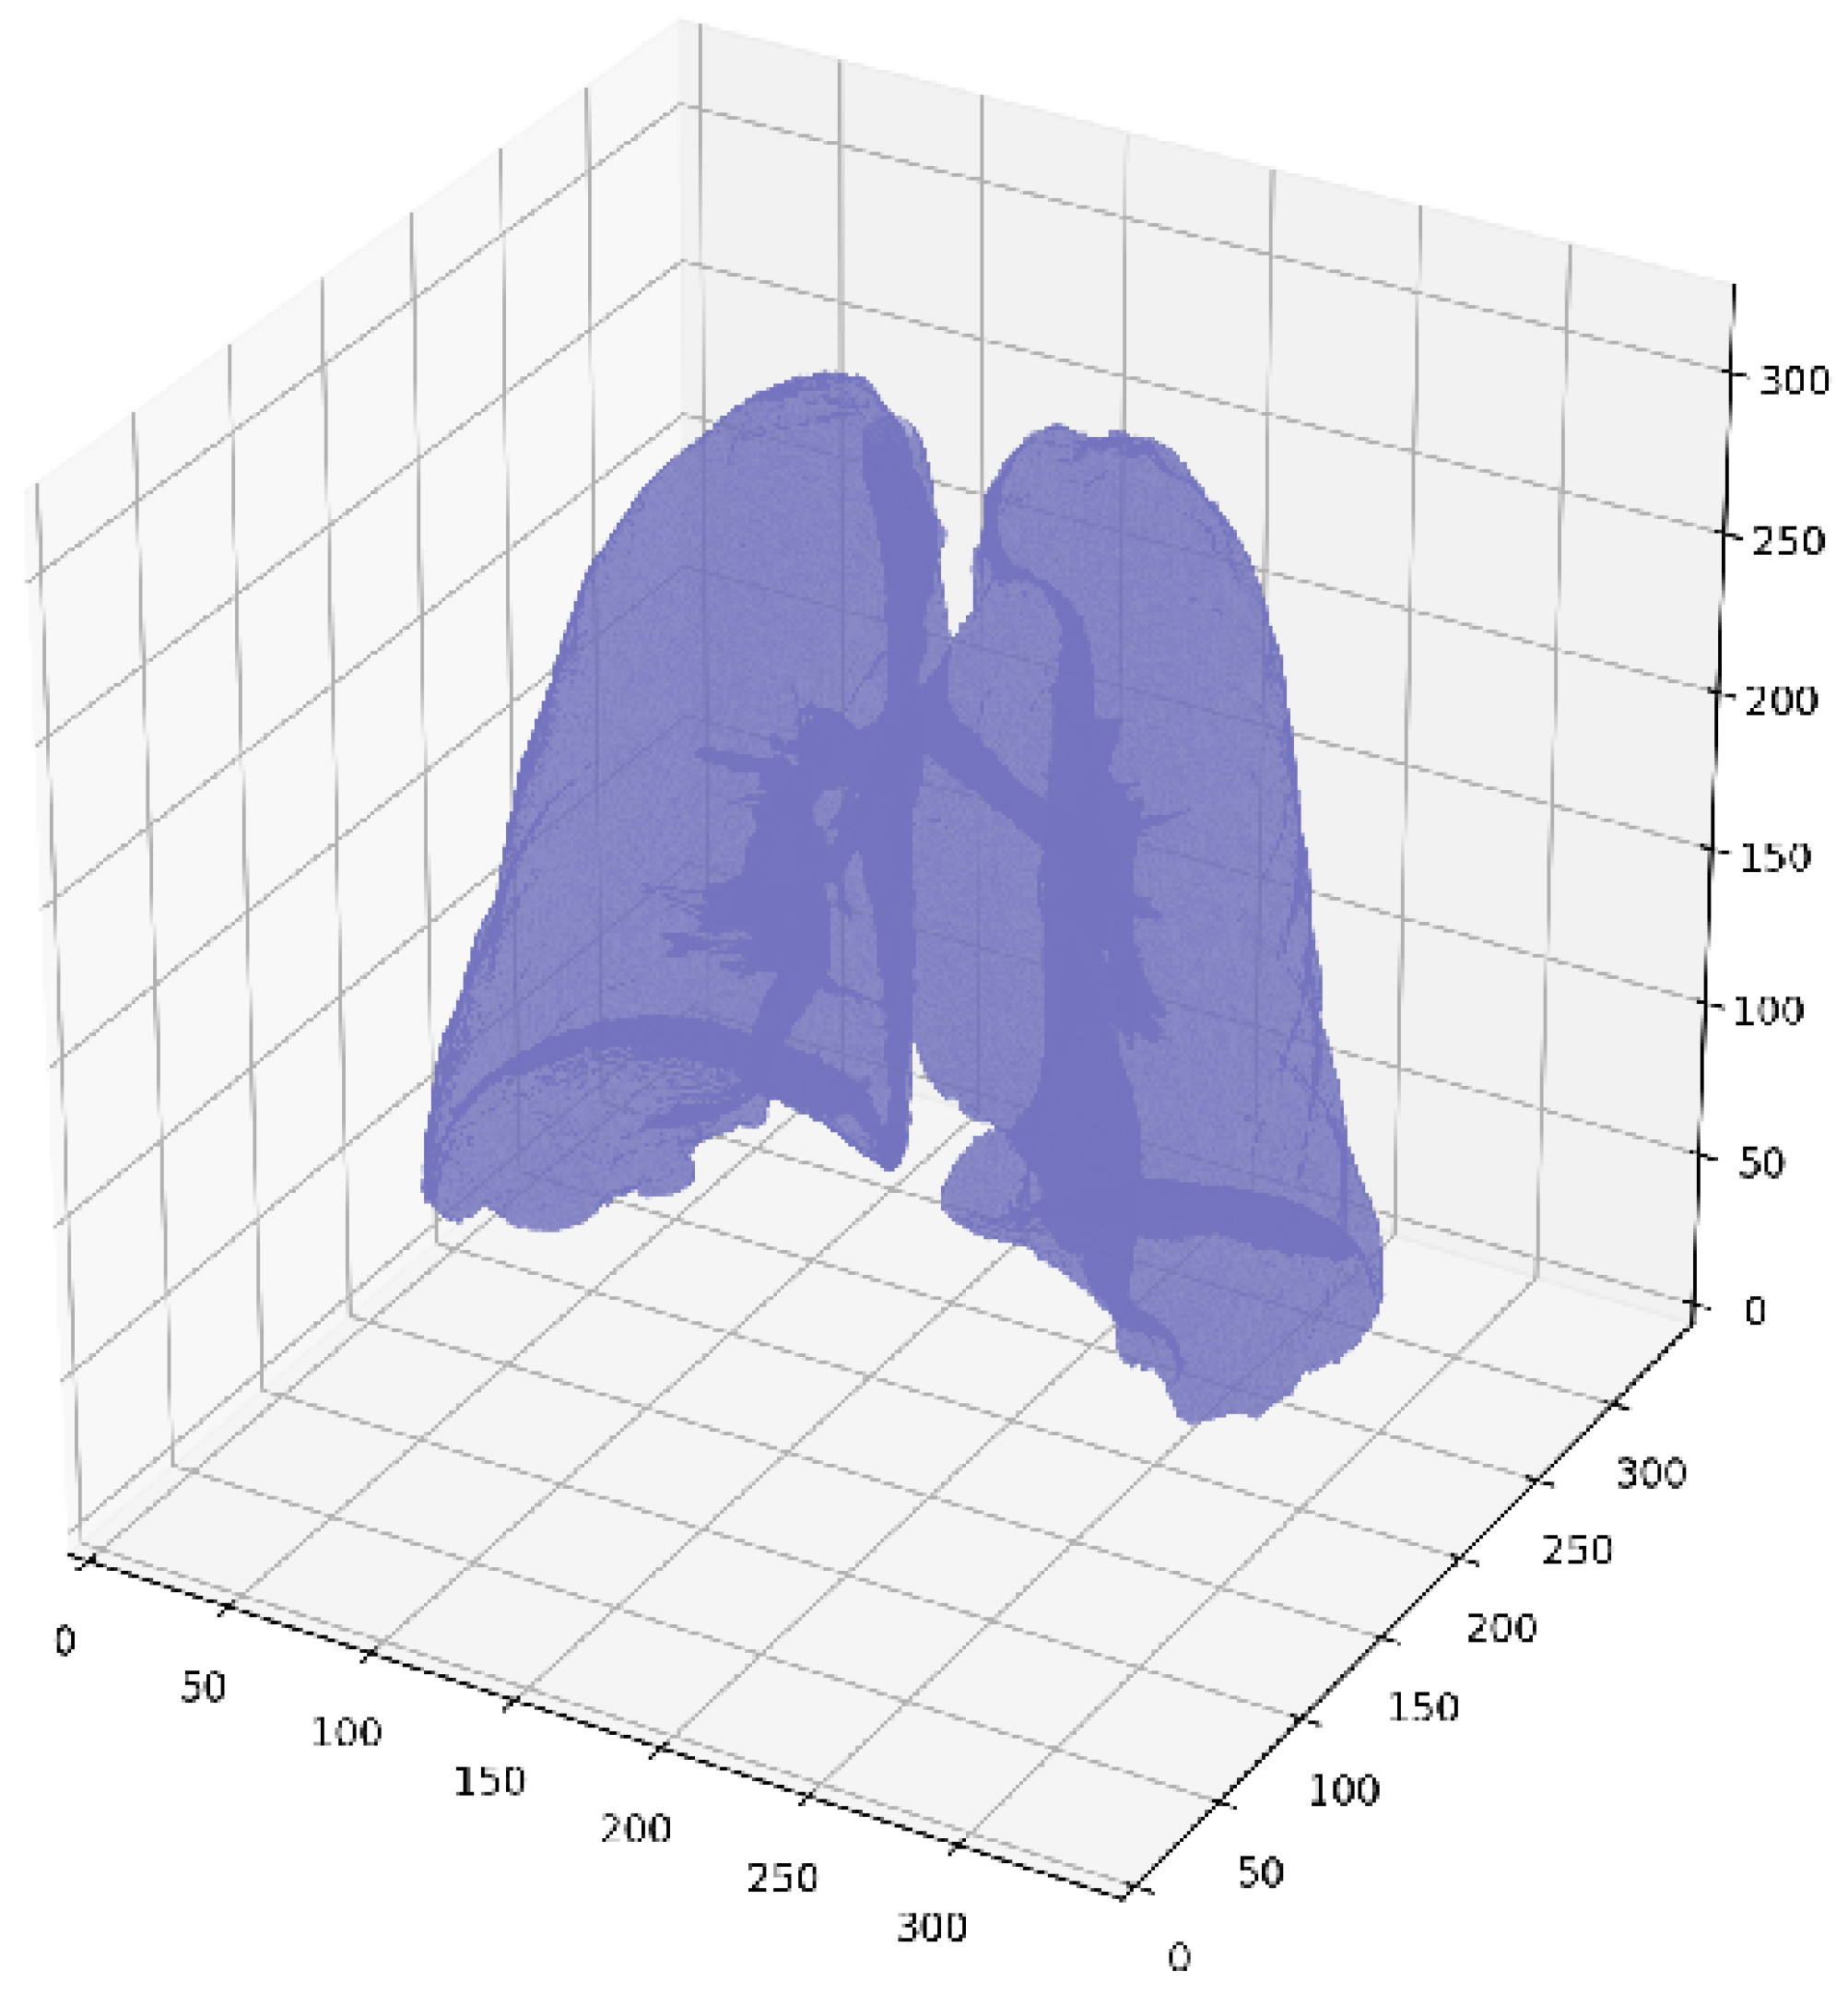
2.2. Lung Segmentation

After preprocessing, the lung in the image must be segmented to extract the region of interest for further processing. There are two types of CT scan images, i.e., lung windows and mediastinal windows, as shown in Figure 1. One may note that in a CT image of the lung window, there are three types of gray levels: a black background and gray regions for the chest wall and lung area. These three regions can be seen in the histogram of the image, as discussed in [20]. Figure 2a presents the histogram plot of the lung window image shown in Figure 1a. The first peak in the histogram corresponds to the black background in the image, which can be easily dropped. The second peak represents the lungs and the circular gray region, and the third peak separates the circular component from the lung region. Therefore, a threshold from the second valley can be used to extract the lungs.
The histogram of the mediastinal window, on the other hand, is straightforward; see Figure 2b. The background and the lung intensities are concentrated around the lower end of the histogram and the region around the lungs is gray. This means that in order to binarize the mediastinal window, we simply require an optimal threshold value from the first valley of the histogram.

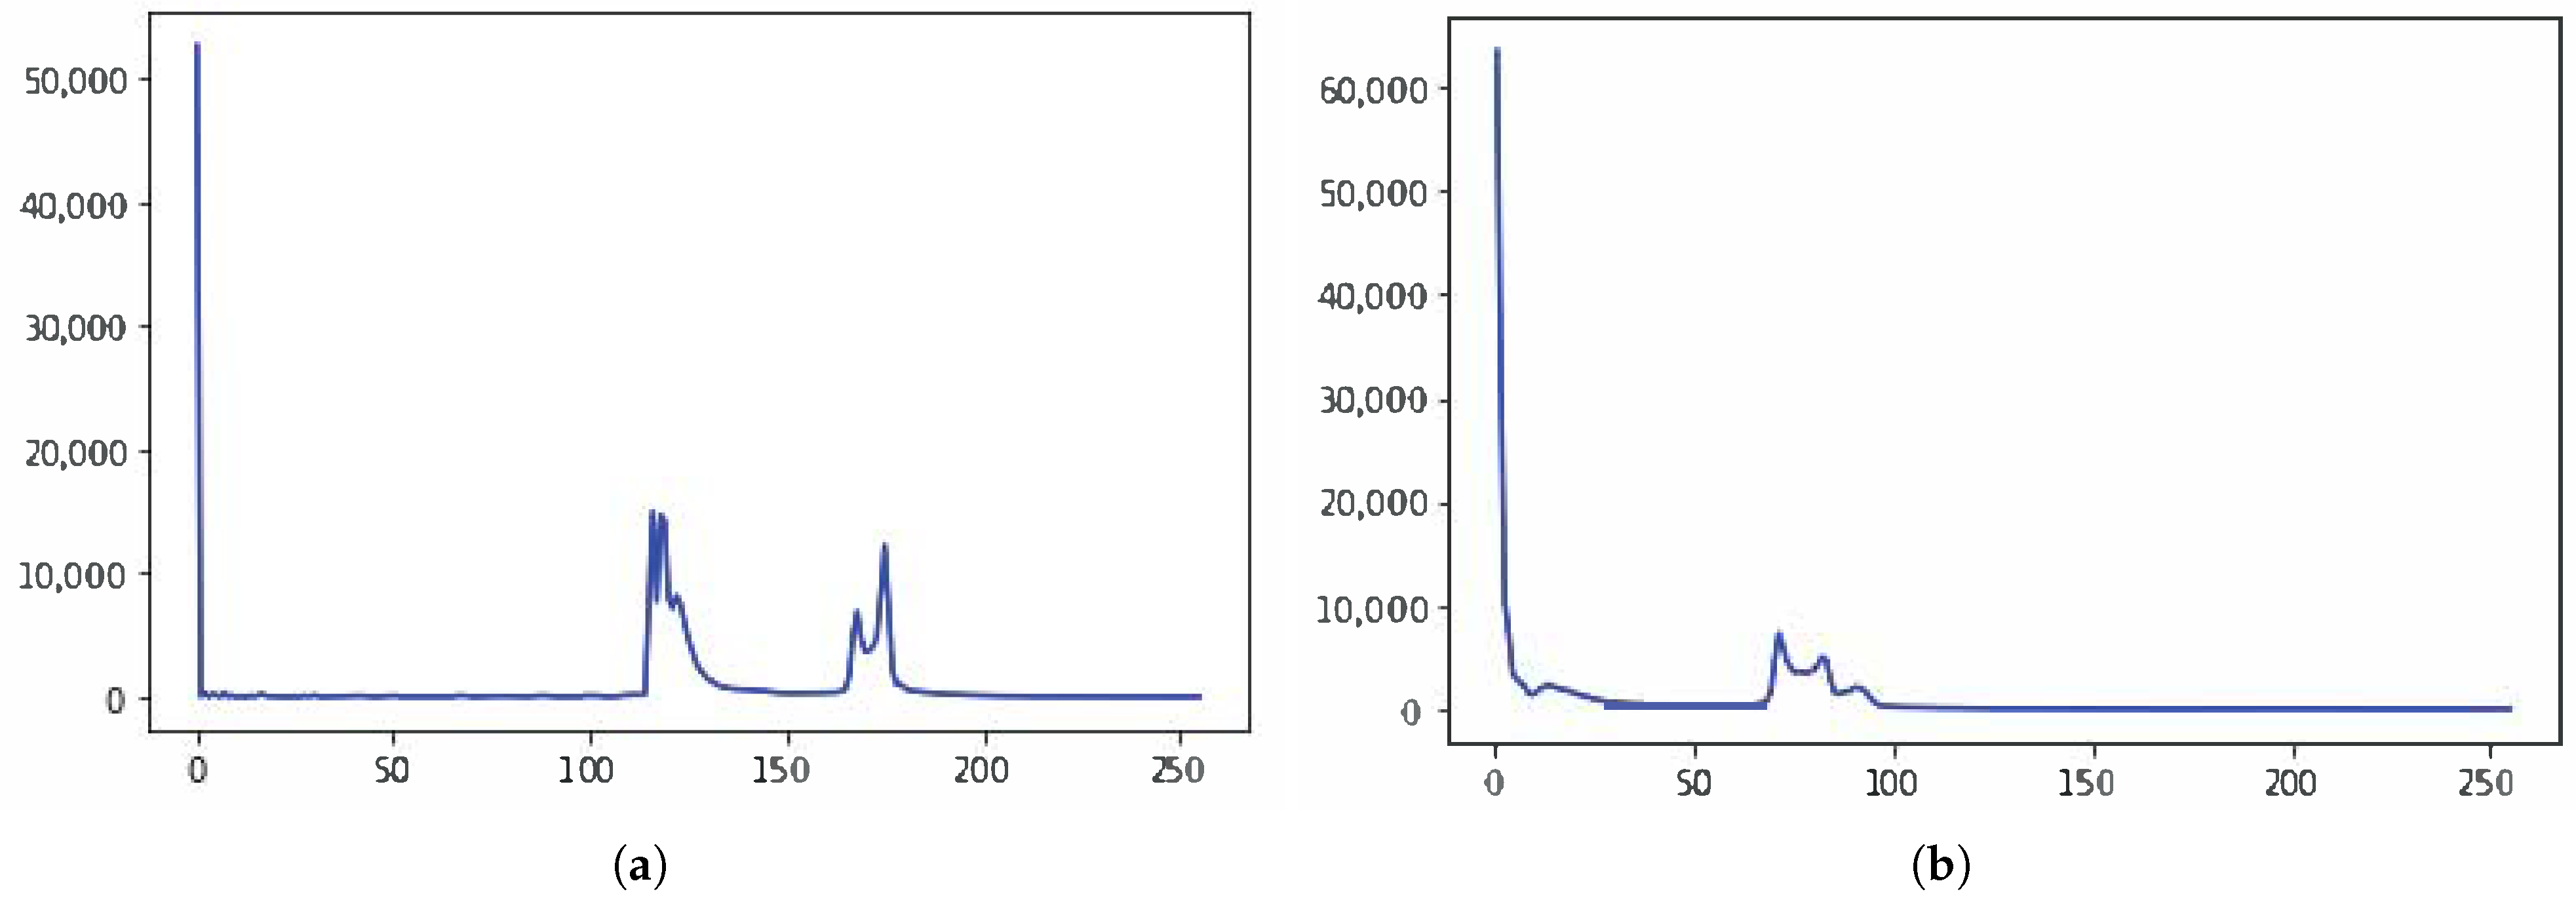
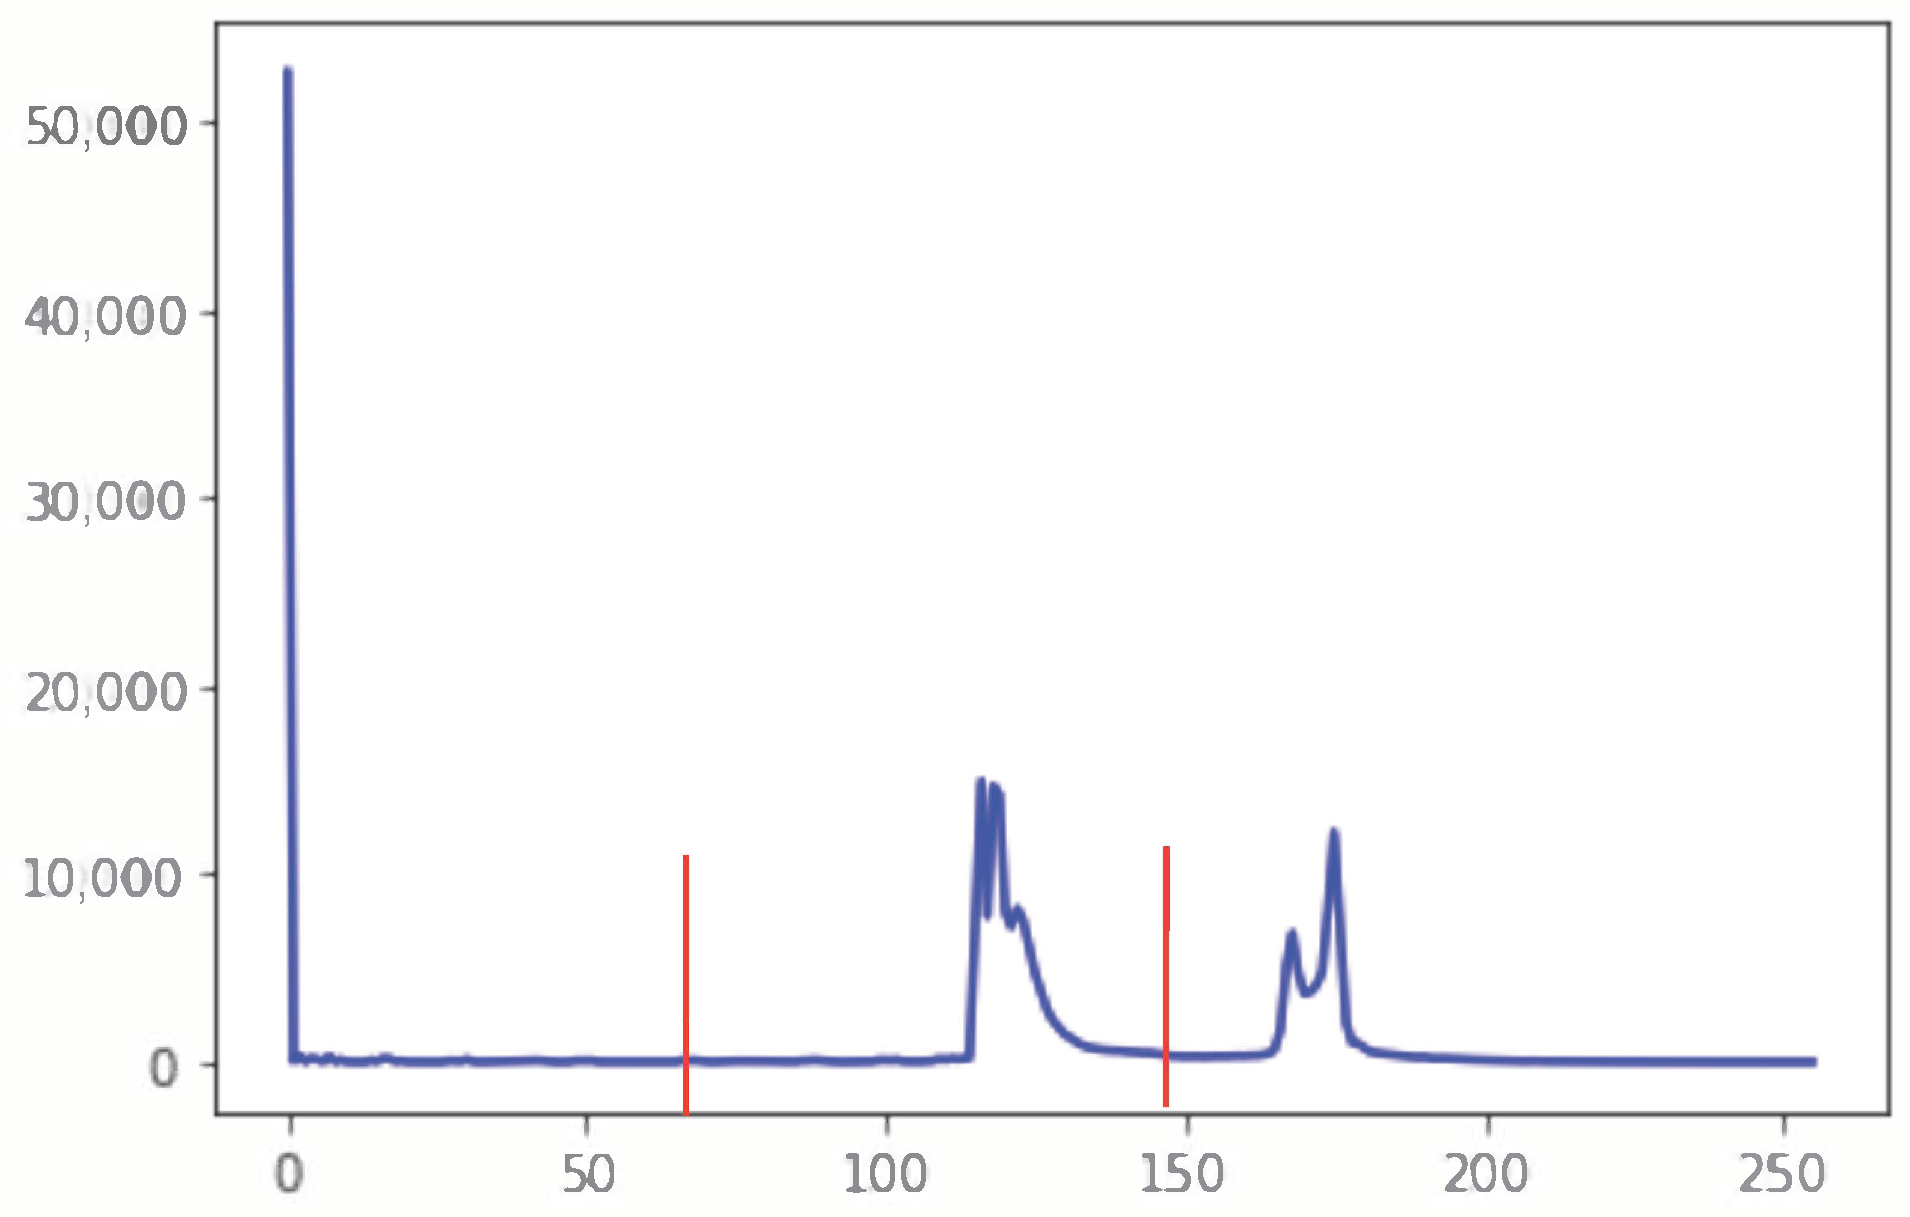
2.2.1. Segmentation in Lung Window

For image segmentation, there are several existing segmentation techniques, such as flood fill, thresholding, and watershed. The flood fill algorithm is not suitable for segmentation since it can miss some important areas, as with thresholding. The watershed algorithm is widely used in lung segmentation and is more effective; however, in most cases it requires seeding the region of interest.
Extracting lungs from the lung window scan is indeed a tri-class pixel classification problem (Figure 1a). To achieve this pixel categorization, we use the multi-Otsu thresholding algorithm [34]. Otsu’s algorithm has been explored to solve many medical imaging problems, e.g., [35,36,37]. It finds the optimal thresholds by maximizing the between-class variance with an exhaustive search [38]. The multi-Otsu method returns two thresholds for three class problems. In our case, the first threshold comes from the valley between the first and the second peaks, and the second threshold separates the second class of pixels from the third class of pixels. The thresholds computed in the lung window shown in Figure 1a using the multi-Otsu method are shown in Figure 3 using the red markers. The second threshold separates the lungs from the rest of the image. Figure 4 shows a few lung window samples from the test dataset and the segmented lungs using the proposed method.

2.2.2. Segmentation in Mediastinal Window

We recall that mediastinal window images usually show two types of gray level intensities; however, in some cases, there are more than two groups, which results in inaccurate thresholds computed with the multi-Otsu method. For instance, lung segmentation on a sample mediastinal window using the multi-Ostu threshold is shown in Figure 5. Figure 5b shows the histogram of the mediastinal image shown in Figure 5a. The segmentation result using this threshold is shown in Figure 5c. Many patches can be noted in the segmented image, which have been incorrectly classified.
Analysis of the mediastinal window histograms shows that the incorrect threshold occurs when there are a few closely appearing peaks on the higher end of the histogram, instead of one large peak. The Otsu method in such cases sometimes results in converging the threshold between these peaks instead. A simple strategy to avoid an incorrect threshold for lung segmentation in the mediastinal window is to compute the image’s global mean and use it as a threshold value. Let I be an image of size M × N ; the global mean μ g of I can be estimated as
μ g = 1 M N x = 1 M y = 1 N I ( x , y )
This mean serves as a better threshold than that estimated with the Otsu method in many cases; however, it still can suffer from bias toward the larger part. Specifically, if there is a significant number of large values (gray) compared to the background (black), the mean can be found in a similar region to the Otsu threshold. In Figure 6, we present some results obtained using the global threshold for lung extraction. The top two rows show the results where segmentation using global-mean-based thresholding produced good results, and the bottom two rows show some failure cases.
To overcome this problem, we use the global mean to roughly separate the image into two regions, Ω 1 and Ω 2 . The set Ω 1 consists of those image pixels that lie in the interval [0, μ g ], and Ω 2 contains the rest of the pixels, i.e., the pixels with intensity lying within [ μ g , 255]. The local means of the two regions are computed and used to find a better threshold. The local mean μ 1 of the region Ω 1 is then computed.
μ 1 = 1 | Ω 1 | x , y Ω 1 ( x , y )
where | Ω 1 | represents the size of the set. Similarly, μ 2 is computed for Ω 2 .
μ 2 = 1 | Ω 2 | x , y Ω 2 ( x , y )
The threshold τ is then taken as the average of the two local means.
τ = μ 1 + μ 2 2
Since the threshold τ is taken as the average of the two local means, it overcomes the bias issue. In Figure 7, we present a few examples where the global mean thresholding technique produced poor results and the local mean thresholding produced ( τ ) quite accurate results. From these lung images, it can be noted that a few lung pixels are incorrectly marked as non-lung and vice versa. To recover these pixels, we employ the watershed algorithm [39,40]. The obtained lung mask is used as the seed for the watershed algorithm. The third column in Figure 7 shows the result after applying the watershed algorithm. The resulting images present accurate lung segmentation.

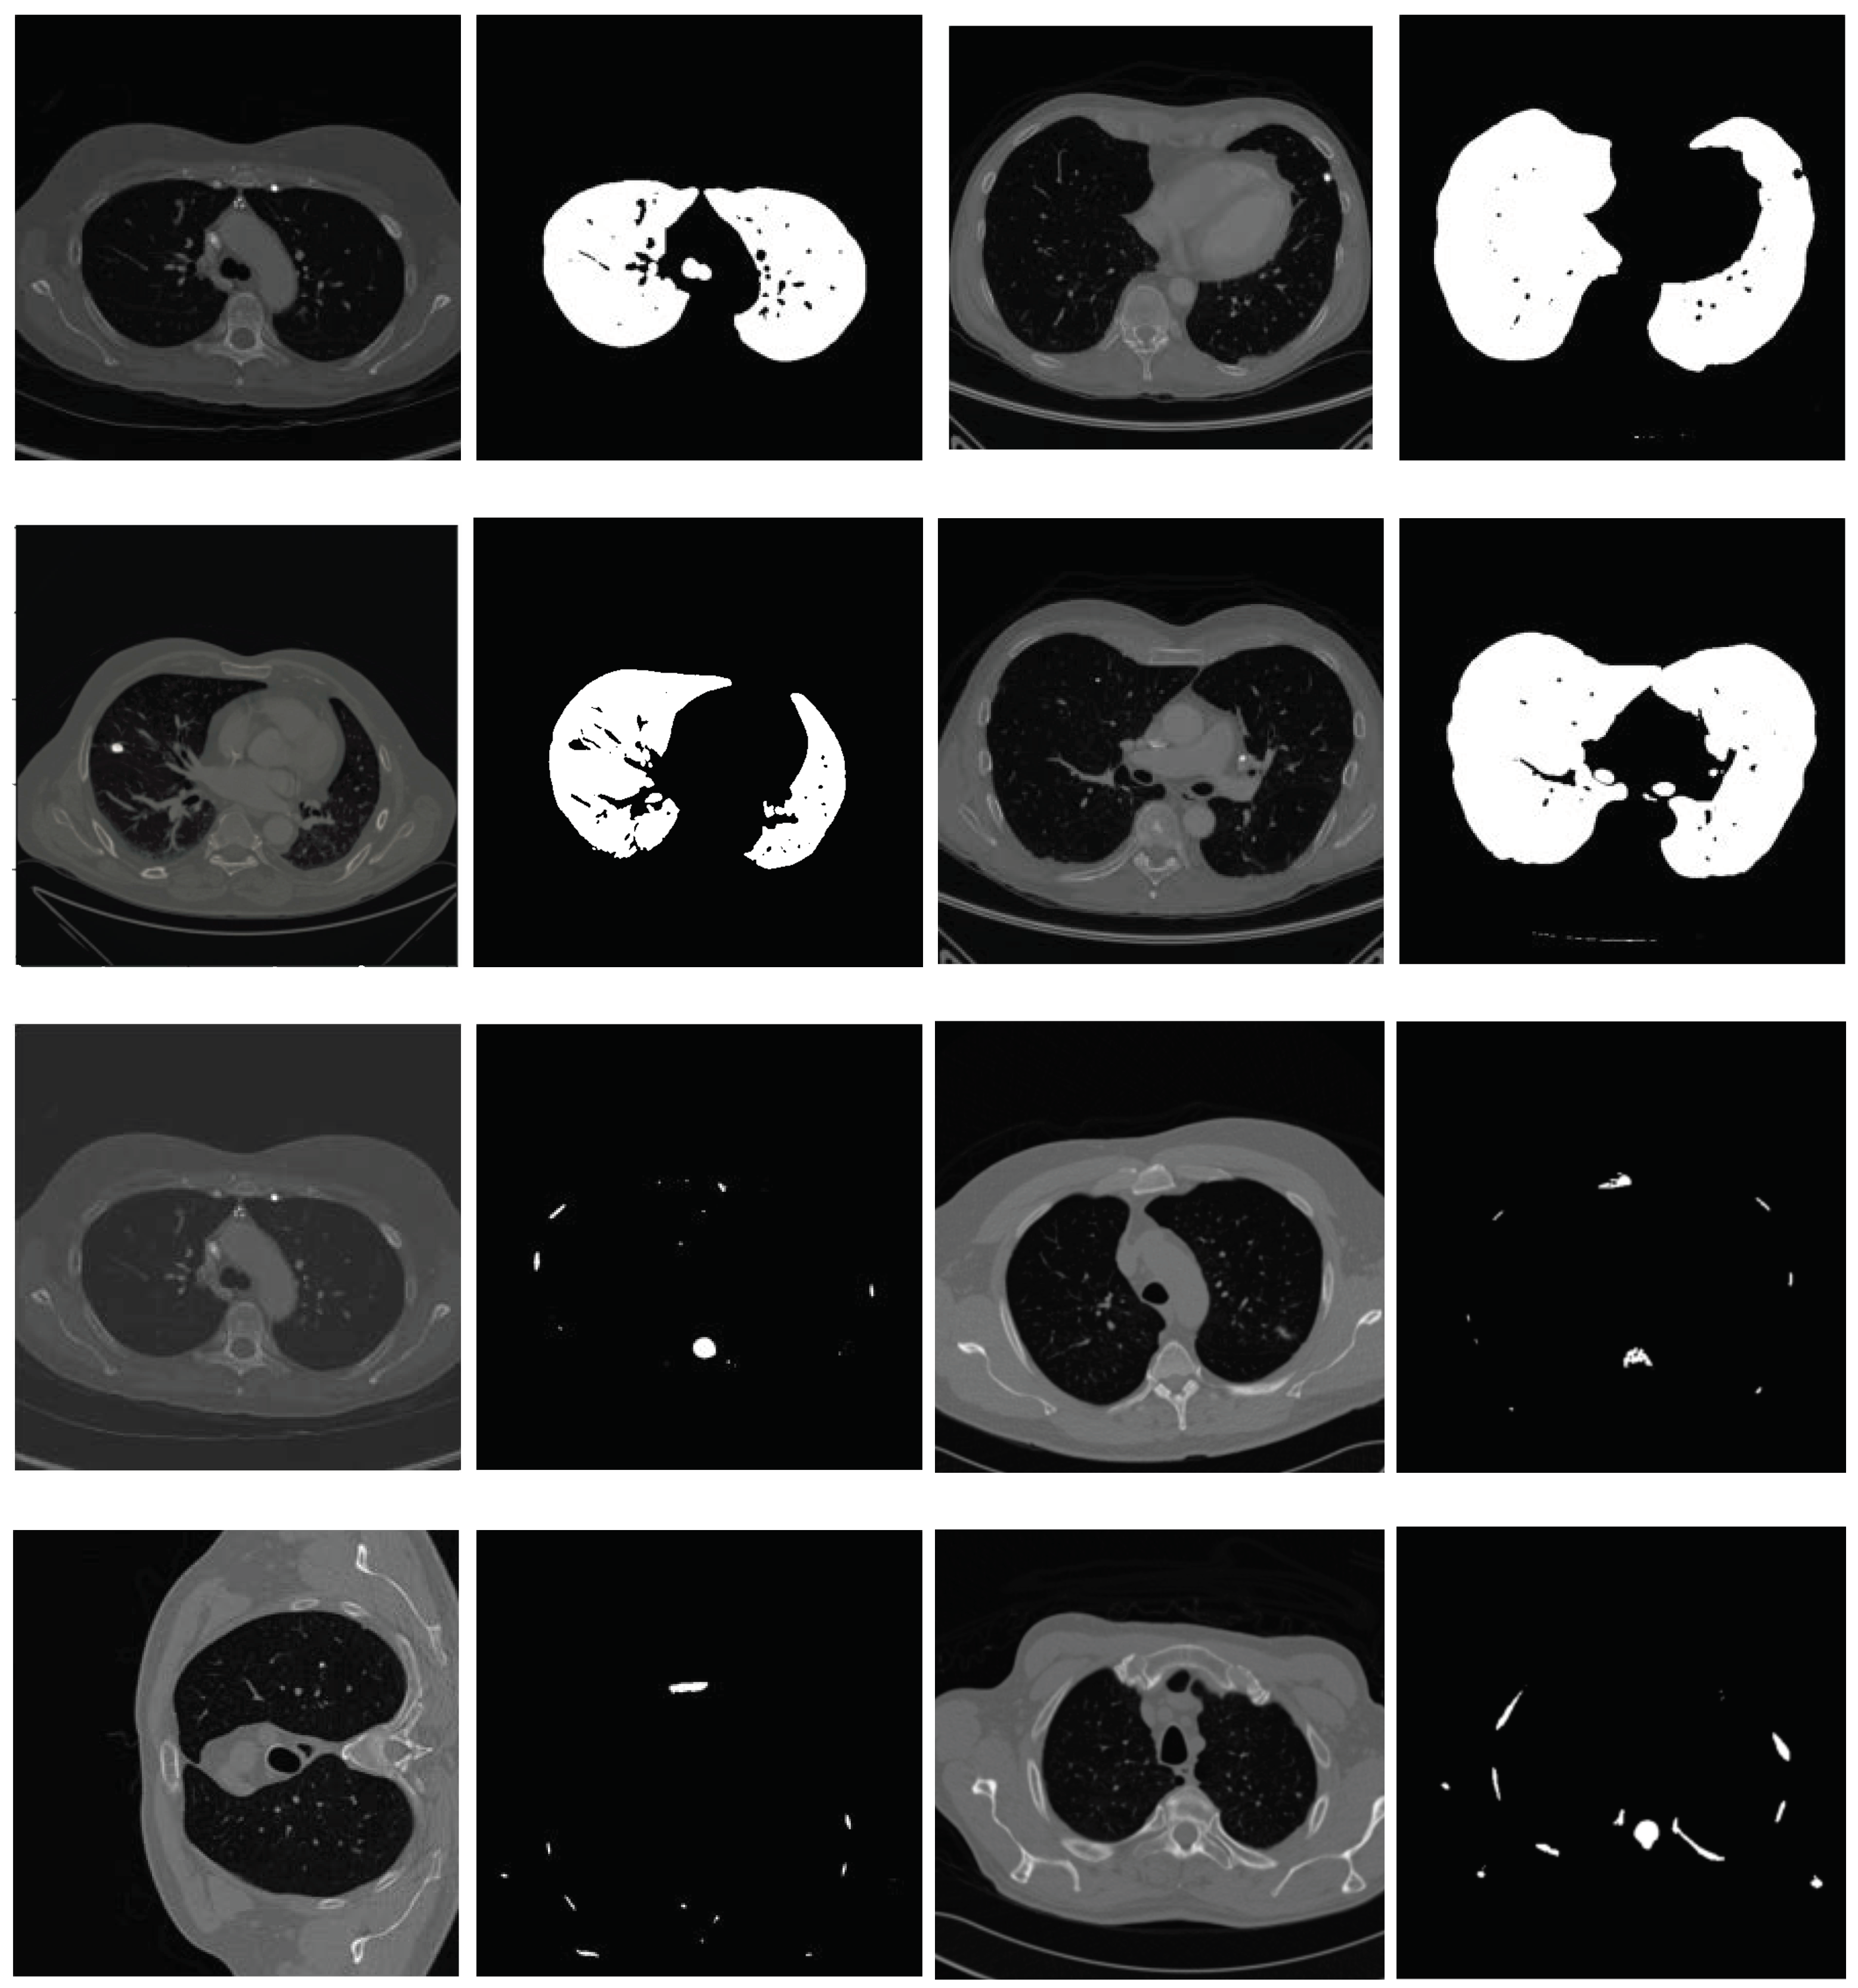
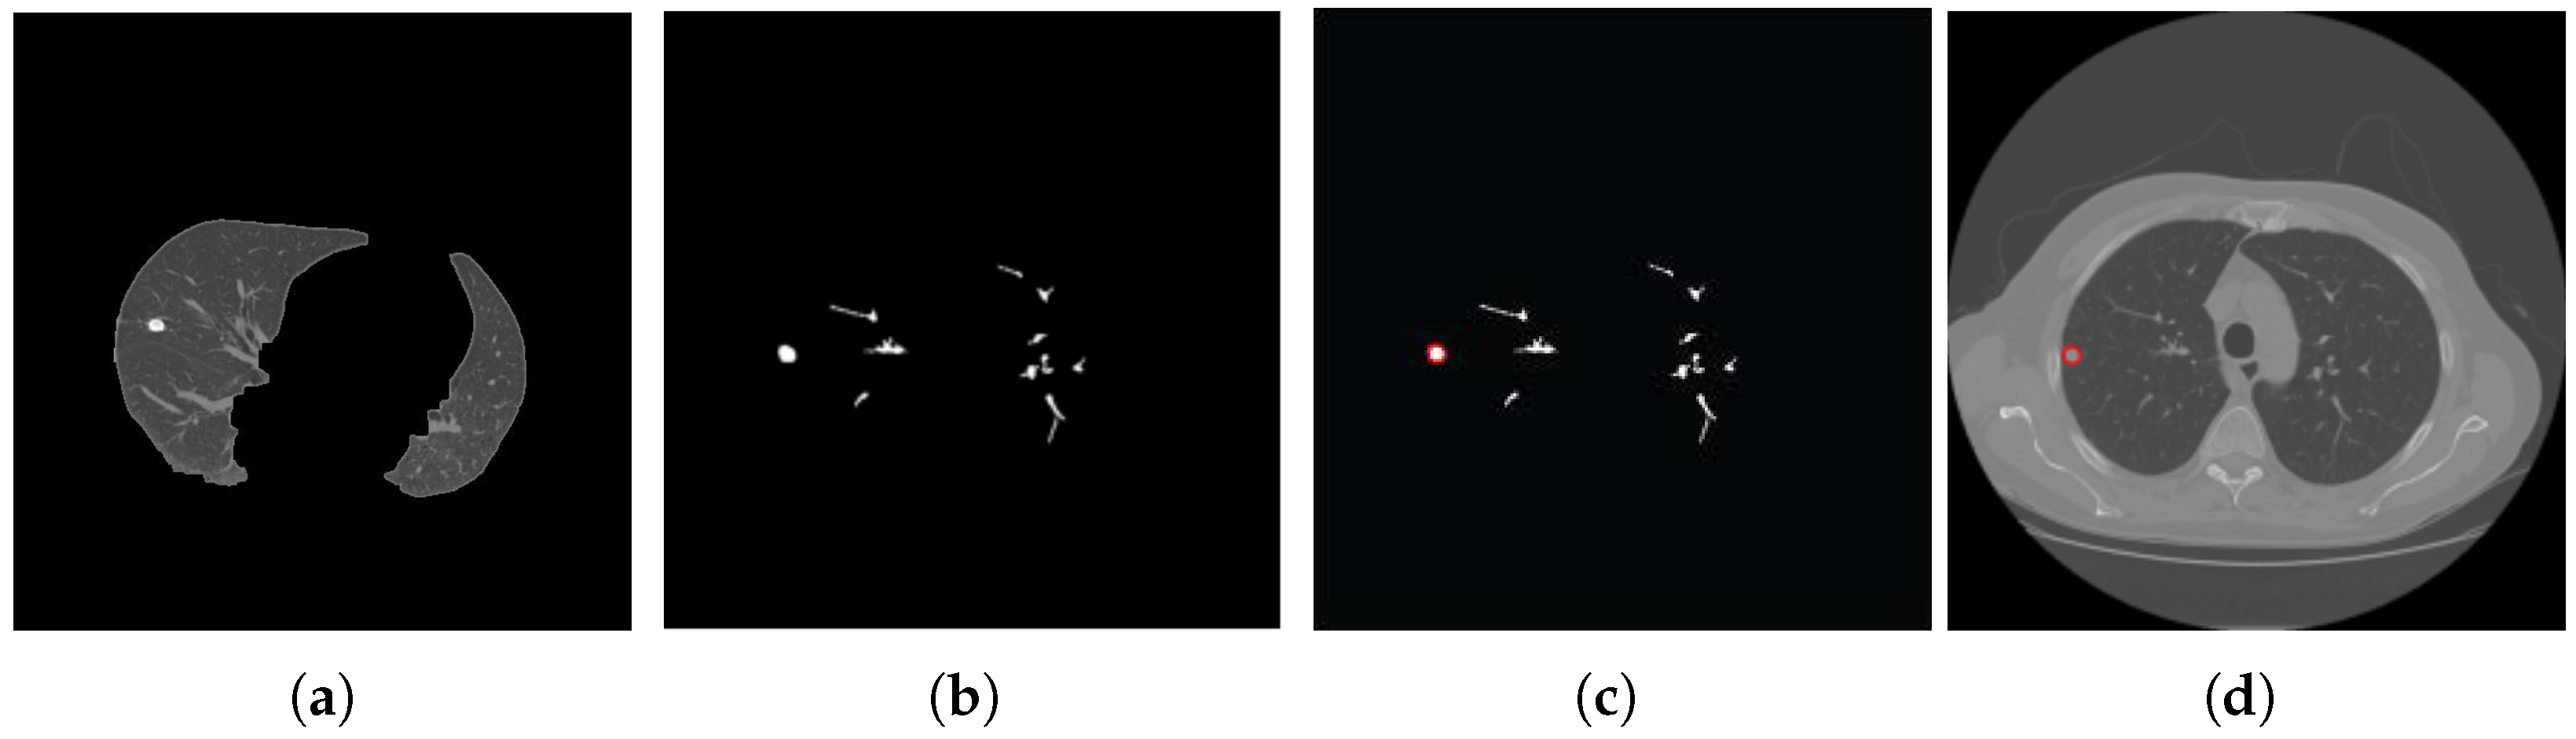
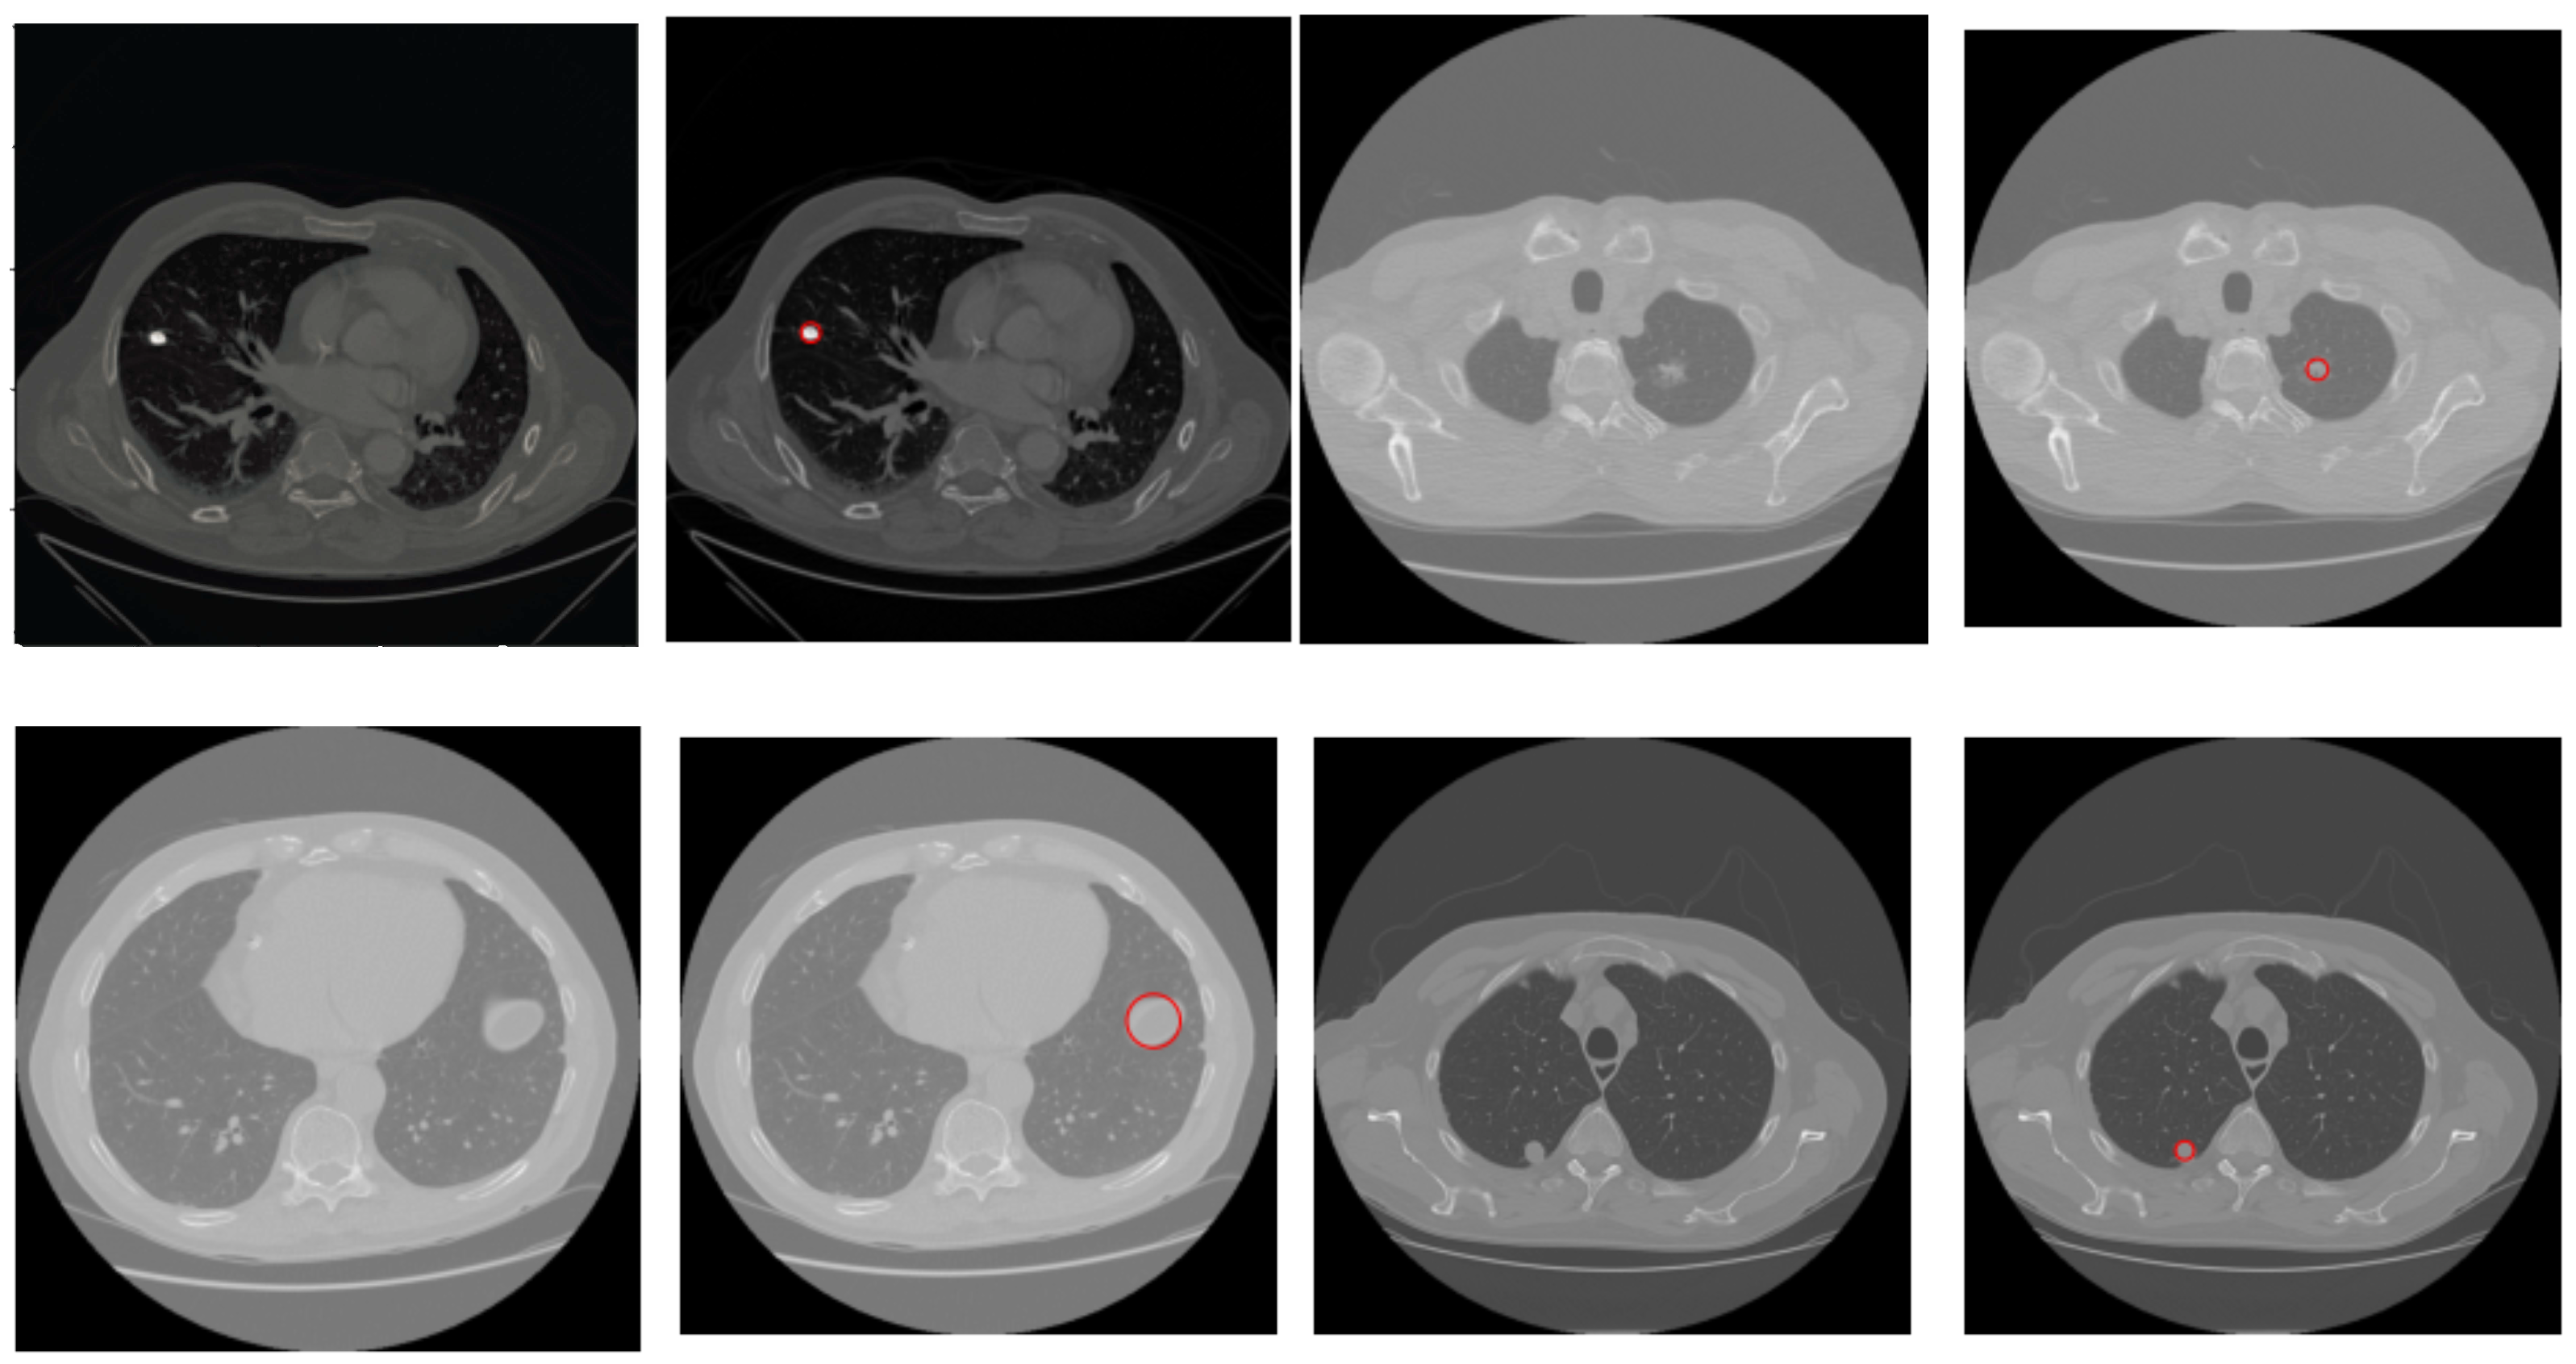
2.3. Nodule Detection

After the lungs are segmented, the next step is the extraction of vessels from the lungs. We achieve this by simply applying thresholding to the segmented lungs. The intensity levels of objects inside the lungs are lower than the lung background. We observe that a threshold value −500 is a good choice to extract vessels and nodules from the segmented lungs, as shown in Figure 8a. Following vessel extraction, morphological techniques, namely binary opening and binary closing, are used to eliminate the smaller objects from the area. We calculate the region of all the objects included in the vessel mask. Almost all nodules are circular, with white pixels covering most of the circle. As a result, we can disregard the additional objects with the elongation feature. We compute the diameter of each lesion to detect the nodule. The diameter threshold that we set to detect nodules is 3 mm because, in our dataset, the radiologists annotated the nodules within the range of 3–30 mm and this is the general nodule size in lung cancer. A few radiologists considered a nodule size of 2 mm but they later disregarded these annotations [41]. Figure 8c shows the nodule detected using the extracted nodule candidates (shown in Figure 8b). Figure 8d shows the detected nodule in the original image. The pseudocode of the proposed algorithm is presented in Algorithm 1.
Algorithm 1 Proposed Nodule Detection Algorithm
Require: A CT Image I of size M × N
Ensure: Detected nodule(s).
1: Normalize I to bring the intensity values within range 0–255
2: Suppress noise in I using Gaussian blur [ G ( x , y ) = 1 2 π σ 2 e x 2 + y 2 2 σ 2 ]
3: if I is a lung window then
4:    Compute histogram H of I
5:    Find the two local minima l a , l b in H
6:    [ τ 1 , τ 2 , τ 3 ] ← multi-Otsu( I , l a , l b )
7:  Threshold I using τ 2 to separate lungs from rest of the lung window image
8: else {I is a mediastinal window}
9:     μ g = 1 M N x = 1 M y = 1 N I ( x , y ) {Compute the global mean m u g of I}
10:    Use μ g to roughly separate divide I into two regions, Ω 1 and Ω 2 .
11:  μ 1 = 1 | Ω 1 | x , y Ω 1 ( x , y ) {Compute the local mean μ 1 of the region Ω 1 }
12:  μ 2 = 1 | Ω 2 | x , y Ω 2 ( x , y ) {Compute the local mean μ 2 of the region Ω 2 }
13:  τ = μ 1 + μ 2 2 {The threshold τ is then taken as the average of the two local means}
14: Threshold I using τ to separate lungs from rest of the mediastinal window image
15: end if
16: Threshold I using threshold value 500 This extracts vessels and nodules from the segmented lungs I.
17: I = OPEN (I) {OPEN is morphological binary open operator.}
18: I = CLOSE (I) {CLOSE is morphological binary open operator.}
19: Drop the objects in I that have the elongation feature, i.e., those that are not circular
20: Compute the diameter d of each lesion in I
21: if d 3 mm then
22:  Mark the region as nodule
23: else d < 3 mm
24:  Mark the region as non-nodule
25: end if
26:Highlight the nodule regions, if any, using red circles

3. Experiments and Results

In this section, we report the performance of the proposed algorithm. We also compare the results with other existing nodule detectors to show the effectiveness of the proposed method.

3.1. Dataset

The experiments are performed on the benchmark LUNA16 (LUng Nodule Analysis 2016) dataset [42]. It is derived from the publicly available LIDC/IDRI database. This data collection comprises labeled data from 888 patients. The data for each patient are composed of CT scan data and labeling (0 for non-cancer and 1 for cancer). Each image is in 3D MHD format with 2D slices of 512 × 512 dimensions. For each pixel within a 2D slice, the range of gray levels is from −1000 to 1000. The lung region varies in 2D slices of an image. MHD is a MetaImage medical format that contains a description file of an image. Each . M H D file comes with a . R A W file that contains explicit data of that image. The dataset characteristics are summarized in Table 1. A 3D representation of a lung CT scan is shown in Figure 9. The dataset can be downloaded from (accessed on 5 June 2023) https://luna16.grand-challenge.org/Download/.

3.2. Performance Evaluation and Comparison

We compute numerous performance parameters to assess the effectiveness of the proposed lung nodule detection algorithm. There are four possible outcomes when an image is tested with any lung nodule detection algorithm: if the image is cancerous and is predicted as cancerous, it is a true positive ( T P ); if the image is non-cancerous and is predicted as non-cancerous, it is a true negative ( T N ); if the image is non-cancerous but is predicted as cancerous, it is a false positive ( F P ); and if the image is cancerous but is predicted as non-cancerous, it is a false negative ( F N ). Based on this formation, we calculate the accuracy, sensitivity or recall, and precision values to test the performance of the proposed method.
Accuracy reflects all true positive and true negative results in detecting nodules. It calculates the percentage of accurately predicted data from all data points as follows:
A c c u r a c y = T N + T P T N + T P + F N + F N
Precision reflects all positive results that are actually positive marked by the radiologist.
P r e c i s i o n = T P T P + F P
Sensitivity or recall measures the percentage of successful results to determine the correct prediction.
R e c a l l = T P T P + F N
We computed all performance metrics on the test dataset and compared the results with existing similar approaches. Specifically, we selected the following methods for performance comparison: Nasser [43], Sang [44], Makaju [19], Xie [45], Alakwaa [31], Jin [46], and Khumancha [47]. The method proposed by Nasser et al. [43] employed an artificial neural network to determine whether or not lung nodules were present in the CT image. The method presented in [44] used U-Net [24], encoder–decoder [48], and MixNet [49] models. In Alakwaa [31], 3D-CNN is used to detect lung nodules from CT scans. They preprocessed the images first using the watershed algorithm for lung segmentation. The lung nodule detector presented in [47] also uses a 3D-CNN model to identify lung nodules using low-dose CT scan images. In [19], the watershed algorithm is used to segment lungs from CT scans and feature extraction is used to detect nodules and then send these features to an SVM for classification. In [45], the authors used R-CNN and 2D CNN models to detect lung nodules and classify true nodules, respectively.
The results of the proposed and the compared methods are presented in Table 2. The proposed algorithm achieves accuracy of 0.94, which is better than all compared methods except the Nasser [43] algorithm, which performs marginally better. However, they do not report the other metrics, making it impossible to draw a fair comparison. In terms of the precision and recall measures, the proposed algorithm outperforms the compared methods by achieving scores of 0.92 and 0.97, respectively. In recent years, deep-learning-based methods have been extensively explored in medical image analysis and showed good performance, particularly for image segmentation and classification problems. These approaches, however, require huge amounts of tagged data for training. Preparing ground truth for medical data is challenging because it needs expert radiologists and it is a very time-consuming task. Therefore, these approaches are not very practical. The proposed method does not require any such training and yet it can produce appreciable results.
In Figure 10, we present a few results of the proposed algorithm on test images from the LUNA16 dataset. The results and statistics presented in Table 2 show that the proposed method is quite accurate and reliable. Moreover, it works for both lung window scans and mediastinal window scans and achieves better accuracy.
The proposed method was implemented in Python and its source code has been publicly released for research purposes at (accessed on 6 June 2023). https://github.com/Muflah-cloud/lung-cancer-detection. All experiments were performed on a laptop running macOS Big Sur with a 2.4 GHz Dual-Core Intel Core i7 and 16GB RAM. The execution time of the proposed method was computed on the entire dataset and averaged to analyze the computational efficiency. Our algorithm takes 6.25 seconds on average to process one CT scan, which shows that the method is computationally efficient.

4. Conclusions

In this paper, we present a lung nodule detection algorithm using CT images. The algorithm is a combination of two methods, one for detecting the nodules in the lung window and the other for analyzing the mediastinal window for nodules. The proposed algorithm is simple; it uses multi-Otsu-based thresholding and a novel global–local-mean-based segmentation to extract the lungs. The watershed algorithm and thresholding are used to find the nodule candidate regions, which are identified using their radii. The algorithm was tested on the LUNA16 dataset with 94% detection accuracy, making it superior to many existing techniques, because it handles multiple window types for segmentation and detects nodules solely through simple image processing operations. As we chose to extend our segmentation approach to a multi-modality context, the originality of our method has the potential to exert a significant effect in detecting lung nodules.

Author Contributions

M.N. and Z.S. conceived the idea. M.N., M.S.F., Z.S. and M.H.K. designed the algorithm. M.N. and M.S.F. carried out the experiments and wrote the main manuscript text. M.N., M.S.F., Z.S. and M.H.K. performed the validation and discussion. M.S.F., Z.S. and M.H.K. supervised the research and proofread the manuscript. All authors have read and agreed to the published version of the manuscript.

Funding

This work has no funding.

Institutional Review Board Statement

Not applicable.

Informed Consent Statement

Not applicable.

Data Availability Statement

The data used in this study are openly available in the LIDC-IDRI repository and can be found at (accessed on 6 June 2023) https://luna16.grand-challenge.org/Data/.

Conflicts of Interest

The authors declare no conflict of interest.

References

  1. Key Statistics for Lung Cancer. Available online: https://www.cancer.org/cancer/lung-cancer/about/key-statistics.html (accessed on 6 June 2023).
  2. Lung Cancer—Non-Small Cell: Statistics. Available online: https://www.cancer.net/cancer-types/lung-cancer-non-small-cell/statistics (accessed on 6 June 2023).
  3. Society, A.C. What Is Lung Cancer? 2019. Available online: https://www.cancer.org/cancer/lung-cancer/about/what-is.html (accessed on 6 June 2023).
  4. Hacking, C.; Hsu, C. Dual Energy CT. 2014. Available online: https://radiopaedia.org/articles/31353 (accessed on 6 June 2023). [CrossRef]
  5. System, L.U.H. Technology Developed to Improve Lung Cancer Detection, Treatment. 2014. Available online: https://www.sciencedaily.com/releases/2014/11/141113194950.htm (accessed on 28 June 2022).
  6. WHO. Preventing Cancer. Available online: https://www.who.int/activities/preventing-cancer (accessed on 6 June 2023).
  7. Li, Q.; Li, F.; Doi, K. Computerized Detection of Lung Nodules in Thin-Section CT Images by Use of Selective Enhancement Filters and an Automated Rule-Based Classifier. Acad. Radiol. 2008, 15, 165–175. [Google Scholar] [CrossRef] [PubMed] [Green Version]
  8. Abdillah, B.; Bustamam, A.; Sarwinda, D. Image processing based detection of lung cancer on CT scan images. J. Phys. Conf. Ser. 2017, 893, 012063. [Google Scholar] [CrossRef]
  9. Wason, J.V.; Nagarajan, A. Image processing techniques for analyzing CT scan images towards the early detection of lung cancer. Bioinformation 2019, 15, 596–599. [Google Scholar] [PubMed]
  10. Uzelaltinbulat, S.; Ugur, B. Lung tumor segmentation algorithm. Procedia Comput. Sci. 2017, 120, 140–147. [Google Scholar] [CrossRef]
  11. Gaikwad, A.; Inamdar, A.; Behera, V. Lung cancer detection using digital Image processing On CT scan Images. Int. Res. J. Eng. Technol. 2016, 3, 2395-0056. [Google Scholar]
  12. Nardi-Agmon, I.; Abud-Hawa, M.; Liran, O.; Gai-Mor, N.; Ilouze, M.; Onn, A.; Bar, J.; Shlomi, D.; Haick, H.; Peled, N. Exhaled Breath Analysis for Monitoring Response to Treatment in Advanced Lung Cancer. J. Thorac. Oncol. 2016, 11, 827–837. [Google Scholar] [CrossRef] [Green Version]
  13. Khan, M.H.; Helsper, J.; Farid, M.S.; Grzegorzek, M. A computer vision-based system for monitoring Vojta therapy. Int. J. Med Informatics 2018, 113, 85–95. [Google Scholar] [CrossRef]
  14. Khan, M.H.; Schneider, M.; Farid, M.S.; Grzegorzek, M. Detection of Infantile Movement Disorders in Video Data Using Deformable Part-Based Model. Sensors 2018, 18, 3202. [Google Scholar] [CrossRef] [Green Version]
  15. de Kock, R.; van den Borne, B.; Soud, M.Y.E.; Belderbos, H.; Stege, G.; de Saegher, M.; van Dongen-Schrover, C.; Genet, S.; Brunsveld, L.; Scharnhorst, V.; et al. Circulating biomarkers for monitoring therapy response and detection of disease progression in lung cancer patients. Cancer Treat. Res. Commun. 2021, 28, 100410. [Google Scholar] [CrossRef]
  16. Fu, W.; Tang, D.; Yang, F.; Wang, J.; Wu, Y.; Shen, X.; Gao, W. Short-term home remote monitoring of patients after lung cancer surgery. Clin. Surg. Oncol. 2022, 1, 100004. [Google Scholar] [CrossRef]
  17. Yeganeh, A.; Shadman, A.; Shongwe, S.C.; Abbasi, S.A. Employing evolutionary artificial neural network in risk-adjusted monitoring of surgical performance. Neural Comput. Appl. 2023, 35, 10677–10693. [Google Scholar] [CrossRef]
  18. Kadir, T.; Gleeson, F. Lung cancer prediction using machine learning and advanced imaging techniques. Transl. Lung Cancer Res. 2018, 7, 304–312. [Google Scholar] [CrossRef]
  19. Makaju, S.; Prasad, P.; Alsadoon, A.; Singh, A.; Elchouemi, A. Lung cancer detection using CT scan images. Procedia Comput. Sci. 2018, 125, 107–114. [Google Scholar] [CrossRef]
  20. Khehrah, N.; Farid, M.S.; Bilal, S.; Khan, M.H. Lung nodule detection in CT images using statistical and shape-based features. J. Imaging 2020, 6, 6. [Google Scholar] [CrossRef] [Green Version]
  21. LeCun, Y.; Bengio, Y.; Hinton, G. Deep learning. Nature 2015, 521, 436–444. [Google Scholar] [CrossRef]
  22. Maqsood, A.; Farid, M.S.; Khan, M.H.; Grzegorzek, M. Deep Malaria Parasite Detection in Thin Blood Smear Microscopic Images. Appl. Sci. 2021, 11, 2284. [Google Scholar] [CrossRef]
  23. Bhatia, S.; Sinha, Y.; Goel, L. Lung cancer detection: A deep learning approach. In Soft Computing for Problem Solving; Springer: Singapore, 2019; pp. 699–705. [Google Scholar]
  24. Ronneberger, O.; Fischer, P.; Brox, T. U-Net: Convolutional Networks for Biomedical Image Segmentation. In Proceedings of the Medical Image Computing and Computer-Assisted Intervention—MICCAI 2015; Navab, N., Hornegger, J., Wells, W.M., Frangi, A.F., Eds.; Springer International Publishing: Cham, Switzerland, 2015; pp. 234–241. [Google Scholar]
  25. He, K.; Zhang, X.; Ren, S.; Sun, J. Deep Residual Learning for Image Recognition. In Proceedings of the 2016 IEEE Conference on Computer Vision and Pattern Recognition (CVPR), Las Vegas, NV, USA, 27–30 June 2016; pp. 770–778. [Google Scholar] [CrossRef] [Green Version]
  26. Asuntha, A.; Srinivasan, A. Deep learning for lung Cancer detection and classification. Multimed. Tools Appl. 2020, 79, 7731–7762. [Google Scholar] [CrossRef]
  27. Huidrom, R.; Chanu, Y.J.; Singh, K.M. Pulmonary nodule detection on computed tomography using neuro-evolutionary scheme. Signal Image Video Process. 2018, 13, 53–60. [Google Scholar] [CrossRef]
  28. Masood, A.; Yang, P.; Sheng, B.; Li, H.; Li, P.; Qin, J.; Lanfranchi, V.; Kim, J.; Feng, D.D. Cloud-Based Automated Clinical Decision Support System for Detection and Diagnosis of Lung Cancer in Chest CT. IEEE J. Transl. Eng. Health Med.-JTEHM 2020, 8, 1–13. [Google Scholar] [CrossRef]
  29. Shakeel, P.M.; Burhanuddin, M.A.; Desa, M.I. Lung cancer detection from CT image using improved profuse clustering and deep learning instantaneously trained neural networks. Measurement 2019, 145, 702–712. [Google Scholar] [CrossRef]
  30. Chon, A.; Balachandar, N.; Lu, P. Deep Convolutional Neural Networks for Lung Cancer Detection; Standford University: Stanford, CA, USA, 2017; pp. 1–9. [Google Scholar]
  31. Alakwaa, W.; Nassef, M.; Badr, A. Lung cancer detection and classification with 3D convolutional neural network (3D-CNN). Lung Cancer 2017, 8, 409. [Google Scholar] [CrossRef] [Green Version]
  32. Kuan, K.; Ravaut, M.; Manek, G.; Chen, H.; Lin, J.; Nazir, B.; Chen, C.; Howe, T.C.; Zeng, Z.; Chandrasekhar, V. Deep learning for lung cancer detection: Tackling the kaggle data science bowl 2017 challenge. arXiv 2017, arXiv:1705.09435. [Google Scholar]
  33. Lu, H.; Kim, J.; Qi, J.; Li, Q.; Liu, Y.; Schabath, M.B.; Ye, Z.; Gillies, R.J.; Balagurunathan, Y. Multi-Window CT Based Radiological Traits for Improving Early Detection in Lung Cancer Screening. Cancer Manag. Res. 2020, 12, 12225–12238. [Google Scholar] [CrossRef] [PubMed]
  34. Sung Liao, P.; Sheng Chen, T.; Choo Chung, P. A fast algorithm for multilevel thresholding. J. Inf. Sci. Eng. 2001, 17, 713–727. [Google Scholar]
  35. Feng, Y.; Zhao, H.; Li, X.; Zhang, X.; Li, H. A multi-scale 3D Otsu thresholding algorithm for medical image segmentation. Digit. Signal Process. 2017, 60, 186–199. [Google Scholar] [CrossRef] [Green Version]
  36. Malarvel, M.; Sethumadhavan, G.; Bhagi, P.C.R.; Kar, S.; Thangavel, S. An improved version of Otsu’s method for segmentation of weld defects on X-radiography images. Optik 2017, 142, 109–118. [Google Scholar] [CrossRef]
  37. Liu, H.; Rashid, T.; Habes, M. Cerebral Microbleed Detection Via Fourier Descriptor with Dual Domain Distribution Modeling. In Proceedings of the 2020 IEEE 17th International Symposium on Biomedical Imaging Workshops (ISBI Workshops), Iowa City, IA, USA, 4 April 2020; pp. 1–4. [Google Scholar] [CrossRef]
  38. Otsu, N. A Threshold Selection Method from Gray-Level Histograms. IEEE Trans. Syst. Man Cybern. 1979, 9, 62–66. [Google Scholar] [CrossRef] [Green Version]
  39. Digabel, H.; Lantuéjoul, C. Iterative algorithms. In Proceedings of the 2nd European Symposium Quantitative Analysis of Microstructures in Material Science, Biology and Medicine; Scientific Research Publishing Inc.: Wuhan, China, 1978; pp. 85–89. [Google Scholar]
  40. Kornilov, A.S.; Safonov, I.V. An overview of watershed algorithm implementations in open source libraries. J. Imaging 2018, 4, 123. [Google Scholar] [CrossRef] [Green Version]
  41. Lung Nodule Analysis 2016. 2016. Available online: https://luna16.grand-challenge.org/Data/ (accessed on 6 June 2023).
  42. Setio, A.A.A.; Traverso, A.; de Bel, T.; Berens, M.S.; van den Bogaard, C.; Cerello, P.; Chen, H.; Dou, Q.; Fantacci, M.E.; Geurts, B.; et al. Validation, comparison, and combination of algorithms for automatic detection of pulmonary nodules in computed tomography images: The LUNA16 challenge. Med Image Anal. 2017, 42, 1–13. [Google Scholar] [CrossRef] [Green Version]
  43. Nasser, I.M.; Abu-Naser, S.S. Lung cancer detection using artificial neural network. Int. J. Eng. Inf. Syst. (IJEAIS) 2019, 3, 17–23. [Google Scholar]
  44. Nasrullah, N.; Sang, J.; Alam, M.S.; Xiang, H. Automated detection and classification for early stage lung cancer on CT images using deep learning. In Proceedings of the Pattern Recognition and Tracking XXX; International Society for Optics and Photonics: Bellingham, WA, USA, 2019; Volume 10995, p. 109950S. [Google Scholar]
  45. Xie, H.; Yang, D.; Sun, N.; Chen, Z.; Zhang, Y. Automated pulmonary nodule detection in CT images using deep convolutional neural networks. Pattern Recognit. 2019, 85, 109–119. [Google Scholar] [CrossRef]
  46. Jin, X.Y.; Zhang, Y.C.; Jin, Q.L. Pulmonary nodule detection based on CT images using convolution neural network. In Proceedings of the 2016 9th International Symposium on Computational Intelligence and Design (ISCID), Hangzhou, China, 10–11 December 2016; Volume 1, pp. 202–204. [Google Scholar]
  47. Khumancha, M.B.; Barai, A.; Rao, C.R. Lung cancer detection from computed tomography (CT) scans using convolutional neural network. In Proceedings of the 2019 10th International Conference on Computing, Communication and Networking Technologies (ICCCNT), Kanpur, India, 6–8 July 2019; pp. 1–7. [Google Scholar]
  48. Ye, J.C.; Sung, W.K. Understanding Geometry of Encoder-Decoder CNNs. In Proceedings of the 36th International Conference on Machine Learning, Long Beach, CA, USA, 9–15 June 2019; Chaudhuri, K., Salakhutdinov, R., Eds.; Proceedings of Machine Learning Research. Volume 97, pp. 7064–7073. [Google Scholar]
  49. Tan, M.; Le, Q.V. Mixconv: Mixed depthwise convolutional kernels. arXiv 2019, arXiv:1907.09595. [Google Scholar]
Figure 1. Sample CT scan in lung window (a), mediastinal window (b).
Applsci 13 07256 g001
Figure 2. (a) Histogram of lung window shown in Figure 1a, (b) histogram of mediastinal window shown in Figure 1b.
Applsci 13 07256 g002
Figure 3. The two threshold values given by the multi-Otsu algorithm on the lung window shown in Figure 1a.
Applsci 13 07256 g003
Figure 4. Lung segmentation results using the proposed algorithm; in each pair, the left is the test image and the right is the segmented lung.
Applsci 13 07256 g004
Figure 5. A sample mediastinal window (a), its histogram (b), and a lung segmented using Otsu’s method (c).
Applsci 13 07256 g005
Figure 6. The top two rows show a few examples where the segmentation using the global threshold is successful, and the bottom two rows show some examples where the method fails. In each pair, the left is the test image and the right is the segmentation result.
Applsci 13 07256 g006
Figure 7. (a) Segmentation results using the global mean as the threshold, (b) segmentation results of the same images using the local mean threshold, (c) segmentation results after applying the watershed-based refinement.
Applsci 13 07256 g007
Figure 8. (a) Segmented lungs, (b) extracted nodule, (c) nodule mask, (d) corresponding original image with nodule highlighted in red circle.
Applsci 13 07256 g008
Figure 9. A 3D representation of a sample MHD image from LUNA16 dataset.
Applsci 13 07256 g009
Figure 10. Results of the proposed algorithm on a few images from the dataset. In each pair, the left is the test image and the right is the image, with the detected nodule highlighted in a red circle.
Applsci 13 07256 g010
Table 1. LUNA16 dataset description.
AttributeProperty
Number of CT scans888
Annotated lung nodule1186
Format3D MHD
2D slice size512 × 512
Table 2. Nodule detection performance comparison of the proposed and the compared methods in terms of precision, recall, and accuracy. The dataset used in evaluation is listed under ‘Dataset’. ‘—’ indicates the unavailability of the score.
MethodAccuracyRecallPrecisionDataset
Nasser [43]0.96
Sang [44]0.94LIDC-IDRI
Makaju [19]0.92
Jin [46]0.840.820.86
Xie [45]0.86LUNA16
Alakwaa [31]0.86LUNA16
Khumancha [47]0.820.89LUNA16
Proposed0.940.970.92LUNA16
Disclaimer/Publisher’s Note: The statements, opinions and data contained in all publications are solely those of the individual author(s) and contributor(s) and not of MDPI and/or the editor(s). MDPI and/or the editor(s) disclaim responsibility for any injury to people or property resulting from any ideas, methods, instructions or products referred to in the content.

