Abstract
Studies that use rivers in a last-mile delivery context are scarce. This research considers the first multimodal alternative based on a barge for parcel delivery activities. It proposes two sustainable network designs for a two-echelon distribution. The efficiency of scenarios is assessed through performance indicators. A three-stage decomposition heuristic is used. Allocation of the customers to the closest satellite at the first stage uses a non-supervised machine learning clustering method, 2D-k-means. The last two stages, comprising the two echelons routing, are solved using a heuristic based on the nearest neighbor procedure. The fixed costs decrease by 41% and energy consumption by 92% when applying a river transportation mode and e-cargo bikes in the distribution network’s first and second echelon, respectively. Future research avenues are to render the results more realistic with the consideration of other costs and a larger network.
1. Introduction
In the last five years, an expansion of e-commerce has been taking place worldwide, reaching a growth of around 21% [1]. The strong measures that several countries implemented to deal with the COVID-19 pandemic, such as the lockdown and home office, not only reinforced the growing trend in 2020 [2] but also caused supply chain and logistics managers to rethink their operations [3]. E-shopping offers a lot of possibilities to the consumer in a comfortable way, receiving all deliveries in different ways; for example, the two most common last-mile delivery modes are (1) delivery to a selected customer destination point like home delivery or at the workplace. (2) Click-and-collect in a store, mailbox, or at a partner location. Last-mile delivery operations include parcel sorting, transportation, and hand-over to the consumer at the preferred delivery mode and location [4,5].
In addition, the concentration of population in urban areas is increasing; about 3.5 billion people live in cities [6], and the number will still grow since cities are where the main economic, cultural, entertainment, and educational activities of a country are concentrated. Moreover, according to [7], many home deliveries of online retail orders are small parcels that must be delivered in dispersed points inside urban areas. Indeed, urban freight transportation has become an important component of urban planning, along with many challenges that arise in the operations associated with freight transportation. For instance, last-mile deliveries cause up to 28% of the total delivery costs [8] and are related to negative environmental impact issues such as air pollution and traffic congestion. Transport systems obstruct themselves and other road users by the invasion of public space during pickup and delivery operations in urban areas. European urban freight transportation causes approximately 23% of carbon dioxide equivalent (CO2e) emissions [9] and between 30% to 50% of other pollutants in cities [10].
Different city logistics initiatives and strategies have been developed and modeled to improve efficiency, relieve traffic congestion, and reduce GreenHouse Gas (GHG) emissions. One of those strategies is the redesign of urban distribution networks by adding intermediate nodes such as hubs, satellites, or other types of urban logistic spaces [11,12,13]. Other strategies are the investment in new logistic resources, information technology systems, and automation technology [14]. When designing the last-mile supply network, the most employed model is the two-echelon distribution system, which consists of delivering parcels from a depot to a set of satellites and from there to a set of customers geographically dispersed. Practitioners and academicians frequently approach this logistics distribution problem as a two-echelon vehicle routing problem (2E-VRP) [15]. Due to the high computational complexity of the problem, many researchers are motivated to design and propose approximate algorithms (heuristics and metaheuristics) to solve it.
Multimodal transportation, such as public transport, Unmanned Aerial Vehicles (UAVs), Autonomous Vehicles (AVs), Electric Modular Vehicles (EMVs), Electric Vehicles (EVs), and cargo bikes, to improve the efficiency and sustainability of urban parcel distribution systems. In the context of innovative solutions to reach more sustainable deliveries, our study proposed two scenarios in which one of these aims to use the inland waterways in such a way that water transport can be used in the first echelon as an innovative way for parcel distribution. In addition, the second echelon has a set of electric cargo bikes (e-cargo bikes) that pick up parcels at the ports designated as fluvial satellites, where a barge will deliver the packages for further last-mile distribution. This research aims to fill the gap in addressing these attributes of urban parcel delivery systems. The research to be challenged was presented at a conference [16]. This paper studied the problem of designing delivery routes in two-echelon distribution networks proposing an approximation algorithm with a three-stage decomposition strategy. In the first stage, allocation of the customers to the closest satellite at the first stage uses a non-supervised machine learning clustering method 2D-k-means; the second and third stages are the routing parts and were solved by the implementation of an approximation algorithm based on the Nearest Neighbor (NN) routing heuristic.
The remainder of this article is organized into five sections. In Section 2, we review related literature. Section 3 discusses the methodology applied to our research. Section 4 explains the parameters to calculate the indicators and reports the results. Section 5 concludes the paper and highlights some perspectives for future research.
2. Literature Review
A literature review of some publications about routing problems in single and two-echelon distribution systems. Since this study contains routing decisions using multimodal transportation, we also present an overview of different studies that considered different transportation modes to make parcel delivery in an urban context.
2.1. Vehicle Routing Problem (VRP)
The main purpose of the VRP is to satisfy the needs of a set of customers with minimal cost that is proportional to the total distance traveled by the fleet of vehicles [17]. This problem was introduced by [18]. From this study, the number of research on this topic has been growing exponentially, not only in the creation of solution approaches but also in the analysis of variants that arise from the basic model and take into consideration more real-life issues. Several variants have been studied in the literature: heterogeneous fleet of vehicles, delivery time windows [19], and multi-depot [20]. Moreover, multi-echelon distribution systems are also modeled as an important variant of this problem; for example, the 2E-VRP [15] is commonly used to model last-mile distribution networks. The increase in the number of documents about this topic through the last eight years highlights the relevance of this problem [21], reaching the highest number of studies in the year 2021. Perspectives about this problem are related to the use of different and eco-friendly transportation modes, time windows, multiple depots, multi-echelon distribution systems, and split deliveries [22].
2.2. Transportation Modes in Urban Parcel Delivery Systems
Existing frameworks for last-mile delivery planning lack important parameters like those that drive customer decisions or the sustainability of the delivery network. Currently, sustainable practices are very important and have special influences on shoppers’ decisions. So, some of the largest retailers are driving the shift to fossil fuel-free deliveries [4]. New variants of VRP have been studied to have more efficient and sustainable applications for e-commerce, parcel delivery, and city logistics distribution in the retail sector. Different transportation modalities are taken into consideration in the literature for urban parcel delivery systems; some of these are UAVs [23], AVs such as delivery robots [24,25], and autonomous mobile lockers (AMLs) [26]. The use of public transport combines people and goods using the metro [27], bus, tram, subway [7], water bus [28], EMVs [9], cargo bikes [26,29,30], and finally, EVs [31].
Results obtained in scenarios using cargo bikes for freight transportation in inner-city areas positioned this transportation mode as a promising alternative to conventional vans to make last-mile delivery; experiments show cost and CO2e emissions savings [32,33]. The results of these studies promote zero-emission strategies for last-mile deliveries, especially in low-emission zones in inner-cities areas. The adoption of cargo bikes has become popular in several cities since it is a sustainable alternative to the current unsustainable model of freight transport. Pedal Me, in London, is one of the successfully executed projects. This initiative is approximately 1.61 times faster than the one performed by a van. In 98 days, a total of 3896 kg of CO2e was saved [34]. With such scenarios, tonnes of CO2e can be saved per year.
Due to the objective of reaching free CO2e city logistics in inner-cities areas [35], many European cities, as in other countries, have already been regulating the flows of non-sustainable freight vehicles (mostly with diesel engines) into defined inner-city areas, with for example low-emission zones, or city tolls [31]. According to [36], EVs could be an important part of the solution to achieve this goal. Ref. [37] evaluated some policies that encouraged the use of EVs and measured the impact of the use of this transportation mode on the environment.
From this partial literature review, we can derive the importance and relevance of increasing the efficiency of urban parcel distribution systems due to the different public policies and city configuration typologies. To design sustainable distribution networks with lower emission levels using the great diversity of transportation modes that can be adapted to each situation, with reasonable costs and efficient routes to ensure customer satisfaction. In the literature reviewed so far, it was found that there are different transportation modes applied to urban parcel delivery. Although vessels are used for long distances, few studies in the scientific community consider making parcel distribution through the city’s waterways with small boats. However, some studies in Amsterdam proved that this initiative could reduce congestion in the city center, satisfying the delivery needs of retailers without interfering with other fluvial activities [38,39]. Consequently, we want to address the 2E-VRP in two different scenarios that consider multimodal transportation to first determine the allocation of customers to the satellites, then to find a set of routes for the first and second echelon, so electric cargo bikes (e-cargo bikes) perform the last-mile delivery. The problem objective is the minimization of the total travel time of the delivery network. So, we can obtain very useful results in terms of CO2e emissions, distance, land use, energy consumption, and fixed cost that can be applied to real cases in cities that have waterways in their configurations.
3. Methodology
The NP-hardness of the 2E-VRP represents a challenge for researchers because approximate algorithms such as heuristics and metaheuristics are needed to solve combinatorial optimization problems by finding feasible solutions. Decomposition strategies are used to solve large-scale real-world problems [40] and overcome the NP-hardiness of the 2E-VRP. To solve this problem, a decomposition algorithm is proposed, as used in [41]. The problem is complex, so it is split into three subproblems ensuring the feasibility and the quality of the solution obtained (see Figure 1). The first subproblem is a 2D-k-means clustering to allocate the delivery points to predetermined satellites; this procedure is made before route optimization to reduce the computational complexity. We considered the latitude and the longitude of each customer’s geographic location as k-means clustering groups customers into clusters based on the two-dimensional Euclidean distance [42,43]. Let k be the number of defined clusters, which corresponds to the number of satellites in the distribution network. The centroid of each cluster k is chosen randomly. The data is analyzed, and the distances between each client and the centroids are determined. Then, for each element, the closest cluster centroid is assigned, and the new centroids of k clusters are updated. This method has to be repeated until all clients have been assigned to the appropriate cluster. Finally, the clustering results are kept and used to build the initial solution for the routing optimization. The second sub-problem determines the routing for the last-mile delivery from satellites to the customers. The third sub-problem proposes to find a set of routes for the first echelon from the depots to the corresponding satellites.
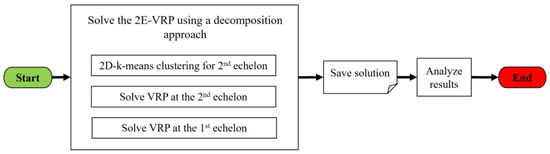
Figure 1.
Represents the decomposition approach applied to solve the 2E-VRP.
The last two sub-problems were solved by an algorithm based on the NN search [44]. This procedure seeks to build Hamiltonian cycles through links to nearby neighbors. It has been frequently applied to solve the VRP efficiently, even in large-size instances [45,46,47]. To create the routes, we use the following steps:
- Define the first point of the route (depot or satellite);
- If the first point is the depot, continue with step 4;
- If the starting point is a satellite, begin the routing with step 4 in the satellite of the cluster i;
- Find the nearest node to the last node added to the path. If the nearest node is already in the path, then choose the next closest;
- Repeat step 4 until the vehicle of the echelon reaches its maximum capacity;
- Connect the last visited node to the depot or satellite (as appropriate) to form the tour. Calculate the distance traveled by the vehicle and the total route time;
- If there are unvisited nodes, add one more vehicle and return to step 4;
- If there are unvisited clusters, return to step 3 in cluster i + 1.
The instances that were used to solve this problem were taken from a dataset previously proposed by [21], where a case study was presented to solve a parcel distribution problem in an urban delivery system. In this case, a small instance of 50 randomly distributed customers was generated within the city of Paris, France (Figure 2). In Paris, e-commerce accounts for 9.8% of retail trade. This generates 2.8 million weekly goods movements in the greater Paris metropolitan area. Many products sold through e-commerce are delivered to the consumer via carriers operating on the messenger system. These include all manufactured products. The transport of parcels requires a specific organization. The last mile is very important in this scheme, as the branch is not necessarily located in the direct vicinity of the consumer. In addition, the distribution network will have different characteristics in the first echelon. Two different transportation modes will be used to serve the satellites depending on the case. Figure 2 shows three nodes in red which are referred to as fluvial satellites and will be served by a barge (Scenario 1), while the nodes colored in yellow will be the satellites of Scenario 2, which a delivery van will serve. The satellites are located within the city and will act as centroids to cluster customers in such a way that they are assigned to the closest satellite to make last-mile distribution more efficient.
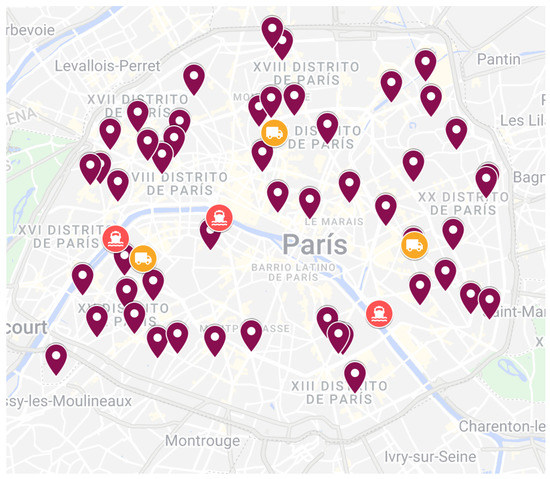
Figure 2.
Distribution of customers, fluvial satellites, and road satellites in Paris.
Two scenarios are proposed with the aim of making comparisons through performance indicators such as distance traveled, travel time, CO2e emissions, fixed cost of each vehicle, energy consumption, and land use. These indicators will be explained further in Section 4. The proposed scenarios are described next:
- Scenario 1: In this scenario, we considered a depot located outside the town and is located near the Seine River. A barge begins its trip in the depot and will attend two previously defined ports inside Paris that will be the satellites of this distribution network (fluvial satellites); from these satellites, e-cargo bikes as second-echelon vehicles can serve the customers.
- Scenario 2: In this scenario, the depot is located outside the town but not necessarily near the river. The fleet of the first echelon is composed of delivery vans, and this transportation mode serves a set of satellites located inside the town. The second echelon is like the one proposed in Scenario 1 but with different satellite locations (the number of customers and the transportation mode used in the second-echelon fleet is the same).
4. Results
The solution procedure was coded in Python, and experiments were run on a computer with processor Intel® Core™ i7-10510U, CPU at 2.3 GHz, and 16 GB RAM. Two main scenarios were evaluated. Regarding the scenarios, Scenario 1 considers three fluvial satellites located in predetermined ports next to the Seine River; these satellites do not have limited capacity. In addition, a barge is the transportation mode used to serve the satellites in the first echelon and e-cargo bikes in the second echelon.
Scenario 2 consists of a set of three uncapacitated satellites located inside Paris and are not fluvial ports. The distribution network in this scenario has a heterogeneous fleet. The fleet of vehicles is composed of delivery vans (diesel-fueled) for the first echelon, and the second echelon has the same transportation mode as Scenario 1. For the generated instance, the transportation modes considered will have load capacities that are proportional to the type of vehicle. These are not the actual capacities for the purpose of this research. Further studies will be done to extend this problem to the actual instance, which comprises more than 90,000 delivery points. The dataset is provided by a French parcel delivery company whose name must be kept confidential. The capacity of the barge, delivery van, and e-cargo bike is respectively 50 kg, 45 kg, and 8 kg.
Key performance indicators were considered to compare both scenarios and see how sustainable they are. The number of vehicles, CO2e emissions, fixed cost, energy consumption, and land use were some of them. The CO2e is a universal measurement used to indicate, in terms of CO2e, the equivalent of each of the greenhouse gasses with respect to its potential for global warming [48]. Land use is considered primarily to ensure that the distribution network does not invade public space in large proportions. Fixed costs allow decision-makers to determine which scenario suits their needs better. Energy consumption allows for monetization of the cost of the energy (diesel or electricity) that each type of vehicle needs to perform the delivery activities. Table 1 shows the factors that were used to calculate the indicators and the average travel speed for each type of vehicle.

Table 1.
Specificities of each mean of transportation.
For first-echelon results, see Table 2. Scenario 1 has the best results in terms of distance, CO2e emissions, fixed cost, and energy consumption, as these indicators depend on the distance traveled by the barge. However, due to the travel speed of this transportation mode and the maximum speed allowed on the Seine River, which is 15 km/h, the travel time is longer than Scenario 2. Moreover, the area occupied by the barge in the river is 66.98 m2 since the barge is bigger than the delivery van selected in this study. In Scenario 2, the complete delivery operation of the first echelon can be performed in 2.89 h, which is 1.12 h faster than in Scenario 1, even if the distance is greater to arrive at the desired delivery point (satellite).
Table 2.
First-echelon results per indicator.
In the second echelon, the customers are clustered in three groups that are the number of satellites in each scenario. This clustering was performed to reduce the distance between the delivery points and the satellite (centroid of the cluster) in such a way that clients are allocated to the closest satellite. Table 3 shows the results for both scenarios per cluster and the total values for each indicator per scenario. For both scenarios, the last-mile delivery is performed by an e-cargo bike. This means of transportation has a limited route duration of 1.5 h per tour due to the duration of the battery. Scenario 2 requires more e-cargo bikes than Scenario 1. Indicators like distance, travel time, CO2e emissions, fixed cost, and energy consumption have better values in Scenario 2 despite having an extra vehicle; this additional e-cargo bike is also the reason why the land use is lower in Scenario 1.
Table 3.
Second-echelon results per indicator.
Regarding the global results, Figure 3 presents a comparison between scenarios per indicator. Regarding the total distance traveled, Scenario 1 shows a reduction of 17% while the travel time increases by 14% since the average travel speeds of the barge and e-cargo bikes are slower than the average travel speed of the delivery van. Moreover, Scenario 1 causes more public space invasion because the area of the barge is considerably bigger than the other transportation modes.
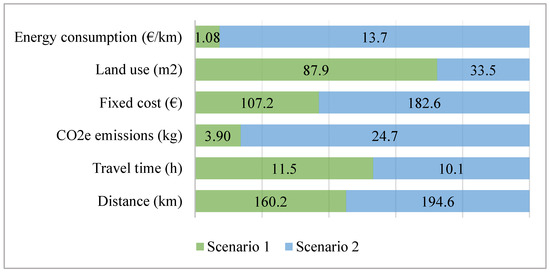
Figure 3.
Differences between scenarios in terms of global results.
It is important to highlight the reduction in CO2e emissions when using Scenario 1 because the entire operation of the second echelon is executed by e-cargo bikes with very low emissions. The difference between scenarios in terms of CO2e emissions is 84%, which means that the implementation of Scenario 1 will have lower values of greenhouse gas emissions, so it is more sustainable. Something similar happens with the cost of the energy consumption since the barge has a consumption of 1 l/100 km (diesel) compared to the consumption of the delivery van, which is 6 l/100 km (diesel). In this specific study, the least polluting means of transportation is the barge. Moreover, this means of transportation has cheaper costs -fixed costs and costs of energy consumption- than those associated with the van. To sum up, the fixed costs decrease by 41% and energy consumption by 92% when applying a river transportation mode and e-cargo bikes in the first and second echelon, respectively, of the distribution network (scenario 1 versus scenario 2).
5. Conclusions
The popularity of the Internet and social networks, followed by historical and disruptive events like the COVID-19 pandemic, have reinforced the increase of online shopping, generating an expansion of e-commerce. Many retail stores had to rethink their operations and start offering online sales channels to catch up with the trend, expand their boundaries and be able to maintain their sales despite the restrictions imposed, delivering the ordered products to their customers’ homes. Due to the considerable increase in demand, delivery companies have had to rethink their logistics and supply chain management operations to provide efficient last-mile delivery, as this activity is the core of e-commerce delivery operations. The most common distribution systems applied in urban logistics are two-echelon delivery networks. The two-echelon distribution network has an Urban Distribution Center or depot located outside the town, and from this facility, the parcels are distributed to a set of Urban Consolidation Centers or satellites that are located inside the cities and are such a cross-docking facility to distribute the parcels to a geographically dispersed customer (last-mile delivery). This paper studied the problem of designing delivery routes in two-echelon distribution networks. An approximation algorithm with a three-stage decomposition strategy was implemented dealing with the computational complexity of the problem: (1) a 2D-k-means clustering procedure is performed to allocate the customers to the closest satellite, (2) to find the second echelon routes, (3) is the first echelon routing. The two last stages were solved by the implementation of an approximation algorithm based on the NN routing heuristic.
A small-size instance (50 nodes) taken from a dataset that contains delivery points of a real-life French company was used for the experiment. Two different scenarios were proposed in which a heterogeneous fleet of delivery vehicles was evaluated using multimodal transportation. We use inland waterway transportation (barge), delivery vans, and e-cargo bikes. The performance of the delivery networks proposed was assessed. Results show that the consideration of environmental-friendly transportation modes has a great potential to reduce some of the issues and externalities caused by conventional urban parcel delivery systems. In this specific study, the least polluting means of transportation is the barge. Moreover, this means of transportation has cheaper costs -fixed costs and costs of energy consumption- than those associated with the van. To sum up, the fixed costs decrease by 41% and energy consumption by 92% when applying a river transportation mode and e-cargo bikes in the first and second echelon, respectively, of the distribution network (scenario 1 versus scenario 2).
It is important to note that the scenario that involves the use of inland waterways for parcel distribution is very useful because waterways are much less congested than Parisian city roads. However, thinking about further applications and tests in different cities, there are different aspects to be considered. First, there can be certain periods of the year when the river may not be navigable; in those cases, scenarios involving vans as a complementary distribution network should be used. In addition, the schedules established for navigation on the river must be taken into account since navigation is not allowed on a continuous daytime basis. Each city, in particular, has its own geography and infrastructure. For example, not all cities are suitable for this type of scenario because waterways are needed for its implementation; furthermore, public policies not only for navigability but also for last-mile distribution may differ. Hence, further studies should consider some additional aspects to analyze the viability of these scenarios in other cities.
This research has some limitations that open research avenues. Last-mile logistics is a very complex activity due to different factors, such as the instability of actors. The research needs to be reinforced. First, river logistics is understudied: the analysis of the use of barges in an urban context for the first echelon could be deepened. If this study gives the first elements, the study of costs must be studied further. Secondly, the proposed model must be applied to different original real-life case studies to validate our conclusions more strongly. Moreover, the service time is stochastic. Time at each delivery time is different. Considering this parameter could give more realistic results. Furthermore, adding new attributes to the model as mobile satellites or a heterogeneous fleet—electric vans, different cargo bikes, etc.—in the same echelon could be studied.
Author Contributions
Conceptualization, A.R.-V. and J.R.M.-T.; methodology A.R.-V., A.J. and J.R.M.-T.; software, A.R.-V.; validation, A.J. and J.R.M.-T.; formal analysis, A.R.-V.; investigation, A.R.-V. and A.J.; resources, A.J.; data curation, A.R.-V.; writing—original draft preparation, A.R.-V.; writing—review and editing, A.R.-V., A.J. and J.R.M.-T.; visualization, A.R.-V.; supervision, A.J. and J.R.M.-T. All authors have read and agreed to the published version of the manuscript.
Funding
The work of the first author was carried out under a post-graduate scholarship awarded by Universidad de La Sabana, Colombia, and Kedge Business School. France. This work was also supported under grants INGPHD-10-2019 and INGPHD-52-2022 from Universidad de La Sabana, Colombia.
Institutional Review Board Statement
Not applicable.
Informed Consent Statement
Not applicable.
Data Availability Statement
Data is unavailable due to confidentiality reasons.
Conflicts of Interest
The authors declare no conflict of interest.
References
- Statista. Global Retail e-Commerce Sales 2014–2023. 2020. Available online: https://www.statista.com/statistics/379046/worldwide-retail-e-commerce-sales/ (accessed on 28 April 2023).
- eMarketer. US Ecommerce Growth Jumps to More Than 30%, Accelerating Online Shopping Shift by Nearly 2 Years. 2020. Available online: https://www.emarketer.com/content/us-ecommerce-growth-jumps-more-than-30-accelerating-online-shopping-shift-by-nearly-2-years (accessed on 28 April 2023).
- Montoya-Torres, J.R.; Muñoz-Villamizar, A.; Mejia-Argueta, C. Mapping research in logistics and supply chain management during COVID-19 pandemic. Int. J. Logist. Res. Appl. 2021, 26, 421–441. [Google Scholar] [CrossRef]
- Risberg, A.; Jafari, H. Last mile practices in e-commerce: Framework development and empirical analysis of Swedish firms. Int. J. Retail Distrib. Manag. 2022, 50, 942–961. [Google Scholar] [CrossRef]
- Kull, T.J.; Boyer, K.; Calantone, R. Last-mile supply chain efficiency: An analysis of learning curves in online ordering. Int. J. Oper. Prod. Manag. 2007, 27, 409–434. [Google Scholar] [CrossRef]
- United Nations. About the Sustainable Development Goals. Sustainable Development Goals. 2019. Available online: https://www.un.org/sustainabledevelopment/sustainable-development-goals/ (accessed on 28 April 2023).
- Azcuy, I.; Agatz, N.; Giesen, R. Designing integrated urban delivery systems using public transport. Transp. Res. Part E Logist. Transp. Rev. 2021, 156, 102525. [Google Scholar] [CrossRef]
- Wang, Y.; Zhang, D.; Liu, Q.; Shen, F.; Lee, L.H. Towards enhancing the last-mile delivery: An effective crowd-tasking model with scalable solutions. Transp. Res. Part E Logist. Transp. Rev. 2016, 93, 279–293. [Google Scholar] [CrossRef]
- Rezgui, D.; Siala, J.C.; Aggoune-Mtalaa, W.; Bouziri, H. A memetic algorithm for fleet size and mix vehicle routing problems with electric modular vehicles. Int. J. Intell. Enterp. 2019, 6, 138. [Google Scholar] [CrossRef]
- Muñoz-Villamizar, A.; Santos, J.; Montoya-Torres, J.R.; Velázquez-Martínez, J.C. Measuring environmental performance of urban freight transport systems: A case study. Sustain. Cities Soc. 2020, 52, 101844. [Google Scholar] [CrossRef]
- Crainic, T.G.; Sgalambro, A. Service network design models for two-tier city logistics. Optim. Lett. 2014, 8, 1375–1387. [Google Scholar] [CrossRef]
- Meza-Peralta, K.; Gonzalez-Feliu, J.; Montoya-Torres, J.R.; Khodadad-Saryazdi, A. A unified typology of urban logistics spaces as interfaces for freight transport: A Systematic Literature Review. Supply Chain. Forum 2020, 21, 274–289. [Google Scholar] [CrossRef]
- Perboli, G.; Tadei, R.; Vigo, D. The two-echelon capacitated vehicle routing problem: Models and math-based heuristics. Transp. Sci. 2011, 45, 364–380. [Google Scholar] [CrossRef]
- Eriksson, E.; Norrman, A.; Kembro, J. Understanding the transformation toward omnichannel logistics in grocery retail: A dynamic capabilities perspective. Int. J. Retail Distrib. Manag. 2022, 50, 1095–1128. [Google Scholar] [CrossRef]
- Crainic, T.G.; Ricciardi, N.; Storchi, G. Advanced freight transportation systems for congested urban areas. Transp. Res. Part C Emerg. Technol. 2004, 12, 119–137. [Google Scholar] [CrossRef]
- Ramirez-Villamil, A.; Jaegler, A.; Montoya-Torres, J.R. On the impact of river satellites in two-echelon urban distribution systems. In Colloquium on European Rsearch in Retailing; CERR 2022: Zagreb, Croatia, 2022. [Google Scholar]
- Purnamasari, C.D.; Santoso, A. Vehicle Routing Problem (VRP) for courier service: A review. MATEC Web Conf. 2018, 204, 07007. [Google Scholar] [CrossRef]
- Dantzig, G.B.; Ramser, J.H. The Truck Dispatching Problem. Manag. Sci. 1959, 6, 80–91. [Google Scholar] [CrossRef]
- Ayu, T.; Nahry. Optimizing the Heterogeneous Fleet Vehicle Routing Problem with Time Window on Urban Last Mile Delivery. IOP Conf. Ser. Earth Environ. Sci. 2021, 830, 012100. [Google Scholar] [CrossRef]
- Calvet, L.; Wang, D.; Juan, A.; Bové, L. Solving the multidepot vehicle routing problem with limited depot capacity and stochastic demands. Int. Trans. Oper. Res. 2019, 26, 458–484. [Google Scholar] [CrossRef]
- Ramirez-Villamil, A.; Jaegler, A.; Montoya-Torres, J.R. Sustainable local pickup and delivery: The case of Paris. Res. Transp. Bus. Manag. 2021, 45, 100692. [Google Scholar] [CrossRef]
- Sajid, M.; Singh, J.; Haidri, R.A.; Prasad, M.; Varadarajan, V.; Kotecha, K.; Garg, D. Article a novel algorithm for capacitated vehicle routing problem for smart cities. Symmetry 2021, 13, 1923. [Google Scholar] [CrossRef]
- Yuan, Y.; Cattaruzza, D.; Ogier, M.; Semet, F.; Vigo, D. A column generation based heuristic for the generalized vehicle routing problem with time windows. Transp. Res. Part E Logist. Transp. Rev. 2021, 152, 102391. [Google Scholar] [CrossRef]
- Chen, C.; Demir, E.; Huang, Y. An adaptive large neighborhood search heuristic for the vehicle routing problem with time windows and delivery robots. Eur. J. Oper. Res. 2021, 294, 1164–1180. [Google Scholar] [CrossRef]
- Sonneberg, M.-O.; Leyerer, M.; Kleinschmidt, A.; Knigge, F.; Breitner, M.H. Autonomous Unmanned Ground Vehicles for Urban Logistics: Optimization of Last Mile Delivery Operations 2019. Available online: https://hdl.handle.net/10125/59594 (accessed on 28 April 2023).
- Li, J.; Ensafian, H.; Bell, M.G.H.; Geers, D.G. Deploying autonomous mobile lockers in a two-echelon parcel operation. Transp. Res. Part C Emerg. Technol. 2021, 128, 103155. [Google Scholar] [CrossRef]
- Zheng, C.; Gu, Y.; Shen, J.; Du, M. Urban logistics delivery route planning based on a single metro line. IEEE Access 2021, 9, 50819–50830. [Google Scholar] [CrossRef]
- Bruzzone, F.; Cavallaro, F.; Nocera, S. The integration of passenger and freight transport for first-last mile operations. Transp. Policy 2021, 100, 31–48. [Google Scholar] [CrossRef] [PubMed]
- Caggiani, L.; Colovic, A.; Prencipe, L.P.; Ottomanelli, M. A green logistics solution for last-mile deliveries considering e-vans and e-cargo bikes. Transp. Res. Procedia 2021, 52, 75–82. [Google Scholar] [CrossRef]
- Janjevic, M.; Merchán, D.; Winkenbach, M. Designing multi-tier, multi-service-level, and multi-modal last-mile distribution networks for omni-channel operations. Eur. J. Oper. Res. 2021, 294, 1059–1077. [Google Scholar] [CrossRef]
- Settey, T.; Gnap, J.; Beňová, D.; Pavličko, M.; Blažeková, O. The growth of e-commerce due to COVID-19 and the need for urban logistics centers using electric vehicles: Bratislava case study. Sustainability 2021, 13, 5357. [Google Scholar] [CrossRef]
- Anderluh, A.; Hemmelmayr, V.C.; Nolz, P.C. Sustainable Logistics with Cargo Bikes-Methods and Applications. In Sustainable Transportation and Smart Logistics: Decision-Making Models and Solutions; Elsevier: Amsterdam, The Netherlands, 2018; pp. 207–232. [Google Scholar] [CrossRef]
- Enthoven, D.; Jargalsaikhan, B.; Roodbergen, K.; uit het Broek, M.; Schrotenboer, A. The two-echelon vehicle routing problem with covering options: City logistics with cargo bikes and parcel lockers. Comput. Oper. Res. 2020, 118, 104919. [Google Scholar] [CrossRef]
- Verlinghieri, E.; Itova, I.; Collignon, N.; Aldred, R. The Promise of Low-Carbon Freight Benefits of Cargo Bikes in London. 2021. Available online: https://static1.squarespace.com/static/5d30896202a18c0001b49180/t/61091edc3acfda2f4af7d97f/1627987694676/The+Promise+of+Low-Carbon+Freight.pdf (accessed on 28 April 2023).
- European Commission. White Paper: Roadmap to a Single European Transport Area; European Commission: Brussels, Belgium, 2011. [Google Scholar]
- Lebeau, P.; de Cauwer, C.; van Mierlo, J.; Macharis, C.; Verbeke, W.; Coosemans, T. Conventional, Hybrid, or Electric Vehicles: Which Technology for an Urban Distribution Centre? Sci. World J. 2015, 2015, 302867. [Google Scholar] [CrossRef]
- Juvvala, R.; Sarmah, S.P. Evaluation of policy options supporting electric vehicles in city logistics: A case study. Sustain. Cities Soc. 2021, 74, 103209. [Google Scholar] [CrossRef]
- Alewijnse, B.; Hübl, A. Minimising Total Costs of a Two-Echelon Multi-Depot Capacitated Vehicle Routing Problem (2E-MD-CVRP) that Describes the Utilisation of the Amsterdam City Canal Network for Last Mile Parcel Delivery. IFIP Adv. Inf. Commun. Technol. 2021, 633 IFIP, 603–612. [Google Scholar] [CrossRef]
- van Duin, J.H.R.; Kortmann, R.; and van den Boogaard, S.L. City logistics through the canals? A simulation study on freight waterborne transport in the inner-city of Amsterdam. Int. J. Urban Sci. 2014, 18, 186–200. [Google Scholar] [CrossRef]
- Flaberg, T.; Hasle, G.; Kloster, O.; Riise, A. Towards Solving Huge-Scale Vehicle Routing Problems for Household Type Applications; Workshop Presentation in Network Optimization Workshop: Saint-Remy de Provence, France, 2006. [Google Scholar]
- Ramírez-Villamil, A.; Montoya-Torres, J.; Jaegler, A. Integrating Clustering Methodologies and Routing Optimization Algorithms for Last-Mile Parcel Delivery. In Proceedings of the Computational Logistics: 13th International Conference, ICCL 2022, Barcelona, Spain, 21–23 September 2022; Springer International Publishing: Cham, Switzerland, 2022. [Google Scholar]
- Wang, Y.; Yuan, Y.; Guan, X.; Xu, M.; Wang, L.; Wang, H.; Liu, Y. Collaborative two-echelon multicenter vehicle routing optimization based on state–space–time network representation. J. Clean. Prod. 2020, 258, 120590. [Google Scholar] [CrossRef]
- Wang, Y.; Zhang, S.; Assogba, K.; Fan, J.; Xu, M.; Wang, Y. Economic and environmental evaluations in the two-echelon collaborative multiple centers vehicle routing optimization. J. Clean. Prod. 2018, 197, 443–461. [Google Scholar] [CrossRef]
- Taiwo, O.S.; Josiah, O.; Taiwo, A.; Dkhrullahi, S.; Sade, O.K. Implementation of heuristics for solving travelling salesman problem using nearest neighbor insertion approaches. Int. J. Adv. Res. 2013, 1, 139–155. [Google Scholar]
- de Araujo Lima, S.J.; de Araújo, S.A.; Schimit, P.H.T. A hybrid approach based on genetic algorithm and nearest neighbor heuristic for solving the capacitated vehicle routing problem. Acta Sci.-Technol. 2018, 40, 36708. [Google Scholar] [CrossRef]
- Solomon, M.M. Algorithms for the Vehicle Routing and Scheduling Problems with Time Window Constraints. Oper. Res. 1987, 35, 254–265. [Google Scholar] [CrossRef]
- Karaoğlu, M.; Kara, G. Two-Stage Heuristic Algorithm Proposal for Urban E-Commerce Deliveries. Asia-Pac. J. Oper. Res. 2022, 39, 2150034. [Google Scholar] [CrossRef]
- United States Environmental Protection Agency. Overview of Greenhouse Gases. Available online: https://www.epa.gov/ghgemissions/overview-greenhouse-gases (accessed on 18 August 2021).


Disclaimer/Publisher’s Note: The statements, opinions and data contained in all publications are solely those of the individual author(s) and contributor(s) and not of MDPI and/or the editor(s). MDPI and/or the editor(s) disclaim responsibility for any injury to people or property resulting from any ideas, methods, instructions or products referred to in the content. |
© 2023 by the authors. Licensee MDPI, Basel, Switzerland. This article is an open access article distributed under the terms and conditions of the Creative Commons Attribution (CC BY) license (https://creativecommons.org/licenses/by/4.0/).